Effective Debt Strategies in the Current Macroeconomic Environment
by
Mr. Phillip Anderson
Senior Manager
Government Debt and Risk Management
World Bank
Ninth UNCTAD Debt Management Conference
Geneva, 11 - 13 November 2013
The views expressed are those of the author and do not necessarily reflect the views of UNCTAD

Effective Management Debt Strategies in the Current Macroeconomic Environment
Phillip Anderson
Senior Manager
Financial Advisory and Banking
Ninth International Debt Management Conference
November, 2013
Geneva

Contents
3
Current Macroeconomic Environment
Lessons from external shocks: global
financial crisis of 2008 – 2009
Framework for developing a medium-term
debt management strategy
4
Current Macroeconomic
Environment
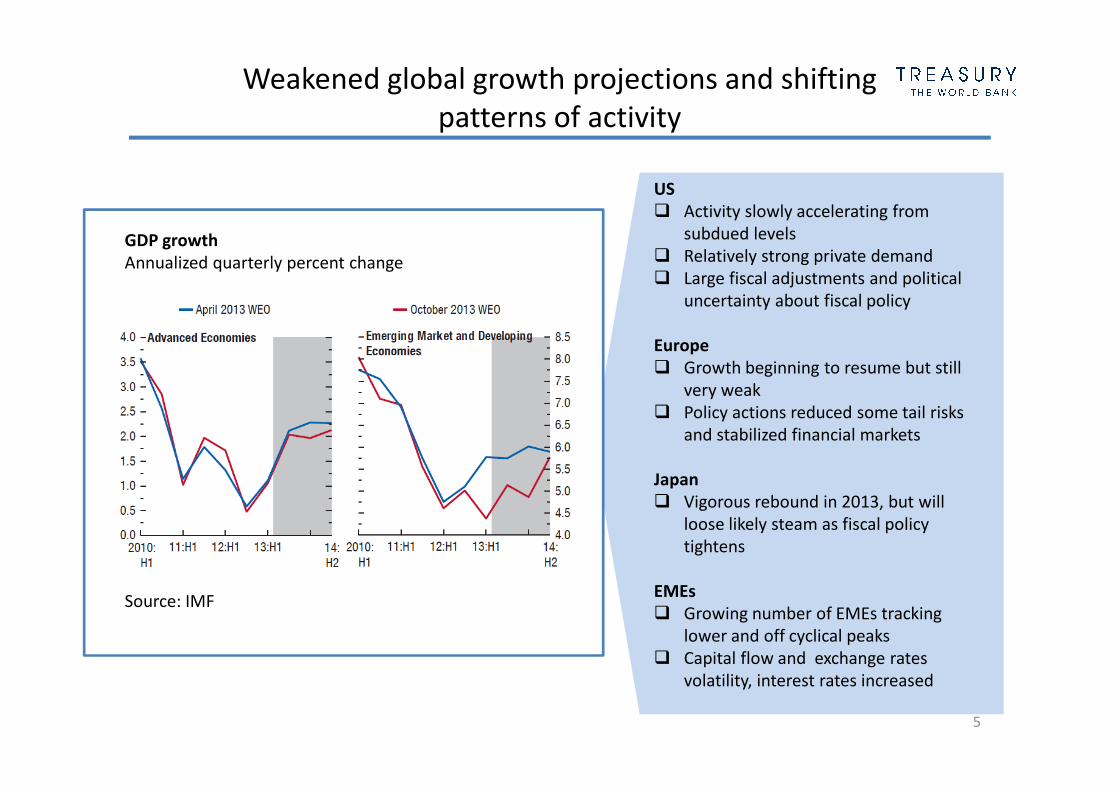
Weakened global growth projections and shifting
patterns of activity
5
GDP growth
Annualized quarterly percent change
Source: IMF
US
� Activity slowly accelerating from
subdued levels
� Relatively strong private demand
� Large fiscal adjustments and political
uncertainty about fiscal policy
Europe
� Growth beginning to resume but still
very weak
� Policy actions reduced some tail risks
and stabilized financial markets
Japan
� Vigorous rebound in 2013, but will
loose likely steam as fiscal policy
tightens
EMEs
� Growing number of EMEs tracking
lower and off cyclical peaks
� Capital flow and exchange rates
volatility, interest rates increased

Weakened financial and macroeconomic conditions
in emerging market economies
6
Net capital flows to EMs
USD bn, monthly flow
Nominal exchange rates
Percent change from Jan. 1, 2013, to Sep. 23, 2013
Source: IMF
Change in 10-year local currency government bond yields
Basis points
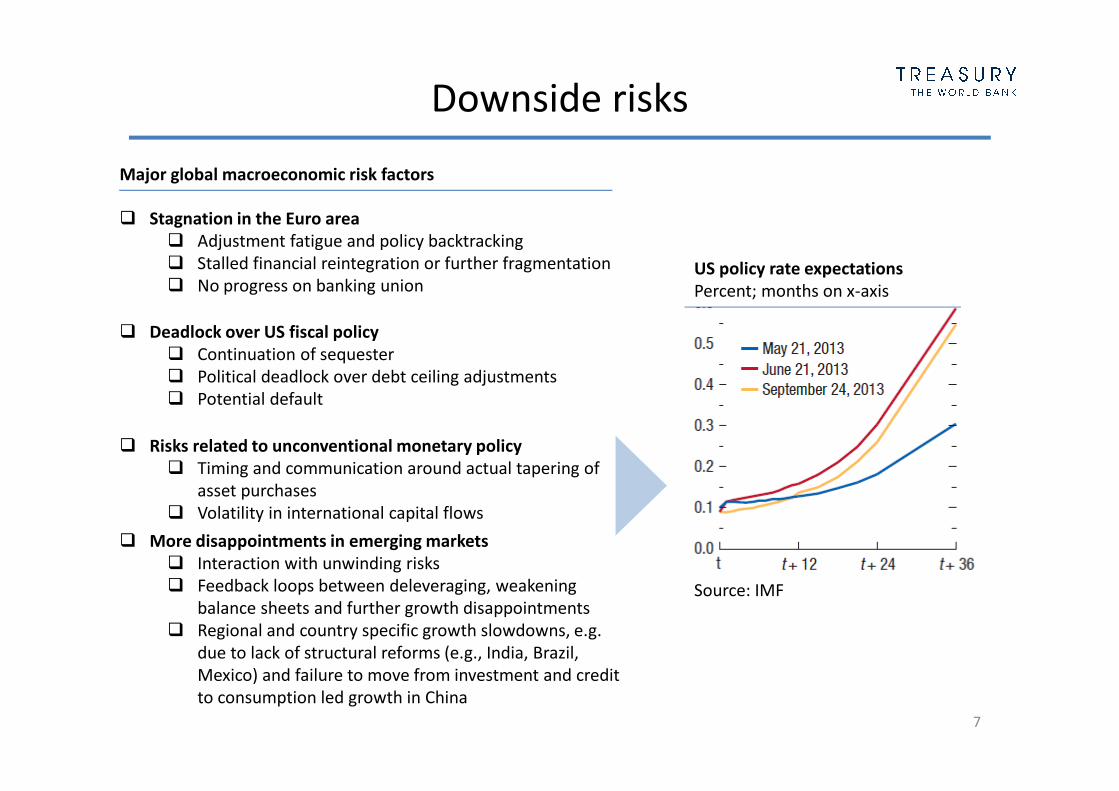
Downside risks
7
Major global macroeconomic risk factors
� Stagnation in the Euro area
� Adjustment fatigue and policy backtracking
� Stalled financial reintegration or further fragmentation
� No progress on banking union
� Deadlock over US fiscal policy
� Continuation of sequester
� Political deadlock over debt ceiling adjustments
� Potential default
� Risks related to unconventional monetary policy
� Timing and communication around actual tapering of
asset purchases
� Volatility in international capital flows
� More disappointments in emerging markets
� Interaction with unwinding risks
� Feedback loops between deleveraging, weakening
balance sheets and further growth disappointments
� Regional and country specific growth slowdowns, e.g.
due to lack of structural reforms (e.g., India, Brazil,
Mexico) and failure to move from investment and credit
to consumption led growth in China
US policy rate expectations
Percent; months on x-axis
Source: IMF

8
Lessons from external shocks: global
financial crisis of 2008 - 2009

9
Large capital outflows in the last quarter of 2008
� Major challenge to debt managers, especially in countries still
dependent on external funding.
-6.0
-5.0
-4.0
-3.0
-2.0
-1.0
0.0
1.0
2.0
3.0
4.0
%
EAP ECA LAC MNA SAR SSA
Quarterly Portfolio Flows (% of GDP)
Source: Portfolio flows from IMF IFS; GDP from World Bank WDI
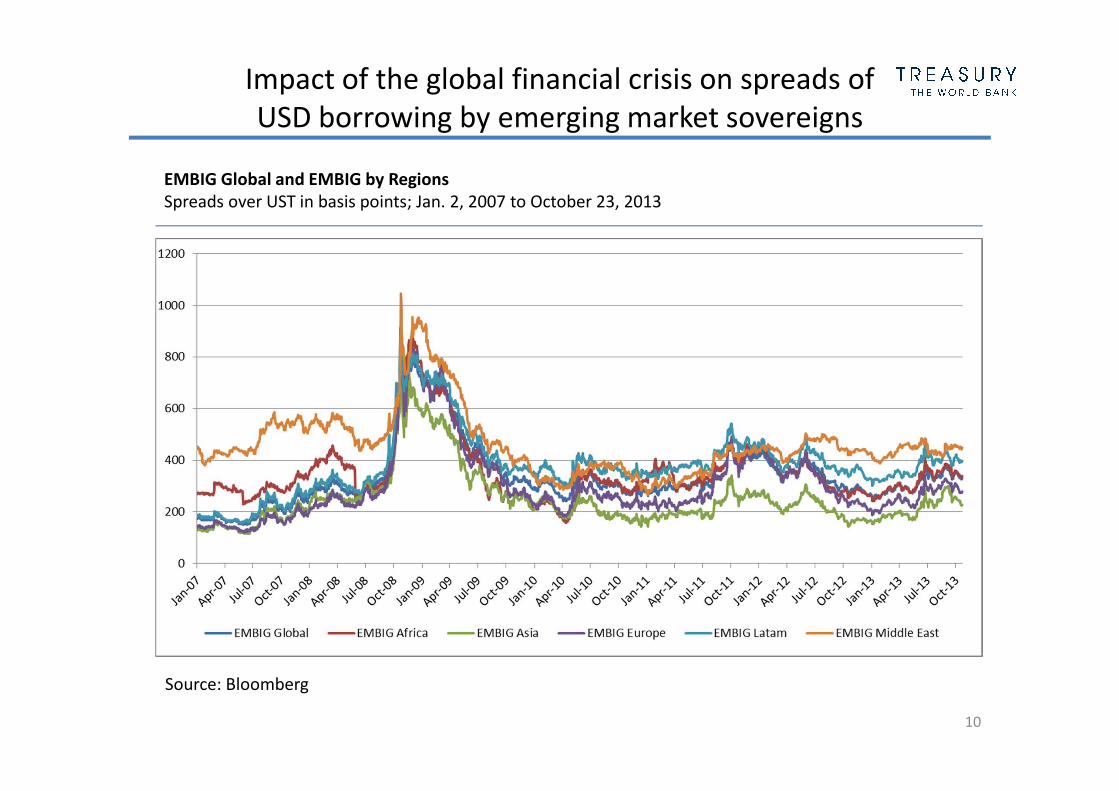
Impact of the global financial crisis on spreads of
USD borrowing by emerging market sovereigns
10
EMBIG Global and EMBIG by Regions
Spreads over UST in basis points; Jan. 2, 2007 to October 23, 2013
Source: Bloomberg

11
The impact of the crisis on local currency bond yields
was mixed
0
20
40
60
80
100
120
140
160
180
Selected Generic 10-Year Government Bond Yield
(1 Sep, 2008 = 100)
Brazil Chile China Hungary India Indonesia Mexico Peru US UK
Source: Bloomberg LP, Datastream

12
Some lessons learned…
� Sound macroeconomic policy was elemental to buffer the impact and for
subsequent recovery
� Prudent debt management pre-crisis played a role in enhancing EMs
resilience: focus on refinancing, interest rate and exchange rate risks.
During 2000 – 2009, major changes in debt portfolios1:
– Average ratio of external to domestic debt dropped from 0.75 to 0.22.
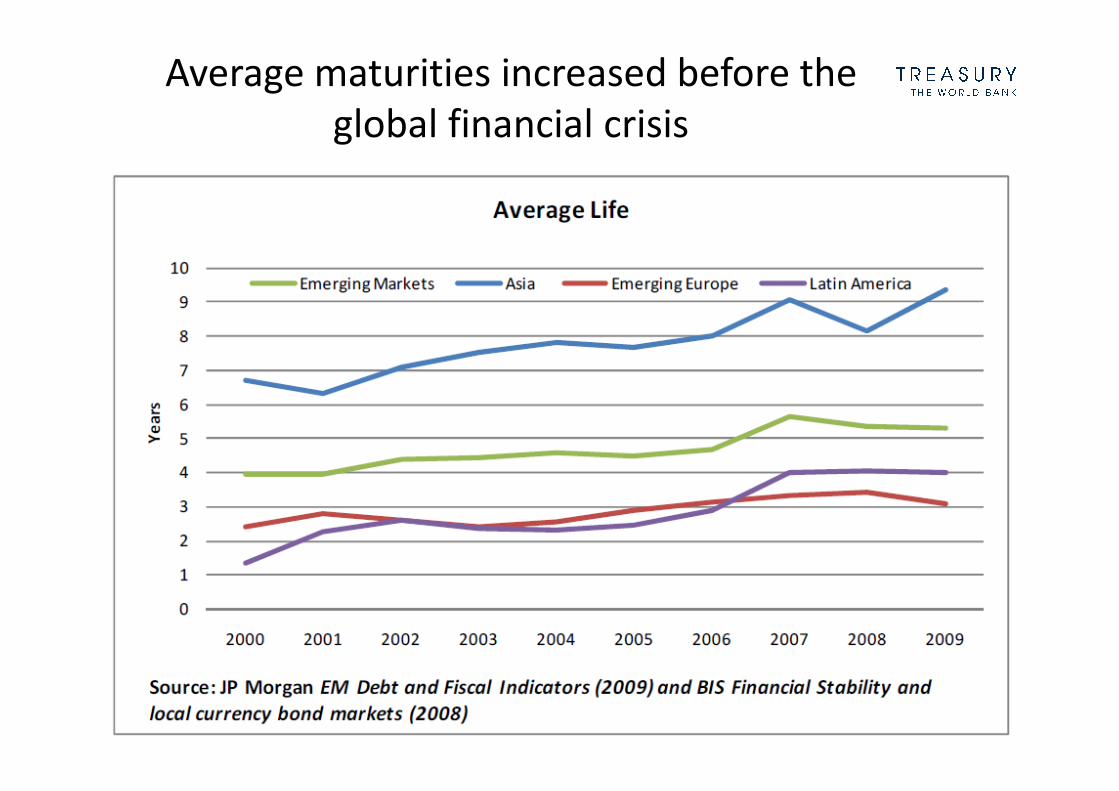
– Average life tripled from 1.3 years to 4 years in Latin America, and
increased from 6.7 years to 9.4 years in Asia.
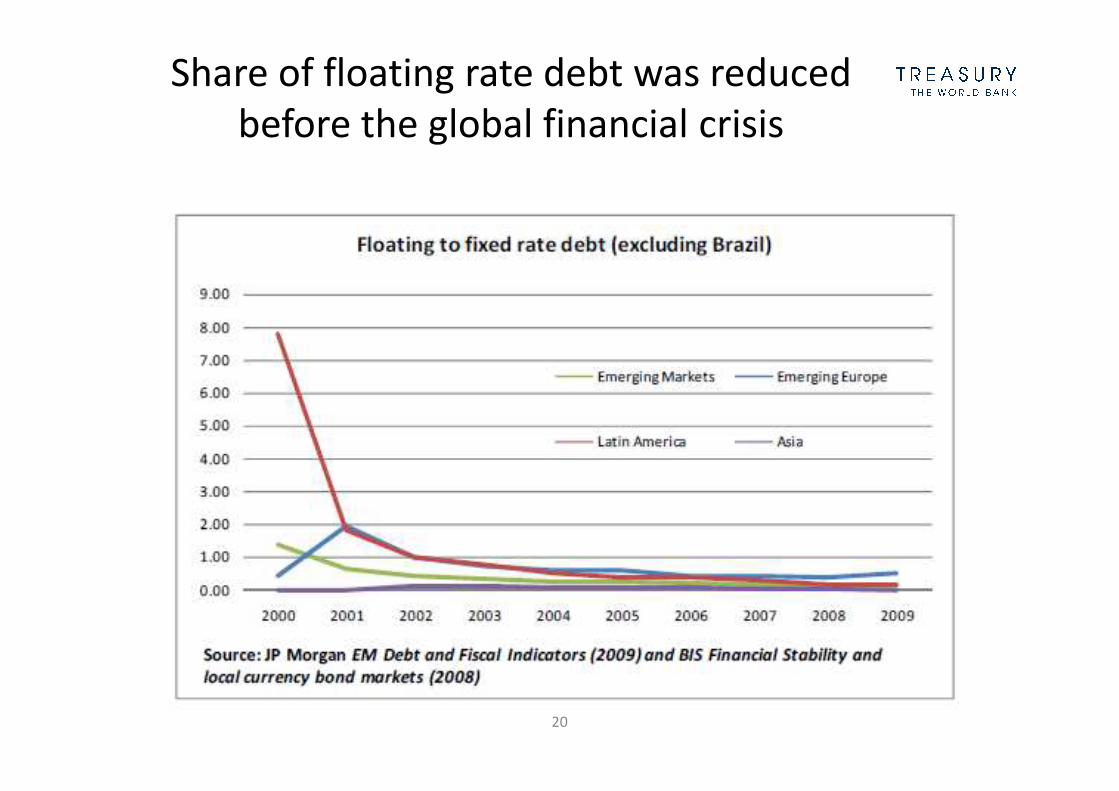
– Ratio of floating and short-term fixed-rate debt to fixed rate debt
dropped from 2 to 0.7.
� Debt managers had room to maneuver, adapt, and absorb risk.
� Countries with larger, more developed bond markets fared better.
1 Public Debt Management in Emerging Market Economies: Has This Time Been Different? Phillip R. D. Anderson et al.

13
Framework for developing a medium-
term debt management strategy

Designing a debt management strategy requires
analysis of choices, constraints and trade-offs
14
Debt Management Strategy Development
Cost/Risk Analysis
Macroeconomic Framework
Debt MarketDevelopment
Information on cost
and riskConstraints
Initiatives
Demand
constraints
Consistency/
Constraints
Information on cost
and risk
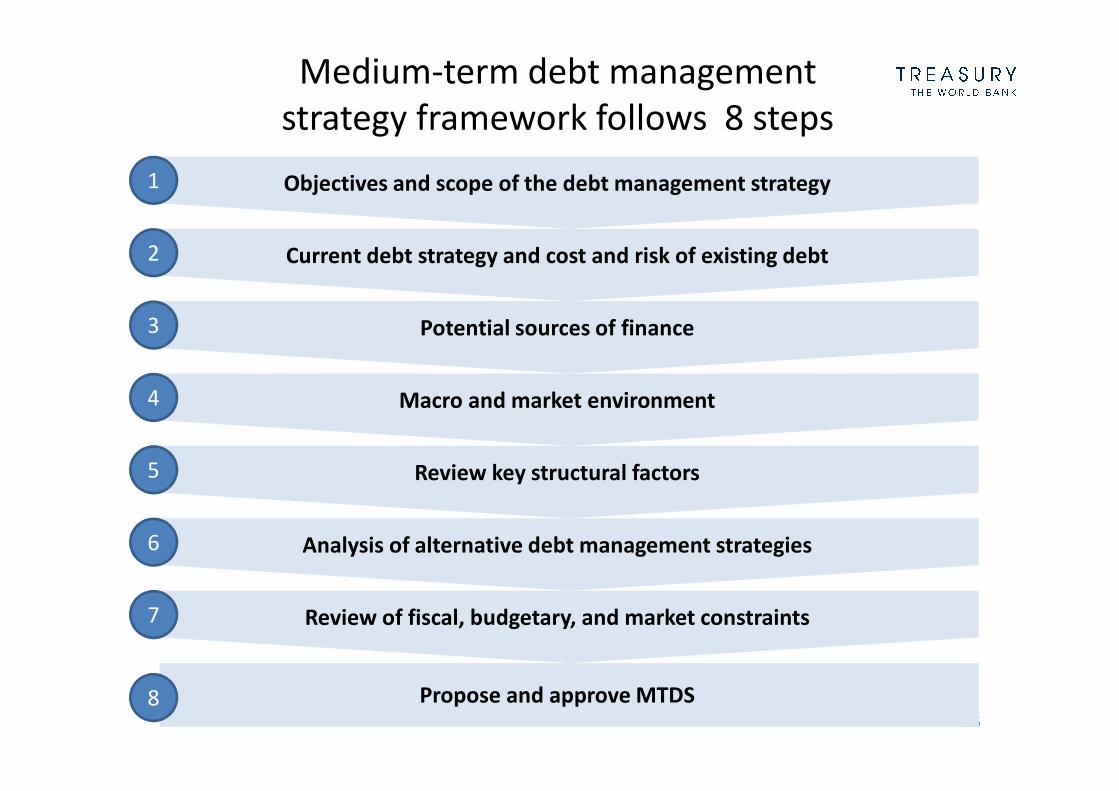
Medium-term debt management
strategy framework follows 8 steps
15
Objectives and scope of the debt management strategy1
Current debt strategy and cost and risk of existing debt2
Potential sources of finance3
Macro and market environment4
Review key structural factors5
Analysis of alternative debt management strategies6
Review of fiscal, budgetary, and market constraints 7
Propose and approve MTDS8

Conclusion
• The turbulence and tail risk observed in recent crises highlight the importance of considering extreme scenarios when analyzing risks in the debt portfolio
• Particular attention should be paid to refinancing and liquidity risks: market dislocation can precipitate a sovereign debt crisis
• Access to domestic market financing can reduce risk and also supports financial sector development; however developing domestic debt markets is a long term process
• Effective communication with stakeholders is helpful in turbulent times, but needs to be established before a crisis hits
16

Appendix
17

18
External debt declined relatively before
global financial crisis
19
Average maturities increased before the
global financial crisis
20
Share of floating rate debt was reduced
before the global financial crisis

Global Financial Conditions
21

Growth changes 2011 – 2013 in BRICS
22

Bond flows from advanced economies
to EMEs in last 10 years
23

Impact of portfolio inflows on LX
bond yields, 2009-12
24

Vulnerabilities in EMEs
25

Potential impact of reversal in capital
flows on bond yields
26

©2013 The International Bank for Reconstruction and Development / The World Bank 1818 H Street NW Washington DC
20433/ Telephone: 202-473-1000/ Internet: www.worldbank.org
E-mail: [email protected]
All rights reserved.
This work is a product of the staff of the International Bank for Reconstruction and Development/The World Bank. The findings,
interpretations, and conclusions expressed in this work do not necessarily reflect the views of the Executive Directors of the
World Bank or the governments they represent.
The World Bank does not guarantee the accuracy of the data included in this work. The boundaries, colors, denominations, and
other information shown on any map in this work do not imply any judgment on the part of the World Bank concerning the legal
status of any territory or the endorsement or acceptance of such boundaries.
Rights and Permissions
The material in this publication is copyrighted. Copying and/or transmitting portions or all of this work without permission may be
a violation of applicable law. The International Bank for Reconstruction and Development / The World Bank encourages
dissemination of its work and will normally grant permission to reproduce portions of the work promptly.
For permission to photocopy or reprint any part of this work, please contact the World Bank Treasury.
Disclaimers
Recommended


