500 Virginia Street, East, Suite 500 Charleston, WV 25301
800.624.9120 · mcrel.org
New River Community and Technical College’s
Framework for Institutional Transformation:
Reimagining Allied Health in
Southeastern West Virginia Summative Evaluation Report
September 2016
Ashli E. Knotts, M.A.
Karen L. Bumgardner, PMP, M.A.
Making
A Difference

Founded in 1966, McREL International is a not-for-profit corporation with offices in Denver, Colorado; Honolulu, Hawaii; and Charleston, West Virginia. McREL delivers high quality program evaluation services and develops award-winning reports to provide clients with timely information to improve their programs and document their successes. McREL staff members work collaboratively with clients to build their planning, data, and program evaluation capacity through just-in-time consulting and training. McREL’s evaluation services are grounded in the latest research methods and evaluation best practices.
For information about McREL’s research, products, or services, contact
4601 DTC Boulevard, Suite 500 • Denver, CO 80237 • 303.337.0990 •fax 303.337.3005 1003 Bishop Street, Suite 2200 • Honolulu, HI 96813 • 808.664.8175 • fax 808.664.8190 P.O. Box 1348, Charleston, WV 25325 • 304.347.0400 • 800.624.9120 • fax 304.347.0487
[email protected] • www.mcrel.org
© 2016 McREL Reproduction of this document is permitted with McREL cited as the source.
This product was funded by a grant awarded to New River Community and Technical College (hereafter referred to as New River) by the U.S. Department of Labor’s (DOL’s) Employment and Training Administration. The product was created by McREL International and does not necessarily reflect the official position of the DOL or New River. The DOL makes no guarantees, warranties, or assurances of any kind, express or implied, with respect to such information, including any information on linked sites and including, but not limited to, accuracy of the information or its completeness, timeliness, usefulness, adequacy, continued availability, or ownership. Additionally, you should not assume endorsement by the DOL or New River.
McREL is an equal employment opportunity/affirmative action employer.

i
Table of Contents
Table of Contents ............................................................................................................................................................. i
List of Tables .................................................................................................................................................................... ii
List of Figures ................................................................................................................................................................. iii
List of Acronyms ............................................................................................................................................................iv
Glossary of Statistical Terms.......................................................................................................................................... v
Executive Summary ........................................................................................................................................................vi
Introduction ...................................................................................................................................................................... 1
Evaluation Design ........................................................................................................................................................... 4
Data Collection.......................................................................................................................................................... 4
Data Analysis ............................................................................................................................................................. 5
Data Limitations ........................................................................................................................................................ 6
Implementation Evaluation Findings ........................................................................................................................... 6
Project Outcomes Findings ......................................................................................................................................... 16
Conclusions/Lessons Learned................................................................................ Error! Bookmark not defined.
References ...................................................................................................................................................................... 29
Appendices
Appendix A. New River Entrance Survey and Data Tables
Appendix B. New River Exit Survey and Data Tables
Appendix C. Pierpont Entrance Survey and Data Tables
Appendix D. Participant v. Non-participant PTA Students’ Employment and Education Outcomes
Appendix E. New River Partner Survey and Data Tables
Appendix F. Findings from New River Education Records
Appendix G. New River Wage and Employment Findings

ii
List of Tables
Table 1. New River TAACCCT Project Strategies and Activities ............................................................................ 2
Table 2. Partner Involvement in Curricula Design and Development .................................................................... 7
Table 3. Partner Survey: Overview of Program Involvement .................................................................................. 13
Table 4. Partners’ Perceptions of Impact on Allied Healthcare Industry and Local Community ....................... 13
Table 5. New River TAACCCT Grant Participants Served ................................................................................... 17
Table 6. Entrance Survey: New River Students’ Perceptions of Career Integration .......................................... 19
Table 7. Exit Survey: New River Students’ Perceptions of Career Integration ................................................... 20
Table 8. Entrance Survey: Pierpont Students’ Perceptions of Career Integration .............................................. 21
Table 9. Participant v. Non-participant Perceptions of Retention Factors.......................................................... 22
Table 10. Wage Increases by Quarter ........................................................................................................................ 24
Table 11. Student Support Service Recipients v. Non-recipients: Average GPA by Semester ......................... 25

iii
List of Figures
Figure 1. Likelihood to Pursue Career Planning via SSCs ...................................................................................... 11
Figure 2. New River TAACCCT Program Implementation Stoplight ................................................................. 15

iv
List of Acronyms
AAS – Associate in Applied Science
CFO – Chief Financial Officer
DOL – Department of Labor
DF - Degrees of Freedom (see Glossary of Statistical Terms)
EMT – Paramedic-emergency medical technician
ES - Effect Size (see Glossary of Statistical Terms)
GPA – Grade Point Average
HESI – Health Education Systems Incorporated
HLC – Higher Learning Commission
HR – Human Resources
M – Mean (see Glossary of Statistical Terms)
MA – Medical assistant
MLT – Medical laboratory technician
NAACLS - National Accrediting Agency for Clinical Laboratory Science
OTA – Occupation Therapy Assistant
PLA – Prior Learning Assessment
PTA – Physical therapy assistant
RN – Registered Nurse
SD – Standard Deviation (see Glossary of Statistical Terms)
SGA – Student Government Association
SSC – Student Success Center
t - t distribution (see Glossary of Statistical Terms)
TAACCCT – Trade Adjustment Assistance Community College and Career Training
WIA-TAA – Workforce Investment Act-Trade Adjustment Assistance

v
Glossary of Statistical Terms1
Degrees of Freedom (DF) – The number of values that are free to vary, given one or more statistical
restrictions on the entire set of values. Also, a statistical compensation for the failure of a range of values to
be normally distributed.
Effect size (ES) – Measure of the strength of a relationship and most often referred to as a measure of
practical significance and reported using Cohen’s d. It is calculated by taking the difference between the
participant and comparison groups’ means and dividing that difference by the standard deviation of the
comparison group’s scores or by the standard deviation of the aggregated scores of both groups. McREL
researchers consider an effect size of 0.25 or greater to be educationally meaningful, and an effect size
between 0.13 and 0.20 to be substantively important2.
Mean (M) – The arithmetic average which is calculated by adding the values for each case and dividing by
the total number of cases.
n – The lower case n refers the number in a sample (as contrasted with the number in a population).
p value – This term refers to the probability value or, in other words, the probability that a statistic could
occur by chance or sampling error if the null hypothesis (i.e., no difference) is true.
Statistical significance – A finding is said to have statistical significance when the value or measure of a
value is significantly larger or smaller than would be expected by chance alone.
Standard deviation (SD) – This is a descriptive measure of variability or spread of scores around the
mean. The wider the scores are spread, the larger the standard deviation. The standard deviation is
calculated by taking the square root of the variance.
Student’s t distribution (t) – A test for statistical significance that uses tables of a statistical distribution
is called a Student’s t distribution. It is referred to as Student’s t because the author of the article that made
this distribution well known used the pen name “Student.” In articles and reports, it is often referred to as
simply “t.”
t-test – A test of statistical significance which shows the differences between two group means.
1 From The Cambridge Dictionary of Statistics, 4th ed. By Everitt & Skrondal 2 These benchmarks are based on the What Works Clearinghouse’s methodological guidelines (U.S. Department of Education, 2014) and
on a Lipsey et al. (2012) article, which reported an average effect size of 0.13 for 227 randomized controlled trials that examined the
effect of curricula or broad instructional programs.
vi
Executive Summary
In September 2012, New River Community and Technical College (hereafter referred to as New
River) was awarded a U.S. Department of Labor (DOL) grant as part of the Round 2 Trade Adjustment
Assistance Community College and Career Training (TAACCCT) program. With this grant, New River
aimed to provide targeted training and workforce development to help economically dislocated workers in
southern West Virginia as well as support partnerships between the college and local employers to develop
programs that provided pathways to high-wage, high-skill jobs that met industry needs (DOL, 2011).
The New River TAACCCT project aimed to provide students with specialized occupational training
while guiding them along healthcare career pathways identified and developed by the college. The pathways
were intended to facilitate students’ entry into the healthcare industry as a medical assistant (MA), medical
laboratory technician (MLT), occupational therapy assistant (OTA), paramedic-emergency medical
technician (EMT), physical therapy assistant (PTA), and registered nurse (RN) programs3. To address
workforce needs of the region, New River has been working over the last four years to expand, develop, and
improve its existing nursing and allied health training programs to provide specialized education options to
participants eligible for trade adjustment assistance (TAA), returning veterans, as well as other unemployed
or underemployed workers. The New River TAACCCT project serves 11 counties in West Virginia and
draws students from seven counties in Virginia. Four overarching, intersecting strategies serve as the
foundation of the initiative: (1) meeting healthcare workforce demands, (2) transforming developmental
education, (3) creating Student Success Centers (SSCs), and (4) overall grant administration.
Evaluation questions, as shown in the table below, were developed by examining the DOL grant
solicitation, the New River technical proposal, and the DOL evaluation requirements. The complexity and
multiple purposes of the evaluation required the use of an embedded mixed methods, quasi-experimental,
cohort-based longitudinal design with a comparison group to examine the extent to which each
implementation and outcome target was met.
Implementation Evaluation Questions
F1. How were the curricula for the allied health programs selected, used, or created for inclusion under this
grant opportunity? (SGA Implementation Q1)
F2. How were programs and program designs improved or expanded using grant funds? (SGA
Implementation Q2)
F3. How were participants selected for inclusion into their program of study? How was the course
sequence for participants established? To what extent and how was career guidance provided to
participants? (SGA Implementation Q3)
F4. To what extent are education, community, employer, and workforce partners involved in the
implementation of the New River TAACCCT? (SGA Implementation Q4)
F5. To what extent are the key strategies and activities being implemented as planned? What changes were
made to the key strategies of the New River TAACCCT during implementation and for what reasons?
(New River Technical Narrative)
F6. To what extent are the various components of the New River TAACCCT sustainable (degree programs,
developmental education, and Student Success Centers)? (New River Technical Narrative)
3 The MA program was not originally proposed as part of New River’s TAACCCT submission to the DOL. This program replaced the
Dietetic Technician program as of August 2013 after receiving approval from the DOL TAACCCT program officer. The occupation
therapy assistant program was removed from the grant in January 2015 upon review of sustainability.

vii
Outcome Evaluation Questions
S1. To what extent does the New River TAACCCT meet targeted project outcomes? (Annual Report
Template Section B)
S2. To what extent does the New River TAACCCT serve a variety of individuals? (Annual Report
Template Section C)
S3. To what extent do participating and comparison students differ on education and employment
outcomes?
S4. To what extent do WIA-TAA and veteran students differ from other participating students on education
and employment outcomes?
S5. To what extent do the student support services (i.e., developmental education, Student Success Center
services) affect education and employment outcomes?
A mixed-method design allowed evaluators to gather information through multiple methods (e.g.,
qualitative and quantitative) from multiple sources. Specifically, seven data collection methods were used by
McREL evaluators to understand and measure the program implementation (e.g., curricula development,
program design, education and workforce partner involvement, program fidelity) as well as program
outcomes (e.g., diversity in participant enrollment, effectiveness of training and student support services,
enhanced education and employment opportunities). The data sources included a student entrance survey,
student exit survey, partner surveys, staff interviews, a fidelity measure, student wage and employment data,
and student education records. All data collection tools were developed in collaboration with New River
project staff.
The data collection methods were used both formatively for fine-tuning project activities and
summatively for determining project outcomes. Analyses of the quantitative data gathered through the
surveys involved the calculation of descriptive statistics such as frequencies, percentages, and measures of
central tendency and dispersion (e.g., means and standard deviations). Staff interview data (i.e., qualitative
data) were analyzed by question and by theme. Data were segmented into passages through coding.
Themes were then identified and summarized by salient and prevalent issues to provide contextual and
process detail only (i.e., did not include quantitative data of responses). Additionally, other extant data were
collected from project staff and WorkForce WV to aid in providing contextual information on student
outcomes.
Key Implementation Evaluation Findings
Many of the allied health programs offered through the New River TAACCCT grant developed the
curriculum based on the respective accreditation board, and curricula have been designed to meet the
accreditation standards and prepare students for post-graduation success. The competency-based
curriculum for the RN program has been developed through a consortium of several institutions. (F1)
Most programs have established relationships with community and workforce partners to serve the
clinical aspects of the curricula as well as in making refinements to the content, as needed. (F1)
To expand and improve the allied health programs, New River implemented crosscutting components,
including program delivery, accelerated completion strategies, stacked and latticed credentials, expansion
of prior learning assessments (PLAs), expansion of technology-enabled learning, transferability of credits,
student support services, and career guidance. (F2)

viii
The New River TAACCCT grant manager and program directors indicated that the majority of the
content for each of the allied health programs was offered in face-to-face classroom settings, but the
allied health programs have provided additional resources online and have incorporated simulation and
virtual labs for exposure to slides and procedures when students are outside of the classroom. (F2)
Accelerated completion strategies are under refinement, with implementation plans for the MA program.
However, these accelerated completion strategies may be limited for the allied health programs due to
specific requirements set by accrediting bodies for the curricula content, number of lab and course
credits, and clinical hours needed to earn the credentials. (F2)
Curricula aligned with accreditation standards increased the potential for stacked and latticed credentials
as well as the certification offerings that students can pursue in conjunction with their degree
coursework. (F2)
During project implementation, foundational education and the SSCs were primary sources for student
support services at New River. The function of the centers included services for students with
disabilities, tutoring, placement testing, academic advising, financial aid support, academic workshops,
and career assistance. (F2)
The grant manager and program directors continue the process of revamping their PLA policies.
Although, as stated by the grant manager, there are limitations to the credits that can be granted because
the accrediting bodies require students to take courses outlined by the mandated curricula. (F3)
Prior to TAACCCT grant implementation, many of the allied health programs made use of specialized
assessments for their selection processes and some programs have implemented rubrics to assess
students’ grades in prerequisite courses with a higher weight being given to science courses. The
admission criteria also utilized students’ scores on assessment tools (e.g., the Health Education Systems
Incorporated [HESI] Admission Assessment Exam) as an assurance that students would be able to meet
the program standards without needing additional remediation. (F3)
New River faculty and staff have established partnerships with program directors from other institutions
to assist with curriculum design, and partners serve on advisory committees to assist with meeting
workforce and accreditation needs, developing curriculum, and discussing resource availability to
contribute to students’ education. (F4)
The most notable aspect of partner involvement, on average, occurred within the student support and
placement services. Partners reported being somewhat involved in providing contextualized learning
opportunities and offering job opportunities for New River allied healthcare program graduates. (F4)
For the most part, the key strategies and activities have been implemented as planned, with three of the
five programs (MA, Paramedic-EMT, and PTA) operational within the grant life. To date, full
implementation of the two remaining programs (Nursing and MLT) remains unresolved; issues of
accreditation for the MLT program and sustainability for the Nursing program remain uncertain. (F5)
An occupation therapy assistant (OTA) program was originally included under the grant initiative.
However, New River removed the OTA program from the grant in January 2015 upon review of viability
and sustainability. (F5)
In fall 2015, a Health Professions Certificate pathway was added to the grant. The certificate was
designed to help students meet prerequisite requirements and build the skills necessary to be successful in
any of the specialized allied health programs. (F5)

ix
A sustainability plan to continue project implementation was developed; however, as of the writing of
this report, West Virginia community colleges were under the threat of unprecedented budget reductions
by the state. Administrators are committed to the programs and look to collaborate with partners to
maintain the resources obtained through the grant as well as gain additional resources. (F6)
Key Outcome Evaluation Findings
A total of 819 unique participants were served under the New River TACCCT grant, with 49 students
completing a grant-funded program of study. There are 541 total participants still retained in their
program of study or other TAACCCT-funded programs. (S1)
Throughout the life of the grant, 433 participants have completed a total of 11,246 credit hours.
Additionally, 58 participants received wage increases post-enrollment.
Students’ average Grade Point Average (GPA) for each semester was a B average (3.00) or higher, with
the exception of Spring 2015 (2.31) and Fall 2015 (2.95), and students earned the highest average GPA in
Fall 2014 with 3.29. Overall, student’s cumulative average GPA is 2.91. (S1)
Of the students who were enrolled in each semester, the majority of them completed all attempted credit
hours. The lowest rates resulted in Fall 2012 and Spring 2013, and the highest rates occurred in Fall 2014
and Spring 2016. (S1)
The majority of students identified as being white in both race and ethnicity. Participants’ average age
was 31.6 years, and 39 participants were eligible for the Pell Grant. (S2)
Pierpont Community and Technical College (hereon referred to as Pierpont) would not provide
education or employment data; therefore, differences between participant and non-participant groups
cannot fully be determined. However, according to entrance survey responses, New River and Pierpont
PTA students had similar perceptions of retention factors and the likelihood for which they would seek
advice from student-provided services (e.g., Student Success Centers). (S3)
Mean ratings of collegiate stress, scholastic conscientiousness, career integration, academic integration,
academic effectiveness, and financial strain were not significantly different between New River and
Pierpont respondents. Pierpont PTA students reported higher ratings of institutional commitment than
New River PTA students, in that Pierpont respondents were more likely than New River respondents to
earn their degree or certificate from their respective institution. (S3)
Pierpont students were more likely to utilize student support services for academic advising, career
planning, early intervention referrals, test proctoring, placement testing, and tutoring, whereas New River
had higher likelihood to pursue disability services and transfer advising. However, none of the
differences between the groups’ mean ratings were statistically significant. (S3)
Due to low enrollment of WIA-TAA (n=2) and veteran (n=2) students, New River enrollment numbers
did not meet the minimum reporting sample size (n≥10). Therefore, the evaluators could not determine,
with accuracy, the extent to which WIA-TAA and veteran students differed from other participating
students on education and employment outcomes. (S4)
New River students were very satisfied with the academic support they received outside of the classroom
and somewhat satisfied with the services from the Student Success Centers. Although many of the
respondents indicated that they did use the Virtual Career Network, others reported that they were neither
satisfied or dissatisfied or somewhat satisfied with the network. (S5)

x
New River’s entrance survey respondents indicated they were most likely to seek academic advising and
career planning, though the likelihood was still rather low. Overall, students reported they were unlikely
to utilize the Student Success Centers for advice and support across the services provided. (S5)
Conclusions
Survey response rates from participants and partners were low when conducting online surveys. Despite
efforts to utilize various methods to secure higher response rates (e.g., shortening the survey, using both
paper and online, having advisors go to classrooms to distribute the survey, etc.), response rates tended
to be low. One barrier to potentially securing a higher response rate was lack of permission to use
incentives.
Projected outcomes that were included in the grant application were frequently unrealistic. This appears
to primarily be due to the lack of understanding about the definition of the indicators when grantees
prepared the proposals and those with familiarity or knowledge of realistic targets were not the grant
writers.
An expectation of TAACCCT evaluations was to employ either an experimental or quasi-experimental
design. Experimental designs were not permissible for TAACCCT evaluations conducted due to the fact
grantees could not randomly select who could participate in the grant program offerings. Quasi-
experimental designs were proposed in the evaluation plan (e.g., comparison with students in similar
programs at same college or students in same programs at a non-TAACCCT college); however,
evaluators had ongoing challenges in securing comparison programs and corresponding data to
effectively employ this design as well.
Engaging the project staff in the evaluation as well as ongoing communication of expectations and their
roles is valuable. It is beneficial for articulating expectations to stakeholders, establishing a common
understanding of the evaluation, and helping stakeholders understand the value and purpose of
evaluation. McREL evaluators and New River staff maintained a collaborative evaluation effort by
participating in monthly update meetings, as needed; discussing data collection tool development and
implementation; and utilizing ongoing email and telephone correspondence, as needed, throughout the
life of the grant.
As an organization that is evaluating more than one TAACCCT, it has been advantageous to build upon
economies of scale; internally, evaluators have learned from each other’s projects and used common
evaluation methods and scales. It would have been valuable to have all TAACCCT evaluators convene
for at least one national meeting as proposed in the SGA. These types of meetings would have built a
community of learners that would have permitted each of us to share what was learned with the
evaluations, instruments and processes as well as facilitated networking with one another.

1
Introduction
New River Community and Technical College (hereafter referred to as New River) was
awarded a grant from the U.S. Department of Labor (DOL) in September 2012 as part of the
Round 2 Trade Adjustment Assistance Community College and Career Training (TAACCCT)
program. New River intended to utilize the grant to provide targeted training and workforce
development to economically dislocated workers in southern West Virginia in addition to supporting
partnerships between the college and local employers to develop programs that provide pathways to
high-wage, high-skill jobs that meet industry needs (DOL, 2011).
Over the duration of the grant, New River worked to expand, develop, and improve its
existing nursing and allied health training programs to provide specialized education options to
participants eligible for trade adjustment assistance (TAA), returning veterans, as well as other
unemployed or underemployed workers. The New River TAACCCT project served 11 counties in
West Virginia and students from another seven counties in Virginia. The New River TAACCCT
project provided students with specialized occupational training while guiding them along healthcare
career pathways identified and developed by the college.
Initially, six pathways were planned as part of the initiative, including dietetic technician,
medical laboratory technician (MLT), occupational therapy assistant (OTA), paramedic-emergency
medical technician (EMT), physical therapy assistant (PTA), and registered nurse (RN) programs. A
medical assistant (MA) program replaced the dietetic technician program in August 2013 and, in
January 2015, the OTA program was removed from the grant. Later in 2015, a Health Professions
certificate was added to the grant for students to gain knowledge and skills in preparation for any of
the five remaining pathways (i.e., MA, MLT, EMT, PTA, or RN programs), which was especially
beneficial to those awaiting selection into their desired degree program. Decisions regarding which
programs to be included under the TAACCCT
grant were approved by New River’s federal
program officer. Currently, three of the programs
are operational (i.e., MA, Paramedic-EMT, and
PTA), and two others are expected to start in 2016.
As mentioned, the overarching goal of the project
is to create and develop viable career options for
southeastern West Virginia’s trade-impacted adults,
unemployed, underemployed, and veterans while
fulfilling the region’s critical healthcare industry
demand for qualified candidates.
Four overarching, intersecting strategies serve as the foundation of the initiative: (1) meeting
healthcare workforce demands, (2) transforming developmental education, (3) creating Student
Success Centers (SSCs), and (4) overall grant administration. To achieve the multi-level goal of the
TAACCCT program, New River staff conceived several project strategies and substrategies. Table 1
presents the four overarching project strategies previously discussed and the activities/milestones
necessary to implement those strategies.

2
Table 1. New River TAACCCT Project Strategies and Activities
Strategy Activities/Milestones
Strategy 1: Meeting Healthcare Workforce Demand
1.1 Create curricula for new healthcare programs
Engage employers in curriculum development
Embed accelerated completion strategies (e.g., reducing the credit hours required or utilizing compressed learning cycles) into the curricula
Embed contextualization into the curricula
Build multimodal delivery into the curricula
1.2 Obtain accreditation for the RN program
Apply to the West Virginia Registered Nursing Board for accreditation
Participate in the Board review
Obtain accreditation
1.3 Define stackable and latticed credentials
Review national models for healthcare career pathways
Consult with employers about the fit of credentials with jobs
Map New River’s healthcare pathways options for learners
1.4 Expand use of prior learning assessments (PLAs)
Implement the Council for Adult and Experiential Learning’s PLA tool,
Learning Counts, for all entering students
Assess veterans’ military experience to translate into credits
Expand use of dual credit strategies with high schools
1.5 Expand use of technology-enabled learning
Implement multimodal delivery, including hybrid, interactive audio-video,
and Internet-based learning
1.6 Ensure transferability of healthcare credits
Identify relevant four-year colleges for articulation agreements
Negotiate articulation agreements
1.7 Engage employers and public workforce system
Work with the Region I Healthcare Consortium to continue identifying
needs and opportunities to solve industry workforce issues
Convene the Employer Leadership Council to co-create curricula and to co-own implementation
Partner closely with the Region I Workforce Investment Board (WIB) and WorkForce West Virginia TAA staff on outreach and placement
Strategy 2: Transforming Developmental Education
2.1 Redesign developmental education approach
Examine models and research
Design math and reading/writing labs
Determine what diagnostic assessment to use
Determine what remedial supports will be offered while a student is in a mainstream course
Create remedial curricula contextualized to healthcare
2.2 Implement reframed developmental education
approach
Identify/hire and train faculty
Implement use of diagnostic assessment
Implement “mainstream with supports” approach
Open math and reading/writing labs
Use contextualized curricula
2.3 Make adjustments to approach based on results
Review evaluation findings regarding developmental education changes
Make revisions as needed to the approach

3
Strategy Activities/Milestones
Strategy 3: Creating Student Success Centers (SSCs)
3.1 Design SSC approach Examine models and research
Create outreach design
Create advising design
Design student success course
Design online supports
Design placement strategy
Develop partnership agreements with Region I WIB and State TAA office on blending efforts on supports
Develop implementation schedule
3.2 Implement SSCs Hire/assign and train staff
Create physical sites for the centers
Promote center availability
Phase-in center openings: one in Year 1, two in Year 2, and two in Year 3
3.3 Bolster online supports Make Virtual Career Network available to students through the
New River portal
Create virtual SSC with unified access to information, advising, and other supports
Strategy 4: Grant Administration
4.1 Appoint program manager Finalize job description
Recruit and select
4.2 Select evaluator and undertake evaluation
Procure evaluator competitively by end of Year 1, Month 3
Launch evaluation by Year 1, Month 4
Review ongoing evaluation findings (grant months 12, 18, 30, and 48)
4.3 Establish project management systems for the grant
Establish internal communication protocols
Develop performance management system
Define fiscal manager system for the grant
Do all required reporting
Engage in national grantee meetings
4.4 Create and implement sustainability plan
Review evidence as to strategy effectiveness
Develop game plan for sustaining strategies post-grant
Phase in institutional funding to meet sustainability goal
The next section of this report describes the evaluation design created by New River’s third-
party evaluator, McREL International, and is followed by a description of the evaluation findings,
conclusions, and lessons learned. Overall, this summative report outlines the evaluation findings.
Data collection tools and detailed data tables for the evaluation activities can be found in
Appendices A-G.

4
Evaluation Design
Data collection tools for the New River TAACCCT grant project included a student
entrance survey, student exit survey, partner surveys, staff interviews, student wage and employment
data, and student education records. The McREL evaluators utilized these data collection tools to
provide New River staff a with formative and summative progress updates through the life of the
grant. More detail on the purposes of each method is described below, along with a description of
how the data were analyzed.
Data Collection
Student Entrance Surveys. A paper-based student entrance survey was administered to
participants enrolled in one of the allied health programs at New River or the comparison site (i.e.,
Pierpont) to gather quantitative data related to participants’ collegiate perceptions and experiences,
ratings of academic instruction and advising, and likelihood to seek a variety of services.
Additionally, qualitative data were collected to measure the aspects of college that motivated
students to complete their respective credentials as well as any barriers to completing their
programs. Data collection for these surveys took place within the first week of each semester. A
total of 152 (131 New River and 21 Pierpont) students completed a survey during the grant. Surveys
were administered and collected by the allied health instructors. The collection of completed
surveys was then mailed to the McREL evaluation team for analysis.
Student Exit Surveys. The evaluation team collected surveys from students upon exiting
their allied health program at New River. A total of 29 student exit surveys were completed and
returned to the McREL evaluators. Similar to the entrance survey, the exit survey asked students to
reflect on their perceptions of their experiences at New River, the quality of instruction and advising
received, and their utilization of the student success centers. The completed surveys were collected
by allied health instructors then mailed to the McREL evaluation team for analysis.
Partner Surveys. New River has partnered with local allied health professionals to support
the TAACCCT grant and programs supported by grant funding. Partnerships include affiliations to
New River via the students or direct contact with New River faculty and/or staff. Generally,
partners could provide support in a variety of ways, including recruitment assistance, curriculum
design input and feedback, supplying technology or equipment, or through the provision of student
support services. Partner surveys were developed and administered in summer 2015 to gather
feedback from New River’s TAACCCT grant partners about their perceptions and expectations of
the program as well as their experiences thus far. A total of 38 partners responded; 34 of whom
completed the survey in its entirety.
Staff Interviews. New River project staff were asked to participate in group interviews to
reflect on implementation, outcomes, and sustainability plans on two occasions throughout the life
of the grant. During staff interviews, program leads, SSC staff, Foundation Education staff, and
grant administration met with a McREL evaluator separately to discuss items on the interview
protocol related to their respective responsibilities. Items from the interview protocol included

5
introductory questions on their overall views on the implementation of the TAACCCT programs,
component questions regarding specific involvement in implementation, and concluding questions
to reflect on sustainability and transferability beyond the life of the grant.
Fidelity Measure. To quantify program progress and implementation efforts, evaluators
developed a fidelity measure designed specifically for the project to document level of
implementation over the course of the project. Evaluators provided an objective rating using data
collected from interviews, record reviews, and event observations to rate each of the key program
strategies. Evaluators used the quantified data, especially the program-level data, to monitor the
program’s progress toward full implementation, and evaluate the strengths and weaknesses of
program implementation to inform the likelihood of program sustainability and transferability.
Wage and Employment Data. In early 2014, McREL evaluators entered into negotiations
with WorkForce WV to obtain wage and employment data. Negotiations continued through the
year and in August 2014, McREL evaluators entered into a data sharing agreement with WorkForce
WV to provide wage and employment data on an annual basis. Prior to the sharing of any wage and
employment data, evaluators obtained signed consent from participating students. WorkForce WV
and evaluators were committed to protecting all personally identifiable information (PII), so all
transfers of data were encrypted using 256-bit SSL (Secure Sockets Layer). Data traveling between
the endpoints could only be decrypted by the intended recipient by using unique decryption keys.
Shared data included each students’ employment status and wages earned by quarter, as well as
information on the industry in which they are employed. Once wage and employment data were
received, records were masked for analysis by using unique identification numbers.
Education Records. Each project year, evaluators were provided with education records
that included PII and other sensitive data such as students’ demographics, academic major, credits
earned and grade point averages by semester, prior learning assessments, academic eligibility, and
credentials earned. New River staff and evaluators were committed to protecting all sensitive data,
so all transfers of data were encrypted using 256-bit SSL (Secure Sockets Layer). It should be noted
that prior to New River sharing any education records, evaluators obtained signed consent from
participating students.
Data Analysis
A variety of quantitative and qualitative data collection methods were employed, as
previously described and all data collection tools were developed in collaboration with New River
project staff. Descriptive statistics (e.g., frequencies and percentages) and measures of central
tendency and dispersion (e.g., means and standard deviations) were conducted on quantitative data,
while qualitative data were analyzed by question and theme. Data were segmented into passages
through coding, and salient themes were then identified and summarized. Qualitative analyses on
open-ended survey items and interview responses provided contextual and process detail only and
did not include quantified findings such as the number and percentage of respondents providing a
particular comment. Other extant data were collected from the project staff and WorkForce WV to
aid in providing further contextual information on student outcomes.

6
Data Limitations
Readers of this report should note that not every student who was enrolled in TAACCCT-
sponsored programs participated in evaluation efforts. Participation in data collection efforts was
voluntary. Additionally, to most effectively examine program outcomes, McREL evaluators initially
planned to employ a quasi-experimental, cohort-based longitudinal design with a comparable
nonparticipating group of students to assess the extent to which the New River TAACCCT project
resulted in participant outcomes of interest. A comparison site was found and initial discussions
about collecting data were positive and a data sharing agreement was solidified, but when data
collection began, comparison site personnel did not respond to requests to collect data and/or to
share data. With a lack of comparison data, evaluators were unable to differentiate treatment and
control students as initially intended.
Implementation Evaluation Findings
Data collected during the TAACCCT grant are utilized in measuring the extent to which
New River has met the project objectives. Data tables for each data collection activity can be found
in Appendices A through G. The findings presented in this section are organized by
implementation evaluation question with the primary findings in bold, orange font. Contextual
information follows these primary findings.
F1 How were the curricula for the allied health programs selected, used, or
created for inclusion under this grant opportunity? (SGA Implementation Q1)?
Curricula for the allied health programs were primarily developed and implemented by
adhering to the respective accrediting board standards.
Many of the Allied Health programs offered through the New River TAACCCT grant
developed the curriculum based on the respective accreditation board. Curricula have been designed
to meet the accreditation standards and prepare students for post-graduation success. One
exception stemmed from the MA program since New River leaders and faculty have been discussing
whether to align their curriculum with the core curriculum set by the Medical Assisting Education
Review Board since accreditation is not necessary for students to receive the credentials. In addition
to the standards that guide curricula development and implementation., many programs established
relationships with community and workforce partners to enhance clinical aspects of the curricula as
well as in making refinements to the content, as needed. Many of those who responded to the
partner survey indicated that they were not involved in curriculum design and development, as
shown in Table 2. However, others expressed that they were somewhat involved in ensuring
industry needs are met by assisting with curriculum design and redesign (23.5%), identifying
credentials (20.6%), and identifying important knowledge and skill sets (25.7%). New River also
recruited partners to serve on advisory committees, in which healthcare professionals and educators
could collaborate to make program refinements.

7
Table 2. Partner Involvement in Curricula Design and Development
n
Not
Involved
Barely
Involved
Somewhat
Involved
Often
Involved
Highly
Involved
Curriculum design and development
Assist in curriculum design and
redesign to ensure the training
provided is aligned with industry needs
34 70.6% -- 23.5% 2.9% 2.9%
Identify credentials that meet
industry needs 34 64.7% 5.9% 20.6% 2.9% 5.9%
Identify important knowledge and
skill sets that meet industry needs 35 54.3% 2.9% 25.7% 8.6% 8.6%
In August 2013, the MA program was added as a modification to the original New River
TAACCCT grant proposal. The MA program existed at New River prior to the grant, though
modifications were made to the curriculum through the use of TAACCCT funds. The program
does not require admittance directly into the program; instead, students are counted as MA majors
upon enrollment into the first restrictive course in which they are evaluated on psychomotor and
affective competencies (MA 107 and 107L). While the Medical Assisting Education Review Board
develops the core curriculum for MA programs across the nation, New River leaders and faculty
continue to discuss whether to align their curriculum with those accreditation standards as
accreditation is not necessary for students to receive the credentials.
The MLT program is still under development. The curriculum has been designed to meet
the requirements of the National Accrediting Agency for Clinical Laboratory Sciences (NAACLS)
and national certification. The New River TAACCCT program director indicated that they
collaborated with other programs to establish the core curriculum, which includes 60 credit hours in
the technical program. Based on the staff interviews, the MLT program has also adjusted the
program’s start date to improve clinical rotations.
As the schedule stands, students must complete a
mandated number of clinic hours during the winter,
which has proven to be troublesome in southern
West Virginia due to weather-related issues. If the
start date is altered, cohorts will complete their
clinical rotations during the summer months when
clinic closures due to weather will not be an issue.
However, the MLT program must receive approval
from the NAACLS before it can begin actively
enrolling students and delivering instruction; once that occurs, the program can apply for
accreditation. In addition, the MLT program has established contracts with community and
workforce partners for equipment and to serve as clinical affiliates. The clinical partners have been
actively involved in the program, as well as contributing disposable equipment for the students to
utilize during the course instruction. The New River program director stated that these donations
are useful due to the expenses required to run the program.

8
The curriculum for the Paramedic-EMT program was set by the U.S. Department of
Transportation. The program received accreditation by the Commission on Accreditation of Allied
Health Education Programs in July 2013, making it the second paramedic program in the state to be
accredited. New River also established an EMT Associate of Science degree as a continuation of the
certificate program. Prior to admission, students complete an EMT exam for initial placement into
the program and to determine whether they need individualized learning plans. The New River
TAACCCT program director indicated that the curriculum has been designed to prepare students
with English and mathematical components, followed by skills-based lab courses. In addition, the
director expressed that the lab activities and clinical rotations prepared students for a scenario
evaluation. At the end of each week, students re-enter the classroom from a hospital or ambulance
setting for faculty to identify any missing areas in
which the students could use additional
instruction. A needs assessment was also used to
gauge students’ preparedness for the national
board examination. While the program has been
able to achieve the target for the number of
unique participants, students have been able to
complete the training necessary to pass the
national registry exam, which is required for
employment, without graduating from the
program.
The PTA program was granted probationary accreditation from the Commission on
Accreditation in Physical Therapy Education (CAPTE), which allows students to sit for the National
Board Exam. The program director and faculty reviewed each course’s curriculum to ensure the
necessary requirements are met for full accreditation based upon CAPTE standard changes in
February 2016. The PTA program director frequently met with the dean and vice-president of
academic affairs to coordinate content and prerequisites needed to meet the CAPTE requirements
and prepare students for national certification. Although the PTA program’s curriculum has not
changed, the courses have undergone revisions to continually meet students’ and accreditation
needs.
The competency-based curriculum for the RN program was developed through a
consortium of several institutions. The program was designed for students to complete 60 credit
hours without prerequisite courses. However, New River experienced challenges in establishing the
program and receiving accreditation. The regulations set forth by the West Virginia Board of
Examiners for Registered Professional Nurses state that instructors must have a master’s degree in
nursing plus two years of teaching experience. Hired faculty who did not meet the minimum
qualifications were required to have a mentoring plan. Project staff at New River indicated that
southern West Virginia schools struggle to find qualified individuals to serve as instructors and who
meet these regulations. As such, New River communicated with the board to establish the
parameters of staffing requirements. The interviewees expressed there was some confusion over
who could serve as a mentor as well as methods for implementing a mentoring plan for instructors
without the required degree and teaching experience. New River staff also noted that programs all

9
over the state had difficulty in hiring new faculty members. Specifically, staff shared that the former
board posed restrictions on who they could hire even after the college’s president approved an
individual.
During the staff interviews in September 2015, the TAACCCT grant manager discussed the
modification of an allied health certification by creating a Health Professions Certificate. The
certificate was designed to help students meet prerequisite requirements for any of the specialized
allied health programs. Students could pursue the Health Professions Certificate to obtain
introductory science courses (e.g., biology or chemistry) and build the skills necessary to be
successful in an accredited program. The grant manager and program directors believed the
certificate will increase completion rates. The PTA program director, in particular, expressed that
the certificate allows students to earn credentials even if they have not yet been selected into their
desired program of study. Certain programs, PTA included, often received a large volume of
applications and could only admit 20 students at a time into the program; therefore, the Health
Professions Certificate could provide students with a productive alterative if they were not selected
for their chosen program of study. Fall 2015 marked the first semester where students pursuing the
Health Professions Certificate were tracked.
F2 How were programs and program designs improved or expanded using grant
funds? (SGA Implementation Q2)
New River improved and expanded the programs by utilizing accelerated completion
strategies, stacked and latticed credentials, and technology-enabled learning. Prior
learning assessments, student support services, career guidance and transferable credits
ensured the quality of the allied health programs offered under grant funding.
To expand and improve the allied health programs, New River implemented crosscutting
components, including program delivery, accelerated completion strategies, stacked and latticed
credentials, expansion of prior learning assessments (PLAs), expansion of technology-enabled
learning, transferability of credits, student support services, and career guidance.
The New River TAACCCT grant manager and program directors indicated that the majority
of the content for each of the allied health programs was offered in face-to-face classroom settings
because students often require hands-on medical training to practice specific techniques. Although,
the allied health programs have been providing additional resources online and have incorporated
simulation and virtual labs for exposure to slides and procedures when students are outside of the
classroom. The program directors indicated that they will be defining the accelerated completion
strategies and plan to start with the MA program. However, these accelerated completion strategies
may be limited for the allied health programs because they often have specific requirements set by
their accrediting bodies for the curricula content, number of lab and course credits, and clinical
hours needed to earn the credentials. The grant manager added that the Paramedic-EMT program is
already somewhat accelerated due to students working through the summer to complete their
clinical rotations.
10
The PTA program offers a two-year degree that aligns with the national board certification
and, ultimately, all doctorate-level physical therapy programs to address components of stacked and
latticed credentials. The MLT program has not received accreditation at this time; however,
students will have the option to pursue a workforce skills certificate in Phlebotomy in addition to
the MLT credentials. There is also a Medical Billing and Coding certificate that students enrolled in
the MA program can pursue simultaneously. In addition, the Paramedic-EMT program offers both
a certificate and degree track.
To address the expansion of PLAs, New River staff plan to follow the state guidelines in
equating industry credentials to college credit. The Board of Governor’s Associate in Applied
Science (AAS) degree marked one of the first examples of PLA implementation. Students had the
opportunity to develop a portfolio of prior learning and work experience in order to receive credits
that could be applied toward the degree. New River staff also indicated that they are working to
maximize students’ credit for their military experiences. Students are granted credit based on an
evaluation completed by the Army/American Council on Education Registry Transcript System
(AARTS). This credit is typically used to fulfill elective courses, but an advisor can approve a
substitution if the course is equivalent to a required course.
A PLA committee and PLA Coordinator drafted a PLA process plan and attended a
TAACCCT grant PLA Process Map Follow-up meeting in August 2015. A formal PLA process
plan was submitted to the Educational Advisory Board and, once approved, was forwarded to the
Faculty Senate. According to New River staff, the PLA policy expands the use and offering of
multiple credit plans. The PLA plan was approved in May 2016, and New River immediately began
implementing the PLA process in full capacity.
New River strived to form articulation agreements with other colleges (i.e., University of
Charleston, Marshall University, West Virginia University, Concord College, etc.) in the region to
ensure that the credits earned by students are transferable. Given that the MLT and RN programs
are under development, it is too early to negotiate articulation agreements for these programs.
However, the allied health program directors searched for two- and four-year colleges with which to
form articulation agreements for functioning programs. Additionally, faculty and staff plan to
collaborate with instructors of similar programs in the region to determine the skills and knowledge
necessary for students to continue from New River’s two-year programs to a four-year institution.
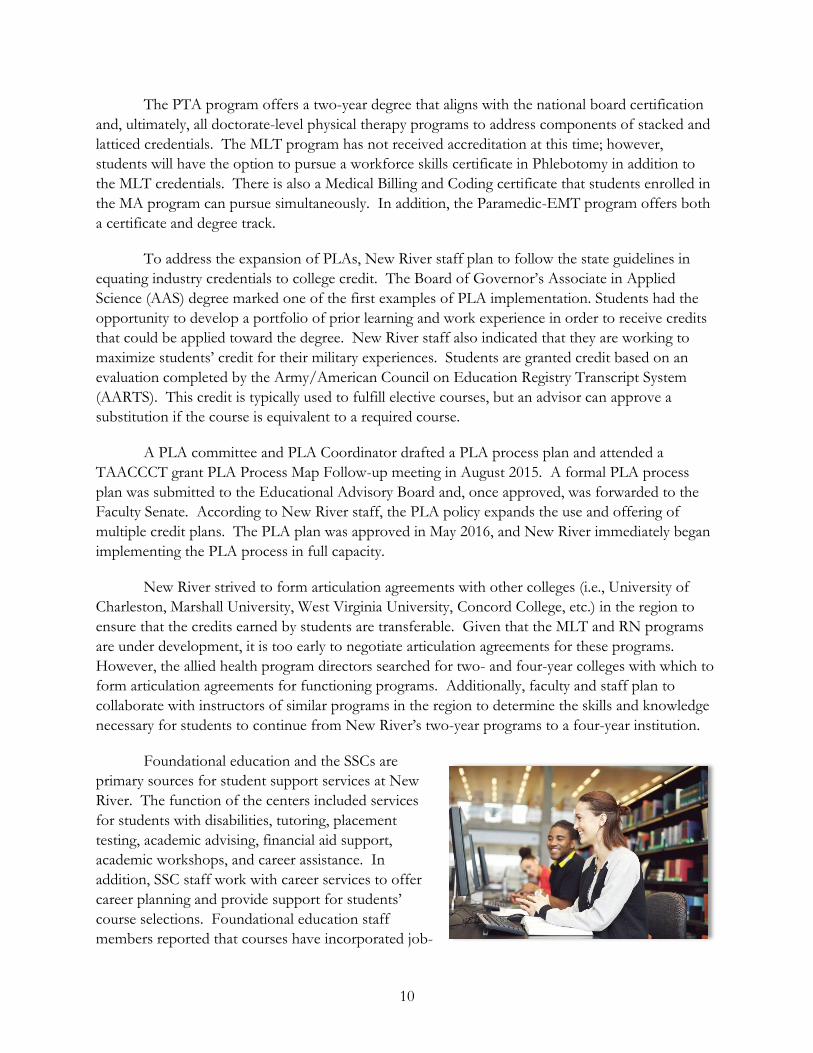
Foundational education and the SSCs are
primary sources for student support services at New
River. The function of the centers included services
for students with disabilities, tutoring, placement
testing, academic advising, financial aid support,
academic workshops, and career assistance. In
addition, SSC staff work with career services to offer
career planning and provide support for students’
course selections. Foundational education staff
members reported that courses have incorporated job-

11
related examples into the lessons to increase students’ understanding of the content and emphasize
its importance for their future. Additionally, the combination of courses and corresponding lab
requirements has provided students with a learning community in which to develop the knowledge
and skills necessary to succeed within and beyond the classroom.
F3
How were participants selected for inclusion into their program of study?
How was the course sequence for participants established? To what extent
and how was career guidance provided to participants? (SGA Implementation
Q3)
The New River TAACCCT programs utilized prior learning assessments during the
selection process. Student Success Centers and the Office of Career Services supplied
participating students with career guidance, and workforce partners offered some career
placement services.
The New River TAACCCT grant manager and program directors shared that they are
revamped their PLA policies. Although, as stated by the grant manager, there are limitations to the
credits that can be granted because the accrediting bodies require students to take courses outlined
by the mandated curricula. In addition, many of the allied health programs already utilize specialized
assessments for their selection processes. At present, New River does not have an accredited MA
program, and students are not required to complete pre-entrance exams or requirements. Allied
health program directors also discussed the use of prerequisite courses in selecting students for
program admission. Some programs have implemented rubrics to assess students’ grades in
prerequisite courses, with a higher weight being given to science courses. The admission criteria also
utilized students’ scores on assessment tools (e.g., the Health Education Systems Incorporated
[HESI] Admission Assessment Exam) as an assurance that students will be able to meet the
program standards without needing additional remediation.
The interviewees added that both the SSCs and the
Office of Career Services offered career guidance to
students. Through these avenues, students received one-
on-one counseling sessions, accessed career assessments
(i.e., Kuder® Journey), and gained general information
about careers as well as job openings for which they could
apply. In addition, students could participate in workshop
sessions on resume writing and interview etiquette.
Overall, New River entrance survey respondents
indicated that the likelihood of them pursuing career
planning through the SSCs was between somewhat unlikely
and neutral, with a mean score of 2.61 (SD=1.39) on the 5-
point Likert type scale (see Figure 1)4.
4 Responses ranged from (1) very unlikely to (5) very likely.
Very
Unlikely
Somewhat
UnlikelyNeutral
Somewhat
Likely
Very
Likely
Mean Score
2.61
Figure 1. Likelihood to Pursue
Career Planning via SSCs

12
Exiting New River TAACCCT students indicated that they were neither satisfied nor dissatisfied with the services they received through the student success centers (60.9%). However, the majority of respondents were highly satisfied with their academic advising (58.6%), felt they could very easily get answers to their education-related questions (51.7%), and expressed the training they received was highly likely to get them the job they want (86.2%).
The program directors reported that it was common practice to incorporate the interview
process, job application, cover letter, and resume as part of the capstone or practicum course. They
further noted that many of the students received job placements from their clinical worksites at the
end of the program. One program where this was the exception is the Paramedic-EMT program.
To be eligible for the program, students must have their EMT-Basic card and most of students were
already working in this capacity. For these individuals, the benefit of the program was an increase in
pay once they passed their national licensure exam. However, program directors indicated that they
often connected students with employers in the community through job fairs and employers who
have expressed interest in recent graduates. Workforce partners involved in project implementation
provided New River students with information related to job openings in the allied healthcare fields
and offered job opportunities to recent graduates on occasion, according partner survey results.
Partner survey respondents also indicated that they would like to be more involved in student
support and placement services. Partners involvement will be further discussed under the following
implementation evaluation findings (refer to F4).
F4
To what extent are education, community, employer, and workforce partners
involved in the implementation of the New River TAACCCT? (SGA Implementation
Q4)
Workforce partners participated in advisory committees to assist with program
development and implementation, offered resources for program delivery, and provided a
platform for students to engage in hands-on training experience outside the classroom.
Partners and New River staff were satisfied with the partners’ level of involvement in the
project.
Each of the New River TAACCCT programs has established local workforce and college
education partnerships. These partners often serve on advisory committees, assist with
employment, and/or instruct students at clinical sites. Additionally, faculty and staff have
established partnerships with program directors from other institutions to assist with curriculum
design. Each of the allied health programs have their own advisory committee to assist with meeting
workforce and accreditation needs, develop curriculum, and discuss resource availability to
contribute to students’ education.
Faculty members indicated they are highly satisfied with their involvement with the partners,
with the vice president of academic affairs adding, “More importantly, the partners are satisfied with
the collaboration they have had with our folks.” New River faculty have built a close-knit
community with the partners to refer students for clinical rotations or employment following
graduation. Additionally, the partners are providing faculty members with informal feedback on

13
students’ strengths and weaknesses in their clinical settings. New River partners indicated that, thus
far, they have had minimal involvement in project activities (see Table 3). The highest area where
partners have been involved, on average, occurred within the student support and placement services
category (M=2.50, SD=1.17); partners reported being somewhat involved in providing
contextualized learning opportunities and offering job opportunities for New River allied healthcare
program graduates.
Table 3. Partner Survey: Overview of Program Involvement
Project Activities M SD
Participant Recruitment 1.28 0.71
Curriculum Design and Development 1.85 1.11
Technology and Equipment Support 2.01 1.18
Partnership Support 2.26 1.54
Student Support and Placement Services 2.50 1.17
Note: Responses ranged from (1) not involved at all to (5) highly involved.
Partners’ satisfaction, on average, landed between neutral (3) and somewhat satisfied (4) on the
five-point scale provided on the partner survey. Partners rated the quality of program
implementation as good or excellent. Participant recruitment received the highest average score across
the partner respondents, followed by student support and placement services. Additionally, the
partners tended to agree that the New River TAACCCT project is making a positive impact on the
allied healthcare industry and local community across all New River locations and partnership sites,
as shown in Table 4. Specifically, the partners indicated that New River prepares workers with the
knowledge and skills to be successful in the allied healthcare industry and supports the development
of the local workforce. The partners also reported that New River offers programs that meets both
their organization’s and the industry’s needs. The majority of partners indicated that the partnership
between their organization and New River will continue and expand beyond the life of the grant,
which is also reflective in partners’ high likelihood to consider working with New River on future
projects.
Table 4. Partner Perceptions of Impact on Allied Healthcare Industry and Local Community
Statement n
Strongly
Disagree Disagree Neutral Agree
Strongly
Agree M SD
New River programs offer
certificate, diploma, and degree programs that meet industry needs.
35 -- -- 28.6% 45.7% 25.7% 3.97 0.75
New River programs prepare
workers with the knowledge and
skills needed to be successful in the allied healthcare industry.
35 -- -- 34.3% 34.3% 31.4% 3.97 0.82
The New River project offers
programs that support local
workforce development.
35 -- 2.9% 28.6% 42.9% 25.7% 3.91 0.88

14
Statement n
Strongly
Disagree Disagree Neutral Agree
Strongly
Agree M SD
New River programs prepare highly
skilled workers who meet allied
healthcare industry needs.
35 -- 5.7% 34.3% 28.6% 31.4% 3.86 0.94
New River allied healthcare
programs prepare highly skilled
workers who meet my organization’s needs.
35 -- 2.9% 37.1% 31.4% 28.6% 3.86 0.88
The partnership between my
organization and New River allied
healthcare programs will continue
and expand beyond the life of the grant period.
35 2.9% -- 22.9% 37.1% 37.1% 4.06 0.94
I will consider collaborating with
New River on other projects in the future.
34 2.9% -- 20.6% 47.1% 29.4% 4.00 0.89
F5
To what extent are the key strategies and activities being implemented as
planned? What changes were made to the key strategies of the New River
TAACCCT during implementation and for what reasons? (New River
Technical Narrative)
The majority of key strategies and activities were implemented as planned. The New River
project staff held regular update meetings to discuss implementation and sustainability to
make program-wide adjustments, including the inclusion of specific programs under grant
funding.
To respond to the grant’s requirements, the grant manager, program directors, accountant,
chief financial officer (CFO), human resources (HR) director, president, vice president of academic
affairs, vice president of student services, and applications programmer all contributed to activity
logs and deliverable tracking systems to provide implementation updates. For the most part, the key
strategies and activities have been implemented as planned. Three of the five programs were
operational (MA, Paramedic-EMT, and PTA) within the grant life.
Two programs (MLT and RN) have yet to start due to personnel and accreditation issues.
The program staff received approval from the federal grant officer to remove the OTA program due
to issues in viability and sustainability. The RN program has continued to work to combat
challenges in obtaining accreditation. Internal and external challenges arose when hiring certified
staff members and meeting the evolving board standards. Specifically, the regulations set forth by
the West Virginia Board of Examiners for Registered Professional Nurses indicated that instructors
must have a master’s degree in nursing and two years of teaching experience. Hired faculty who do
not meet the minimum qualifications must have a mentoring plan. The RN program staff felt they
did not get clear, consistent feedback on who can be mentors, the purpose of the mentorships, and

15
personnel qualifications. In September 2015, staff expressed that the RN program may have better
odds of becoming operational under the newly appointed board members. The MLT program, on
the other hand, was delayed in obtaining accreditation due to equipment and space needed for the
clinical and laboratory components of the program.
In early 2013, a program “stoplight” graphic was created (see Figure 2) when the first
quarterly report was developed for New River. The “stoplight” graphic enabled evaluators to
quickly illustrate the implementation status of the major strategies and components of New River’s
project. The components in the figure are based on the activities and milestones outlined in New
River’s technical plan (pp. 22-25). Green indicates areas in which New River made substantial
progress, yellow represents those areas that are underway but are behind schedule, and red depicts
those areas that are least established.
Strategy 1: Meeting Healthcare Workforce
Demand
Strategy 2: Transforming
Developmental Education
Strategy 3: Creating
Student Success Centers
Strategy 4: Grant
Administration
Medical Assisting (MA)
Medical Laboratory Technician (MLT)
Occupational Therapy Assistant (OTA)
Paramedic-EMT
Physical Therapist Assistant (PTA)
Registered Nursing (RN)
Career Guidance
Transferability of Credits
Expansion of Prior Learning Assessments
Accelerated Completion Strategies
Program Delivery
Stacked and Latticed Credentials
Student Support Services
Expanded Technology-Enabled Learning
Collaboration with Grant Partners
Design and Implement Math and Reading/Writing Labs
Diagnostic Assessment
Redesign Developmental Education Approach
Hire and Train Developmental Education Staff
Design Student Success Center Approach
Hire and Train Student Success Center Staff
Appoint Project Manager
Select Evaluator
Contextualized Learning
Mainstream with Supports
Create and Phase-In Center Sites
Outreach and Branding
Bolster Online Supports
Establish Project Management System
Sustainability Plan
Structures for Data Tracking
Substantial Progress
Some Progress
Little or No Progress
Figure 2. New River TAACCCT Program Implementation Stoplight
F6
To what extent are the various components of the New River TAACCCT
sustainable (degree programs, developmental education, and Student Success
Centers)? (New River Technical Narrative)
The New River staff are committed to the allied health programs, and the administration
has constructed a sustainability plan for maintaining key components of the project.
New River project staff were asked to discuss the extent to which the key components of the
grant are sustainable. Overall, the interviewees indicated their belief that most of the grant
components will be sustained. Staff members shared that they are highly dedicated to their allied
health programs and, in turn, believe that the majority of staff involved with the TAACCCT project
are committed to New River. Grant administration have established a sustainability plan to continue
project implementation. Administrators indicated that they are committed to the programs and plan
16
to communicate with partners to maintain the resources obtained through the grant as well as gain
additional resources. Throughout the life of the grant, administrators have taken action to
appropriate funds and establish sustainability; however, in April 2016, West Virginia community and
technical college leaders were faced with the threat of having to make an “unprecedented budget
reduction.”5
Project Outcomes Findings
Outcome evaluation questions and findings are presented in the following section. Primary
findings are reported in bold, red font followed by contextual information.
S1 To what extent does the New River TAACCCT meet targeted project
outcomes? (Annual Report Template Section B)
New River served 819 unique participants, with the majority completing credits. Students
for whom education records were available maintained a 3.0 GPA or higher in the majority
of the semesters throughout the span of the grant.
A total of 819 unique participants were served over the duration of the New River
TAACCCT grant, with 49 participants completing a grant-funded program of study and 541
participants still retained in a program of study or another grant-funded program. Five additional
participants are retained in other education programs. The majority of New River TAACCCT
participants completed credit hours (52.9%) throughout the grant life. There only two participants
who enrolled in further education. There were also 19 participants were employed upon completing
their grant-funded program of study, four of whom retained employment (21.1%). Additionally, 58
participants received wage increases upon graduating from a New River TAACCCT-funded
program. See Table 5 for a complete breakdown of New River’s outcome measure target and actual
numbers by grant year.
5 Comment made at West Virginia Council for Community and Technical College meeting in April 2016.

17
Table 5. New River TAACCCT Grant Participants Years 1 and 2 Targets vs. Actuals
Outcome Measure Year1 Year 2 Year 3 End-of-Project
Target Actual Target Actual Target Actual Target Actual
1, Total unique participants served 70 105 116 139 186 575 372 819
2. Total number of participants completing a TAACCCT-
funded program of study 12 6 40 2 148 41 200 49
2a. Total number of grant-funded program of study
completers who are incumbent workers 0 0 0 0 0 0 0 0
3. Total number of participants still retained in their
program of study or other TAACCCT-funded program 55 87 92 66 153 388 300 541
4. Total number retained in other education program(s) 0 0 0 2 0 3 0 5
5. Total number of credit hours completed 0 2,422 0 3,022 0 5,802 0 11,246
5a. Total number of students completing credit hours 67 80 103 135 168 218 337 433
6. Total number of earned credentials 12 6 98 2 144 41 254 49
6a. Total number of students earning certificates <1 year 0 6 0 1 0 14 0 21
6b. Total number of students earning certificates >1 year 0 0 0 0 0 0 0 0
6c. Total number of students earning degrees 0 0 0 1 0 27 0 28
7. Total number pursuing further education after program
of study completion 10 0 12 0 30 2 52 2
8. Total number employed after program of study
completion 10 6 32 0 140 13 182 19
9. Total number employed after retained in employment
after program of study completion 0 4 35 0 126 0 161 4
10. Total number of those employed at enrollment who
received a wage increase post-enrollment 25 2 28 0 40 56 93 58

18
New River staff also shared educational records (e.g., program of study, credentials earned,
GPA, etc.) with McREL evaluators to further evaluate the extent to which project outcomes are
met. Data was only available for 144 of the 372 participants (38.7%) since the evaluation team
needed signed permission from participants to collect such information.
According to education records, a total of 67 students have earned a certificate or degree at
New River. Although not all credentials earned fall beneath the umbrella of a TAACCCT-funded
program, it is worth noting that the 67 participants completed a total of 97 certificates or degrees.
There were 55 students who have completed a total of 58 degrees, with the majority of students
completing an associate’s degrees focused on physical therapy assistant (63.6%) or medical assisting
(30.9%). The remaining 5.5 percent of students completed an associate’s degree in technical studies
or board of governors. Additionally, 34 students have completed a total of 39 certificates. The
majority of students (67.6%) earned certificates in health professions, including medical assisting
(38.2%), physical therapy assistant (26.5%), and health information technology (2.9%) pathways,
followed by certifications in paramedic training (23.5%) and technical studies (23.5%).
Students’ average Grade Point Average (GPA) for each semester is a B average (3.00) or
higher, with the exception of Spring 2015 (2.31) and Fall 2015 (2.95), and students earned the
highest average GPA in Fall 2014 with 3.29. Overall, student’s cumulative average GPA is 2.91. Of
the students who were enrolled in each semester, the majority of them completed all attempted
credit hours. The lowest rates resulted in Fall 2012 (63.2%) and Spring 2013, and the highest rates
occurred in Fall 2014 (78.8%) and Spring 2016 (80.5%).
S2 To what extent does the New River TAACCCT serve a variety of individuals?
(Annual Report Template Section C)
The majority of New River participants were white, with an average age of 32 years.
Enrollment rates of veteran and WIA-TAA eligible students were low; however, there
were multiple Pell-Grant eligible participants.
Based on the available education records, McREL evaluators determined that the majority of
students identified as being both white in race (90.3%) and ethnicity (91.7%), with an average age of
31.6 years. A total of 39 participants were eligible for the Pell Grant (27.1%). However, New River
experienced low enrollment rates of WIA-TAA eligible and veteran participants.

19
S3 To what extent do participating and comparison students differ on education
and employment outcomes?
New River and Pierpont students had similar perceptions of many retention factors and
the extent to which they were likely to seek student support services. Comparison data
were limited and findings should be interpreted cautiously.
Since the New River TAACCCT project aimed to provide targeted training and workforce
development, students were asked the extent to which their program of study integrated information
and training related to their desired career. Overall, the vast majority of New River entrance survey
respondents were very confident that their coursework not only taught them the appropriate skills
and knowledge for their future careers (77.7%), but they were also very informed of the career path
they intend to pursue (58.8%). Students were strongly committed to pursuing a career in the allied
health field (94.7%), which they believed was highly likely due to the training they received (90.8%).
These specific findings indicate that New River students had positive perceptions of career
integration, which exists when students relate coursework in their program of study to the career
they hope to pursue upon receiving a degree. All responses to these items can be found in Table 6.
Table 6. Entrance Survey: New River Students’ Perceptions of Career Integration
Survey Item n
Very
Much Much
Some/
Neutral Little
Very
Little
How confident are you that the
career training you receive here will
give you the necessary knowledge and
skills?
130 77.7% 19.2% 3.1% -- --
How much do you know about the
duties and responsibilities of the
career and field in which you are
receiving training?
131 58.8% 31.3% 9.9% -- --
How committed are you to getting a
job in the field for which you are
training?
131 94.7% 3.1% 2.3% -- --
How likely is it that the training you
are receiving here will help you to get
the job you want?
131 90.8% 8.4% 0.8% -- --
New River exit survey respondents also believed they were highly likely to get the job they
want due to the training they received (86.2%), and they were very confident that the career training
gave them the necessary skills and knowledge (67.9%). The majority of exiting students were also
very knowledgeable about the career field in which they received training (69.0%) and very
committed to getting a job in their field of training (89.7%). Table 7 displays the exiting student
responses to the career integration items.

20
Table 7. Exit Survey: New River Students’ Perceptions of Career Integration
n
Very
Much Much Some Little
Very
Little
How likely is it that the training you
are receiving here will help you to get
the job you want?
29 86.2% 10.3% 3.4% -- --
A goal of education is to provide you
with what you need to know in order
to succeed in your future job. How
confident are you that the career
training you receive here will give you
the necessary knowledge and skills?
28 67.9% 25.0% 7.1% -- --
How much do you know about the
duties and responsibilities of the
career and field in which you are
receiving training?
29 69.0% 20.7% 10.3% -- --
How committed are you to getting a
job in the field for which you are
training?
29 89.7% 10.3% -- -- --
New River entrance and exit survey respondents reported that they were very satisfied with
their academic experience as a whole (79.2% and 55.2%, respectively), with the majority indicating
the instruction was of excellent (67.2% and 41.4%, respectively) or good (31.3% and 41.4%,
respectively) quality. Instructors and courses also made students feel as though they can complete
their work successfully (88.7%) at the beginning of the program.
Pierpont PTA students were very confident that the career training will give them the necessary
skills and knowledge to succeed in their future jobs, and they believe the training they received
would very likely help them get the job they want (100%, respectively). The majority of students
knew much or very much about the duties and responsibilities (28.6% and 33.3%, respectively), while
others knew little about the career and field in which they were training (38.1%). Pierpont students
were very committed to getting a job in their training area (100%). Similar to New River students,
Pierpont students had positive perceptions of career integration, as shown in Table 8.
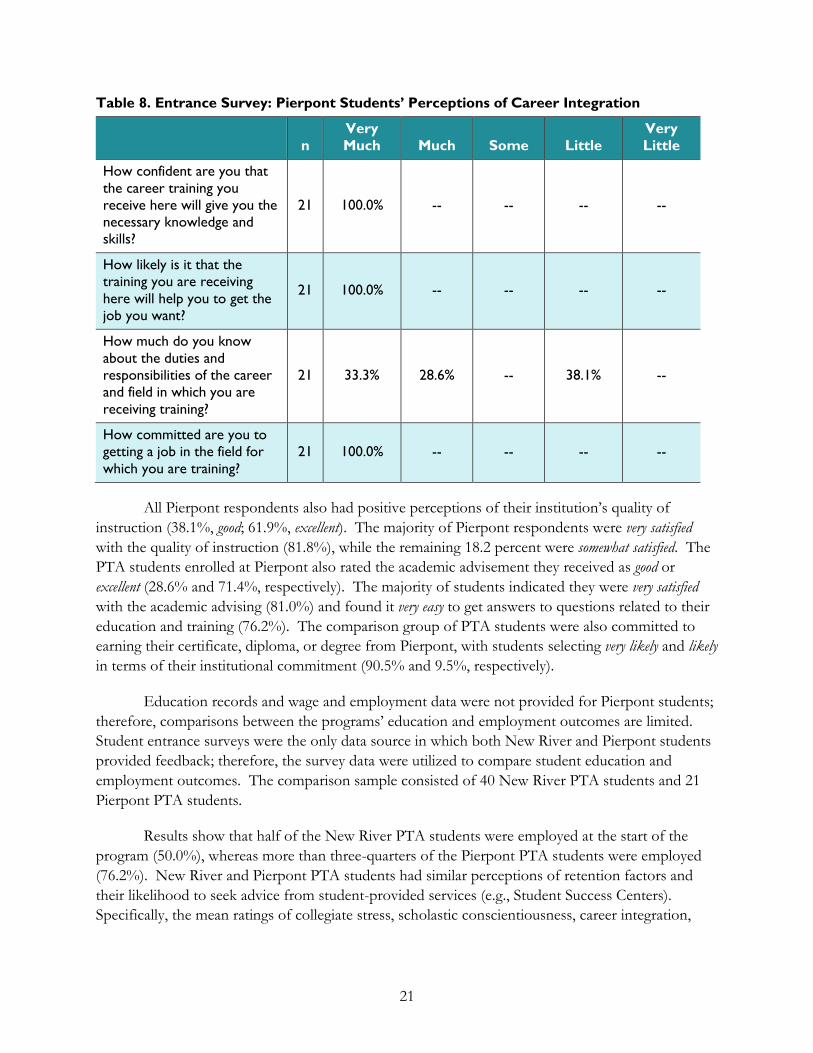
21
Table 8. Entrance Survey: Pierpont Students’ Perceptions of Career Integration
n
Very
Much Much Some Little
Very
Little
How confident are you that
the career training you
receive here will give you the
necessary knowledge and
skills?
21 100.0% -- -- -- --
How likely is it that the
training you are receiving
here will help you to get the
job you want?
21 100.0% -- -- -- --
How much do you know
about the duties and
responsibilities of the career
and field in which you are
receiving training?
21 33.3% 28.6% -- 38.1% --
How committed are you to
getting a job in the field for
which you are training?
21 100.0% -- -- -- --
All Pierpont respondents also had positive perceptions of their institution’s quality of
instruction (38.1%, good; 61.9%, excellent). The majority of Pierpont respondents were very satisfied
with the quality of instruction (81.8%), while the remaining 18.2 percent were somewhat satisfied. The
PTA students enrolled at Pierpont also rated the academic advisement they received as good or
excellent (28.6% and 71.4%, respectively). The majority of students indicated they were very satisfied
with the academic advising (81.0%) and found it very easy to get answers to questions related to their
education and training (76.2%). The comparison group of PTA students were also committed to
earning their certificate, diploma, or degree from Pierpont, with students selecting very likely and likely
in terms of their institutional commitment (90.5% and 9.5%, respectively).
Education records and wage and employment data were not provided for Pierpont students;
therefore, comparisons between the programs’ education and employment outcomes are limited.
Student entrance surveys were the only data source in which both New River and Pierpont students
provided feedback; therefore, the survey data were utilized to compare student education and
employment outcomes. The comparison sample consisted of 40 New River PTA students and 21
Pierpont PTA students.
Results show that half of the New River PTA students were employed at the start of the
program (50.0%), whereas more than three-quarters of the Pierpont PTA students were employed
(76.2%). New River and Pierpont PTA students had similar perceptions of retention factors and
their likelihood to seek advice from student-provided services (e.g., Student Success Centers).
Specifically, the mean ratings of collegiate stress, scholastic conscientiousness, career integration,

22
academic integration, academic effectiveness, and financial strain were not significantly different
between New River and Pierpont students (see Table 9).
Pierpont PTA students reported higher ratings of institutional commitment than New River
PTA students (t(48)= -8.26, p<0.001), in that Pierpont respondents were more likely than New
River respondents to earn their degree or certificate from their respective institution. Pierpont
students were more likely to utilize student support services for academic advising, career planning,
early intervention referrals, test proctoring, placement testing, and tutoring, whereas New River had
higher likelihood to pursue disability services and transfer advising. However, none of the
differences between the groups’ mean ratings were not statistically significant. The descriptive
statistics and results of the independent samples t-test for New River and Pierpont students are
displayed in Table 9.
Table 9. Participant v. Non-participant Perceptions of Retention Factors
New River Pierpont Independent Samples t-test
n M SD n M SD t DF p-value ES
Retention Factors
Collegiate Stress 40 2.95 0.96 21 2.95 0.80 -0.10 59 0.992 -0.03
Scholastic
Conscientiousness 38 4.92 0.27 16 5.00 0.00 1.70 26† 0.101
0.67
Career Integration 39 4.76 0.32 21 4.74 0.22 0.31 58 0.755 0.08
Academic Integration 39 4.62 0.44 21 4.71 0.34 -0.90 58 0.371 -0.24
Academic Effectiveness 40 4.53 0.45 21 4.75 0.36 -1.88 59 0.065 -0.49
Institutional
Commitment 40 3.28 1.18 21 4.90 0.30 -8.26 48† 0.000***
-2.39
Financial Strain 39 2.89 0.57 20 2.98 0.73 -0.45 57 0.656 -0.12
Student Support Services
Academic Advising 39 3.05 1.41 21 4.19 1.12 -1.04 59 0.303 -0.27
Career Planning 39 3.10 1.39 21 4.14 0.96 -1.01 59 0.316 -0.26
Disability Services 39 1.87 1.15 21 1.57 1.08 -0.63 59 0.529 -0.16
Early Intervention
Referrals 39 2.05 1.07 21 2.40 1.43 0.40 59 0.694
0.10
Test proctoring 39 2.13 1.20 21 2.95 1.56 -0.95 59 0.345 -0.25
Placement Testing 39 2.10 1.12 21 3.05 1.50 0.28 59 0.781 0.07
Transfer Advising 39 2.44 1.39 21 2.00 1.10 -0.60 59 0.554 -0.16
Tutoring 39 2.31 1.26 21 3.35 1.27 0.26 59 0.795 0.07

23
S4 To what extent do WIA-TAA and veteran students differ from other participating
students on education and employment outcomes?
New River had low enrollment rates of WIA-TAA and veteran students; therefore, effects
on education and employment outcomes cannot be accurately calculated.
Due to low enrollment numbers of WIA-TAA (n=2) and veteran (n=2) students, New River
enrollment numbers did not meet the minimum reporting sample size (n≥10). Therefore, the
evaluators cannot determine, with accuracy, the extent to which WIA-TAA and veteran students
differ from other participating students on education and employment outcomes.
S5 To what extent do the student support services (i.e., developmental education,
Student Success Center services) affect education and employment outcomes?
Students who accessed services from the Student Success Centers earned GPAs that were
slightly higher than those who did not seek support from the Centers.
Students were very satisfied with the academic support they received outside of the classroom
(58.6%) and somewhat satisfied with the services from the Student Success Centers (60.9%). Although
some did not rate their satisfaction in regard to the Virtual Career Network since the service was not
applicable to their experience (35.7%), others reported that they were neither satisfied or dissatisfied
(28.6%) or somewhat satisfied (25.0%) with the network. Entrance survey respondents indicated they
were most likely to seek academic advising (M=2.84, SD=1.36) and career planning (M=2.61,
SD=1.39), though the likelihood is still rather low. Overall, students reported they were unlikely to
utilize the Student Success Centers for advice and support across the services.
In Year 3, New River staff shared data on participants who have received SSC services. A
total of 24 counselors and SSC staff met with students to provide support services, with meetings
per staff member ranging from one to 2,114 (M = 308.13) in the project year. The SSC staff also
tracked the number of unique students served (i.e., each student was only counted once). The
unique student count ranged from one to 795 per staff member (M = 134.08). Between July and
September 2015, six staff members had anywhere from 31 to 338 meetings (M = 188) with an
average of 123 unique students per staff member. Overall, SSC staff averaged approximately 561
contact hours with students for the provision of support services during that timeframe.
Additionally, there were a total of 339 students enrolled in at least one foundational
education course during the grant life. There were a total of 188 in Foundational English, 134 of
whom passed (73.4%), and 312 in Foundational Math, 218 of whom passed (69.9%). Of the 339
Foundational students, wage and employment data as well as educational records were available for
60 participants (17.7%)6.
6 Wage and employment data, as well as educational records, were only available for participants who provided signed
permission to access their education and employment data.

24
Of the students for whom wage and employment data is available, approximately 60 percent
(n = 76) accessed at least one SSC service in Year 3, with the number of meetings ranging from one
to 13 (M = 3.7). The highest percentage of wage increases resulted between the second and third
quarters of 2015 (77%). Students who received services from the SSCs accounted for 79 percent of
the wage increases received across all students in the same quarter. The lowest percentage of
students who received SSC services and wage increases resulted between the third and fourth
quarter of 2014 (41.0%). Although, students who received SSC services represented half (50.0%) of
all students receiving wage increases in the same quarter. As for the effects from enrollment in
foundational education courses, the highest percentage of wage increases occurred between the third
and fourth quarters of 2015 (87.2%), while the lowest percentage of wage increases occurred
between the third and fourth quarters of 2014 (45.5%). Although participants earned wage increases
for 75 percent of the jobs held between the second and third quarters of 2015, it should be noted
that unemployment rates were also highest at this time. Specifically, 60 percent of participants were
unemployed in the third quarter of 2015. Wage increases by quarter are presented for SSC and
Foundational Education participants are shown in Table 10.
Table 10. Wage Increases by Quarter
SSC Foundational
Wage Increases by Quarter n Freq. %* n Freq. %*
Q3 2014 v. Q4 2014 76 25 41.0 52 15 45.5
Q4 2014 v. Q1 2015 75 39 63.9 51 23 65.7
Q1 2015 v. Q2 2015 75 39 61.9 51 27 65.9
Q2 2015 v. Q3 2015 76 26 76.5 52 15 75.0
Q3 2015 V. Q4 2015 -- -- -- 52 41 87.2
Q4 2015 v. Q1 2016 -- -- -- 59 27 56.3
Q2 2016 v. Q2 2016 -- -- -- 59 35 63.6
Noted: Data on those who accessed SSC services was not provided beyond Q3 2015.
*The sample size (n) and number of jobs are not equivalent; the percentage (%) of wage increases are determined by the
number of wage increases (Freq.) and number of total jobs.
Based on educational records, students who were enrolled in foundational education courses
(i.e., foundational students) tended to have lower GPAs than their “non-foundational” peers.
However, foundational students earned higher GPAs than non-foundational students (2.61 and 2.02,
respectively) in Spring 2015. Students who utilized the SSCs improved their GPAs over time,
increasing from 3.17 in Spring 2014 to 3.30 in Fall 2014, and outperformed their non-SSC peers
who saw a decrease from 3.18 to 2.86 during the same timeframe. The lowest average GPA for
both SSC and non-SSC students occurred in Spring 2015 (i.e., 1.96 and 2.07, respectively).

25
Overall, SSC students had an average cumulative GPA of 2.95, whereas non-SSC students’
average cumulative GPA was 2.797. Additionally, foundational students’ average cumulative GPA
was 2.83, and non-foundational students earned an average cumulative GPA of 2.97. All
comparisons are shown in Table 11.
Table 11. Student Support Recipients v. Non-recipients: Average GPA by Semester
SSC Non-SSC Foundational
Non-
Foundational
Average GPA by
Semester n GPA n GPA n GPA n GPA
Fall 2012 -- -- -- -- 24 3.08 14 3.27
Spring 2013 -- -- -- -- 26 3.01 22 3.22
Fall 2013 42 3.17 36 3.18 46 3.01 41 3.44
Spring 2014 54 3.11 39 2.86 52 2.94 57 3.22
Fall 2014 71 3.30 28 2.82 49 3.25 64 3.32
Spring 2015 65 1.96 10 2.07 45 2.61 46 2.02
Fall 2015 -- -- -- -- 31 2.54 27 3.41
Spring 2016 -- -- -- -- 22 2.88 19 3.54
Cumulative 71 2.95 46 2.79 60 2.83 83 2.97
Note: Fall 2012 and Spring 2013 are not included in the GPA by semester calculations since the non-SSC sample size (n) was
less than the minimum reporting requirement (n>10). Data related to those who access SSC services was not provided for Fall
2015 and Spring 2016.
7 Data on SSC and non-SSC students were not available in Year 4. Therefore, the cumulative GPA calculations are based on
data presented in September 2015.

26
Conclusions/Lessons Learned
The New River TAACCCT project had many successes during implementation. Although,
one area of concern is the lack of available data from the comparison site (Pierpont Community and
Technical College), which appeared to be due to a lack of commitment and willingness to participate
in this project. Based upon the data collected and analyzed, conclusions follow with
recommendations and lessons learned provided as bullet points in bold, orange font.
Overall, project staff reported that implementation has gone as planned and more efficiently
under the current grant management. Although modifications have occurred, New River
administrators and program directors expressed these changes were based on demand and outcome
research.
To maintain effective communication and implementation, New River should
continue to hold staff meetings and discuss the implementation progress and
improvement efforts.
Although SSC staff indicated that they have supplied a variety of student support services,
New River participants reported a low likelihood of seeking support from the centers in various
topic areas (i.e., academic advising, transfer advising, career planning, disability services, early
intervention referrals, placement testing, test proctoring, and tutoring). Students also indicated that
they often experience a high degree of financial stress and/or worry about maintaining their course
workload, which could be attributed to students working multiple jobs while they are pursuing these
educational opportunities.
Consider seeking or providing additional resources to students to help reduce the
financial strain associated with attending college.
Focus student-provided supports in areas that students are more likely to utilize
(i.e., academic advising, career planning, and tutoring).
Provide resources (e.g., guest lecturers and information via articles or blogs) or
incorporate financial and time management strategies into courses to teach
students how to alleviate stress.
The Student Entrance and Exit Surveys suggest that students are satisfied with the training
they received at New River and believe it will help them get a job they want; committed to getting a
job in the field for which they are training; confident that they will earn a certificate, diploma, or
degree from New River; and likely to finish whatever program they begin. Exiting students
expressed overall satisfaction with the advisement they received from New River staff.
Continue to monitor students’ satisfaction and performance to gain an
understanding of the progress being made in regards to implementation and
outcomes.
27
Examine individual Student Entrance Survey items to glean information about
students’ experiences with their program of study and the TAACCCT project.
Continue to provide the same quality of services to students.
Determine what factors may have caused the decline in students’ academic
performance during the Spring 2015 term.
Although New River staff and partners expressed satisfaction with their levels of
collaboration, there were some areas in which partners would like to be more involved. The
program directors stated that partners have been a vital aspect in the curricula design and internship
placement processes. However, partners reported low levels of involvement in participant
recruitment efforts, curriculum development, partnership support, and student support and
placement services. While the partners demonstrated having some involvement in subareas for each
of these categories, their overall involvement was rated as being low to moderate.
Consider establishing a subcommittee to engage partners in the grant activities
outside of their advisory council membership (e.g., assisting with recruitment
efforts, student support services, and partnership support).
Getting data sharing agreements established was an issue for the evaluation. This has taken
considerable time to address and, in some situations, data sharing agreements were still unable to be
established. More recently (June 2016) it was made known that other data sources are permissible
for reporting on the outcome indicators. It would have been ideal to have this information as
structures and processes were being established for data collection (i.e., Year 1 of a TAACCCT
grant).
Additionally, an expectation of TAACCCT evaluations was to employ either an experimental
or quasi-experimental design. Experimental designs were not permissible for TAACCCT
evaluations conducted due to the fact that grantees could not (colleges would not permit) random
selection of who could participate in the grant. Quasi-experimental designs were proposed in the
evaluation plan (e.g., comparison with students in similar programs at same college or students in
same programs at a non-TAACCCT college); however, this was not possible due to the challenges
posed in securing comparison sites or programs willing to participate.
For the most part, securing comparison site data was unachievable. There were, in turn,
limits in the type of data available for that comparison group and the meaningfulness of any
conclusions that could be drawn from an impact study. Specifically, there is a lack of data available
for comparison students, which inhibits evaluators in answering evaluation questions related to
students’ education and employment outcomes. Despite efforts to try various methods to secure
higher response rates (e.g., shortening the survey, using both paper and online, having advisors go to
classrooms to distribute the survey, etc.), response rates tended to be low.
In addition to the previously mentioned challenge of securing comparison site buy-in,
another barrier to potentially securing a higher response rate was not being allowed to use incentives

28
for comparison students or like colleges to collaborate with ongoing requests. Only one staff
member from the comparison site was willing to collect student survey data; as such, data received
from Pierpont’s PTA program students have been analyzed and included in this report. Given the
lack of commitment and collaboration from the comparison site, evaluators face a great number of
challenges in collecting comparison site data.
Administrators at New River established a sustainability plan for moving forward with key
components of the TAACCCT grant. Project staff also been met monthly throughout the year to
discuss updates or modifications that have been made to each program, determine the status of
implementation progress, and explore areas in need of improvement. New River should consider
utilizing this model in continuing to support the allied health programs as well as New River faculty,
staff and students.
Continue to communicate with each other about achievements within the
programs and components that should or should not be sustained once
TAACCCT grant funding ends.
29
References
Department of Labor. (2011). Trade Adjustment Assistance Community College and Career
Training (TAACCCT) Grant Program. Retrieved from http://www.doleta.gov/taaccct/
Ferguson, C. J. (2009). An effect size primer: A guide for clinicians and researchers. Professional
Psychology: Research and Practice, 4(38), 1-7. Retrieved from
http://psychology.okstate.edu/faculty/jgrice/psyc3214/AnEffectSizePrimer_2009.pdf.
Lipsey, M. W., Puzio, K., Yun, C., Hebert, M. A., Steinka-Fry, K., Cole, M. W., Roberts, M.,
Anthony, K. S., & Busick, M. D. (2012). Translating the statistical representation of the
effects of education interventions into more readily interpretable forms (NCSER 2013-
3000). Washington, DC: National Center for Special Education Research, Institute of
Education Sciences, U.S. Department of Education.
U.S. Department of Education. (2014). What Works Clearinghouse Procedures and Standards
Handbook, Ver. 3.0. Washington, DC: U.S. Department of Education, Institute of
Education Sciences, National Center for Education Evaluation and Regional Assistance,
What Works Clearinghouse. Retrieved from
http://ies.ed.gov/ncee/wwc/DocumentSum.aspx?sid=19
Appendix A
Appendix A. New River Entrance Survey and Data Tables

A-1
New River: Student Entrance Survey
Informed Consent
New River Community and Technical College:
Student Entrance Survey for Allied Health Programs
McREL International is evaluating a Trade Adjustment Assistance Community College and
Career Training (TAACCCT) grant awarded to New River Community and Technical College
(hereafter referred to as New River) by the U.S. Department of Labor (DOL). This grant is
being used to expand and improve career training programs in the field of allied health at
New River. The goal of the program is to help prepare participants for employment in high-
wage, high-skill occupations.
Purpose of the Survey: To determine the grant’s success, McREL is working with
New River and other community and technical colleges throughout the state to gather
information from individuals who are enrolled in allied health programs. Because you are
enrolled in one of the New River programs, we would like you to participate in this survey.
The survey includes questions about your decision to go to college and about your
perceptions, expectations, and experiences with college so far. It also asks about any
potential challenges or barriers you might face with regard to program completion and
persistence. This survey will take you about 15-25 minutes to finish.
Completion of the Survey: Completion of this survey is voluntary. You will be asked to
provide personally identifiable information such as your name, birthdate, or student ID
number in case evaluators need to match your information across multiple data collection
tools. We will not share your personal information in any summaries or reports and will
take care to protect your personal information. Information will be combined for all
individuals by program or subgroups and no one will be identified in any publications, such
as quarterly or annual reports, presentations, or journal articles.
Protecting Your Rights: There are no “right” or “wrong” answers for this survey. We just
want to hear about your college experiences. If you decide that you do not want to finish
taking the survey, you can stop at any time—even if you have already started. However,
your experiences and feedback are important; this information will be used to help improve
the quality and relevance of the allied health programs at New River and to measure the
success of the grant. There are no known risks associated with completing this survey
greater than those faced in daily life. But, you are granting permission for McREL, the DOL,
and The Urban Institute (the national grant evaluator) to have access to your personal
information. Please note that data files will be kept in a safe place during the study and
destroyed after the end of the study.
Questions: If you have questions about the grant evaluation, contact Karen Bumgardner
(project manager for the New River evaluation project) at 304-347-1841
([email protected]). For information on protection of your rights as a participant or
any additional Institutional Review Board issues, contact Howard Pitler at 303-632-5554
We appreciate your time and cooperation!

A-2
General Information
1. What is your student enrollment ID number?
2. In which program of study are you currently enrolled?
Medical Assisting
Medical Laboratory Technician
Paramedic-EMT
Physical Therapy Assistant
Registered Nurse
3. What is your name?
First Name Middle Initial Last Name
4. What is your birthdate (MM/DD/YYYY)?
5. What future educational outcomes do you expect to achieve? (Select all that
apply)
Do not plan to continue my education after leaving this school
Earn an associate’s degree
Earn a bachelor’s degree
Earn a master’s degree or higher
6. Are you currently employed?
Ο Not currently employed
Ο Employed part-time in the field of allied health
Ο Employed full-time in the field of allied health
Ο Employed part-time in a different field
Ο Employed full-time in a different field
7. Some organizations do not have to report employment and wage data to
Workforce West Virginia, the state’s workforce agency. Do you work for one
of the exempt agencies?
Ο I am unemployed.
Ο I am self-employed.
Ο I am employed with the railroad.
Ο I am employed with a faith-based agency or church.
Ο I do not work for an exempt organization.
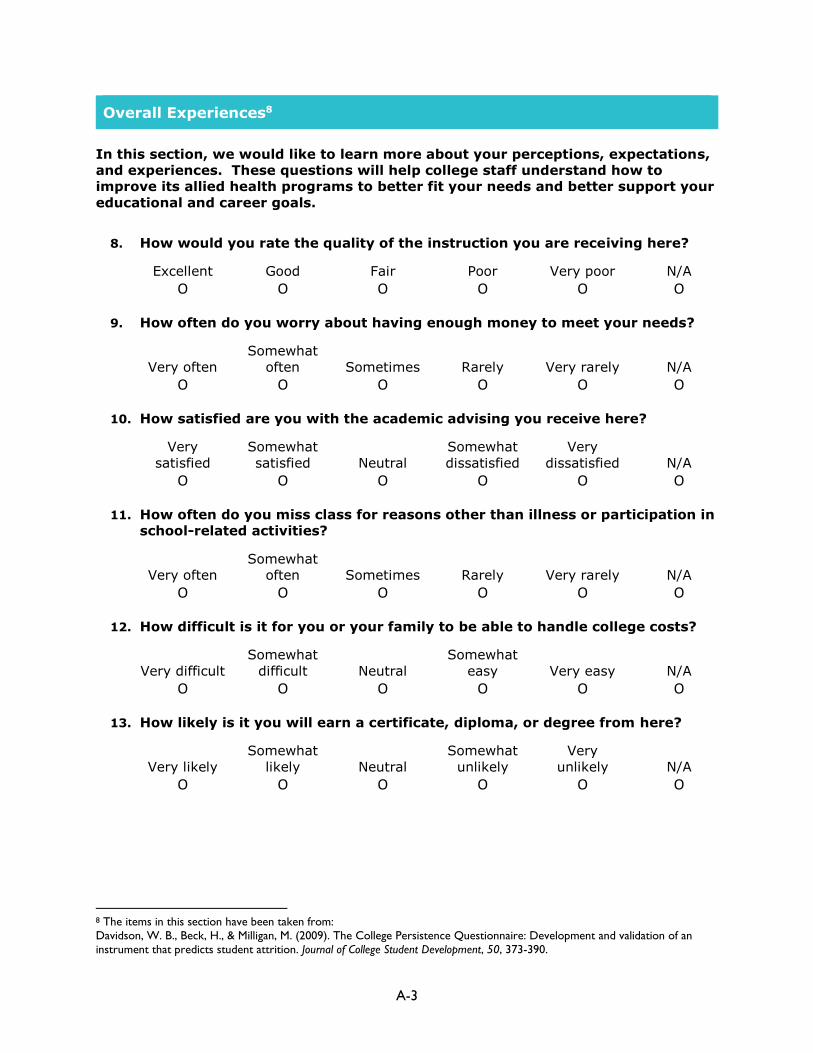
A-3
Overall Experiences8
In this section, we would like to learn more about your perceptions, expectations,
and experiences. These questions will help college staff understand how to
improve its allied health programs to better fit your needs and better support your
educational and career goals.
8. How would you rate the quality of the instruction you are receiving here?
Excellent
Ο
Good
Ο
Fair
Ο
Poor
Ο
Very poor
Ο
N/A
Ο
9. How often do you worry about having enough money to meet your needs?
Very often
Ο
Somewhat
often
Ο
Sometimes
Ο
Rarely
Ο
Very rarely
Ο
N/A
Ο
10. How satisfied are you with the academic advising you receive here?
Very
satisfied
Ο
Somewhat
satisfied
Ο
Neutral
Ο
Somewhat
dissatisfied
Ο
Very
dissatisfied
Ο
N/A
Ο
11. How often do you miss class for reasons other than illness or participation in
school-related activities?
Very often
Ο
Somewhat
often
Ο
Sometimes
Ο
Rarely
Ο
Very rarely
Ο
N/A
Ο
12. How difficult is it for you or your family to be able to handle college costs?
Very difficult
Ο
Somewhat
difficult
Ο
Neutral
Ο
Somewhat
easy
Ο
Very easy
Ο
N/A
Ο
13. How likely is it you will earn a certificate, diploma, or degree from here?
Very likely
Ο
Somewhat
likely
Ο
Neutral
Ο
Somewhat
unlikely
Ο
Very
unlikely
Ο
N/A
Ο
8 The items in this section have been taken from:
Davidson, W. B., Beck, H., & Milligan, M. (2009). The College Persistence Questionnaire: Development and validation of an
instrument that predicts student attrition. Journal of College Student Development, 50, 373-390.

A-4
14. How easy is it to get answers to your questions about things related to your
education and training here?
Very easy
Ο
Somewhat
easy
Ο
Neutral
Ο
Somewhat
hard
Ο
Very hard
Ο
N/A
Ο
15. In general, how satisfied are you with the quality of instruction you are
receiving here?
Very
satisfied
Ο
Somewhat
satisfied
Ο
Neutral
Ο
Somewhat
dissatisfied
Ο
Very
dissatisfied
Ο
N/A
Ο
16. When considering the financial costs of being in college, how often do you
feel unable to do things that other students here can afford to do?
Very often
Ο
Somewhat
often
Ο
Sometimes
Ο
Rarely
Ο
Very rarely
Ο
N/A
Ο
17. How often do you feel overwhelmed by the academic workload here?
Very often
Ο
Somewhat
often
Ο
Sometimes
Ο
Rarely
Ο
Very rarely
Ο
N/A
Ο
18. How would you rate the academic advisement you receive here?
Excellent
Ο
Good
Ο
Fair
Ο
Poor
Ο
Very poor
Ο
N/A
Ο
19. How much of a financial strain is it for you to purchase the essential
resources you need for courses such as books and supplies?
A very large
strain
Ο
Somewhat
of a strain
Ο
Neutral
Ο
A little
strain
Ο
Hardly any
strain at all
Ο
N/A
Ο
20. How likely is it that the training you are receiving here will help you to get
the job you want?
Very likely
Ο
Somewhat
likely
Ο
Neutral
Ο
Somewhat
unlikely
Ο
Very
unlikely
Ο
N/A
Ο

A-5
21. A goal of education is to provide you with what you need to know in order to
succeed in your future job. How confident are you that the career training
you receive here will give you the necessary knowledge and skills?
Very
confident
Ο
Somewhat
confident
Ο
Neutral
Ο
Somewhat
unconfident
Ο
Very
unconfident
Ο
N/A
Ο
22. How much do you know about the duties and responsibilities of the career
and field in which you are receiving training?
Very much
Ο
Much
Ο
Some
Ο
Little
Ο
Very little
Ο
N/A
Ο
23. How committed are you to getting a job in the field for which you are
training?
Very
committed
Ο
Somewhat
committed
Ο
Neutral
Ο
Somewhat
uncommitted
Ο
Very
uncommitted
Ο
N/A
Ο
Additional Information
24. What is the most motivating factor for you to complete this degree program?
25. What is the biggest barrier that you think you are going to face in completing
this degree program?
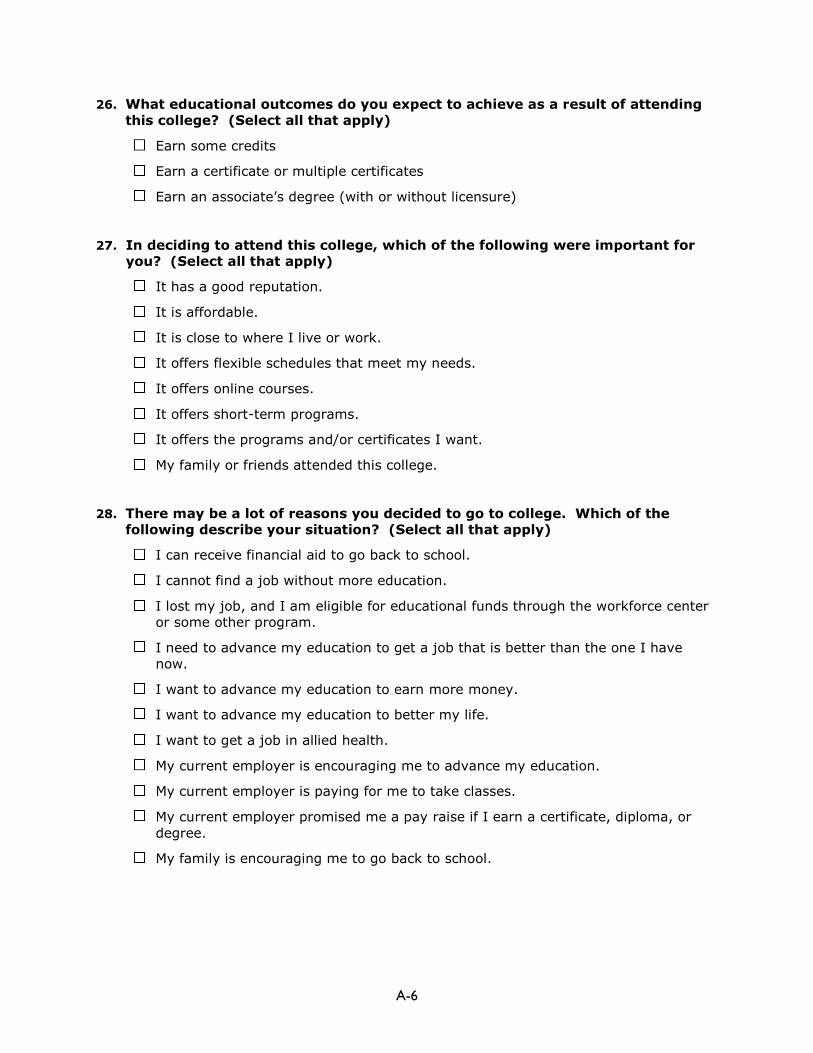
A-6
26. What educational outcomes do you expect to achieve as a result of attending
this college? (Select all that apply)
Earn some credits
Earn a certificate or multiple certificates
Earn an associate’s degree (with or without licensure)
27. In deciding to attend this college, which of the following were important for
you? (Select all that apply)
It has a good reputation.
It is affordable.
It is close to where I live or work.
It offers flexible schedules that meet my needs.
It offers online courses.
It offers short-term programs.
It offers the programs and/or certificates I want.
My family or friends attended this college.
28. There may be a lot of reasons you decided to go to college. Which of the
following describe your situation? (Select all that apply)
I can receive financial aid to go back to school.
I cannot find a job without more education.
I lost my job, and I am eligible for educational funds through the workforce center
or some other program.
I need to advance my education to get a job that is better than the one I have
now.
I want to advance my education to earn more money.
I want to advance my education to better my life.
I want to get a job in allied health.
My current employer is encouraging me to advance my education.
My current employer is paying for me to take classes.
My current employer promised me a pay raise if I earn a certificate, diploma, or
degree.
My family is encouraging me to go back to school.

A-7
29. Which of the following financial resources are you currently receiving to assist
with your education expenses? (Select all that apply)
Employer paid
Grants
Loans
Scholarships
Veteran’s benefits
Work on campus
Other
30. How supportive is your family of your decision to continue your education?
Ο Very supportive
Ο Somewhat supportive
Ο Neutral
Ο Somewhat unsupportive
Ο Very unsupportive
31. To what extent do you struggle with securing support or resources for child
care so that you can attend classes?
Ο I do not have children.
Ο Child care is never an issue for me.
Ο Child care is rarely an issue for me.
Ο Child care is sometimes an issue for me.
Ο Child care is always an issue for me.
32. To what extent do you struggle with securing transportation to school?
Ο Transportation is never a struggle for me.
Ο Transportation is rarely a struggle for me.
Ο Transportation is sometimes a struggle for me.
Ο Transportation is always a struggle for me.

A-8
Student Success Centers
33. How likely is it that you will go to the Student Success Center for advice and
support on the following areas?
Topic Area
Very
Unlikely
Somewhat
Unlikely Neutral
Somewhat
Likely
Very
Likely
Academic advising
Transfer advising
Career planning
Disability services
Early intervention referrals
Placement testing
Test proctoring
Tutoring
Thank you for completing this survey!
We appreciate your time and assistance!

A-9
New River: Participating Students’ Education and
Employment Outcomes
Table A-1. Student Entrance Survey: Background Information
Background n %*
What future educational outcomes do you expect to achieve? (Select all that apply**)
Do not plan to continue my education after leaving this school 15 18.6%
Earn an associate’s degree 77 59.7%
Earn a bachelor’s degree 32 24.8%
Earn a master’s degree or higher 22 17.1%
Are you currently employed?
Not currently employed 47 35.9%
Employed part-time in the field of allied health 9 6.9%
Employed full-time in the field of allied health 37 28.2%
Employed part-time in a different field 26 19.8%
Employed full-time in a different field 12 9.2%
*Missing values are not included in the percentage (i.e., valid percentage).
**Percentages may not equal 100 since respondents (n =129) can select all that apply.
Table A-2. Student Entrance Survey: Participating Students’ Perceptions of Retention
Factors
n N/A
Very
Much Much
Some/
Neutral Little
Very
Little
Collegiate Stress
How often do you feel
overwhelmed by the academic workload here?
130 -- 6.2% 19.2% 47.7% 18.5% 8.5%
How much pressure do you
feel when trying to meet
deadlines for course assignments?*
62 -- 16.1% 33.9% 37.1% 6.5% 6.5%
Students differ quite a lot in
how distressed they get over
various aspects of college life.
Overall, how much stress
would you say that you
experience while attending this
institution?*
62 -- 17.7% 32.3% 40.3% 6.5% 3.2%
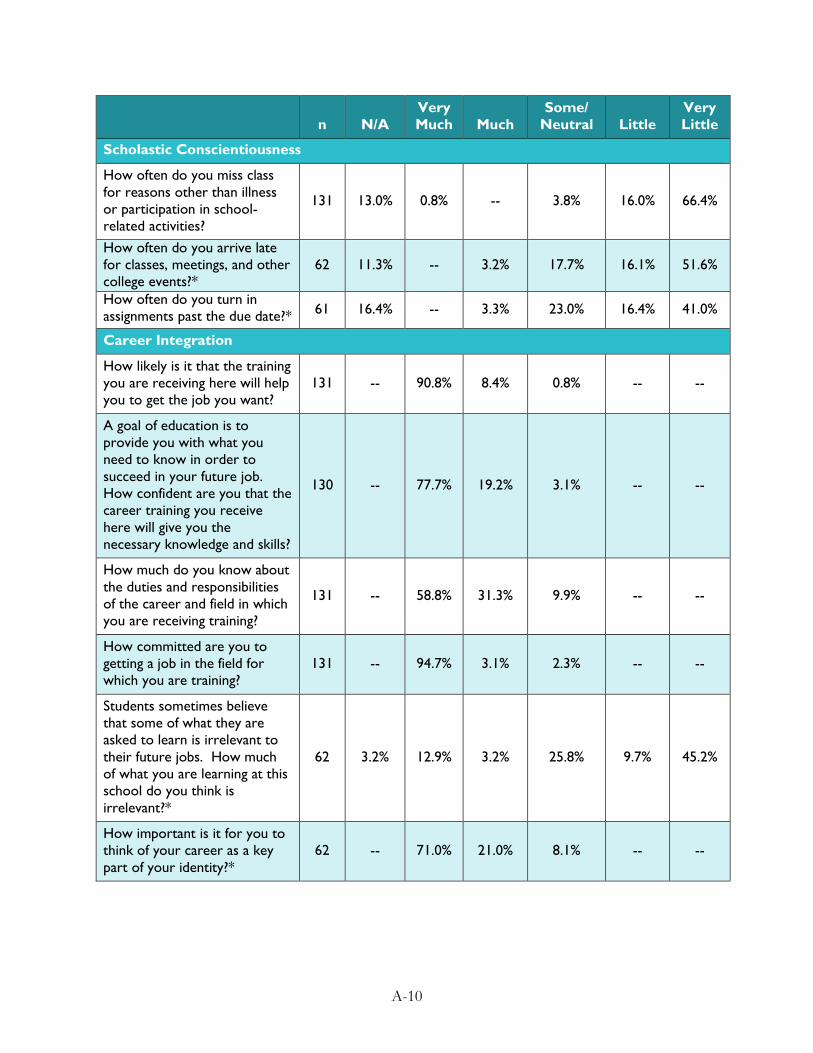
A-10
n N/A
Very
Much Much
Some/
Neutral Little
Very
Little
Scholastic Conscientiousness
How often do you miss class
for reasons other than illness
or participation in school-
related activities?
131 13.0% 0.8% -- 3.8% 16.0% 66.4%
How often do you arrive late
for classes, meetings, and other
college events?*
62 11.3% -- 3.2% 17.7% 16.1% 51.6%
How often do you turn in
assignments past the due date?* 61 16.4% -- 3.3% 23.0% 16.4% 41.0%
Career Integration
How likely is it that the training
you are receiving here will help
you to get the job you want?
131 -- 90.8% 8.4% 0.8% -- --
A goal of education is to
provide you with what you
need to know in order to
succeed in your future job.
How confident are you that the
career training you receive
here will give you the
necessary knowledge and skills?
130 -- 77.7% 19.2% 3.1% -- --
How much do you know about
the duties and responsibilities
of the career and field in which
you are receiving training?
131 -- 58.8% 31.3% 9.9% -- --
How committed are you to
getting a job in the field for
which you are training?
131 -- 94.7% 3.1% 2.3% -- --
Students sometimes believe
that some of what they are
asked to learn is irrelevant to
their future jobs. How much
of what you are learning at this
school do you think is
irrelevant?*
62 3.2% 12.9% 3.2% 25.8% 9.7% 45.2%
How important is it for you to
think of your career as a key
part of your identity?*
62 -- 71.0% 21.0% 8.1% -- --

A-11
n N/A
Very
Much Much
Some/
Neutral Little
Very
Little
Academic Integration
How would you rate the
quality of the instruction you
are receiving here?
131 -- 67.2% 31.3% 1.5% -- --
In general, how satisfied are
you with the quality of
instruction you are receiving
here?
130 -- 79.2% 16.2% 3.1% 0.8% 0.8%
How much do the instructors
and the courses make you feel
like you can do the work
successfully?*
62 -- 54.8% 33.9% 8.1% 3.2% --
Academic Effectiveness
How satisfied are you with the
academic advising you receive
here?
131 -- 59.5% 31.3% 7.6% -- 1.5%
How easy is it to get answers
to your questions about things
related to your education and
training here?
131 0.8% 3.8% -- 8.4% 31.3% 55.7%
How would you rate the
academic advisement you
receive here?
131 1.5% 47.3% 40.5% 9.2% 1.5% --
Institutional Commitment
How likely is it you will earn a
certificate, diploma, or degree
from here?
131 -- 81.7% 15.3% 0.8% -- 2.3%
How confident are you that
this is the right college or
university for you?
62 -- 46.8% 24.2% 25.8% 3.2% --
How much thought have you
given to stopping your
education here (perhaps
transferring to another college,
going to work, or leaving for
other reasons)?
62 12.9% 3.2% 25.8% 11.3% 12.9% 33.9%
How likely is it that you will re-
enroll here next semester? 62 -- 80.6% 6.5% 8.1% 1.6% 3.2%

A-12
n N/A
Very
Much Much
Some/
Neutral Little
Very
Little
Financial Strain
How often do you worry about
having enough money to meet
your needs? 131 -- 35.1% 22.9% 31.3% 8.4% 2.3%
How difficult is it for you or
your family to be able to handle
college costs?
130 3.8% 23.1% 34.6% 27.7% 4.6% 6.2%
When considering the financial
costs of being in college, how
often do you feel unable to do
things that other students here
can afford to do?
131 3.1% 15.3% 22.1% 29.8% 20.6% 9.2%
How much of a financial strain
is it for you to purchase the
essential resources you need
for courses such as books and
supplies?
130 1.5% 26.2% 30.8% 23.1% 8.5% 10.0%
Table A-3. Student Entrance Survey: Additional Information
n %
What educational outcomes do you expect to achieve as a result of attending your
current college? (Select all that apply*)
Earn some credits 16 12.2%
Earn a certificate or multiple certificates 53 40.5%
Earn an associate’s degree (with or without licensure) 106 80.9%
In deciding to attend this college, which of the following were important for you?
(Select all that apply*)
It has a good reputation. 50 38.2%
It is affordable. 85 64.9%
It is close to where I live or work. 97 74.0%
It offers flexible schedules that meet my needs. 63 48.1%
It offers online courses. 43 32.8%
It offers short-term programs. 40 30.5%
It offers the programs and/or certificates I want. 116 88.5%
My family or friends attended this college. 25 19.1%
There may be a lot of reasons you decided to go back to college. Which of the following
describe your situation? (Select all that apply*)
I can receive financial aid to go back to school. 47 35.9%
I cannot find a job without more education. 26 19.8%

A-13
n %
I lost my job, and I am eligible for educational funds through the
workforce center or some other program. 7 5.3%
I need to advance my education to get a job that is better than the one
I have now. 73 55.7%
I want to advance my education to earn more money. 96 73.3%
I want to advance my education to better my life. 115 87.8%
I want to get a job in allied health. 58 44.3%
My current employer is encouraging me to advance my education. 16 12.2%
My current employer is paying for me to take classes. 2 1.5%
My current employer promised me a pay raise if I earn a certificate,
diploma, or degree. 11 8.4%
My family is encouraging me to go back to school. 50 38.2%
Which of the following financial resources are you currently receiving to assist with your
education expenses? (Select all that apply*)
Employer paid 2 1.5%
Grants 76 58.0%
Loans 55 42.0%
Scholarships 10 7.6%
Veteran’s benefits 8 6.1%
Work on campus 2 1.5%
Other 35 26.7%
What is your current living arrangement?
Government-assisted housing 2 3.3%
Owned house/apartment 23 37.7%
Parents’ house 20 32.8%
Rental house/apartment 14 23.0%
Other 2 3.3%
How supportive is your family of your decision to continue your education?
Very unsupportive 0 --
Somewhat unsupportive 3 2.3%
Neutral 8 6.1%
Somewhat supportive 14 10.7%
Very supportive 106 80.9%
To what extent do you struggle with securing support or resources for child care so that
you can attend classes?
I do not have children. 67 51.1%
Child care is never an issue for me. 18 13.7%
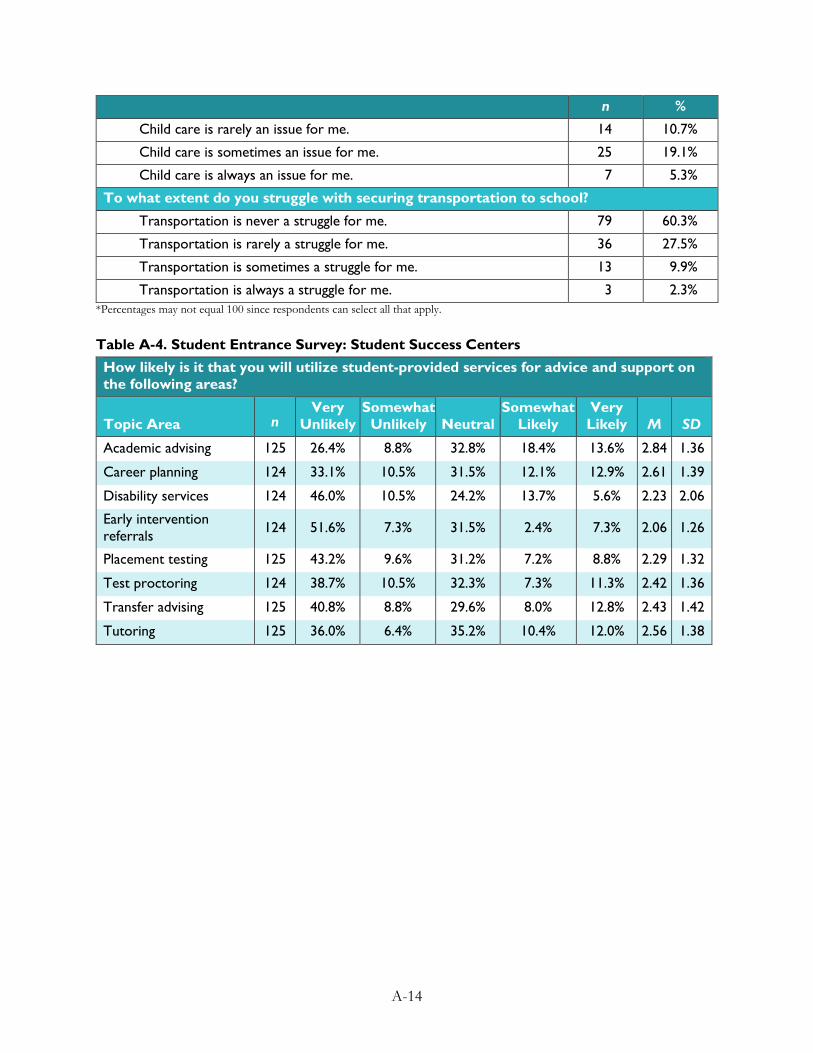
A-14
n %
Child care is rarely an issue for me. 14 10.7%
Child care is sometimes an issue for me. 25 19.1%
Child care is always an issue for me. 7 5.3%
To what extent do you struggle with securing transportation to school?
Transportation is never a struggle for me. 79 60.3%
Transportation is rarely a struggle for me. 36 27.5%
Transportation is sometimes a struggle for me. 13 9.9%
Transportation is always a struggle for me. 3 2.3%
*Percentages may not equal 100 since respondents can select all that apply.
Table A-4. Student Entrance Survey: Student Success Centers
How likely is it that you will utilize student-provided services for advice and support on
the following areas?
Topic Area n Very
Unlikely
Somewhat
Unlikely Neutral
Somewhat
Likely
Very
Likely M SD
Academic advising 125 26.4% 8.8% 32.8% 18.4% 13.6% 2.84 1.36
Career planning 124 33.1% 10.5% 31.5% 12.1% 12.9% 2.61 1.39
Disability services 124 46.0% 10.5% 24.2% 13.7% 5.6% 2.23 2.06
Early intervention
referrals 124 51.6% 7.3% 31.5% 2.4% 7.3% 2.06 1.26
Placement testing 125 43.2% 9.6% 31.2% 7.2% 8.8% 2.29 1.32
Test proctoring 124 38.7% 10.5% 32.3% 7.3% 11.3% 2.42 1.36
Transfer advising 125 40.8% 8.8% 29.6% 8.0% 12.8% 2.43 1.42
Tutoring 125 36.0% 6.4% 35.2% 10.4% 12.0% 2.56 1.38

Appendix B
Appendix B. New River Exit Survey and Data Tables

B-1
Participating Students’ Education and Employment Outcomes
Table B-1. Student Exit Survey: Background Information
Background n %
What future educational outcomes do you expect to achieve? (Select all that apply)
Do not plan to continue my education after leaving this school 11 37.9%
Earn an associate’s degree 10 34.5%
Earn a bachelor’s degree 12 41.4%
Earn a master’s degree or higher 5 17.2%
Are you currently employed?
Not currently employed 17 58.6%
Employed part-time in the field of allied health 0 --
Employed full-time in the field of allied health 0 --
Employed part-time in a different field 8 27.6%
Employed full-time in a different field 4 13.8%
Table B-2. Student Exit Survey: Participating Students’ Perceptions of Retention Factors
n N/A
Very
Much Much Some Little
Very
Little
Collegiate Stress
How often do you feel overwhelmed
by the academic workload here? 29 -- 6.9% 13.8% 44.8% 24.1% 10.3%
Scholastic Conscientiousness
How often do you miss class for
reasons other than illness or
participation in school-related
activities?
30 13.3% -- -- 6.7% 6.7% 73.3%
Career Integration
How likely is it that the training you are
receiving here will help you to get the
job you want?
29 -- 86.2% 10.3% 3.4% -- --
A goal of education is to provide you
with what you need to know in order
to succeed in your future job. How
confident are you that the career
training you receive here will give you
the necessary knowledge and skills?
28 -- 67.9% 25.0% 7.1% -- --
How much do you know about the
duties and responsibilities of the career
and field in which you are receiving
training?
29 -- 69.0% 20.7% 10.3% -- --

B-2
n N/A
Very
Much Much Some Little
Very
Little
How committed are you to getting a
job in the field for which you are
training?
29 -- 89.7% 10.3% -- -- --
Academic Integration
How would you rate the quality of the
instruction you are receiving here? 29 -- 41.4% 41.4% 13.8% -- 3.4%
In general, how satisfied are you with
the quality of instruction you are
receiving here?
29 -- 55.2% 24.1% 13.8% 3.4% 3.4%
Academic Effectiveness
How satisfied are you with the
academic advising you receive here? 29 -- 58.6% 13.8% 24.1% 3.4% --
How easy is it to get answers to your
questions about things related to your
education and training here?
29 -- 51.7% 20.7% 24.1% 3.4% --
How would you rate the academic
advisement you receive here? 29 -- 51.7% 27.6% 20.7% -- --
Institutional Commitment
How likely is it you will earn a
certificate, diploma, or degree from
here?
29 -- 96.6% 3.4% -- -- --
Financial Strain
How often do you worry about having
enough money to meet your needs? 29 -- 17.2% 31.0% 37.9% 6.9% 6.9%
How difficult is it for you or your family
to be able to handle college costs? 28 -- 21.4% 28.6% 35.7% 7.1% 7.1%
When considering the financial costs of
being in college, how often do you feel
unable to do things that other students
here can afford to do?
29 -- 6.9% 20.7% 31.0% 17.2% 24.1%
How much of a financial strain is it for
you to purchase the essential resources
you need for courses such as books
and supplies?
29 -- 13.8% 24.1% 34.5% 10.3% 17.2%

B-3
Table B-3. Student Exit Survey: Program Quality
Program Quality n Extensively Greatly Somewhat
Very
Little Not at All
To what extent did your
training program provide a
technology-rich
environment that
facilitated your learning
experience?
29 24.1% 48.3% 24.1% 3.4% --
To what extent did your
training program provide
state-of-the-art lab
equipment that prepared
you to be competitive in the
job market?
29 17.2% 34.5% 34.5% 3.4% 10.3%
To what extent did your
training program provide
opportunities for you to
build a network of
professional contacts?
29 34.5% 37.9% 20.7% 3.4% 3.4%
To what extent did your
training program provide
opportunities specifically to
network, connect, or
interact with potential
employers?
29 31.0% 27.6% 31.0% 10.3% --
n Excellent Good Fair Poor
Very
Poor
Overall, how would you
rate the quality of your
training program?
29 48.3% 41.4% 10.3% -- --
n
Very
Satisfied
Somew
hat
Satisfie
d
Neutral
Somew
hat
Dissatis
fied
Very
Dissatisfie
d
Overall, how satisfied are
you with your training
program?
29 69.0% 20.7% 10.3% -- --
n
Very
Likely Likely Neutral
Unlikel
y
Very
Unlikely
How likely are you to
recommend your training
program to your friends and
prospective students?
29 62.1% 24.1% 10.3% 3.4% --

B-4
Table B-4. Student Exit Survey: Student Success Center Experiences
SSC
Experiences n
N/A Very
Useful
Somewhat
Useful Neutral
Not Very
Useful
Not at All
Useful
How useful was
your individual
learning plan? 29 27.6% 31.0% 24.1% 17.2% -- --
n
Did Not
Respond Extensively Greatly Neutral Very Little Not At All
To what extent
did you use the
Virtual Career
Network
available through
the New River
portal?
29 -- 3.4% 13.8% 34.5% 13.8% 34.5%
n N/A
Very
Satisfied
Somewhat
Satisfied Neutral
Somewhat
Dissatisfied
Very
Dissatisfied
How satisfied
were you with
the academic
support from
faculty/
instructors/
advisors that you
received outside
of the classroom?
29 3.4% 58.6% 20.7% 17.2% -- --
How satisfied
were you with
the Virtual
Career
Network
available through
New River
Portal?
28 35.7% 10.7% 25.0% 28.6% -- --
How satisfied
were you with
the services you
received from
the Student
Success
Center?
28 -- 13.0% 21.7% 60.9% -- 4.3%

Appendix C
Appendix C. Pierpont Entrance Survey and Data Tables

C-1
Pierpont Entrance Survey
Informed Consent
Pierpont Community and Technical College:
Student Entrance Survey for Allied Health Programs
McREL International is evaluating a Trade Adjustment Assistance Community College and
Career Training (TAACCCT) grant awarded to New River Community and Technical College
(hereafter referred to as New River) by the U.S. Department of Labor (DOL). This grant is
being used to expand and improve career training programs in the field of allied health at
New River. Pierpont Community and Technical College (hereafter referred to as Pierpont)
has agreed to serve as a comparison group for various programs (i.e., Paramedic-EMT,
Physical Therapist Assistant, and possibly Medical Laboratory Technician).
Purpose of the Survey: To determine the grant’s success, McREL is working with
New River and other community and technical colleges throughout the state (like Pierpont)
to gather information from individuals who are enrolled in allied health programs. Because
you are enrolled in one of the Pierpont programs, we would like you to participate in this
survey. The survey includes questions about your decision to go to college and about your
perceptions, expectations, and experiences with college so far. It also asks about any
potential challenges or barriers you might face with regard to program completion and
persistence. This survey will take you about 15-25 minutes to finish.
Completion of the Survey: Completion of this survey is voluntary. You will be asked to
provide personally identifiable information such as your name, birthdate, or student ID
number in case evaluators need to match your information across multiple data collection
tools. We will not share your personal information in any summaries or reports and will
take care to protect your personal information. Information will be combined for all
individuals by program or subgroups and no one will be identified in any publications, such
as quarterly or annual reports, presentations, or journal articles.
Protecting Your Rights: There are no “right” or “wrong” answers for this survey. We just
want to hear about your college experiences. If you decide that you do not want to finish
taking the survey, you can stop at any time—even if you have already started. However,
your experiences and feedback are important to us. There are no known risks associated
with completing this survey greater than those faced in daily life. But, you are granting
permission for McREL, the DOL, and The Urban Institute (the national grant evaluator) to
have access to your personal information. Please note that data files will be kept in a safe
place during the study and destroyed after the end of the study.
Questions: If you have questions about the grant evaluation, contact Karen Bumgardner
(project manager for the New River evaluation project) at 304-347-1841
([email protected]). For information on protection of your rights as a participant or
any additional Institutional Review Board issues, contact Howard Pitler at 303-632-5554
We appreciate your time and cooperation!
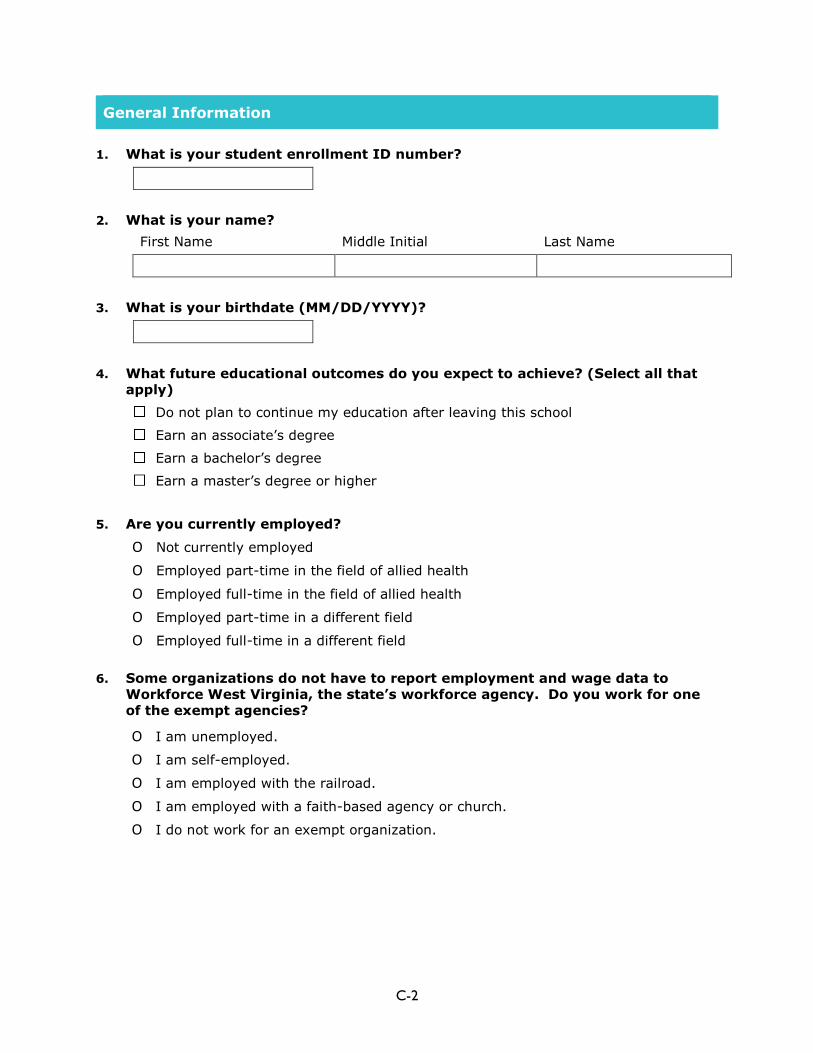
C-2
General Information
1. What is your student enrollment ID number?
2. What is your name?
First Name Middle Initial Last Name
3. What is your birthdate (MM/DD/YYYY)?
4. What future educational outcomes do you expect to achieve? (Select all that
apply)
Do not plan to continue my education after leaving this school
Earn an associate’s degree
Earn a bachelor’s degree
Earn a master’s degree or higher
5. Are you currently employed?
Ο Not currently employed
Ο Employed part-time in the field of allied health
Ο Employed full-time in the field of allied health
Ο Employed part-time in a different field
Ο Employed full-time in a different field
6. Some organizations do not have to report employment and wage data to
Workforce West Virginia, the state’s workforce agency. Do you work for one
of the exempt agencies?
Ο I am unemployed.
Ο I am self-employed.
Ο I am employed with the railroad.
Ο I am employed with a faith-based agency or church.
Ο I do not work for an exempt organization.

C-3
Overall Experiences9
In this section, we would like to learn more about your perceptions, expectations,
and experiences. These questions will help McREL staff understand how the allied
health programs fit your needs and support your educational and career goals.
7. How would you rate the quality of the instruction you are receiving here?
Excellent
Ο
Good
Ο
Fair
Ο
Poor
Ο
Very poor
Ο
N/A
Ο
8. How often do you worry about having enough money to meet your needs?
Very often
Ο
Somewhat
often
Ο
Sometimes
Ο
Rarely
Ο
Very rarely
Ο
N/A
Ο
9. How satisfied are you with the academic advising you receive here?
Very
satisfied
Ο
Somewhat
satisfied
Ο
Neutral
Ο
Somewhat
dissatisfied
Ο
Very
dissatisfied
Ο
N/A
Ο
10. How often do you miss class for reasons other than illness or participation in
school-related activities?
Very often
Ο
Somewhat
often
Ο
Sometimes
Ο
Rarely
Ο
Very rarely
Ο
N/A
Ο
11. How difficult is it for you or your family to be able to handle college costs?
Very difficult
Ο
Somewhat
difficult
Ο
Neutral
Ο
Somewhat
easy
Ο
Very easy
Ο
N/A
Ο
12. How likely is it you will earn a certificate, diploma, or degree from here?
Very likely
Ο
Somewhat
likely
Ο
Neutral
Ο
Somewhat
unlikely
Ο
Very
unlikely
Ο
N/A
Ο
9 The items in this section have been taken from:
Davidson, W. B., Beck, H., & Milligan, M. (2009). The College Persistence Questionnaire: Development and validation of an
instrument that predicts student attrition. Journal of College Student Development, 50, 373-390.
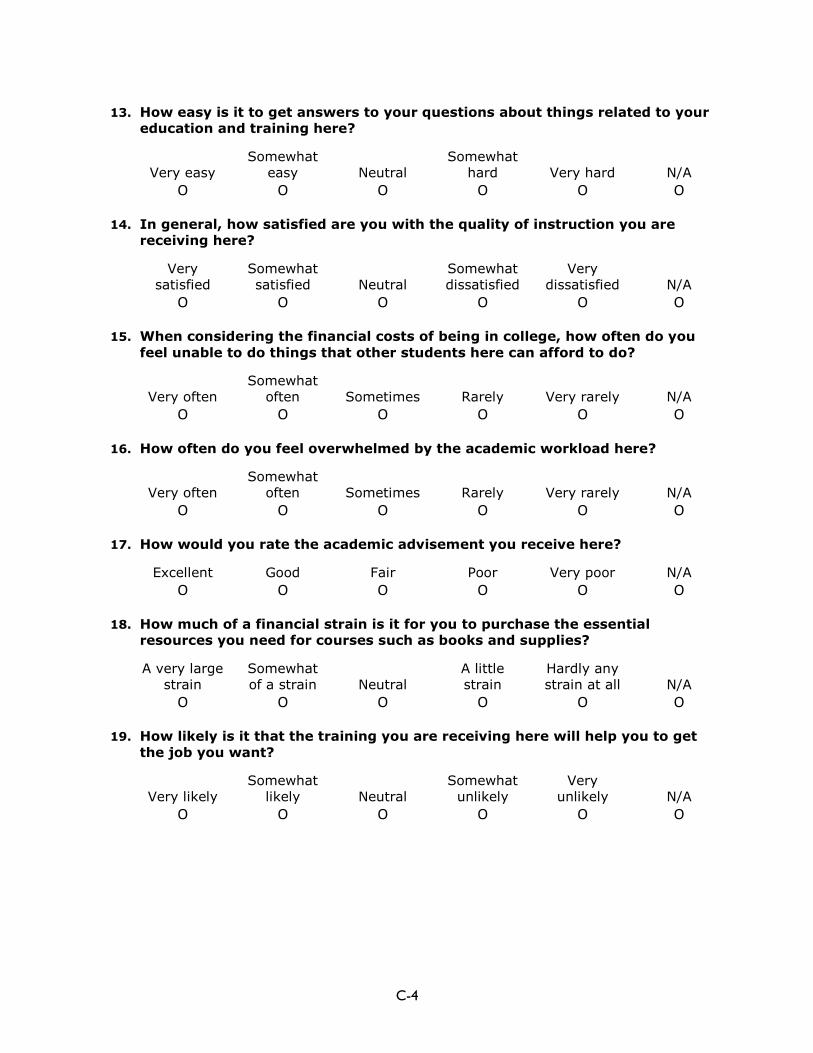
C-4
13. How easy is it to get answers to your questions about things related to your
education and training here?
Very easy
Ο
Somewhat
easy
Ο
Neutral
Ο
Somewhat
hard
Ο
Very hard
Ο
N/A
Ο
14. In general, how satisfied are you with the quality of instruction you are
receiving here?
Very
satisfied
Ο
Somewhat
satisfied
Ο
Neutral
Ο
Somewhat
dissatisfied
Ο
Very
dissatisfied
Ο
N/A
Ο
15. When considering the financial costs of being in college, how often do you
feel unable to do things that other students here can afford to do?
Very often
Ο
Somewhat
often
Ο
Sometimes
Ο
Rarely
Ο
Very rarely
Ο
N/A
Ο
16. How often do you feel overwhelmed by the academic workload here?
Very often
Ο
Somewhat
often
Ο
Sometimes
Ο
Rarely
Ο
Very rarely
Ο
N/A
Ο
17. How would you rate the academic advisement you receive here?
Excellent
Ο
Good
Ο
Fair
Ο
Poor
Ο
Very poor
Ο
N/A
Ο
18. How much of a financial strain is it for you to purchase the essential
resources you need for courses such as books and supplies?
A very large
strain
Ο
Somewhat
of a strain
Ο
Neutral
Ο
A little
strain
Ο
Hardly any
strain at all
Ο
N/A
Ο
19. How likely is it that the training you are receiving here will help you to get
the job you want?
Very likely
Ο
Somewhat
likely
Ο
Neutral
Ο
Somewhat
unlikely
Ο
Very
unlikely
Ο
N/A
Ο

C-5
20. A goal of education is to provide you with what you need to know in order to
succeed in your future job. How confident are you that the career training
you receive here will give you the necessary knowledge and skills?
Very
confident
Ο
Somewhat
confident
Ο
Neutral
Ο
Somewhat
unconfident
Ο
Very
unconfident
Ο
N/A
Ο
21. How much do you know about the duties and responsibilities of the career
and field in which you are receiving training?
Very much
Ο
Much
Ο
Some
Ο
Little
Ο
Very little
Ο
N/A
Ο
22. How committed are you to getting a job in the field for which you are
training?
Very
committed
Ο
Somewhat
committed
Ο
Neutral
Ο
Somewhat
uncommitted
Ο
Very
uncommitted
Ο
N/A
Ο
Additional Information
23. What is the most motivating factor for you to complete this degree program?
24. What is the biggest barrier that you think you are going to face in completing
this degree program?

C-6
25. What educational outcomes do you expect to achieve as a result of attending
this college? (Select all that apply)
Earn some credits
Earn a certificate or multiple certificates
Earn an associate’s degree (with or without licensure)
26. In deciding to attend this college, which of the following were important for
you? (Select all that apply)
It has a good reputation.
It is affordable.
It is close to where I live or work.
It offers flexible schedules that meet my needs.
It offers online courses.
It offers short-term programs.
It offers the programs and/or certificates I want.
My family or friends attended this college.
27. There may be a lot of reasons you decided to go to college. Which of the
following describe your situation? (Select all that apply)
I can receive financial aid to go back to school.
I cannot find a job without more education.
I lost my job, and I am eligible for educational funds through the workforce center
or some other program.
I need to advance my education to get a job that is better than the one I have
now.
I want to advance my education to earn more money.
I want to advance my education to better my life.
I want to get a job in allied health.
My current employer is encouraging me to advance my education.
My current employer is paying for me to take classes.
My current employer promised me a pay raise if I earn a certificate, diploma, or
degree.
My family is encouraging me to go back to school.

C-7
28. Which of the following financial resources are you currently receiving to assist
with your education expenses? (Select all that apply)
Employer paid
Grants
Loans
Scholarships
Veteran’s benefits
Work on campus
Other
29. How supportive is your family of your decision to continue your education?
Ο Very supportive
Ο Somewhat supportive
Ο Neutral
Ο Somewhat unsupportive
Ο Very unsupportive
30. To what extent do you struggle with securing support or resources for child
care so that you can attend classes?
Ο I do not have children.
Ο Child care is never an issue for me.
Ο Child care is rarely an issue for me.
Ο Child care is sometimes an issue for me.
Ο Child care is always an issue for me.
31. To what extent do you struggle with securing transportation to school?
Ο Transportation is never a struggle for me.
Ο Transportation is rarely a struggle for me.
Ο Transportation is sometimes a struggle for me.
Ο Transportation is always a struggle for me.
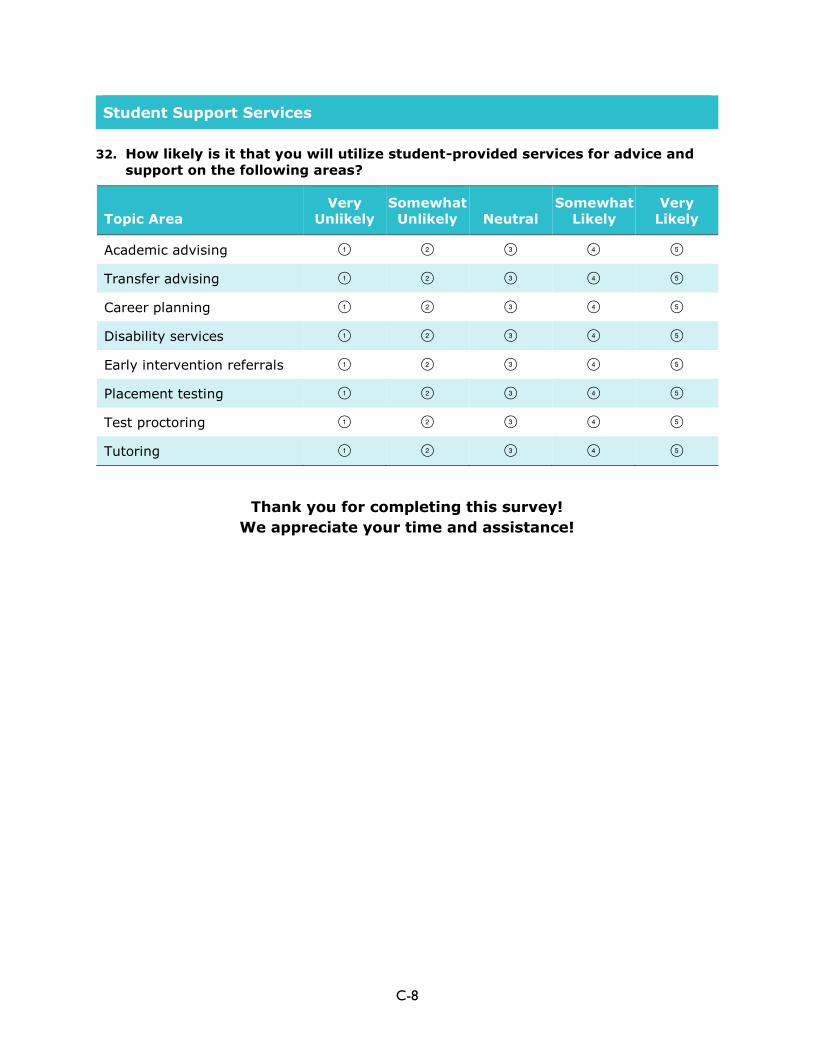
C-8
Student Support Services
32. How likely is it that you will utilize student-provided services for advice and
support on the following areas?
Topic Area
Very
Unlikely
Somewhat
Unlikely Neutral
Somewhat
Likely
Very
Likely
Academic advising
Transfer advising
Career planning
Disability services
Early intervention referrals
Placement testing
Test proctoring
Tutoring
Thank you for completing this survey!
We appreciate your time and assistance!

C-9
Comparison Students’ Education and Employment Outcomes
Table C-1. Comparison Group Entrance Survey: Background Information
Background n %
What future educational outcomes do you expect to achieve? (Select all that apply)
Do not plan to continue my education after leaving this school 1 4.8%
Earn an associate’s degree 17 81.0%
Earn a bachelor’s degree 4 19.0%
Earn a master’s degree or higher 2 9.5%
Are you currently employed?*
Not currently employed 5 22.7%
Employed part-time in the field of allied health 2 9.1%
Employed full-time in the field of allied health 2 9.1%
Employed part-time in a different field 13 59.1%
Employed full-time in a different field 0 --
*One individual had two employers; therefore, the total number of cases for employment is 22 while the total number of
participants remains 21.
Table C-2. Comparison Group Entrance Survey: Perceptions of Retention Factors
n N/A
Very
Much Much Some Little
Very
Little
Collegiate Stress
How often do you feel
overwhelmed by the
academic workload here?
21 -- 4.8% 19.0% 52.4% 23.8% --
Scholastic Conscientiousness
How often do you miss class
for reasons other than illness
or participation in school-
related activities?
21 23.8% -- -- -- -- 76.2%
Career Integration
How likely is it that the
training you are receiving
here will help you to get the
job you want?
21 -- 100.0% -- -- -- --

C-10
n N/A
Very
Much Much Some Little
Very
Little
A goal of education is to
provide you with what you
need to know in order to
succeed in your future job.
How confident are you that
the career training you
receive here will give you the
necessary knowledge and
skills?
21 -- 100.0% -- -- -- --
How much do you know
about the duties and
responsibilities of the career
and field in which you are
receiving training?
21 -- 33.3% 28.6% -- 38.1% --
How committed are you to
getting a job in the field for
which you are training?
21 -- 100.0% -- -- -- --
Academic Integration
How would you rate the
quality of the instruction you
are receiving here?
21 -- 61.9% 38.1% -- -- --
In general, how satisfied are
you with the quality of
instruction you are receiving
here?
21 -- 81.8% 18.2% -- -- --
Academic Effectiveness
How satisfied are you with
the academic advising you
receive here?
21 -- 81.0% 14.3% 4.8% -- --
How easy is it to get answers
to your questions about
things related to your
education and training here?
21 -- 76.2% 23.8% -- -- --
How would you rate the
academic advisement you
receive here?
21 -- 71.4% 28.6% -- -- --
Institutional Commitment
How likely is it you will earn
a certificate, diploma, or
degree from here?
21 -- 90.5% 9.5% -- -- --

C-11
n N/A
Very
Much Much Some Little
Very
Little
Financial Strain
How often do you worry
about having enough money
to meet your needs? 21 4.8% 19.0% 33.3% 23.8% 4.8% 14.3%
How difficult is it for you or
your family to be able to
handle college costs?
21 4.8% 9.5% 33.3% 28.6% 19.0% 4.8%
When considering the
financial costs of being in
college, how often do you
feel unable to do things that
other students here can
afford to do?
21 -- -- 23.8% 33.3% 23.8% 19.0%
How much of a financial
strain is it for you to
purchase the essential
resources you need for
courses such as books and
supplies?
21 -- 14.3% 38.1% 14.3% 14.3% 19.0%
Table C-3. Comparison Group Entrance Survey: Additional Information
n %
What educational outcomes do you expect to achieve as a result of attending your
current college? (Select all that apply)
Earn some credits 2 7.1%
Earn a certificate or multiple certificates 6 21.4%
Earn an associate’s degree (with or without licensure) 20 71.4%
In deciding to attend this college, which of the following were important for you?
(Select all that apply)
It has a good reputation. 14 66.7%
It is affordable. 17 81.0%
It is close to where I live or work. 20 95.2%
It offers flexible schedules that meet my needs. 10 47.6%
It offers online courses. 13 61.9%
It offers short-term programs. 11 52.4%
It offers the programs and/or certificates I want. 20 95.2%
My family or friends attended this college. 4 19.0%

C-12
n %
There may be a lot of reasons you decided to go back to college. Which of the
following describe your situation? (Select all that apply)
I can receive financial aid to go back to school. 5 22.7%
I cannot find a job without more education. 6 28.6%
I lost my job, and I am eligible for educational funds through the workforce center or some other program.
0 --
I need to advance my education to get a job that is better than the
one I have now. 13 61.9%
I want to advance my education to earn more money. 19 90.5%
I want to advance my education to better my life. 21 100.0%
I want to get a job in allied health. 11 52.4%
My current employer is encouraging me to advance my education. 0 --
My current employer is paying for me to take classes. 0 --
My current employer promised me a pay raise if I earn a certificate,
diploma, or degree. 0 --
My family is encouraging me to go back to school. 8 38.1%
Which of the following financial resources are you currently receiving to assist with
your education expenses? (Select all that apply)
Employer paid 1 4.8%
Grants 11 52.4%
Loans 11 52.4%
Scholarships 6 28.6%
Veteran’s benefits 0 --
Work on campus 0 --
Other 4 19.0%
None 2 9.5%
How supportive is your family of your decision to continue your education?
Very unsupportive 1 4.8%
Somewhat unsupportive 0 --
Neutral 0 --
Somewhat supportive 2 9.5%
Very supportive 18 85.7%
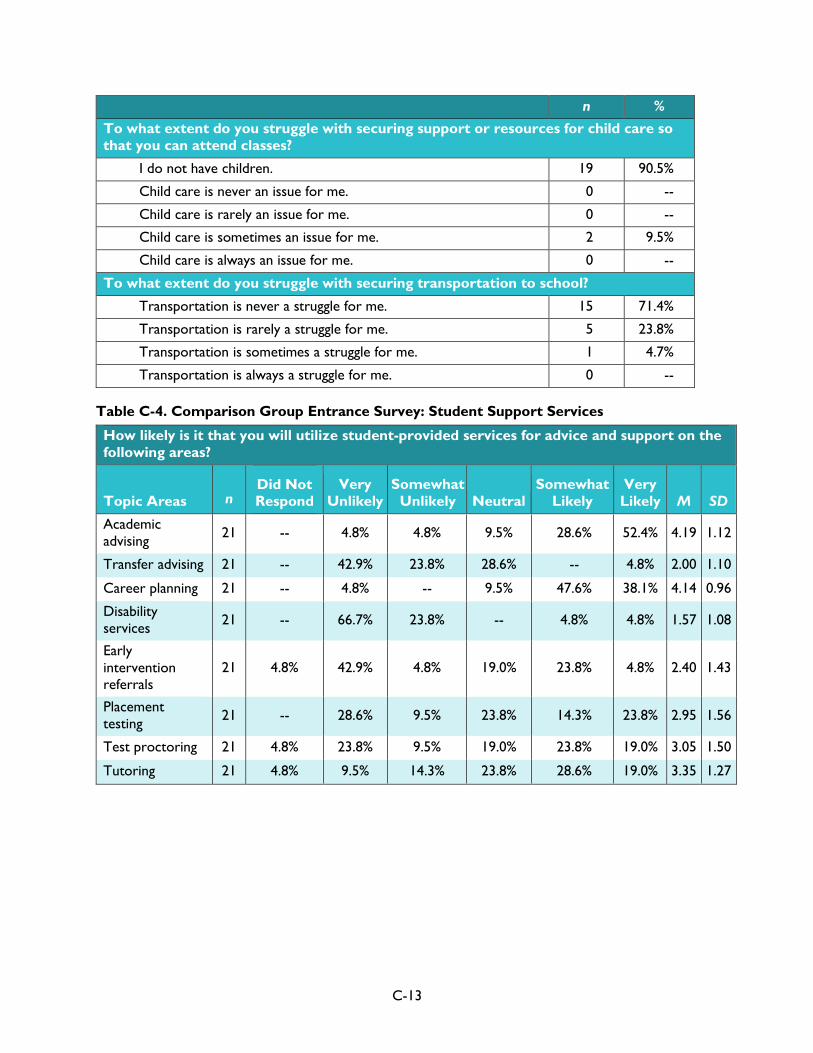
C-13
n %
To what extent do you struggle with securing support or resources for child care so
that you can attend classes?
I do not have children. 19 90.5%
Child care is never an issue for me. 0 --
Child care is rarely an issue for me. 0 --
Child care is sometimes an issue for me. 2 9.5%
Child care is always an issue for me. 0 --
To what extent do you struggle with securing transportation to school?
Transportation is never a struggle for me. 15 71.4%
Transportation is rarely a struggle for me. 5 23.8%
Transportation is sometimes a struggle for me. 1 4.7%
Transportation is always a struggle for me. 0 --
Table C-4. Comparison Group Entrance Survey: Student Support Services
How likely is it that you will utilize student-provided services for advice and support on the
following areas?
Topic Areas n
Did Not Respond
Very
Unlikely
Somewhat
Unlikely Neutral
Somewhat
Likely
Very
Likely M SD
Academic
advising 21 -- 4.8% 4.8% 9.5% 28.6% 52.4% 4.19 1.12
Transfer advising 21 -- 42.9% 23.8% 28.6% -- 4.8% 2.00 1.10
Career planning 21 -- 4.8% -- 9.5% 47.6% 38.1% 4.14 0.96
Disability
services 21 -- 66.7% 23.8% -- 4.8% 4.8% 1.57 1.08
Early
intervention referrals
21 4.8% 42.9% 4.8% 19.0% 23.8% 4.8% 2.40 1.43
Placement
testing 21 -- 28.6% 9.5% 23.8% 14.3% 23.8% 2.95 1.56
Test proctoring 21 4.8% 23.8% 9.5% 19.0% 23.8% 19.0% 3.05 1.50
Tutoring 21 4.8% 9.5% 14.3% 23.8% 28.6% 19.0% 3.35 1.27
Appendix D
Appendix D. Participant v. Non-participant PTA Students’
Employment and Education Outcomes

D-1
Table D-1. Participant v. Non-participant Employment Status
Employment Status n %
New River
Employed 20 50.0%
Not Employed 20 50.0%
Pierpont
Employed 16 76.2%
Not Employed 5 23.8%
Table D-2. Participant v. Non-participant Perceptions of Retention Factors
Retention Factors
New River Pierpont Independent Samples
t-test
n M SD n M SD t DF p-value ES
Collegiate Stress 40 2.95 0.96 21 2.95 0.80 -0.10 59 0.992 -0.03
Scholastic Conscientiousness 38 4.92 0.27 16 5.00 0.00 1.70 26† 0.101 0.67
Career Integration 39 4.76 0.32 21 4.74 0.22 0.31 58 0.755 0.08
Academic Integration 39 4.62 0.44 21 4.71 0.34 -0.90 58 0.371 -0.24
Academic Effectiveness 40 4.53 0.45 21 4.75 0.36 -1.88 59 0.065 -0.49
Institutional Commitment 40 3.28 1.18 21 4.90 0.30 -8.26 48† 0.000*** -2.39
Financial Strain 39 2.89 0.57 20 2.98 0.73 -0.45 57 0.656 -0.12
†Due to a significance < 0.50 on Levene’s test of equality of variances, equal variances are not assumed and the degree of
freedom (DF) is rounded to the nearest whole number.
Note. The items used a five-point scale. A high mean score indicates better outcomes. Effect size (ES) estimating of the
magnitude of differences over time is reported using the Cohen’s d statistic. *p< .05, ** p< .01, *** p< .001
Table D-3. Participant v. Non-participant Use of Student Support Services
Student Support Services
New River Pierpont Independent Samples
t-test
n M SD n M SD t DF p-value ES
Academic Advising 39 3.05 1.41 21 4.19 1.12 -1.04 59 0.303 -0.27
Career Planning 39 3.10 1.39 21 4.14 0.96 -1.01 59 0.316 -0.26
Disability Services 39 1.87 1.15 21 1.57 1.08 -0.63 59 0.529 -0.16
Early Intervention Referrals 39 2.05 1.07 21 2.40 1.43 0.40 59 0.694 0.10
Test proctoring 39 2.13 1.20 21 2.95 1.56 -0.95 59 0.345 -0.25
Placement Testing 39 2.10 1.12 21 3.05 1.50 0.28 59 0.781 0.07
Transfer Advising 39 2.44 1.39 21 2.00 1.10 -0.60 59 0.554 -0.16
Tutoring 39 2.31 1.26 21 3.35 1.27 0.26 59 0.795 0.07
Note. The items used a five-point scale, with a high mean score indicating better outcomes. Effect size (ES) estimating of the
magnitude of differences over time is reported using the Cohen’s d statistic. *p< .05, ** p< .01, *** p< .001

Appendix E
Appendix E. New River Partner Survey and Data Tables

E-1
Partner Survey
NEW RIVER COMMUNITY AND TECHNICAL COLLEGE:
Framework for Institutional Transformation: Reimagining Allied Health in
Southeastern West Virginia
McREL International is evaluating a grant awarded to New River Community and Technical College
by the U.S. Department of Labor (DOL) through the Trade Adjustment Assistance Community
College and Career Training (TAACCCT) initiative. New River’s Allied Health TAACCCT grant
offers three new associate degree programs (Medical Laboratory Technician, Physical Therapist
Assistant, and Registered Nursing); one expanded certificate program (Paramedic-Emergency Medical
Technician [EMT]); and one expanded associate degree program (Medical Assisting).
Purpose of the Survey: To determine the grant’s success, New River hired McREL International as a
third-party evaluator to gather information from the New River TAACCCT project partners to
provide data needed for program improvement and refinement. Being a valuable member of the New
River advisory committee, you are invited to take this survey. It should take you approximately 10 to
15 minutes to complete. McREL evaluators are not using any of the information collected to assess
how well you, as an individual partner, are developing or implementing the project. Rather, the data
obtained from the survey will be reported in an aggregated form to assist New River TAACCCT
project staff in making project-wide adjustments and improvements.
Protecting Your Rights: Participation in this survey is voluntary and should not involve any known
risks above those normally encountered in daily life. There are no “right” or “wrong” answers. There
will be no retribution of any sort for any responses you provide. If you feel uncomfortable about
responding to some questions, you may skip those questions. You may also choose to discontinue
participation altogether without penalty or reprisal; however, we value any information you can
provide to inform project quality and improvement.
About Your Confidentiality: McREL evaluators will handle the data and do everything they can to
ensure its security.10 All information collected on this survey will be confidential and will only be
accessible by the evaluation team conducting this project. New River TAACCCT project personnel
will not have access to your individual responses. Further, you will not be identifiable in any report
and no one will be able to “guess” your identity from reports or presentations.
Benefits: While there are no direct benefits to individuals for participating, the survey is one of several
data sources that will be used to evaluate the development and implementation of the New River
TAACCCT project. The evaluation report will provide crucial information to project staff to help
them understand the impact of the
New River TAACCCT project on participants and partners. Further, the study can contribute to the
larger collection of research literature about the impact of similar workforce training initiatives.
Questions: We appreciate your time and help in making sure that New River can provide a program
that suits your industry needs. If you have any questions about this evaluation effort, please feel free
10 Please note that the McREL Institutional Review Board (IRB) has the authority to inspect consent records and data files only
to assure compliance with approved procedures. If, during the process of collecting data, a threat of violence against an
individual or entity is uncovered, McREL cannot guarantee anonymity or confidentiality to any party involved.

E-2
to contact Ashli Knotts, Evaluation Specialist, by phone (800.624.9120, ext. 5462) or e-mail
([email protected]). For information on protection of your rights as a participant, you may contact
Sheila Arens (303.632.5625; [email protected]).
By completing and returning this survey, you are indicating that you are at least 18 years of
age and that you voluntarily agree to participate in the survey.

E-3
Section I. General Information
The New River TAACCCT project provides postsecondary education and training programs for
individuals who are interested in obtaining two-year associate degrees, diplomas, or certificates in five
allied health programs.
In this section, we would like to learn a little bit about your working relationship with the project.
1. Which of the following five allied health programs are you most closely associated?
Medical Assisting (MA)
Medical Laboratory Technician (MLT)
Paramedic-Emergency Medical Technician (EMT)
Physical Therapy Assistant (PTA)
Registered Nursing (RN)
2. What is your job title/position? (Choose the category that best describes you.)
Owner, President, or CEO of a Healthcare Organization
Division Manager or Director of a Healthcare Organization
Human Resources staff of a Healthcare Organization
Other (Please specify: ______________________________)
3. When did you become involved in the New River project?
Before the project was funded (Before September 2012)
Since grant Year 1 (October 2012 to September 2013)
Since grant Year 2 (October 2013 to September 2014)
Since grant Year 3 (October 2014 to present)

E-4
Section II. Program Involvement
In this section, we would like to learn more about your involvement with the New River TAACCCT
grant activities. Please rate each item based on your knowledge and your own experiences with the
grant project.
4. As of today, to what extent have you personally been involved in the following project activities?
Project Activities
Rating of level of involvement from
1 (not involved at all) to 5 (highly
involved)
1 2 3 4 5
Participant recruitment
Recruit incumbent workers
Recruit TAA-eligible participants
Recruit veterans or spouses of veterans
Recruit underemployed participants
Recruit long-term unemployed participants
Recruit other program participants
Curriculum design and development
Assist in curriculum design and redesign to ensure the
training provided is aligned with industry needs
Identify credentials that meet industry needs Identify important knowledge and skill sets that meet industry
needs
Technology and equipment support
Provide equipment and software to support project success
Provide facilities and equipment for training activities
Partnership support
Assist in creating new partnerships to support project success
Student support and placement services
Provide contextualized learning opportunities (e.g., paid or
unpaid internships, or company visits)
Identify services needed to support participant success Provide graduate placement services (e.g., mock interviews
and assistance in developing résumés)
Provide information related to job openings in the allied
healthcare fields to colleges and their students
Offer job opportunities for New River allied healthcare
program graduates

E-5
5. Overall, how satisfied are you with your current level of involvement in the New River project?
Strongly dissatisfied
Dissatisfied
Neutral
Satisfied
Very satisfied
6. Overall, how satisfied are you with New River project staff’s efforts to engage you in the program?
Strongly dissatisfied
Dissatisfied
Neutral
Satisfied
Very satisfied
7. In what areas would you like to become more involved? (Select all that apply)
Participant recruitment
Curriculum design and development
Technology and equipment support
Partnership support
Student support and placement services
None of the above (i.e., I am satisfied with my current level of involvement.)
8. Based on your experiences with the project, rate the quality of program implementation on each of
the key project components. Please mark N/A if a certain New River component has not yet been
implemented or if you do not have experience with that particular aspect of the project.
Project Component
Rating of quality of project implementation
from
1 (poor quality) to 5 (high quality) N/A
1 2 3 4 5
Participant recruitment
Curriculum design and development
Technology and equipment support
Partnership support
Student support and placement services

E-6
Section III. Project Impact on the Allied Healthcare Industry and Local
Community
In this section, we would like to learn more about your perceptions of the New River project’s impact
on participants, the allied healthcare industry, and the local community.
9. To what extent do you agree with the following statements?
Statement Strongly
Disagree Disagree Neutral Agree
Strongly
Agree
a. New River programs offer certificate, diploma, and
degree programs that meet industry needs.
b. New River programs prepare workers with the
knowledge and skills needed to be successful in the
allied healthcare industry.
c. The New River project offers programs that support
local workforce development.
d. New River programs prepare highly skilled workers
who meet allied healthcare industry needs.
e. New River allied healthcare programs prepare highly
skilled workers who meet my organization’s needs.
f. The partnership between my organization and New
River allied healthcare programs will continue and
expand beyond the life of the grant period.
g. I will consider collaborating with New River on
other projects in the future.
10. How likely are you to recommend the New River allied healthcare programs to companies,
organizations, and community partners with which you collaborate?
Not likely
Somewhat likely
Neutral
Likely
Very likely
11. How did you learn about the New River allied healthcare project and become involved? (Select all that
apply)
I have an existing partnership with the college that started before the New River TAACCCT project began.
I learned about the project from my coworkers or current employee(s).
I learned about the project from a trade union/association.
I learned about the project from a job fair/conference.
I learned about the project from local/state workforce agencies.
I learned about the project via print media (e.g., newspapers and magazines) or e-mail.
I learned about the project via social media (e.g., Facebook, Twitter, or LinkedIn).
The college reached out to my organization.
The college reached out to me personally.
Other (Please specify: ______________________________)

E-7
Partner Survey Data Tables
Table E-1. Partner Survey: Background Information
n %*
Which of the following five allied health programs are you most closely associated?
Medical Assisting (MA) 2 5.1%
Medical Laboratory Technician (MLT) 7 17.9%
Paramedic-Emergency Medical Technician (EMT) 9 23.1%
Physical Therapy Assistant (PTA) 18 46.2%
Registered Nursing (RN) 3 7.7%
What is your job title/position? (Choose a category that best describes you)
Owner, President, or CEO of a Healthcare Organization 5 12.8%
Division Manager or Director of a Healthcare Organization 13 33.3%
Human Resources staff of a Healthcare Organization 1 2.6%
Other 20 51.3%
If other, please specify: (n = 20)
Adm[inistrative] Director of Laboratory Services
CCCE [Center Coordinator of Clinical Education]
CCCE of PT [Physical Therapy] Department
Clinical Director/LPTA [Licensed Physical Therapy Assistant]
Director of Clinical Services
Director of Education
Director of Physical Therapy
Education Department
Education Department Director; Gym Supervisor; Athletic Trainers
Lab Administrative Director
Lab Manager
Lab Administrative Director
Physical Therapist (PT)
Physical Therapy Assistant (PTA)
PT Clinical Instructor
PT Director of Rehab Department
Staff Therapist
Vice-President, Patient Care Services
IS/IT [Information System/Information Technology] Specialist
* Missing values are not included in the percentage (i.e., valid percentage).
Table E-2. Partner Survey: Becoming a Project Partner
n %*
When did you become involved in the New River project? (n = 39)
Before the project was funded (before September 2012) 9 23.1%
Since grant Year 1 (October 2012 to September 2013) 5 12.8%
Since grant Year 2 (October 2013 to September 2014) 9 23.1%
Since grant Year 3 (October 2014 to present) 16 41.0%
How did you learn about the New River allied healthcare project and become involved?
(select all that apply) (n = 34)
I have an existing partnership with the college that started before the
New River TAACCCT project began. 9 26.5%
I learned about the project from my coworkers or current employee(s). 5 14.7%

E-8
n %*
I learned about the project from a job fair/conference. 1 2.9%
I learned about the project from local/state workforce agencies. -- --
I learned about the project via print media (e.g., newspapers and magazines)
or e-mail. 2 5.9%
I learned about the project via social media (e.g., Facebook, Twitter, or
LinkedIn). 1 2.9%
The college reached out to my organization. 18 52.9%
The college reached out to me personally. 13 38.2%
* Missing values are not included in the percentage (i.e., valid percentage).
Table E-3. Partner Survey: Overview of Program Involvement
M SD
As of today, to what extent have you personally been involved in the following project
activities?
Participant Recruitment 1.28 0.71
Curriculum Design and Development 1.85 1.11
Technology and Equipment Support 2.01 1.18
Partnership Support 2.26 1.54
Student Support and Placement Services 2.50 1.17
Table E-4. Partner Survey: Detailed Program Involvement
n
Not
Involved
At All
Barely
Involved
Some-
what
Involved
Often
Involved
Highly
Involved M SD
Participant recruitment
Recruit incumbent workers 34 82.4% 2.9% 8.8% 2.9% 2.9% 1.41 0.99
Recruit TAA-eligible participants 34 88.2% 2.9% 2.9% 2.9% 2.9% 1.29 0.91
Recruit veterans or spouses of
veterans 35 88.6% 5.7% -- 2.9% 2.9% 1.26 0.85
Recruit underemployed participants 34 88.2% 5.9% 2.9% 2.9% -- 1.21 0.64
Recruit long-term unemployed
participants 34 88.2% 5.9% -- 5.9% -- 1.24 0.74
Recruit other program participants 34 82.4% 2.9% 8.8% 2.9% 2.9% 1.41 0.99
Curriculum design and development
Assist in curriculum design and
redesign to ensure the training
provided is aligned with industry needs
34 70.6% -- 23.5% 2.9% 2.9% 1.68 1.12
Identify credentials that meet industry
needs 34 64.7% 5.9% 20.6% 2.9% 5.9% 1.79 1.23

E-9
n
Not
Involved At All
Barely
Involved
Some-
what Involved
Often
Involved
Highly
Involved M SD
Identify important knowledge and
skill sets that meet industry needs 35 54.3% 2.9% 25.7% 8.6% 8.6% 2.14 1.40
Technology and equipment support
Provide equipment and software to
support project success 34 79.4% 5.9% 2.9% 5.9% 5.9% 1.53 1.19
Provide facilities and equipment for
training activities 34 42.9% 11.4% 11.4% 17.1% 17.1% 2.54 1.60
Partnership support
Assist in creating new partnerships to
support project success 35 54.3% 2.9% 20.0% 8.6% 14.3% 2.26 1.54
Student support and placement services
Provide contextualized learning
opportunities (e.g., paid or unpaid
internships, or company visits)
34 23.5% 11.8% 23.5% 14.7% 26.5% 3.09 1.53
Identify services needed to support
participant success 35 45.7% 8.6% 11.4% 22.9% 11.4% 2.46 1.54
Provide graduate placement services
(e.g., mock interviews and assistance
in developing resumes)
35 80.0% 8.6% 2.9% 2.9% 5.7% 1.46 1.09
Provide information related to job
openings in the allied healthcare fields to colleges and their students
35 45.7% -- 25.7% 11.4% 17.1% 2.54 1.58
Offer job opportunities for
New River allied healthcare program graduates
35 37.1% 2.9% 5.7% 22.9% 31.4% 3.09 1.76
Table E-5. Partner Survey: Satisfaction and Interest Areas for Increased Involvement
n Very
Dissatisfied
Somewhat
Dissatisfied Neutral
Somewhat
Satisfied
Very
Satisfied M SD
Overall, how satisfied are you
with your current level of
involvement in the New River project?
34 -- 2.9% 47.1% 29.4% 20.6% 3.68 0.84
Overall, how satisfied are you
with New River project
staff’s efforts to engage you in the program?
34 5.9% 2.9% 44.1% 26.5% 20.6% 3.53 1.05
*A total number of 100 selections from 34 partners.

E-10
Table E-6. Partner Survey: Interest Areas for Increased Involvement
n* %
In what areas would you like to become more involved? (Select all that apply)
Participant recruitment 6 15.0%
Curriculum design and development 8 20.0%
Technology and equipment 5 12.5%
Partnership support 12 30.0%
Student support and placement services 12 30.0%
None of the above (i.e., I am satisfied with my current level of involvement.) 12 30.0%
Table E-7. Partner Survey: Quality of Program Implementation
n N/A
Very
Poor
Somewhat
Poor Fair Good Excellent M* SD*
Based on your experiences with the project, rate the quality of program implementation on
each of the key project components.
Participant recruitment 34 52.9% 2.9% -- 17.6% 5.9% 20.6% 3.88 1.20
Curriculum design and
development 34 55.9% 2.9% 8.8% 14.7% 11.8% 5.9% 3.20 1.45
Technology and equipment
support 33 48.5% 3.0% 12.1% 12.1% 15.2% 9.1% 3.29 1.21
Partnership support 34 44.1% 5.9% 5.9% 11.8% 8.8% 23.5% 3.68 1.42
Student support and placement
services 34 38.2% 2.9% 2.9% 17.6% 20.6% 17.6% 3.76 1.09
* Means and standard deviations only include those who had experiences with project components (i.e., excludes N/A responses).
Table E-8. Partner Survey: Project Impact on Allied Healthcare Industry and Local
Community
Statement n
Strongly
Disagree Disagree Neutral Agree
Strongly
Agree M SD
To what extent do you agree with the following statements?
New River programs offer
certificate, diploma, and degree programs that meet industry needs.
35 -- -- 28.6% 45.7% 25.7% 3.97 0.75
New River programs prepare
workers with the knowledge and
skills needed to be successful in the allied healthcare industry.
35 -- -- 34.3% 34.3% 31.4% 3.97 0.82
The New River project offers
programs that support local workforce development.
35 -- 2.9% 28.6% 42.9% 25.7% 3.91 0.88

E-11
Statement n
Strongly
Disagree Disagree Neutral Agree
Strongly
Agree M SD
To what extent do you agree with the following statements?
New River programs prepare highly
skilled workers who meet allied healthcare industry needs.
35 -- 5.7% 34.3% 28.6% 31.4% 3.86 0.94
New River allied healthcare
programs prepare highly skilled
workers who meet my organization’s needs.
35 -- 2.9% 37.1% 31.4% 28.6% 3.86 0.88
The partnership between my
organization and New River allied
healthcare programs will continue
and expand beyond the life of the
grant period.
35 2.9% -- 22.9% 37.1% 37.1% 4.06 0.94
I will consider collaborating with
New River on other projects in the future.
34 2.9% -- 20.6% 47.1% 29.4% 4.00 0.89

Appendix F
Appendix F. Findings from New River Education Records
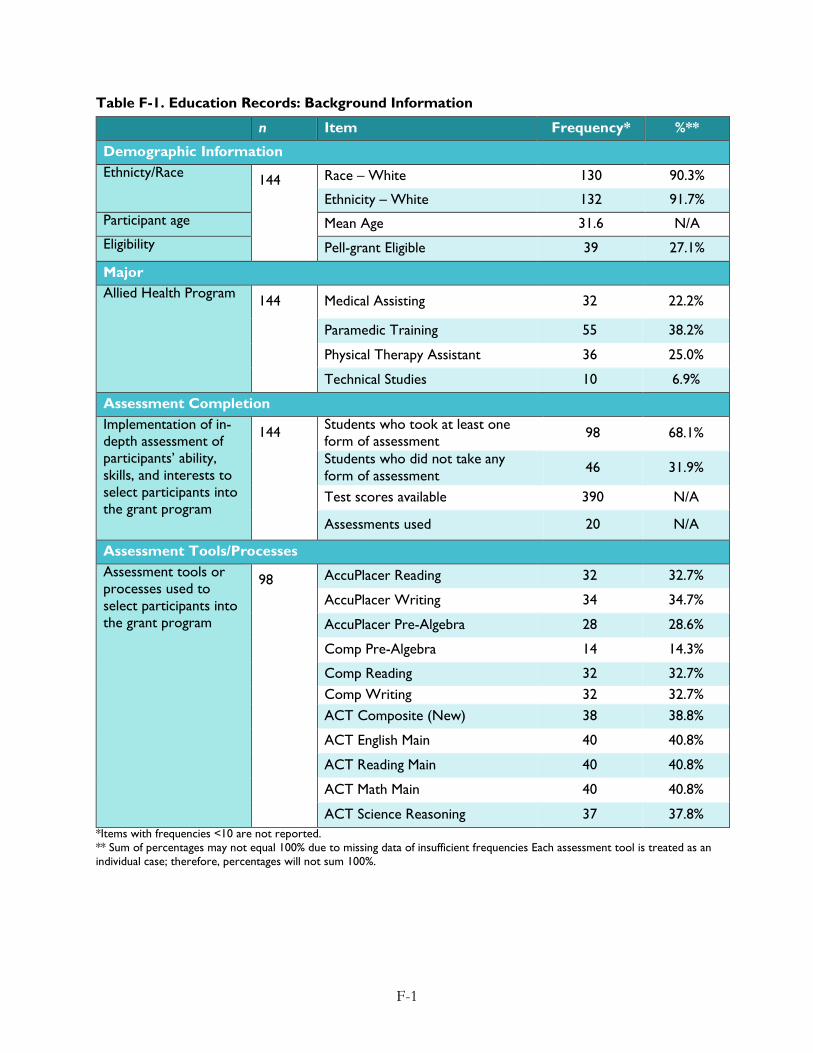
F-1
Table F-1. Education Records: Background Information
n Item Frequency* %**
Demographic Information
Ethnicty/Race 144 Race – White 130 90.3%
Ethnicity – White 132 91.7%
Participant age Mean Age 31.6 N/A
Eligibility Pell-grant Eligible 39 27.1%
Major
Allied Health Program 144 Medical Assisting 32 22.2%
Paramedic Training 55 38.2%
Physical Therapy Assistant 36 25.0%
Technical Studies 10 6.9%
Assessment Completion
Implementation of in-
depth assessment of
participants’ ability,
skills, and interests to
select participants into
the grant program
144 Students who took at least one
form of assessment 98 68.1%
Students who did not take any
form of assessment 46 31.9%
Test scores available 390 N/A
Assessments used 20 N/A
Assessment Tools/Processes
Assessment tools or
processes used to
select participants into
the grant program
98 AccuPlacer Reading 32 32.7%
AccuPlacer Writing 34 34.7%
AccuPlacer Pre-Algebra 28 28.6%
Comp Pre-Algebra 14 14.3%
Comp Reading 32 32.7%
Comp Writing 32 32.7%
ACT Composite (New) 38 38.8%
ACT English Main 40 40.8%
ACT Reading Main 40 40.8%
ACT Math Main 40 40.8%
ACT Science Reasoning 37 37.8%
*Items with frequencies <10 are not reported.
** Sum of percentages may not equal 100% due to missing data of insufficient frequencies Each assessment tool is treated as an
individual case; therefore, percentages will not sum 100%.

F-2
Table F-2. Education Records: Degrees Earned
Item n Frequency %
Total number of students earning
degrees and/or certificates
(aggregate across all enrollees) 144 68 47.2%
Table F-3. Education Records: Grade Point Average by Semester
Item n Semester Average GPA
Student grade point
averages (GPA) 38 Fall 2012 3.15
48 Spring 2013 3.11
87 Fall 2013 3.22
109 Spring 2014 3.10
113 Fall 2014 3.29
92 Spring 2015 2.31
58 Fall 2015 2.95
41 Spring 2016 3.19
143 Cumulative 2.91
Table F-4. Education Records: Students to Complete Credits by Semester
Item n* Semester Frequency %**
Total number of
students completing
credit hours
143 Fall 2012 38 26.6
Spring 2013 48 33.6
Fall 2013 87 60.8
Spring 2014 109 76.2
Fall 2014 113 79.0
Spring 2015 92 64.3
Fall 2015 58 40.6
Spring 2016 41 28.7
*Not all students were enrolled every semester from Fall 2012-Spring 2016. Percentages should be evaluated with caution due
to missing data for those who enrolled after the 2012 semester.
**Percentages represent those who completed credit hours by semester and at the end of the three-year span (i.e., Total). To
equal 100%, percentages would need to be compared to the equation (n – freq) to determine those who did not complete
credit hours each semester rather than comparing percentages from semester to semester.

F-3
Table F-5. Education Records: Students to Complete All Credits Attempted by Semester
Item n Semester Frequency %
Number of students who
completed all credit
hours attempted
38 Fall 2012 24 63.2
48 Spring 2013 27 56.3
87 Fall 2013 64 73.6
109 Spring 2014 82 75.2
113 Fall 2014 89 78.8
92 Spring 2015 68 73.9
58 Fall 2015 43 74.1
41 Spring 2016 33 80.5
Table F-6. Education Records: Number of Students Completed and Earned by Semester
Item n Semester Completed/Earned Credits %
Earned*
Total number of
credit hours
(aggregate across all
enrollees)
143
Fall 2012 Completed 403
90.3 Earned 364
Spring 2013 Completed 472
96.8 Earned 457
Fall 2013 Completed 1,029
93.9 Earned 966
Spring 2014 Completed 1,323
96.4 Earned 1,275
Fall 2014 Completed 1,235
98.5 Earned 1,217
Spring 2015 Completed 1,084
99.3 Earned 1,076
Fall 2015 Completed 631
99.4 Earned 627
Spring 2016 Completed 463
99.1 Earned 459
Total Completed 6,640
97.0 Earned 6,441
*Percentage earned is equal to the number of credit hours earned from the hours completed.

Appendix G
Appendix G. New River Wage and Employment Findings

G-1
Table G-1. Number of Students Employed at Enrollment Who Received a Wage Increase
Item n* Quarter Comparison Frequency %**
Total Number of Those
Employed at Enrollment
Who Receive a Wage
Increase Post-Enrollment
124 Q3 2014 v. Q4 2014 50 44.6
122 Q4 2014 v. Q1 2015 67 60.9
123 Q1 2015 v. Q2 2015 76 67.5
125 Q2 2015 v. Q3 2015 33 64.7
125 Q3 2015 v. Q4 2015 100 82.6
143 Q4 2015 v. Q1 2016 72 55.0
143 Q1 2016 V. Q2 2016 92 64.3
* Sample size and number of jobs held are not synonymous. Multiple individuals in each quarter held more than one job.
** Averages are based on the number of wage increases across all jobs in the latter quarter rather than by the number of
students in sample.
Table G-2. Number of Students Employed and Not Employed Each Quarter
Item n Quarter Employment Status Frequency %
Incumbent Workers 125 Q3 2014
Employed 93 74.4
Not Employed 32 25.6
124 Q4 2014 Employed 92 74.2
Not Employed 32 25.8
123 Q1 2015 Employed 90 73.2
Not Employed 33 26.8
125 Q2 2015 Employed 96 76.8
Not Employed 29 23.2
125 Q3 2015 Employed 46 36.8
Not Employed 79 63.2
144 Q4 2015 Employed 108 75.0
Not Employed 36 25.0
143 Q1 2016 Employed 104 72.7
Not Employed 39 27.3
144 Q2 2016 Employed 115 79.9
Not Employed 29 20.1

G-2
Table G-3. Number of Students Employed Each Quarter by Industry Sector
Quarter N* Industry Frequency %
Q3 2014 125 Accommodation 5 4.0
Administrative and Support Services 17 13.6
Ambulatory Health Services 38 30.4
Amusement, Gambling and Recreation 1 0.8
Building Material and Garden Equipment 1 0.8
Educational Services 2 1.6
Executive, Legislative, and Other General Government
Support 3 2.4
Food and Beverage Services 11 8.8
Gasoline Station 3 2.4
General Merchandise Stores 1 0.8
Heavy and Civil Engineering Construction 1 0.8
Hospitals 2 1.6
Justice, Public Order, and Safety Activity 6 4.8
Membership Associations and Organization 1 0.8
Merchant Wholesalers 1 0.8
Nursing and Residential Care Facilities 6 4.8
Personal and Laundry Services 1 0.8
Printing and Related Support Activities 1 0.8
Private Households 1 0.8
Social Assistance 3 2.4
Specialty Trade and Contractors 1 0.8
Q4 2014
124
Accommodation 3 2.4
Administrative and Support Services 17 13.7
Ambulatory Health Services 37 29.8
Amusement, Gambling and Recreation 1 0.8
Building Material and Garden Equipment 1 0.8
Construction of Building 1 0.8
Educational Services 3 2.4
Executive, Legislative, and Other General Government
Support 6 4.8
Food and Beverage Services 12 17.9
Gasoline Station 3 2.4
General Merchandise Stores 2 1.6

G-3
Quarter N* Industry Frequency %
Health and Personal Care Stores 2 1.6
Heavy and Civil Engineering Construction 1 0.8
Hospitals 2 1.6
Justice, Public Order, and Safety Activity 6 4.8
Membership Associations and Organization 1 0.8
Nursing and Residential Care Facilities 6 4.8
Personal and Laundry Services 1 0.8
Printing and Related Support Activities 1 0.8
Private Household 1 0.8
Social Assistance 3 2.4
Support Activities for Mining 2 1.6
Q1 2015 123 Accommodation 3 2.4
Administrative and Support Services 14 11.4
Ambulatory Health Services 38 30.9
Building Material and Garden Equipment 1 0.8
Educational Services 2 1.6
Executive, Legislative, and Other General Government Support
4 3.3
Food and Beverage Services 14 11.4
Gasoline Station 3 2.4
General Merchandise Stores 4 3.3
Health and Personal Care Stores 1 0.8
Heavy and Civil Engineering Construction 1 0.8
Hospitals 2 1.6
Justice, Public Order, and Safety Activity 8 6.5
Nursing and Residential Care Facilities 6 4.9
Personal and Laundry Services 1 0.8
Printing and Related Support Activities 1 0.8
Private Households 1 0.8
Professional, Scientific, and Technical 1 0.8
Social Assistance 3 2.4
Specialty Trade Contractors 1 0.8
Transportation Equipment Manufacturing 1 0.8
Q2 2015 125 Accommodation 3 2.4
Administrative and Support Services 16 12.8

G-4
Quarter N* Industry Frequency %
Ambulatory Health Services 39 31.2
Amusement, Gambling and Recreation 1 0.8
Educational Services 3 2.4
Executive, Legislative, and Other General Government Support
4 3.2
Food and Beverage Services 14 11.2
Gasoline Station 3 2.4
General Merchandise Stores 3 2.4
Health and Personal Care Stores 1 0.8
Heavy and Civil Engineering Construction 1 0.8
Hospitals 4 3.2
Justice, Public Order, and Safety Activity 7 5.6
Merchant Wholesalers 1 0.8
Nursing and Residential Care Facilities 7 5.6
Personal and Laundry Services 1 0.8
Printing and Related Support Activities 1 0.8
Private Households 1 0.8
Professional, Scientific, and Technical 1 0.8
Social Assistance 3 2.4
Transportation Equipment Manufacturing 1 0.8
Q3 2015 125 Accommodation 3 2.4
Administrative and Support Services 1 0.8
Ambulatory Health Services 21 16.8
Amusement, Gambling and Recreation 1 0.8
Educational Services 2 1.6
Executive, Legislative, and Other General Government Support
2 1.6
Food and Beverage Services 2 1.6
Gasoline Station 2 1.6
General Merchandise Stores 1 0.8
Hospitals 2 1.6
Justice, Public Order, and Safety Activity 4 3.2
Nursing and Residential Care Facilities 3 2.4
Personal and Laundry Services 1 0.8
Printing and Related Support Activities 1 0.8
Social Assistance 2 1.6

G-5
Quarter N* Industry Frequency %
Specialty Trade Contractors 1 0.8
Transportation Equipment Manufacturing 1 0.8
Q4 2015 144 Accommodation 5 3.5
Administration of Environmental Quality 1 0.7
Administrative and Support Services 17 11.8
Ambulatory Health Services 43 29.9
Amusement, Gambling and Recreation 2 1.4
Building Material and Garden Equipment 1 0.7
Clothing and Clothing Accessories Stores 1 0.7
Credit Intermediation and Related Activities 1 0.7
Educational Services 4 2.8
Electronics and Appliance Stores 1 0.7
Executive, Legislative, and Other General Government Support
6 4.2
Food and Beverage Services 9 6.3
Gasoline Station 2 1.4
General Merchandise Stores 4 2.8
Health and Personal Care Stores 3 2.1
Heavy and Civil Engineering Construction 1 0.7
Hospitals 7 4.9
Justice, Public Order, and Safety Activity 8 5.6
Merchant Wholesalers 1 0.7
Miscellaneous Store Retailers 1 0.7
Nursing and Residential Care Facilities 6 4.2
Personal and Laundry Services 1 0.7
Printing and Related Support Activities 1 0.7
Private Households 1 0.7
Social Assistance 5 3.5
Sporting Goods, Hobby, Book, and Music Stores 1 0.7
Q1 2016 143 Accommodation 4 2.8
Administrative and Support Services 20 14.0
Ambulatory Health Services 48 33.6
Amusement, Gambling and Recreation 1 0.7
Clothing and Clothing Accessories Stores 1 0.7
Educational Services 3 2.1

G-6
Quarter N* Industry Frequency %
Electronics and Appliance Stores 1 0.7
Executive, Legislative, and Other General Government Support
4 2.8
Food and Beverage Services 9 6.3
Gasoline Station 2 1.4
General Merchandise Stores 2 1.4
Health and Personal Care Stores 2 1.4
Heavy and Civil Engineering Construction 1 0.7
Hospitals 9 6.3
Justice, Public Order, and Safety Activity 8 5.6
Miscellaneous Store Retailers 1 0.7
Nursing and Residential Care Facilities 6 4.2
Printing and Related Support Activities 1 0.7
Professional, Scientific, and Technical 1 0.7
Social Assistance 4 2.8
Specialty Trade Contractors 1 0.7
Sporting Goods, Hobby, Book, and Music Stores 1 0.7
Wood Product Manufacturing 1 0.7
Q2 2016 144 Accommodation 5 3.5
Administration of Environmental Quality 1 0.7
Administrative and Support Services 18 12.5
Ambulatory Health Services 59 41.0
Amusement, Gambling and Recreation 2 1.4
Educational Services 2 1.4
Electronics and Appliance Stores 1 0.7
Executive, Legislative, and Other General Government Support
5 3.5
Food and Beverage Services 8 5.6
Gasoline Station 2 1.4
General Merchandise Stores 3 2.1
Health and Personal Care Stores 3 2.1
Heavy and Civil Engineering Construction 1 0.7
Hospitals 7 4.9
Justice, Public Order, and Safety Activity 6 4.2
Merchant Wholesalers 1 0.7

G-7
Quarter N* Industry Frequency %
Miscellaneous Store Retailers 1 0.7
Nonmetallic Mineral Product Manufacturing 1 0.7
Nursing and Residential Care Facilities 6 4.2
Printing and Related Support Activities 1 0.7
Professional, Scientific, and Technical 1 0.7
Real Estate 1 0.7
Social Assistance 6 4.2
Sporting Goods, Hobby, Book, and Music Stores 1 0.7
Telecommunications 1 0.7
Wood Product Manufacturing 1 0.7
* Sample size and number of jobs held are not synonymous. Multiple individuals in each quarter held more than one job.
Recommended