University of KentuckyUKnowledge
Theses and Dissertations--Public Health (M.P.H. &Dr.P.H.) College of Public Health
2016
Neurotoxic Effects of Occupational Exposures inAgricultural WorkersMiriam SiegelUniversity of Kentucky
Click here to let us know how access to this document benefits you.
This Graduate Capstone Project is brought to you for free and open access by the College of Public Health at UKnowledge. It has been accepted forinclusion in Theses and Dissertations--Public Health (M.P.H. & Dr.P.H.) by an authorized administrator of UKnowledge. For more information, pleasecontact [email protected].
Recommended CitationSiegel, Miriam, "Neurotoxic Effects of Occupational Exposures in Agricultural Workers" (2016). Theses and Dissertations--Public Health(M.P.H. & Dr.P.H.). 103.https://uknowledge.uky.edu/cph_etds/103

STUDENT AGREEMENT:
I represent that my thesis or dissertation and abstract are my original work. Proper attribution has beengiven to all outside sources. I understand that I am solely responsible for obtaining any needed copyrightpermissions. I have obtained and attached hereto needed written permission statements(s) from theowner(s) of each third-party copyrighted matter to be included in my work, allowing electronicdistribution (if such use is not permitted by the fair use doctrine).
I hereby grant to The University of Kentucky and its agents the non-exclusive license to archive and makeaccessible my work in whole or in part in all forms of media, now or hereafter known. I agree that thedocument mentioned above may be made available immediately for worldwide access unless apreapproved embargo applies.
I retain all other ownership rights to the copyright of my work. I also retain the right to use in futureworks (such as articles or books) all or part of my work. I understand that I am free to register thecopyright to my work.
REVIEW, APPROVAL AND ACCEPTANCE
The document mentioned above has been reviewed and accepted by the student’s advisor, on behalf ofthe advisory committee, and by the Director of Graduate Studies (DGS), on behalf of the program; weverify that this is the final, approved version of the student’s dissertation including all changes requiredby the advisory committee. The undersigned agree to abide by the statements above.
Miriam Siegel, Student
Wayne Sanderson, PhD, MS, Major Professor
Wayne Sanderson, PhD, MS, Director of Graduate Studies

Neurotoxic effects of occupational exposures in agricultural workers
DrPH Capstone
Miriam Siegel, MPH
University of Kentucky
College of Public Health
Department of Epidemiology

Committee:
Wayne Sanderson, PhD (Chair)
Steve Browning, PhD
Bin Huang, DrPH
Acknowledgements:
Central Appalachian Regional Education and Research Center (CARERC)
Fred Gerr, MD
Sarah Starks, PhD
Jane Hoppin, ScD

TABLE OF CONTENTS
ABSTRACT
I. INTRODUCTION
Problem statement
Literature review
Specific aims
II. AIM 1 ANALYSIS: Occupational exposures and
depressive symptoms in agricultural workers
Background
Methods
Results
Summary of findings
III. AIM 2 ANALYSIS: Organic solvent exposure and
neurobehavioral function in agricultural
workers
Background
Methods
Results
Summary of findings
IV. DISCUSSION
Weight of the evidence
Strengths and limitations
V. PUBLIC HEALTH IMPLICATIONS AND
CONCLUSIONS
REFERENCES
TABLES
APPENDICES
Page
i
1
1
2
11
13
13
13
19
24
26
26
26
32
35
36
36
40
46
49
55
66

i
ABSTRACT
Background: Pesticides and organic solvents are two classes of neurotoxic substances regularly
used in agriculture. Pesticides have been studied in relation to a range of nervous system effects,
and have been repeatedly shown to relate to depression in agricultural workers. Likewise,
occupational solvent exposure is recognized as a risk factor for central nervous system effects,
including mood disturbances and cognitive impairment, across various industries. Many gaps in
knowledge regarding the effects of chronic exposure to these substances on mental/neurological
health in agricultural workers still exist. The specific aims of the current analysis were to 1.)
Estimate associations between metrics of a.) pesticide exposure and b.) organic solvent exposure
and results from the Center for Epidemiologic Studies Depression Scale of depressed mood; and
2.) Estimate associations between questionnaire-based organic solvent exposure metrics and
measures of central nervous system function assessed from a battery of nine neurobehavioral
tests.
Methods: This was a cross-sectional analysis of a subsample of 701 licensed pesticide
applicators (i.e., the Neurobehavioral Testing Study add-on) that participated in the Agricultural
Health Study (AHS) in Iowa and North Carolina and were evaluated for neurobehavioral (NB)
performance between 2006 and 2008. Participants eligible for the NB Study were male farmers
that completed all phases of AHS questionnaires. Further exclusion criteria excluded AHS
participants with a diagnosis of various medical conditions, as well as those who reported
drinking >42 alcoholic beverages/week, reported pesticide poisoning at AHS Phase 3, or lived
>150 miles away from testing facilities. Stratified random sampling was conducted among
eligible participants to provide adequate representation of individuals with higher lifetime use of
selected organophosphate pesticides. A total of 1,807 AHS participants were subsequently
eligible for the NB Study, of which 39% participated. Ever-use and cumulative use of pesticide
information was compiled from all phases of the AHS for 16 specific organophosphates, 4
specific carbamates, all-organophosphate pesticide use, all-pesticide use, and high pesticide
exposure events (HPEEs). At the time of neurobehavioral evaluation, solvent exposure was
assessed in a questionnaire. An ever-use and categorical years of use variable based on the
median years of exposure for each measure were derived for gasoline, paint/lacquer thinner,
petroleum distillates, and use of any solvent (sample sizes for benzene, toluene, and turpentine
were not large enough to evaluate). Three solvent-based activity variables ascertained at
enrollment were also evaluated (ever-use of solvent additives in mixing pesticides, ever-use of
gasoline to clean hands or equipment, and ever-use of other solvents for cleaning). Depressive
symptoms were measured using the Center for Epidemiologic Studies Depression Scale (CES-
D). Various neurobehavioral functions, including attention, visual scanning/processing, motor
speed, motor coordination, learning, memory, and motor speed/scanning were evaluated using a
battery of nine tests administered by trained professionals. Multivariable linear regression was
employed to estimate the association between each measure of pesticide exposure and solvent
exposure and CES-D score; as well as each measure of solvent exposure and performance on
each neurobehavioral test.
Results: Direction of associations between pesticide exposure measures and CES-D score were
inconsistently positive and negative. However, few specific pesticide measures were found to be
significantly associated with CES-D score (p<0.05). Disulfoton and ethoprop were consistently

ii
associated with greater depressive symptoms when examined as ever-use and cumulative
lifetime days of use. HPEE was also associated with greater depressive symptoms. Dichlorvos
appeared to consistently relate to less depressive symptoms when assessed as ever-use and
cumulative lifetime days of use; ever-use of malathion showed a similar effect, but not when
characterized as cumulative use. More statistically significant (p<0.05) effects of pesticide
exposure were seen when evaluating CES-D as a continuous versus binary outcome. Forty-one
percent of participants reported any solvent exposure. Solvent exposure measures consistently
appeared to be risk factors for greater depressive symptoms. Several variables involving any
solvent use, gasoline use, and petroleum distillate use showed statistically significant positive
associations with CES-D score. More effects of solvent exposure were seen when evaluating
CES-D as a continuous rather than binary outcome. No clear pattern of association existed
between solvent exposure and general neurobehavioral function. Several negative associations
were found between gasoline and painter thinner exposure and tests assessing motor speed.
Petroleum distillate measures appeared to relate to better performance on a test evaluating motor
coordination. Performance on tests of attention, memory, learning, and visual
scanning/information processing did not appear to be substantially affected by solvent exposure.
Conclusions: Results from the current study may suggest relationships between neurotoxic
chemicals, such as some pesticides and organic solvents, and mental/neurobehavioral health
outcomes that exist on a linear scale. This study serves as a justification for further research as
well as early behavioral interventions in agricultural workers. That is, because subtle changes in
central nervous system function can occur with exposures that may exist on a sub-clinical level,
efforts should be taken to minimize exposure and prevent further progression that could
eventually lead to clinical disorders.

Siegel
1
INTRODUCTION
Problem Statement
The National Institute for Occupational Safety and Health (NIOSH) has considered
neurotoxic disorders one of the ten leading causes of work-related disease and injury since 1983
based on four reasons: the large number of chemicals characterized by neurotoxic properties; the
vulnerability of the nervous system to damage; the large number of workers exposed to
neurotoxic substances; and the importance of a healthy nervous system for daily functioning and
subsequent potential severity of neurotoxic disorder. It has been estimated that approximately
eight million workers may be exposed full-time to neurotoxic agents.1 Neurotoxic effects occur
from a large range of chemicals, especially those lipid-soluble in nature, and a large variation of
central nervous system (CNS) disturbances may result. The extent of exposure to neurotoxic
substances within U.S. workers in unknown, and existing systems for health and safety
surveillance do not adequately measure the range of effects produced by such substances. CNS
changes can lead to workplace accidents and greatly influence quality of life.1 The agricultural
industry provides workers with opportunity for exposure to various neurotoxic substances,
including pesticides and organic solvents.2,3 There is a deficit of research that focuses on
neurological symptoms in farmers exposed to these substances.
Several national and international agencies recommend a battery of screening tests for the
evaluation of neurotoxicity of substances in humans.1,4 NIOSH and the National Academy of
Sciences have supported that neurotoxicity test data is inadequate.1 Additionally, NIOSH calls
for research on the magnitude of neurotoxic effects that have been identified.1 Much of the past
research on occupational exposures in farmers, particularly on pesticides, has relied on report of
a diagnosis of neurological disorders.3,5-7 However, small changes in mental or behavioral

Siegel
2
functioning induced by chemicals are often undiagnosed or unrecognized.3,8 Neurologic
symptoms may indicate early signs of dysfunction before clinically measurable signs appear.9
The proposed study uses a battery of neurobehavioral tests as well as a valid, reliable, and
internally consistent diagnostic scale for depressive mood10 to not only accurately record
symptoms and function, but also measure the magnitude of neurological effects on continuous
scales.
Research regarding risk factors for central nervous system dysfunction in agricultural
workers will contribute to policy and practice to better protect an industry of workers that are
shown to experience high rates of mental health problems.9,11,12 It will inform occupational
health and safety standards, worker practice, education and training programs, as well as
exposure and medical monitoring/surveillance. Specifically, quantifying the severity of
depressive symptoms to which agricultural workers may be vulnerable due to various aspects of
pesticide and organic solvent exposures would support knowledge of how depression develops in
agricultural workers. Additionally, evaluating risk for solvent-induced neurobehavioral
dysfunction in agricultural workers could identify an area for increased awareness, caution,
training, and protection in agricultural practice.
Literature Review
Neurotoxic disorders are one of the ten leading causes of work-related disease and injury
due to the widespread use of neurotoxic substances and the potential adverse effects that have
implications on work and life.1 Two classes of neurotoxic substances regularly used in
agriculture include pesticides and organic solvents.1,3,9 For example, pesticides have been studied
in relation to a range of nervous system effects, and have been repeatedly shown to relate to

Siegel
3
depression in agricultural workers.5,6,9,10,13-16 Likewise, occupational solvent exposure has been
consistently shown to induce many variations of chronic central nervous system disorders in
various industries.3,17-20 However, many gaps in knowledge regarding the neurotoxicity of
agricultural exposures still exist. A majority of studies on depression in relation to pesticide
exposure have relied on self-report of physician-diagnosed depression,5,6 and a few have used
criteria from diagnostic screening tests, but in a dichotomized fashion (i.e., depressed vs. non-
depressed).10,13 However, diagnostic scales have been underutilized in determining the
magnitude of depressive symptoms on a continuous incremental scale experienced by
agricultural workers; and how depressive symptoms may relate to acute high-level or chronic
low- to moderate-level pesticide exposure. Additionally, there is an even larger gap regarding
neurobehavioral outcomes attributed to solvent use specifically in agricultural workers; although
tasks that require solvents are regularly performed by farmers, and farmers often hold secondary
jobs involving solvent exposure.2,21-23
Neurotoxic manifestations of pesticide exposure
Farmers are shown to suffer from high rates of depression, anxiety, and reduced mental
health-related quality of life.11,12,24-26 Estimates of depression prevalence in farmers have ranged
between about 8% and 20%, compared to a national prevalence of approximately 8%.6,27 Many
risk factors for depression exist in this population that are often out of the farmer’s control,
including financial strain, social isolation, long and physically demanding work requirements,
working conditions and processes that rely on variable weather, and health comorbidities.10-12,28
Exposure to neurotoxic substances, however, can be limited with appropriate engineering
controls, worker practices, and use of personal protective equipment.

Siegel
4
Farmers are vulnerable to substantial pesticide exposure; approximately 70% of
insecticides used in the U.S. are used in agriculture.29 These substances, such as
organophosphate pesticides, can induce neurotoxicity due to an inhibition of
acetylcholinesterase, leading to overabundant amounts of acetylcholine remaining in
neurotransmitter synapses, which can cause damage over time; as well as a possible disruption of
serotonin, leading to mood or behavioral changes.10,30,31 Signs of toxicity can be observed when
at least 20% of the acetylcholinesterase activity is inhibited; and rat models have supported that
chronic inhalation exposure to the organophosphate dichlorvos over two years can deplete more
than 90% of the enzyme’s activity. But evidence supports that the most important predictor of
toxicity is how rapidly the acetylcholinesterase inhibition occurs, which has a direct impact on
the adaptation abilities of the nervous system.32 Organophosphates, carbamates, organochlorines,
pyrethroid insecticides, herbicides, fungicides, and fumigants have been supported to induce a
range of neurologic effects and complaints, from mood disorders to central and peripheral
nervous system disruptions.9,15,16,33,34
Cumulative exposure to various specific pesticides, pesticide poisoning, high pesticide
exposure events, and pesticide classes including organophosphates, insecticides,
organochlorines, and fumigants have been found to relate to self-reported physician-diagnosed
depression.5-7,35,36 For example, self-reported physician-diagnosed depression was found to be
associated with ever-use of fumigants, herbicides, organochlorines, organophosphates, and some
specific carbamates in a longitudinal analysis of Agricultural Health Study (AHS) participants.5
Additionally, the ever-use of some specific organophosphates, including diazinon, malathion,
and parathion were consistent risk factors for depression.5 Similarly, a cross-sectional study of
AHS participants demonstrated pesticide poisoning and high pesticide exposure events to be risk

Siegel
5
factors for a diagnosis of depression (odds ratios=2.57, 1.65, respectively); cumulative exposure
to all pesticides was not found to be associated with depression until poisoning cases were
excluded.6 A study of agricultural workers in France found an association between herbicide use
and self-reported treatment/hospitalization for depression, but not for insecticides or fungicides.36
Two studies that focused on wives participating in the AHS supported pesticide poisoning and
husbands’ ever-use of carbamates to be associated with a diagnosis of depression, but not wives’
ever-use or cumulative use of pesticides or husbands’ use of other pesticides.7,35 Relying on self-
report of diagnosed depression may result in misclassification due to misreporting or an under-
diagnosis of the condition.
On the other hand, several studies have evaluated depression by using self-report or
clinical measures of symptomology as opposed to report of diagnosis. For example, an AHS
study evaluated complaints of neurologic symptoms reported by pesticide applicators and found
associations between report of high- versus low-frequency of depressive symptoms and high
cumulative use of any pesticide, all insecticides, organophosphates, organochlorines, and
fumigants.9 Depressive symptoms relied on self-report as opposed to clinical ascertainment, and
symptoms were not evaluated on a continuous scale. Cross-sectional and longitudinal analyses of
Colorado farm residents have found pesticide poisoned participants to be between two and nearly
five times more likely to score high vs. low on the clinical Center for Epidemiologic Studies
Depression Scale of depressed mood (using a threshold score of 16).10,13 A study of sheep
farmers in the UK chronically exposed to low levels of organophosphates were more likely to
exhibit clinical depression as assessed by the Hospital Anxiety and Depression Scale when
compared to rural police officer controls.33 Another study on sheep farmers found an association
between clinical depression, as determined by the PHQ-9 Depression scale, and pesticide

Siegel
6
poisoning, but not for ever-use of pesticides.37 While an analysis of depressive symptoms
obtained from the clinical Brief Symptom Inventory (BSI) showed that the median scores of
depression in both organophosphate and carbamate poisoned banana farmers were higher than in
the referent group, a multivariable model employed a threshold BSI cutoff to demonstrate that
reporting multiple pesticide poisonings was associated with an elevated depression score.38
Therefore, a majority studies evaluating pesticide exposure and clinically-screened depression
have typically relied upon dichotomous outcomes.
The magnitude of incremental changes in depressive symptoms in relation to chronic
low- or moderate-level pesticide exposure in a diverse sample of farmers is not well-established.
Using a valid, reliable, and internally consistent diagnostic scale for depressive mood, such as
the Center for Epidemiologic Studies Depression Scale (CES-D),39 would allow for an
evaluation of the severity of symptoms that may exist on a sub-clinical or undiagnosed level.
This is particularly important because farmers have been found to be reluctant to seek treatment
for mental health conditions despite displaying depressive symptoms.6,40 Furthermore,
employing a continuous scale for depressive symptoms may allow the examination of subtle
changes that may not otherwise be detectable with a binary classification for depression.
Quantifying the extent to which chronic low- to moderate-levels of exposure may relate to
depressive symptom severity could inform monitoring and evaluation programs to better protect
the mental health of agricultural workers and provide opportunities for intervention of modifiable
risk factors.
Neurotoxic manifestations of organic solvent exposure

Siegel
7
Organic solvents constitute a wide variety of organic chemicals that differ variably in
structure, such as carbon disulfide, n-hexane, methyl n-butyl ketone, toluene, benzene, xylene,
and trichloro-ethylene.1,2,20,41 Due to their lipid-solubility, solvents are readily absorbed, can
cross the blood-brain barrier, and subsequently undergo biotransformation. Resulting
metabolites, which can often have greater toxicity than their parent compounds, accumulate in
lipid-rich tissues such as those found in the nervous system.17,42 However, the specific
mechanism that leads to neurotoxic effects is not well understood.43 For example, one animal
study on rats exposed to unleaded gasoline found reductions in neurotransmitters norepinephrine,
dopamine, and serotonin (which is linked to mood disorders), and, as seen in organophosphate
exposure, a reduction in acetylcholinesterase activity.44
Solvents that can produce CNS disorders are present in a variety of occupational sources,
including paints, varnishes, lacquers, stains, glues, adhesives, gasoline, and cleaning/degreasing
agents.1,17 Chronic exposure to solvents can lead to chronic solvent-induced encephalopathy,
which is defined by mild to severe cognitive impairment.3,41,43,45 Additionally, there are several
categories of recognized solvent-induced CNS disorders according to severity as defined by the
International Solvent Workshop.17,18,46 Type 1 is characterized by fatigue, memory impairment,
irritability, difficulty in concentrating, and mild mood disturbances. Type 2A includes sustained
personality or mood changes, such as emotional instability and diminished impulse control and
motivation. Type 2B involves impairment in intellectual function manifested by diminished
concentration, memory, and learning capacity. Type 3 categorizes severe and pronounced
neurologic effects that are not typical of occupational exposures.17 Workers that come into
regular contact with such substances have been shown to be at a higher risk for Type 1, Type 2A,
and Type 2B neurobehavioral dysfunction than unexposed workers in studies on a variety of

Siegel
8
different industries.17 While these classifications may constitute overt clinical outcomes, research
has also identified the importance of chronic low solvent exposures in inducing subtle
neurobehavioral effects.8 Furthermore, a global reduction in solvent exposures attributed to
better occupational hygiene practices has led to milder or less obvious chronic solvent-induced
encephalopathy symptoms, which contributes to an underdiagnoses of the condition.18,20,47,48
Therefore, subtle neurotoxic effects induced by solvent exposure should be studied using
validated neurobehavioral tests.
Studies of neurotoxic effects of chronic chemical exposures in farmers have mainly
focused on pesticide exposure.14-16,31,49 However, maintenance and repair of farm machinery and
equipment are primary regular tasks performed by farmers, and often require use of solvent-
based materials (e.g., paints, adhesives, gasoline, degreasers, lubricants, etc.).2,50,51 While studies
on solvent exposures in agricultural workers have evaluated correlations with some health
outcomes,21,52 those focusing on neurotoxic effects of solvent exposures are scarce. A study on a
rural population of both farming and non-farming individuals in Ecuador found years of
exposure to solvents to be associated with several neurobehavioral outcomes in mixed
directions.53 Solvent use was associated with improved visual perception/memory (Benton
Visual Retention test), negatively associated with psychomotor performance (Trails B test), and
positively associated with manual dexterity (Santa Anna test). Among the non-significant
associations, no relationship was found between solvent use and performance on the Profile of
Mood States (POMS), which includes a depression component. However, the evaluation of
solvent exposure in this study was not specific to the farming group alone, and only used one
general metric of exposure.

Siegel
9
While there is a deficit of research pertaining to agricultural workers, the neurotoxic
manifestations of solvents have been extensively researched in a wide variety of other
occupations.47 Many of these studies employ validated clinical scales to evaluate these
associations. For example, in relation to mental health, one study found that rotogravure printers
exposed to toluene displayed higher depression scores on the Symptom Checklist (SCL-35) than
controls 20 years after exposure.54 A study on solvent-exposed munitions workers and mental
health outcomes consistently found significantly higher mood/emotional impairment across a
variety of clinical tests in the solvent-exposed group versus unexposed controls, and exposure-
response associations with years of exposure.55 Likewise, presence of exposure and duration of
exposure were both positively associated with tension-anxiety, hostility, depression, and
confusion domains presented on the POMS scale in a study of Venezuelan adhesive factory
workers exposed to organic solvent mixtures.56
On the other hand, some occupational studies have found null results regarding solvents
and mental health-related outcomes. An assessment of gun factory workers found no difference
in Hospital Anxiety and Depression scores between those with long-term low-level exposure to
solvents and those with no exposure.57 Similarly, acetone-exposed acetate fiber workers
demonstrated similar scores on the Manifest Anxiety Scale and Self-Rating Depression Scale as
unexposed controls.58 The effects of occupational solvent exposure on mental health and
depression warrants further research.
In addition to mental health, other CNS outcomes have been studied in relation to solvent
exposure using a large variety of clinical scales. Since the range of neurobehavioral domains that
may be affected by neurotoxic exposures is extremely wide, researchers typically administer
batteries of tests. The Neurobehavioral Evaluation System (NES) is a computerized battery that

Siegel
10
includes over a dozen neurobehavioral tests of psychomotor speed and control, perpetual speed,
learning, attention, and affect.59 Many occupational studies have employed the NES battery or
similar adaptations to evaluate the range of CNS effects in solvent-exposed workers.56,58,60-67 For
example, a study on shipyard painters in Korea found visual scanning/processing speed (Symbol
Digit Substitution test) to be worse in those with more than 20 years of work duration compared
to the group with less than 10 years of work duration after controlling for age and education; no
associations were found for measures of psychomotor speed.60 A study of paint factory workers
in Taiwan used environmental sampling to compare no-, low-, and high-exposure groups and
found associations with increasing exposure and poorer performance on measures of sustained
attention (Continuous Performance test), processing speed (Pattern Comparison test), and visual
memory (Pattern Memory test).61 There were no associations for eight other administered
neurobehavioral tests. Likewise, a study of union painters in Michigan found that increasing
solvent exposure ascertained by questionnaire was related to poorer visual scanning/processing
speed (Symbol Digit Substitution test) and memory (Pattern Memory test, Digit Span test), but
not psychomotor speed (Simple Reaction Time).62 Deficits in visual scanning/processing
(Symbol Digit Substitution), psychomotor speed (Simple Reaction time), and manual dexterity
(Santa Anna test) have also been found in Venezuelan adhesive factory workers when compared
to controls, and poorer performance correlated with years of exposure. Null associations were
found for tests of memory (Digit Span, Benton tests) and motor control/speed (Pursuit Aiming
test).56
In light of the potential neurotoxic effects of solvent exposure, a lack of routine use of
adequate personal protective equipment (PPE) during farm activities by agricultural workers is
concerning.2,68 Both inhalation and dermal exposure are potential routes of exposure. A pilot

Siegel
11
study in Kentucky supported that farm tasks involving solvents are often performed indoors
and/or without PPE. Dermal patches detected very high levels of xylene and toluene, although n-
hexane and benzene were also detected.2 Additionally, at least 22-28% of agricultural workers
surveyed from North Carolina and Iowa reported cleaning equipment with solvents at least once
a month; 8% reported mixing solvents with pesticides, and 16% reported using solvents in off-
farm jobs.23 Therefore, agricultural workers are at risk for neurotoxic effects induced by solvents.
Research on the extent to which this occupational population may experience solvent-induced
CNS effects would contribute to an understanding of worker practices involving solvents and
potential implications for strategies to reduce exposure and prevent adverse effects.
Specific Aims
The current study was a cross-sectional analysis of the central nervous system effects
related to chemical exposures for which agricultural workers are at risk. As mentioned,
neurotoxic disorders are a leading cause of workplace-related illness and injury in the U.S.
because of the widespread use of neurotoxic substances and the potential for work and life
impairment due to central nervous system dysfunction. Examples of central nervous system
effects include mood disorders, such as depression, and impaired neurobehavioral functions,
such as learning, memory, attention, and motor coordination. Pesticides and organic solvents are
supported to be neurotoxic, and the abovementioned literature shows that both are regularly used
by agricultural workers. Research has supported that pesticides are associated with depression,
both physician-diagnosed and diagnostic scale-confirmed, in agricultural workers. The quantified
magnitude of symptoms related to pesticide exposure is less supported. Additionally, solvents
have consistently been reported to induce a range of mood disruptions and neurobehavioral

Siegel
12
deficits; however, the relationship between solvent exposure and CNS effects in agricultural
workers has scarcely been an area of focus in the literature. Therefore, the specific aims of the
current analysis were as follows:
Aim 1: A.) Estimate associations between metrics of pesticide exposure and results from the
Center for Epidemiologic Studies Depression Scale (CES-D) of depressed mood. B.) Estimate
associations between questionnaire-based organic solvent exposure metrics and results from the
CES-D scale of depressed mood. Based on the supporting evidence discussed above, it was
hypothesized that those with neurotoxic exposures would show more depressive symptoms than
those without exposures; furthermore, there would be a positive relationship between cumulative
lifetime exposures and depressive symptoms.
Aim 2: Estimate associations between questionnaire-based organic solvent exposure metrics and
measures of central nervous system function assessed from a battery of nine neurobehavioral
tests. As demonstrated in other occupational groups, it was hypothesized that solvent exposure
would be associated with reduced neurobehavioral function.

Siegel
13
AIM 1 ANALYSIS: Occupational exposures and depressive symptoms in agricultural workers
Background
Pesticides and organic solvents are two classes of neurotoxic substances regularly used in
agriculture.1,3,9 Pesticides have been studied in relation to a range of nervous system effects, and
have been repeatedly shown to relate to depression in agricultural workers.5,6,9,10,13-16 Likewise,
occupational solvent exposure is recognized as a risk factor for central nervous system effects,
including mood disturbances and changes, across various industries.3,17-20 Many gaps in
knowledge regarding the effects of chronic exposure to these substances on depressed mood,
especially as a continuous measure, in agricultural workers still exist. The specific aims of the
current analysis were to estimate associations between metrics of a.) pesticide exposure and b.)
organic solvent exposure and results from the CES-D scale of depressed mood.
Methods
Data Source
The current study was a cross-sectional analysis of the neurological outcomes of a
subsample of 701 licensed pesticide applicators (i.e., the Neurobehavioral Testing Study add-on)
that participated in the Agricultural Health Study (AHS) in Iowa and North Carolina, a
collaborative project from the National Cancer Institute, the National Institute of Environmental
Health Sciences, and the Environmental Protection Agency.14-16,22 Information regarding
exposure to pesticides, demographics, and co-exposures was collected in three phases between
1993 and 2007 for all AHS participants. Phase 1 of exposure data collection was a self-
administered enrollment questionnaire completed at the time of pesticide licensing/recertification
and an additional take-home questionnaire completed by 44% of private pesticide applicators
Siegel
14
(i.e., farmers) between 1993 and 1997. Subsequently, Phase 2 was a 5-year follow-up phone
interview and Phase 3 was a 10-year follow-up phone interview.22,69 Participants eligible for the
Neurobehavioral Testing Study were male (i.e., 99% of AHS sample), AHS participants that
were farmers at enrollment, and completed all three phases of questionnaires. Further exclusion
criteria excluded AHS participants with a diagnosis of amyotrophic lateral sclerosis, diabetes,
multiple sclerosis, Parkinson’s disease, retinal or macular degeneration, hypothyroidism, or
stroke, as well as those who reported drinking at least 42 alcoholic beverages per week, reported
being diagnosed with pesticide poisoning during the Phase 3 interview, or lived greater than 150
miles away from the testing facilities. Random sampling was conducted among eligible
participants using a stratified design that allowed oversampling of individuals with higher
lifetime use of 10 organophosphate pesticides ascertained in Phase 1 (equal sampling from below
and above 75% of exposures in Iowa and 66% of exposures in North Carolina) to assure
representation of high-end exposure. A total of 1,807 AHS participants were subsequently
eligible for the Neurobehavioral (NB) Testing Study, of which 39% participated (N = 701).
Assessment of neurobehavioral function was conducted between 2006 and 2008, occurring no
more than one year after the Phase 3 interview. Participants provided informed written consent
and were compensated for time and travel. Appropriate Institutional Review Boards approved
the study protocol.14-16
Pesticide Exposure Assessment
Pesticide exposure was obtained by the AHS and NB Study questionnaire through self-
report of frequency and duration of use of specific pesticides, high pesticide exposure events, and
pesticide poisoning.9,15,22 Pesticide exposure information was ascertained in slightly different

Siegel
15
ways for each phase/questionnaire: Phase 1 involved reporting ever-use, frequency of use, and
years of use for 50 specific pesticides at enrollment and a checklist regarding ever-use of specific
chemicals in the take-home questionnaire; Phases 2 and 3 involved open-ended responses in
regards to pesticide use since last interview; and the NB Study questionnaire ascertained
pesticide ever-use and days of use information for the past 12 months. All pesticide exposure
occurred prior to NB testing.15,16
The current analysis evaluated 16 organophosphate (OP) pesticides (acephate,
chlorpyrifos, coumaphos, diazinon, dichlorvos, dimethoate, disulfoton, ethoprop, fonofos,
malathion, parathion, phorate, phosmet, tebupirimfos, terbufos, and tetrachlorvinphos) and four
carbamate pesticides (aldicarb, benomyl, carbaryl, and carbofuran) that were sufficiently
represented among participants in the NB Study (ever-use N>50). All OP pesticides were
introduced at either enrollment or the take-home questionnaire in Phase 1, with the exception of
tebupirimfos, which was reported initially at Phase 2 after being introduced in 1995. For each
individual pesticide, a dichotomous (i.e., ever- vs. never-use at any interview) and a continuous
(i.e., cumulative lifetime days of use across all interviews) variable were evaluated. Cumulative
days of use for Phase 1 was determined by multiplying the number of days used per year by the
number of years used (with the pesticides first reported in the take-home portion assumed to
have days used per year and years used equal to the median number of days used per year and
years used for all insecticides reported at enrollment for each individual); and determined
individually for Phases 2 and 3 and the NB Study questionnaire by multiplying the number of
days used per year by years since last interview. Subsequently, these cumulative values were
summed for a cumulative lifetime days of use estimate for each pesticide. In addition to the ever-
use variable and cumulative lifetime days of use variable for each of the 20 identified pesticides
Siegel
16
(16 OPs and 4 carbamates), a summary variable reflecting cumulative lifetime days of use for all
OP pesticides, a summary variable reflecting cumulative lifetime days of use for all pesticides
(i.e., any of the 50 pesticides included in Phase 1), and a dichotomous variable indicating
whether or not a participant had ever experienced a high pesticide exposure event (HPEE)
(reported in Phase 1, 2, or 3) were also evaluated. Because cumulative exposure variables tend to
be heavily skewed right, log10-transformed cumulative lifetime days of exposure variables were
employed in the regression analyses to normalize residuals.15,16 Therefore, in total, there were 43
measures of pesticide exposure.
Organic Solvent Exposure Assessment
Organic solvent exposure was assessed in the NB Study questionnaire by ascertaining
ever-use and years of use for six individual measures of exposure: gasoline, paint/lacquer
thinner, turpentine, benzene, toluene, and petroleum distillates. Specifically, the question was
phrased: “Have you ever worked with or been exposed to any of the following chemicals for 8
hours a week or more in a past job, your present job, or at home (i.e. hobbies).” Two summary
variables were also evaluated: ever-use and cumulative years of use of any solvents. The number
of years used for each continuous measure was categorized based on the median number of years
of exposure for those reporting ever-use for each respective measure; resulting in a categorical
variable for each measure including never-use (referent), years of use at or below the median
(i.e., low duration), and years of use above the median (i.e., high duration). The number of
respondents for benzene, toluene, and turpentine were not large enough to include in the analysis
(N=18, 11, and 5, respectively). Three dichotomous variables ascertained at AHS enrollment
(i.e., Phase 1) were also assessed: ever-use of solvent additives when personally mixing

Siegel
17
pesticides; ever-use of gasoline to clean hands or equipment; and ever-use of other solvents for
cleaning. Therefore, in total, seven ever-use variables and four categorical years of use variables
were examined.
Outcome Measure
Depressive symptoms were measured at the time of the NB Study using the Center for
Epidemiologic Studies Depression Scale (CES-D), a widely-used self-report scale designed to
evaluate current level of depressive symptomology related to depressed affect, positive affect,
somatic and retarded activity, and interpersonal relations. The scale has consistently
demonstrated validity, reliability, and internally consistency.39 Participants were asked to “please
indicate how often you’ve felt this way during the past week” in regards to 20 items representing
personal feeling or behaviors listed on a questionnaire. Individual items are self-reported on a
Likert scale with 0 representing rarely or none of the time and 3 representing most or all of the
time (5-7 days). Total scores range from 0 to 60; higher scores reflect greater levels of depressive
symptoms. Because of the tendency for CES-D score distributions to be heavily skewed right,
log10-transformed CES-D score values were used in any linear regression models to normalize
residuals. A CES-D score of 16 or higher may be indicative of a high risk for clinical depression
or need for treatment,13,39 therefore a dichotomous depression variable was created based on this
threshold (i.e., a score of below 16 indicated low-risk for depression and a score of 16 or above
indicated high-risk for depression) for use in an alternative logistic regression analyses for
comparison with results from the linear analysis.
Statistical Analysis

Siegel
18
Covariates assessed for inclusion in multivariable analyses as potential confounders were
obtained from self-report on the questionnaires. In particular, covariates considered in the
pesticide exposure analysis included state (i.e., Iowa or North Carolina), age in years, education,
marital status, smoking status, alcohol use, personal protective equipment (PPE) use, co-
exposures (i.e., ever-use of organic solvents, welding, or soldering), off-farm job presence, and
head injury.
Covariates considered for the solvent exposure analysis included state, age in years,
education, marital status, smoking status, alcohol use, PPE use, co-exposures (i.e., cumulative
organophosphate exposure or cumulative all-pesticide exposure, ever exposure to welding, and
ever exposure to soldering), head injury, and HPEE. Off-farm job exposure was not considered
due to the non-specificity of source of exposure in the phrasing of the solvent exposure
questionnaire (see Organic Solvent Exposure Assessment) and the main focus of the analysis
being neurotoxicity of solvent exposure in this specific population (i.e., not source of exposure).
Univariate analyses were used to explore the distribution of CES-D scores (characterized
as continuous and high- vs. low-risk dichotomous), pesticide and solvent exposure metrics, and
covariates across the entire sample with frequencies and percentages or means and standard
deviations (or geometric means and geometric standard deviations for skewed distributions)
reported.
Covariates that were individually associated with the log10-transformed CES-D score
outcome at a p-value of less than 0.20 through simple linear regression were included in a base
model selection that sequentially excluded each covariate with a p-value of 0.20 or greater using
a multiple linear regression backward elimination approach; this was conducted using the
specific covariates identified for the pesticide exposure analysis and solvent exposure analysis

Siegel
19
separately. Therefore, two base linear models were generated: one to be employed in the model
of an association between pesticide exposure measures and CES-D score, and one for solvent
exposure measures and CES-D score.
Subsequent multivariable analyses employed linear regression models, one for each
pesticide exposure variable and each organic solvent exposure variable, controlling for qualified
covariates in the base models. The few participants with missing values for variables were
excluded from the appropriate multivariable models. Crude and multivariable (i.e., adjusted) beta
coefficients with standard errors and p-values were calculated for the relationships between each
pesticide variable and CES-D score, as well as each solvent variable and CES-D score.
Similarly, exploratory alternative analyses employed logistic regression using the
dichotomous depression outcome (i.e., high-risk vs. low-risk) to compare continuous vs. binary
classification of depressive symptoms. The same processes of base model selection were
repeated for the logistic regression analyses as were used in the linear regression procedures.
Crude and multivariable odds ratios (ORs) with 95% confidence intervals (CIs) were produced
for the relationships between each pesticide variable and high- vs. low-risk for depression, as
well as each solvent exposure variable and high- vs. low-risk for depression.
All statistical analyses were conducted using SAS software (versions 9.3 and 9.4; SAS
Institute Inc., Cary, NC).
Results
Descriptive Characteristics
Table 1 displays the demographic characteristics of the 701 agricultural workers that
participated in the study. Approximately half of participants were from Iowa (51%) and half

Siegel
20
from North Carolina (49%). The mean age was about 61 years (SD=11.7) and roughly half of the
sample had at least a high school education (49%). A large majority of participants were married
or living as married (89%). Most of the participants were never smokers (57%), followed by past
smokers (36%), and current smokers (7%). A majority of the sample reported drinking 0
alcoholic drinks per week (57%), followed by 1-7 drinks per week (33%), and more than 7
drinks per week (10%). Eighty-six percent of participants reported using PPE. In regards to co-
exposures, 41% of the sample reported solvent exposure, 20% reported welding exposure, and
5% reporting soldering. A majority of the participants did not work an off-farm job (61%). Over
a third of the sample had not experienced a head injury (76%), followed by 13% experiencing a
head injury with loss of consciousness, and 10% reporting a head injury with no loss of
consciousness. More than a third of participants reported no HPEEs (77%).
CES-D Scores
Table 2 exhibits the distribution of CES-D scores across the sample. The mean score was
6.5 (SD=6.4; median=5; range=0 – 44). When applying the threshold of a score of less than 16
vs. 16 or greater, about 92% of the sample had a low-risk for depression and approximately 8%
were high-risk for depression.
Pesticide Analysis
Characteristics of pesticide exposure across the sample are displayed in Table 3, with
geometric means representing the analog of mean log10 values. All but one participant reported
exposure to any pesticides, and 97% reported use of OP pesticides. The most common OP
pesticide reported was malathion (N=541), while the least common was dimethoate (N=66). The

Siegel
21
most commonly reported carbamate exposure was carbaryl (N=440), followed by carbofuran
(N=290), aldicarb (N=131), and benomyl (N=116). Univariate distributions of cumulative
lifetime days of use are shown for those reporting ever-use (Table 3). As mentioned above, a
majority of the sample had not experienced any HPEEs (77%).
Backward elimination linear regression model selection for covariates associated with
CES-D score in relation to pesticide exposure confounding resulted in a base model adjusting for
marital status and solvent exposure; additionally, though not supported by the model selection
procedure, age was included in the final base model due to its well-supported association with
mental health.70,71 See Appendix A for estimates for all covariates. Therefore, the final linear
model used in the multivariable (i.e., adjusted) analysis assessing the relationship between
pesticide exposure and CES-D score was:
Log10 (CES-D score) = β0 + β1[(ever-use of pesticide) or (log10 (cumulative pesticide
exposure))] + β2(age) + β3(marital status) + β4(solvent exposure) + εi
Results for the effects of ever-use of specific pesticides and HPEE on CES-D score are
shown in Table 4. Crude and adjusted estimates were similar. There was no consistent pattern of
directionality of associations. In the adjusted analysis controlling for age, marital status, and
solvent exposure, ever-use of disulfoton and ethoprop were significantly (p<0.05) associated
with greater depressive symptoms (i.e., higher CES-D score); while ever-use of dichlorvos and
malathion were significantly associated with less depressive symptoms. Reporting a HPEE was
associated with greater depressive symptoms. No other ever-use associations reached statistical
significance.

Siegel
22
Crude and adjusted results for the effects of cumulative lifetime days of exposure on
CES-D score were similar (Table 5). No consistent directionality of associations was observed.
Cumulative exposure to both disulfoton and ethoprop were associated with greater depressive
symptoms; while higher exposure to dichlorvos was associated with less depressive symptoms.
No other relationships reached statistical significance.
Several hypothetical examples predicting CES-D score are given in Appendix I. For
example, an individual that is 60 years old, single, reported solvent exposure, and was exposed to
disulfoton for 20 cumulative lifetime days was predicted to have a CES-D score of 7.74; whereas
the same person instead exposed to 56 cumulative lifetime days of disulfoton was predicted to
have a CES-D score of 8.25 (Appendix I.2). One must note that actual CES-D scores are whole
integers, however; the magnitude of difference between scores is the estimate to be interpreted.
Although crude associations existed for dichlorvos, ethoprop, and all OP exposure,
results from the multivariable logistic regression analysis revealed no effects of pesticide
exposures on high- vs. low-risk for depression (adjusted for age, smoking, alcohol use, solvent
exposure, and off-farm job). See Appendix B.
Organic Solvent Analysis
Characteristics of solvent exposure are shown in Tables 6.A and 6.B. Forty-one percent
of the sample reported some solvent exposure, with gasoline exposure most common (32%),
followed by petroleum distillates (25%), and paint thinner (11%). Exposures to benzene, toluene,
and turpentine were all reported by less than 3% of the sample, and were therefore not evaluated
in further analyses. Mean years of use of any solvent, gasoline, paint thinner, and petroleum
distillates were approximately 33, 26, 22, and 29 years, respectively. Furthermore, at enrollment,

Siegel
23
10% of participants reported using solvent additives when mixing pesticides, 41% using gasoline
to clean hands or equipment, and 28% using other solvents to clean. Cumulative exposure to
specific solvent measures was categorized based on medians of exposure distributions, which are
exhibited in Table 6.B. Sample sizes for any solvent use and gasoline use were large enough to
further categorize duration of exposure into smaller levels for exploration in multivariable
analyses (Appendix C).
Backward elimination linear regression model selection for covariates associated with
CES-D score examined in relation to confounding with solvent exposure resulted in a base model
adjusting for state, marital status, and HPEE; additionally, age was again forced into the
multivariable model. See Appendix D for base model estimates.
Results of the crude and adjusted analyses of the effects of solvent exposure metrics on
CES-D score were comparable (Table 7). All estimates revealed a positive estimate for the
relationship between ever-use and duration of exposure and greater depressive symptoms (i.e.,
higher CES-D score). After adjusting for age, state, marital status, and HPEE, the statistically
significant (p<0.05) risk factors for greater CES-D score included ever-use of any solvents, high
duration of any solvent exposure, ever-use of gasoline, ever-use of petroleum distillates, and low
duration of petroleum distillate exposure. Further categorization of duration of any solvent
exposure and cumulative gasoline exposure variables into quartiles failed to show any
different/additional trends in increasing CES-D score with increasing exposure (Appendix E).
Associations between the three solvent-related activity measures collected at enrollment (i.e.,
using solvent additives when mixing pesticides, using gasoline to clean hands or equipment, and
using other solvents to clean) and CES-D score were not statistically significant (Table 7).

Siegel
24
Hypothetical examples predicting CES-D score with solvent exposure can be found in
Appendix I. For example, a 45 year old participant that is married, from Iowa, has not
experienced an HPEE, and has never been exposed to any solvent for 8 hours per week or more
may have a CES-D score of about 4.37; and the same individual with a high duration of any
solvent exposure may have a CES-D score of 5.38 (Appendix I.4). Again, however, CES-D
scores in reality are whole integers; therefore the magnitude of difference between groups should
be interpreted.
Results from the logistic regression analysis indicated that, while all estimates were
positive, many less statistically significant associations existed for the binary CES-D outcome
than were examined in the linear regression analysis. After controlling for age, marital status,
smoking, alcohol use, lifetime organophosphate pesticide use, and HPEE, ever-use of any
solvent was associated with an 80% higher odds of being high-risk for depression relative to
never-use (95% CI: 1.02-3.13) (Appendix F.1). Further categorization of selected solvent
variables also indicated that highest duration of gasoline exposure (i.e., over 45 years) was
associated with a 2.56 times greater likelihood of being high-risk for depression relative to never
use of gasoline (95% CI: 1.05-6.24) (Appendix F.2).
Summary of Findings
Direction of associations between pesticide exposure measures and CES-D score were
inconsistently positive and negative. However, few specific pesticide measures were found to be
significantly associated with CES-D score. Disulfoton and ethoprop were consistently associated
with greater depressive symptoms when examined as ever-use and cumulative lifetime days of
use. HPEE was also associated with greater depressive symptoms. Dichlorvos appeared to

Siegel
25
consistently relate to less depressive symptoms when assessed as ever-use and cumulative
lifetime days of use; ever-use of malathion showed a similar effect, but not when characterized
as cumulative use. Any effects of pesticide exposure were seen when evaluating CES-D as a
continuous rather than a binary outcome.
Unlike the pesticide measures, solvent exposure measures consistently appeared to be
risk factors for greater depressive symptoms. Several variables involving any solvent use,
gasoline use, and petroleum distillate use were positively associated with CES-D score. Again,
more effects of solvent exposure were seen when evaluating CES-D as a continuous rather than
binary outcome.
Interpretation/implications of findings and strengths and limitations of the current study
are discussed in the Discussion chapter.

Siegel
26
AIM 2 ANALYSIS: Organic solvent exposure and neurobehavioral function in agricultural
workers
Background
Sources of organic solvent exposure include paints, varnishes, lacquers, stains, glues,
adhesives, gasoline, and cleaning/degreasing agents. A variety of solvent-induced central
nervous system disorders are recognized by public health agencies, including symptoms of
fatigue; irritability; mild or sustained mood disturbances; personality changes such as emotional
instability, diminished impulse control, and effects on motivation; and impairment in intellectual
function manifested by diminished concentration, memory, and learning capacity.17,18,45 Very
little research evaluating neurotoxicity of solvents in agricultural workers exists, although
maintenance and repair of farm machinery and equipment requiring solvent-based materials are
regular tasks performed by farmers.2,23 Farm tasks involving solvents may often be performed
indoors and without PPE; both inhalation and dermal exposure are of concern.2,72 Therefore,
agricultural workers could be at risk for neurotoxic effects induced by solvents. The current
analysis aimed to estimate associations between questionnaire-based organic solvent exposure
and measures of neurobehavioral (NB) function.
Methods
Data Source
A subsample of 701 licensed pesticide applicators (i.e., the Neurobehavioral Testing
Study add-on) that participated in the Agricultural Health Study (AHS) in Iowa and North
Carolina were evaluated for neurobehavioral performance. Participants eligible for the
Neurobehavioral Testing Study (NB Study) were male farmers that completed all three phases of
Siegel
27
AHS questionnaires. Further exclusion criteria excluded AHS participants with a diagnosis of
amyotrophic lateral sclerosis, diabetes, multiple sclerosis, Parkinson’s disease, retinal or macular
degeneration, hypothyroidism, or stroke, as well as those who reported drinking at least 42
alcoholic beverages per week, reported being diagnosed with pesticide poisoning during the
AHS Phase 3 interview, or lived greater than 150 miles away from the testing facilities. Stratified
random sampling was conducted among eligible participants to provide adequate representation
of individuals with higher lifetime use of selected organophosphate pesticides. A total of 1,807
AHS participants were subsequently eligible for the NB Study, of which 39% participated
(N=701). Assessment of neurobehavioral function was conducted between 2006 and 2008.
Participants provided informed written consent and were compensated for time and travel.
Appropriate Institutional Review Boards approved the study protocol.14-16
Exposure Assessment
Organic solvent exposure was assessed in the NB Study questionnaire by determining
ever-use and years of use for six individual measures of exposure: gasoline, paint/lacquer
thinner, turpentine, benzene, toluene, and petroleum distillates. Two summary variables were
compiled: ever-use and cumulative years of use of any solvents. The number of years used for
each continuous measure was categorized based on the median number of years of use for those
reporting ever-use for each respective measure, resulting in a categorical variable for each
measure including never-use (referent), low duration of use, and high duration of use. The
number of respondents for benzene, toluene, and turpentine were not large enough to include in
the analysis (N=18, 11, and 5, respectively). Three dichotomous solvent-related activity variables
collected at AHS enrollment were also evaluated: ever-use of solvent additives when personally
Siegel
28
mixing pesticides; ever-use of gasoline to clean hands or equipment; and ever-use of other
solvents for cleaning. In summary, seven binary variables and four categorical years of use
variables were examined.
Outcome Measures
Nine outcomes represented various tests of neurobehavioral (NB) function, assessed on a
continuous scale, which were administered to participants in private rooms by trained personnel
blinded to participants’ exposure status during the NB Study. These tests are commonly used in
studies on the effects of neurotoxic substances in humans and represent a wide variety of NB
function.14,15 Eight tests were administered in English from the computerized Neurobehavioral
Evaluation System, Version 3 (NES3).73-76 Additionally, the manual Grooved Pegboard
(Lafayette Instruments, Lafayette, IN)77 test was given. Only dominant hand performance results
are presented for the Finger Tapping and Grooved Pegboard tests because of the similarity in
performance between both hands. Participants unable to complete individual tests in the allotted
time or after two attempts were excluded from the appropriate NB test data and contribute to
varying sample sizes across tests.14,15 Further detail for each test is summarized below.14
A. The Continuous Performance Test evaluated sustained attention. Participants were
asked to press the space bar on a computer keyboard as fast as possible every time the
letter “S” appeared, but no action was to be taken for other letters that appeared. One new
letter appeared on screen every second for 300 seconds. Performance was calculated in
milliseconds as mean reaction time for responding to the letter “S.”

Siegel
29
B. The Digit-Symbol Test assessed visual scanning and information-processing speed. Nine
digit-symbol pairs were displayed across the top of a touchscreen while nine symbols
were displayed across the bottom. Random integers 1-9 individually appeared in the
middle of the screen 36 times and participants were to touch the symbol at the bottom of
the screen that was paired with the integer from the options at the top of the screen as
quickly as possible. Performance was measured as time in seconds taken to complete all
36 items.
C. The Finger Tapping test measured motor speed and dexterity. Participants pressed the
space bar on a computer keyboard as many times as possible using the index finger of
their dominant hand, until instructed to stop. Following a practice trial, four 10-second
trials were administered. Performance was defined as average number of taps across all
four trials.
D. The Grooved Pegboard test evaluated dexterity and fine motor coordination.77 The
manual test was comprised of a metal board with 25 notched pegs and 25 holes with
randomly-positioned slots at their perimeters. Participants inserted the pegs into the slots
as quickly as possible in sequence until all pegs were placed or after three minutes had
passed. Performance was calculated as number of seconds required to place all pegs.
E. Auditory Verbal Learning Test (AVLT) Total Recall assessed verbal learning and
memory. After listening to a recorded list of 12 words, participants were asked to repeat
as many of the words as they could remember aloud. Three trials were conducted using
identical words lists. Performance was measured as total number of correct responses for
all three trials, ranging from 0 to 36.

Siegel
30
F. The AVLT Delayed Recall test measured memory and was conducted approximately 20
minutes after completion of the AVLT Total Recall test. Participants were asked to recall
as many words as possible from the original 12-item list aloud. Performance was defined
as the number of correct words identified, ranging from 0 to 12.
G. The AVLT Recognition test followed the AVLT Delayed Recall and also evaluated
memory. A recorded list of 24 words comprised of the 12 words previously presented and
12 new words were presented in random order. Participants were to identify only words
from the original list. Performance was calculated as the number of true positives minus
the number of false positives, ranging from -12 to 12.
H. The Sequences A test assessed motor speed and tracking and involved a touchscreen
with circles containing the letters “A” through “U” displayed in random order.
Participants were asked to touch the circles in alphabetical order as quickly as possible.
Performance was measured as time in second taken to complete the sequence correctly.
I. The Sequences B test also measured motor speed and tracking and followed the
Sequences A test. Circles containing numbers “1” through “11” and letters “A” through
“J” were displayed on the touchscreen in random order. Participants were instructed to
touch the circles in sequence but alternate between number and letter in numerical and
alphabetical order as quickly as possible. Performance was defined as time in seconds
taken to complete the sequence correctly.
Statistical Analysis
Covariates considered for confounding were obtained from self-report on the
questionnaires as well as performance on several measures during the NB Study. In particular,
Siegel
31
covariates considered included state, age in years, education, marital status, smoking status,
alcohol use, PPE use, co-exposures (i.e., cumulative organophosphate exposure or cumulative
all-pesticide exposure, ever exposure to welding, and ever exposure to soldering), caffeine
consumption, head injury, height in centimeters, anti-depressant use, visual acuity measured
using the Optec 1000 (Stereo Optical Co, Chicago, IL) during the NB Study examination, and
performance on several measures from the NES3 including Adult Reading Test (ART) ability
(scored 0-60) and positive and negative affect (scored 1-5) from the Positive and Negative Affect
Schedule.14,15,73-75,78
Univariate analyses were used to explore the distributions of performance on
neurobehavioral tests, solvent exposure metrics, and covariates across the entire sample with
frequencies and percentages or means and standard deviations reported. Participants previously
determined to have studentized residual values that exceeded the absolute value of 4.0 for each
NB tests were excluded.14,15,79 Two outlier participants were excluded from the Digit-Symbol
test, one participant from the Sequences A test; and one participant from the Sequences B
test.14,15
A base linear model was created for the multivariable analyses for each individual
neurobehavioral outcome. Specifically, covariates that were individually associated with an
outcome at a p-value of less than 0.20 were included in a base model selection that sequentially
excluded each covariate with a p-value of at least 0.20 using a multiple linear regression
backward elimination approach. Nine separate base models were generated: one for each
outcome.
Subsequent multivariable analyses employed linear regression models assessing the
relationship between each separate solvent measure and each separate neurobehavioral outcome

Siegel
32
controlling for qualified covariates in the base models. Participants with missing values for
variables were excluded from the appropriate multivariable models. Crude and multivariable
(i.e., adjusted) beta coefficients with standard errors and p-values were calculated. Beta
coefficients of the timed NB tests (Continuous Performance Test, Digit-Symbol, Grooved-
pegboard, Sequences A and Sequences B) were multiplied by -1 for consistency in interpreting
the direction of associations across all outcomes (i.e., negative beta coefficients indicate poorer
NB performance with ever/increasing exposure).
All statistical analyses were conducted using SAS software (versions 9.3 and 9.4; SAS
Institute Inc., Cary, NC).
Results
Characteristics of the Sample
In addition to demographic characteristics explained in the previous analysis, 75% of the
sample reported regular caffeine consumption, and 93% were not taking anti-depressant
medications. The average height was 179 centimeters (SD=6.5), the average ART reading score
was 29.9 (SD=10.2), and average positive and negative affect scores were 3.5 (SD=0.7) and 1.4
(SD=0.4), respectively. A majority of the sample (84%) had good vision (20/20-20/40). See
Table 1.
Distributions of solvent exposure across the sample are shown in Tables 6.A and 6.B;
41% of the sample reported exposure to any solvents and sample sizes for each specific solvent
or solvent-related activity varied. Performance scores for the nine NB tests are summarized in
Table 8. Sample sizes varied due to incomplete tests from some participants. Performance was

Siegel
33
similar to previous general-population studies, as discussed in a previous study of this
population.15
Linear Regression Results
After selecting base models, each NB outcome was associated with a specific set of
covariates, which are listed in Table 9. Base model association estimates for each covariate and
each outcome are exhibited in Appendix G.
Crude associations between solvent exposure and NB performance are displayed in Table
10. Negative beta estimates indicated poorer performance on NB tests, while positive estimates
indicated better performance. Many significant (p<0.05) crude associations existed between
measures of ever-use of solvents and duration of solvent exposure and all NB performance
outcomes (N = 39), particularly in regards to any solvent exposure and gasoline exposure.
Furthermore, a majority of the crude associations were negative (N=35), reflecting poorer
performance with increasing exposure. Five crude associations existed between solvent-related
activities ascertained at enrollment and NB performance; directionality was inconsistent.
When adjusting for each set of outcome-specific covariates, a majority of the associations
were no longer statistically significant (p>0.05) (Table 11). In regards to specific measures of
ever-use and duration of exposure, there were no significant associations for the Continuous
Performance Test, Digit-Symbol Test, AVLT Total Recall test, AVLT Delayed Recall test,
AVLT Recognition test, or Sequences B tests. Directionality of all associations for the Finger
Tapping test was consistently negative, but only three associations reached statistical
significance. Ever-use of gasoline, high duration of gasoline exposure, and low duration of paint
thinner exposure groups demonstrated significantly less finger taps than the respective never-use

Siegel
34
groups. All but one of the associations were positive for the Grooved Pegboard test, but only two
reached statistical significance. Ever-use of petroleum distillates and low duration of petroleum
distillate exposure were related to quicker performance relative to never-use of petroleum
distillates. There was inconsistent directionality in associations for the Sequences A test, and the
only significant association involved longer latency in performance for high duration of gasoline
exposure relative to never-use of gasoline. Several additional associations for NB tests were
revealed by further categorizing duration of exposure to any solvent and duration of exposure to
gasoline into smaller levels, such as an additional positive association for the Grooved Pegboard
test involving duration of any solvent exposure, and two associations found for select AVLT
tests (Appendix H).
Among the solvent-related activity measures ascertained at enrollment, three significant
associations existed after controlling for covariates (Table 11). Using gasoline to clean hands or
equipment, using other solvents to clean, and using solvents when mixing pesticides were related
to poorer performance on the Digit-Symbol test, AVLT Recognition test, and Sequences A test,
respectively.
A hypothetical example of the results of the linear regression model involves a 60 year
old male farmer, from Iowa, with a 29 ART score, 3.6 positive affect score, and never exposed to
gasoline predicted to achieve 53.47 finger taps on the Finger Tapping test; the same person
having ever used gasoline would have 51.84 predicted finger taps. Similarly, the same person
with a low duration of gasoline exposure (i.e., <21 years) would have 52.34 finger taps; and the
same person with a high duration of gasoline exposure (i.e., >21 years) would have 51.26 finger
taps (Appendix I.5).

Siegel
35
Summary of Findings
No clear pattern of association existed between solvent exposure and general
neurobehavioral function. Several negative associations were found between gasoline and paint
thinner exposure and tests assessing motor speed. Petroleum distillate measures appeared to
relate to better performance on a test evaluating motor coordination. Performance on tests of
attention, memory, learning, and visual scanning/information processing did not appear to be
substantially affected by solvent exposure. Interpretation/implications of findings and strengths
and limitations are discussed in the Discussion chapter below.

Siegel
36
DISCUSSION
Weight of the evidence
Aim 1.A. Pesticide Exposure and Depressive Symptoms
One aim of the current study was to assess the relationship between pesticide exposure
measures and depressive symptoms assessed on the Center for Epidemiologic Studies
Depression Scale (CES-D). In general, direction of associations between pesticide exposure
measures and CES-D score were inconsistently positive and negative. However, some specific
pesticide measures were found to be significantly associated with CES-D score. Disulfoton and
ethoprop were consistently associated with greater depressive symptoms when examined as both
ever-use and cumulative lifetime days of use. High pesticide exposure event was a risk factor for
greater depressive symptoms. Dichlorvos appeared to relate to less depressive symptoms when
assessed as both ever-use and cumulative lifetime days of use; ever-use of malathion showed a
similar effect, but not cumulative use of malathion. The only associations between pesticide
exposure and CES-D score were demonstrated when evaluating CES-D as a continuous rather
than a binary outcome.
An evaluation of physician-diagnosed depression among pesticides applicators from the
Agricultural Health Study (AHS) found several positive associations with specific carbamates
and specific organophosphates.5 The current study, however, found no associations between
carbamates and depressive symptoms, and some positive and some negative associations among
several specific organophosphates. Discrepancies could relate to differences in outcome
assessment. Another AHS study found pesticide poisoning to be a risk factor for diagnosed
depression, but not cumulative pesticide exposure.6 Analyses of AHS wives also found pesticide
poisoning to relate to diagnosed depression, but not cumulative pesticide use.7,35 Similarly, the

Siegel
37
results of this analysis found high pesticide exposure events (HPEEs) to be a risk factor for
depressive symptoms, and a majority of cumulative measures to show null effects. A study in
France also found no association between insecticide use and self-reported
treatment/hospitalization for depression.36 Studies that have employed measures of depressive
symptoms as opposed to diagnosed depression have supported relationships between chronic
organophosphate exposure and greater symptoms.9,33 Although the findings of the current
analysis were inconsistent with these studies, they are supported by the findings of one study on
sheep farmers, which demonstrated only an effect for pesticide poisoning, but not ever-use of
pesticides in general.37
When concluding a real exposure-response relationship, directional consistency, dose-
response, and consistency with the literature are three factors that should be met. Overall, no
directional consistency was observed for ever-use and cumulative measures of pesticide
exposure, and few significant associations existed. Although inconsistencies also exist in the
literature for the association between various measures of chronic pesticide use and various
measures of depression, the associations found for few specific organophosphate pesticides in
this study may be due to chance and not reflect a real association. On the other hand, pesticide
poisoning has consistently been shown to relate to depression in the literature.6,7,10,13,35,38
Similarly, the current study found high pesticide exposure events to be a significant risk factor
for depressive symptoms, likely supporting evidence for a real exposure-response relationship
for this specific pesticide measure.
While some measures demonstrated statistical significance, the clinical significance of
the magnitude of effects may be called into question. That is, the changes in CES-D associated
with specific pesticide exposure measures are so subtle that they may not be of importance to

Siegel
38
practice. On the other hand, so many of the socio-environmental risk factors for depression
cannot easily be altered by the farmers; therefore, limiting modifiable risk factors for depression
where possible should be considered, such as reducing occupational exposures through safe
workers practices.10-12,28 Furthermore, demonstrating subtle changes in mental health associated
with exposures that are not detected on a threshold-based classification of depression provides
justification for early intervention to prevent further progression toward clinical disorder.
Aim 1.B. Organic Solvent Exposure and Depressive Symptoms
Organic solvent exposure measures appeared to be more consistent risk factors for greater
depressive symptoms than pesticide exposure measures. Several variables involving any solvent
use, gasoline use, and petroleum distillate use were positively associated with CES-D score.
More effects of solvent exposure were seen when evaluating CES-D as a continuous rather than
binary outcome.
Although mental health outcomes associated with solvent exposure have not been studied
in an agricultural population, one study on a rural Ecuadorian population in which approximately
67% of the sample were farm members found no association between general solvent use and
mental health performance on the Profile of Mood States scale.53 The current study, however,
found several associations between more specific solvent use measures and higher depressive
symptoms among an all-farming population. Although some studies in other industries have
found null effects,57,58 there is a large evidence base for research supporting a real association
between presence and duration of solvent exposure and mental health dysfunction as measured
by a variety of scales.54-56 The need for consistency in methods of outcome assessment is
imperative.

Siegel
39
In the evaluation for a real exposure-response relationship, three factors are supported by
the results of this analysis. First, all estimates exhibited a positive direction. Second, some dose-
response was observed; greater depressive symptoms were exhibited by those with exposure or
higher duration of some exposures than those never exposed across several measures. Third, as
explored above, there is an evidence-base in the literature to support this finding.
The results of this analysis can again be disputed for clinical significance in terms of the
small magnitude of effects found. But, as previously discussed, it may be worthwhile to consider
these associations in light of the many unmodifiable risk factors for depression and an
opportunity for early intervention.
Aim 2. Organic Solvent Exposure and Neurobehavioral Function
No clear pattern of association existed between solvent exposure and general
neurobehavioral function. Several negative associations were found between gasoline and painter
thinner exposure and tests assessing motor speed. Petroleum distillate measures appeared to
relate to better performance on a test evaluating motor coordination. Performance on tests of
attention, memory, learning, and visual scanning/information processing did not appear to be
substantially affected by solvent exposure.
As mentioned, this is a new topic of research in that neurobehavioral function has
scarcely been studied in an agricultural population. A sample of rural Ecuadorians, in which 67%
of participants were farm members, was found to exhibit mixed results of neurobehavioral
function associated with general solvent use.53 Specifically, solvent use was related to improved
visual perception/memory, poorer psychomotor performance, and improved manual dexterity.
Several null associations were found for other functions. Similarly, the current analysis found

Siegel
40
mixed effects of solvent use on functions of motor ability; but no effects on other performance
measures. Studies of workers of various other industries have demonstrated negative associations
between solvent exposure and neurobehavioral function evaluated on Neurobehavioral
Evaluation System tests, including poorer visual scanning/processing speed,56,60-62 poorer
sustained attention,61 worse visual memory,61,62 reduced psychomotor speed,56 and poorer
manual dexterity.56 However, many of these studies have also found null effects on other
neurobehavioral functions. The inconsistencies demonstrated across the literature are also
demonstrated from results of the current study.
This was the first study to the author’s knowledge to evaluate neurotoxic effects of
organic solvent exposure in a population of all agricultural workers. No definitive conclusions
from the current results can be drawn in relation to general associations between solvent
exposure and neurobehavioral function. While some significant associations were observed
between exposure and psychomotor function, some were risk effects and some were protective.
Literature supports risk or null effects in other industries, but little supports protective effects.
Therefore, further research focused on this population is needed.
Strengths and limitations
There were several strengths to the current study. First, the large sample size for an
occupational study evaluating neurobehavioral function through clinical tests is an improvement
over many other studies that often use much smaller sample sizes. Additionally, farming
practices and commodities vary considerably in North Carolina and Iowa; therefore, this analysis
evaluated neurotoxicity of agricultural exposures across a diverse occupational sample.9 Second,
this study emphasized subtle effects of neurotoxic substances as opposed to associations with

Siegel
41
clinically-diagnosed or binary conditions, which is important for understanding the risk and
progression of neurotoxic effects, as well as providing an opportunity for primary
prevention/early intervention.8 Third, widely-used, valid, reliable, and consistent clinical scales
were employed to assess outcomes.39,74,76 Fourth, exposure assessment using questionnaires can
better characterize long-term cumulative or low-level exposures than can environmental
sampling or biomarker data capturing exposure information for a given point in time. Task-based
exposure measures allow for consideration of all routes of exposure, including inhalation of
pesticides or solvent fumes as well as dermal exposure to pesticides or solvents.2
There are various limitations to the current study. For example, the analysis used a cross-
sectional design. Although pesticide exposure was collected longitudinally throughout the AHS,
baseline mental health and neurobehavioral information was unavailable and assessed at the
same time as a majority of the solvent exposure measures. Therefore, no assumption can be
made in regards to the temporality/sequence of exposure-response relationships.
This analysis was unable to use a true never-exposure group. Ninety-nine percent and
97% of participants reported using any pesticide or organophosphate pesticides, respectively.
Furthermore, the definition of solvent exposure consisted of at least eight hours of use in a week.
Those that may have used solvents for shorter durations were subsequently considered never
exposed, although they may still have had some measure of exposure. Therefore, the analysis
was strictly based on a gradient of exposure and no true never-exposure reference group.
Because exposure information was self-reported, there is a possibility for exposure
misclassification due to recall bias. Little effects of the solvent-based activities ascertained at
enrollment were found, but these results may have nonetheless been unreliable with responses
having been collected at least 10 years prior to NB evaluation. Task-based activities would have

Siegel
42
likely changed for workers over that period of time. Although pesticide exposure was self-
reported, it was assessed repeatedly over three phases of questionnaires, making the cumulative
estimates more reliable than produced from any one questionnaire alone. Additionally, multiple
studies have supported that recall of pesticide use many years later as well as consistencies with
expert judgment provided reliable self-reported exposure information.80-83
There is minimal risk for outcome misclassification because diagnostic tests were
administered by trained personnel blinded to exposure status, which is an improvement over
previous studies that have analyzed self-reported conditions. However, the CES-D scale only
reflects depressive symptoms experienced over a seven-day period (i.e., current mood state); and
depressed mood is not static over time.10,39,54 The current analysis only has CES-D scores from
one test period available. On the other hand, previous research has found associations between
depression diagnosed from the CES-D scale and pesticide poisoning experienced up to three
years before.10 Solvent-induced neurobehavioral outcomes are often irreversible, or exist for long
periods of time after exposure ceases, therefore neurobehavioral function may be less static than
depressive symptoms.17,19
There may be selection bias presented in the current design. While participation from
Iowa and North Carolina does present a broad range of farm and personal characteristics, only
those persons pursuing restricted-use pesticide certification were enrolled and only those residing
within 150 miles of neurobehavioral testing facilities were eligible. Therefore, farmers that do
not use pesticides, live in more rural/remote areas, or are financially disadvantaged and have no
reliable means of transportation may not have been included in the sample. Exposure may be
limited in this population relative to other occupational groups because of the training/testing in
safe handling of pesticides required to obtain a license to use restricted-use pesticides, at which

Siegel
43
point AHS participants were recruited.22 The stratified sampling procedure in which participants
with high-end exposure to organophosphates were oversampled has further implications for the
generalizability of both pesticide and solvent-exposed samples.
Additionally, a healthy worker effect must be considered in interpreting results, as those
with moderate-to-severe depression or adverse neurological symptoms may not be working or
may not have completed all phases of the AHS (i.e., remained enrolled for at least 10 years), and
subsequently would have been ineligible for participation in Neurobehavioral Testing (NB)
Study; participants are older (i.e., survival effect) or healthier than their peers if they were able to
participate in all questionnaires. In fact, nearly 70% of the sample reported still farming.15 A
general-population study of CES-D performance found that 21% of participants scored 16 or
higher on the scale,39 while the current study found that approximately 8% of participants scored
16 or higher. On the other hand, an AHS study previously found that participants reporting
depression at enrollment were equally likely to drop out by the first follow-up as non-depressed
participants.84 Lastly, though response rate was relatively low for the NB study (39%), a
previous study has supported that participants of this sample were comparable to non-
participants across many demographic characteristics.14
Employing a large number of statistical tests causes the results to be subject to the pitfalls
of multiple comparisons. That is, the more tests done in an analysis, the higher the probability
that any significant effects were found due to chance. Statistical adjustments were not made in
analyzing the results as to not increase the risk for type II error, although protection against type
I error was reduced.85 Furthermore, the number of tests for which to control becomes arbitrary
with so many different exposures and outcomes evaluated.86,87 However, multiple comparisons
should still at least be taken into consideration when interpreting the results of the current study,

Siegel
44
with awareness that the estimates could have been produced due to chance. But as discussed
previously, when significant associations are supported by directional consistency, significant
dose-response, and literature support, it is more likely that the results found are not due to
chance. These factors are demonstrated by some of the current results (e.g., solvent exposure and
depressive symptoms; solvent exposure and Finger Tapping performance), but not others.
There is some information unavailable in the data that was subsequently not considered
in the analysis. For example, though information regarding baseline depression or NB function
(i.e., prior to any exposure) was not ascertained, indicators for cognitive reserve, a psychological
concept representing an inherent ability to cope with and adapt to mental challenges, exist.88,89
One of which indicators includes education, which was evaluated in the analysis. Performance
on the Adult Reading Test measure also represents intellectual functioning, and thereby
potentially reflects inherent NB function pre-exposure.15 Furthermore, it cannot be assumed that
depression would have been differentially distributed among exposure groups prior to exposure,
thereby its baseline levels are not of substantial concern. Depressive symptoms measured by the
CES-D scale can be influenced by life events (e.g., vacation, illness/injury, relationship
occurrences, financial events, etc.),39,90,91 however, data was not available to assess or control for
these covariates. On the other hand, evaluation of the scale has still found test-retest reliability to
be moderate one year apart even with various life events occurring.39 Data was also not available
on income, but because participants of the AHS are a homogenous group (i.e., male farmers in
specified regions; at least 97% white22), income may not vary substantially; and education serves
as a measure of socioeconomic status in the current analysis.
Future sensitivity analyses could employ exclusions for characteristics that were not
substantial enough to assess for confounding. For example, very small groups of participants

Siegel
45
reported conditions such as pesticide poisoning, solvent poisoning, and use of various
medications or drugs. Previous studies have employed sensitivity analyses to exclude these
groups, finding mixed effects on results.6,14,15
The issue of age and duration of exposure and their effects on health outcomes is often of
concern due to collinearity or interaction. However, individual effects of exposures were still
seen when controlling for age, a conservative method in light of potential collinearity between
duration and age. Additionally, select correlation analyses supported that associations between
age and duration of exposure were only low-to-moderate (results not shown). Additionally, there
was enough variation of age in categorical solvent groups as to not suspect a lack of controlling
for age appropriately with a continuous variable (results not shown). Furthermore, it is possible
for the effects of age to interact with cumulative exposure to lead to health effects not exhibited
by either variable alone. However, an exploration of interaction terms within the statistical
models revealed no such significant interaction (results not shown).
Despite the limitations, this study provided a novel and innovative strategy to evaluate
variable central nervous system effects of neurotoxic substances encountered regularly by
agricultural workers.

Siegel
46
PUBLIC HEALTH IMPLICATIONS AND CONCLUSIONS
The current study opens a door to an important area of research for which much future
attention is needed. An AHS study on the prevalence of exposure to various occupational
exposures in agricultural workers found that farmers reporting more frequent use of pesticides
were 27% more likely to use solvents compared to farmers using pesticides less frequently.23
Because pesticides and solvents both have neurotoxic characteristics, it would be relevant to
understand any potential interaction effects of co-exposure, particularly in occupational groups
that regularly use both substances. Although this topic has not yet been explored in an
agricultural population (or in occupational health studies in general), a cumulative risk
assessment model has supported that environmental exposure to pesticides and solvents together
can affect Disability Adjusted Life Years.92
NIOSH, the Occupational Safety and Health Administration (OSHA), and the American
Conference of Governmental Industrial Hygienists (ACGIH) have characterized at least 19
organophosphate pesticides as occupational hazards, for which occupational exposure limits
have been assigned (ranging from 0.05 to 10 mg/m3).93 In published recommendations, these
substances are noted to have central nervous system effects. Not only does NIOSH recommend
sampling techniques to capture inhalation as a source of organophosphate pesticide exposure, but
ACGIH also provides skin notations indicating dermal absorption risk as well.93 Additionally,
NIOSH had published recommendations for dozens of organic solvents, which are also
recognized as hazardous through both inhalation and dermal routes.2 For example, a pilot study
in Kentucky found dermal patches detecting up to 36,000 µg/patch for toluene and up to 5,700
µg/patch for xylene in a sample of agricultural workers performing maintenance/repair of
machinery.2 Furthermore, neurotoxicity studies have demonstrated gasoline constituents to have

Siegel
47
neurologic effects at or below their ACGIH Threshold Limits Values.8 Therefore, research
should attempt to quantify the extent to which agricultural workers from various commodities
are exposed to neurotoxic substances in order to influence recommendations for exposure limits,
engineering controls, and worker practices pertinent to this group. Specific recommendations for
agricultural workers should be developed particularly because small farms (with 10 or fewer
employees) are exempt from OSHA enforcement activities.94
The current study found that approximately 14% of participants did not use personal
protective equipment (PPE), but other surveys have found much larger proportions of
agricultural workers reporting a lack of PPE.2,72 Worker practice interventions should train
agricultural workers in safe practices to reduce exposure to both pesticides and solvents. For
example, interventions involving education of adverse health outcomes, simulation of exposures,
farmer feedback, and provision of cognitive behavioral strategies have shown to be successful in
increasing PPE use post-intervention and relative to comparison groups.95,96
In addition to interventions focused on exposure, interventions targeting
mental/neurological health in agricultural workers are also recommended. Depressive symptoms
in agricultural workers and their family members are influenced by factors such as financial
strain, social isolation, long and physically demanding work requirements, working conditions
and processes that rely on variable weather, and health comorbidities.10-12,28 Therefore,
behavioral practices, such as stress management activities, can help reduce risk for depression
and anxiety. Because farmers have been found to be reluctant to seek treatment for mental health
conditions despite displaying depressive symptoms,6,40 agricultural workers should be trained in
recognizing mental health or neurobehavioral dysfunction, provided with healthcare resources,
and encouraged to pursue screening and/or treatment.

Siegel
48
Results from the current study may suggest relationships between neurotoxic chemicals,
such as some pesticides and organic solvents, and mental/neurobehavioral health outcomes that
exist on a linear scale. This research serves as a justification for early behavioral interventions in
agricultural workers. That is, because subtle changes in central nervous system function can
occur with exposures that may exist on a sub-clinical level, efforts should be taken to minimize
exposure and prevent further progression that could eventually lead to clinical disorders.

Siegel
49
REFERENCES
1. National Institute for Occupational Safety and Health. Proposed National Strategy for the
Prevention of Neurotoxic Disorders. In: U.S. Department of Health and Human Services,
ed1988.
2. Bunn TL, Liu Y, Lee K, Robertson M, Yu L. Farmer exposure to organic solvents during
the maintenance and repair of farm machinery: a pilot study. American journal of
industrial medicine. Dec 2009;52(12):973-981.
3. Monat-Descamps C, Deschamps F. Nervous system disorders induced by occupational
and environmental toxic exposure. 2012.
4. World Health Organization. Operational Guide for the WHO Neurobehavioural Core
Test Battery. Geneva, Switzerland: World Health Organization;1986.
5. Beard JD, Umbach DM, Hoppin JA, et al. Pesticide exposure and depression among male
private pesticide applicators in the agricultural health study. Environmental health
perspectives. Sep 2014;122(9):984-991.
6. Beseler CL, Stallones L, Hoppin JA, et al. Depression and pesticide exposures among
private pesticide applicators enrolled in the Agricultural Health Study. Environmental
health perspectives. Dec 2008;116(12):1713-1719.
7. Beseler C, Stallones L, Hoppin JA, et al. Depression and pesticide exposures in female
spouses of licensed pesticide applicators in the agricultural health study cohort. Journal
of occupational and environmental medicine / American College of Occupational and
Environmental Medicine. Oct 2006;48(10):1005-1013.
8. Burbacher TM. Neurotoxic effects of gasoline and gasoline constituents. Environmental
health perspectives. Dec 1993;101 Suppl 6:133-141.
9. Kamel F, Engel LS, Gladen BC, Hoppin JA, Alavanja MC, Sandler DP. Neurologic
symptoms in licensed private pesticide applicators in the agricultural health study.
Environmental health perspectives. Jul 2005;113(7):877-882.
10. Beseler CL, Stallones L. A cohort study of pesticide poisoning and depression in
Colorado farm residents. Annals of epidemiology. Oct 2008;18(10):768-774.
11. Sanne B, Mykletun A, Moen BE, Dahl AA, Tell GS. Farmers are at risk for anxiety and
depression: the Hordaland Health Study. Occup Med-Oxford. Mar 2004;54(2):92-100.
12. Browning SR, Westneat SC, McKnight RH. Suicides among farmers in three
southeastern states, 1990-1998. J Agric Saf Health. Oct 2008;14(4):461-472.
13. Stallones L, Beseler C. Pesticide poisoning and depressive symptoms among farm
residents. Annals of epidemiology. Aug 2002;12(6):389-394.
14. Starks SE, Gerr F, Kamel F, et al. High pesticide exposure events and central nervous
system function among pesticide applicators in the Agricultural Health Study.
International archives of occupational and environmental health. Jul 2012;85(5):505-
515.
15. Starks SE, Gerr F, Kamel F, et al. Neurobehavioral function and organophosphate
insecticide use among pesticide applicators in the Agricultural Health Study.
Neurotoxicology and teratology. Jan-Feb 2012;34(1):168-176.
16. Starks SE, Hoppin JA, Kamel F, et al. Peripheral nervous system function and
organophosphate pesticide use among licensed pesticide applicators in the Agricultural
Health Study. Environmental health perspectives. Apr 2012;120(4):515-520.
17. National Institute for Occupational Safety and Health. Organic Solvent Neurotoxicity.
1987;Current Intelligence Bulletin 48(DHHS (NIOSH) Publication Number 87-104).

Siegel
50
18. Dick FD. Solvent neurotoxicity. Occupational and environmental medicine. Mar
2006;63(3):221-226, 179.
19. Dryson EW, Ogden JA. Organic solvent induced chronic toxic encephalopathy: extent of
recovery, and associated factors, following cessation of exposure. Neurotoxicology. Oct
2000;21(5):659-665.
20. White RF, Proctor SP. Solvents and neurotoxicity. Lancet. Apr 26 1997;349(9060):1239-
1243.
21. Hoppin JA, Umbach DM, London SJ, Alavanja MC, Sandler DP. Diesel exhaust,
solvents, and other occupational exposures as risk factors for wheeze among farmers.
American journal of respiratory and critical care medicine. Jun 15 2004;169(12):1308-
1313.
22. Alavanja MCR, Sandler DP, McMaster SB, et al. The agricultural health study.
Environmental health perspectives. Apr 1996;104(4):362-369.
23. Coble J, Hoppin JA, Engel L, et al. Prevalence of exposure to solvents, metals, grain dust,
and other hazards among farmers in the Agricultural Health Study. Journal of exposure
analysis and environmental epidemiology. Nov 2002;12(6):418-426.
24. Boxer PA, Burnett C, Swanson N. Suicide and Occupation - a Review of the Literature.
Journal of Occupational and Environmental Medicine. Apr 1995;37(4):442-452.
25. Malmberg A, Simkin S, Hawton K. Suicide in farmers. Brit J Psychiat. Aug
1999;175:103-105.
26. Riise T, Moen BE, Nortvedt MW. Occupation, lifestyle factors and health-related quality
of life: The Hordaland health study. Journal of Occupational and Environmental
Medicine. Mar 2003;45(3):324-332.
27. Centers for Disease Control and Prevention. QuickStats: Prevalence of Current
Depression* Among Persons Aged ≥12 Years, by Age Group and Sex — United States,
National Health and Nutrition Examination Survey, 2007–2010. MMWR Weekly.
2012;60(51):1747.
28. Rayens MK, Reed DB. Predictors of depressive symptoms in older rural couples: the
impact of work, stress and health. The Journal of rural health : official journal of the
American Rural Health Association and the National Rural Health Care Association.
Winter 2014;30(1):59-68.
29. Hoppin JA, Long S, Umbach DM, et al. Lifetime organophosphorous insecticide use
among private pesticide applicators in the Agricultural Health Study. Journal of exposure
science & environmental epidemiology. Nov 2012;22(6):584-592.
30. Ray DE, Richards PG. The potential for toxic effects of chronic, low-dose exposure to
organophosphates. Toxicology letters. Mar 31 2001;120(1-3):343-351.
31. Freire C, Koifman S. Pesticides, depression and suicide: a systematic review of the
epidemiological evidence. International journal of hygiene and environmental health. Jul
2013;216(4):445-460.
32. Agency for Toxic Substances and Disease Registry. Toxicological Profile for Dichlorvos.
Atlanta, GA: U.S. Department of Health and Human Services, Public Health
Service;1997.
33. Mackenzie Ross SJ, Brewin CR, Curran HV, Furlong CE, Abraham-Smith KM, Harrison
V. Neuropsychological and psychiatric functioning in sheep farmers exposed to low
levels of organophosphate pesticides. Neurotoxicology and teratology. Jul-Aug
2010;32(4):452-459.

Siegel
51
34. Bazylewicz-Walczak B, Majczakowa W, Szymczak M. Behavioral effects of
occupational exposure to organophosphorous pesticides in female greenhouse planting
workers. Neurotoxicology. Oct 1999;20(5):819-826.
35. Beard JD, Hoppin JA, Richards M, et al. Pesticide exposure and self-reported incident
depression among wives in the Agricultural Health Study. Environmental research. Oct
2013;126:31-42.
36. Weisskopf MG, Moisan F, Tzourio C, Rathouz PJ, Elbaz A. Pesticide exposure and
depression among agricultural workers in France. Am J Epidemiol. Oct 1
2013;178(7):1051-1058.
37. Povey AC, McNamee R, Alhamwi H, et al. Pesticide exposure and screen-positive
neuropsychiatric disease in British sheep farmers. Environmental research. Nov
2014;135:262-270.
38. Wesseling C, van Wendel de Joode B, Keifer M, London L, Mergler D, Stallones L.
Symptoms of psychological distress and suicidal ideation among banana workers with a
history of poisoning by organophosphate or n-methyl carbamate pesticides. Occupational
and environmental medicine. Nov 2010;67(11):778-784.
39. Radloff LS. The CES-D scale a self-report depression scale for research in the general
population. Applied psychological measurement. 1977;1(3):385-401.
40. Linn JG, Husaini BA. Determinants of Psychological Depression and Coping Behaviors
of Tennessee Farm Residents. J Community Psychol. Oct 1987;15(4):503-512.
41. van der Hoek JA, Verberk MM, Hageman G. Criteria for solvent-induced chronic toxic
encephalopathy: a systematic review. International archives of occupational and
environmental health. Aug 2000;73(6):362-368.
42. Agency for Toxic Substances and Disease Registry. Toxicological Profile for Automotive
Gasoline. Atlanta, GA: U.S. Department of Health and Human Services, Public Health
Service;1995.
43. van Valen E, Wekking E, van der Laan G, Sprangers M, van Dijk F. The course of
chronic solvent induced encephalopathy: a systematic review. Neurotoxicology. Nov
2009;30(6):1172-1186.
44. Kinawy AA. Impact of gasoline inhalation on some neurobehavioural characteristics of
male rats. BMC physiology. 2009;9:21.
45. Visser I, Wekking EM, de Boer AG, et al. Prevalence of psychiatric disorders in patients
with chronic solvent induced encephalopathy (CSE). Neurotoxicology. Dec
2011;32(6):916-922.
46. Human aspects of solvent neurobehavioral effects. Neurotoxicology. Winter
1986;7(4):43-56.
47. Furu H, Sainio M, Hyvarinen HK, et al. Detecting chronic solvent encephalopathy in
occupations at risk. Neurotoxicology. Aug 2012;33(4):734-741.
48. Xiao JQ, Levin SM. The diagnosis and management of solvent-related disorders.
American journal of industrial medicine. Jan 2000;37(1):44-61.
49. Beseler C, Stallones L. Safety practices, neurological symptoms, and pesticide poisoning.
Journal of occupational and environmental medicine / American College of Occupational
and Environmental Medicine. Oct 2003;45(10):1079-1086.
50. Amshoff SK, Reed DB. Health, work, and safety of farmers ages 50 and older. Geriatr
Nurs. Sep-Oct 2005;26(5):304-308.

Siegel
52
51. Wu JD, Nieuwenhuijsen MJ, Samuels SJ, Lee K, Schenker MB. Identification of
agricultural tasks important to cumulative exposures to inhalable and respirable dust in
California. Aiha J-J Sci Occup E. Nov-Dec 2003;64(6):830-836.
52. Coble JB, Brown LM, Hayes RB, et al. Sugarcane farming, occupational solvent
exposures, and the risk of oral cancer in Puerto Rico. Journal of occupational and
environmental medicine / American College of Occupational and Environmental
Medicine. Aug 2003;45(8):869-874.
53. Cole DC, Carpio F, Julian J, Leon N, Carbotte R, De Almeida H. Neurobehavioral
outcomes among farm and nonfarm rural Ecuadorians. Neurotoxicology and teratology.
Jul-Aug 1997;19(4):277-286.
54. Nordling Nilson L, Karlson B, Nise G, Malmberg B, Orbaek P. Delayed manifestations
of CNS effects in formerly exposed printers--a 20-year follow-up. Neurotoxicology and
teratology. Nov-Dec 2010;32(6):620-626.
55. Bowler RM, Lezak M, Booty A, et al. Neuropsychological dysfunction, mood
disturbance, and emotional status of munitions workers. Applied neuropsychology.
2001;8(2):74-90.
56. Escalona E, Yanes L, Feo O, Maizlish N. Neurobehavioral evaluation of Venezuelan
workers exposed to organic solvent mixtures. American journal of industrial medicine.
Jan 1995;27(1):15-27.
57. Saygun M, Ekici A, Muluk NB, et al. Effects of long-term low-level solvent exposure on
cognitive function. Clinical and investigative medicine. Medecine clinique et
experimentale. 2012;35(4):E190-205.
58. Satoh T, Omae K, Nakashima H, et al. Relationship between acetone exposure
concentration and health effects in acetate fiber plant workers. International archives of
occupational and environmental health. 1996;68(3):147-153.
59. Centers for Disease Control and Prevention. National Health and Nutrition Examination
Survey III: Neurological Testing Procedure Manual. 1993.
60. Lee CR, Jeong KS, Kim Y, Yoo CI, Lee JH, Choi YH. Neurobehavioral changes of
shipyard painters exposed to mixed organic solvents. Ind Health. Apr 2005;43(2):320-
326.
61. Tsai SY, Chen JD, Chao WY, Wang JD. Neurobehavioral effects of occupational
exposure to low-level organic solvents among Taiwanese workers in paint factories.
Environmental research. 1997;73(1-2):146-155.
62. Grosch JW, Neale AV, Demers RY. Neurobehavioral and health-related deficits in
solvent-exposed painters. American journal of industrial medicine. Nov 1996;30(5):623-
632.
63. Bolla KI, Schwartz BS, Stewart W, Rignani J, Agnew J, Ford DP. Comparison of
neurobehavioral function in workers exposed to a mixture of organic and inorganic lead
and in workers exposed to solvents. American journal of industrial medicine.
1995;27(2):231-246.
64. Ruijten MW, Hooisma J, Brons JT, Habets CE, Emmen HH, Muijser H. Neurobehavioral
effects of long-term exposure to xylene and mixed organic solvents in shipyard spray
painters. Neurotoxicology. Fall 1994;15(3):613-620.
65. Kishi R, Harabuchi I, Katakura Y, Ikeda T, Miyake H. Neurobehavioral effects of
chronic occupational exposure to organic solvents among Japanese industrial painters.
Environmental research. Aug 1993;62(2):303-313.

Siegel
53
66. Spurgeon A, Gray CN, Sims J, et al. Neurobehavioral effects of long-term occupational
exposure to organic solvents: two comparable studies. American journal of industrial
medicine. 1992;22(3):325-335.
67. LoSasso GL, Rapport LJ, Axelrod BN, Whitman RD. Neurocognitive sequelae of
exposure to organic solvents and (meth)acrylates among nail-studio technicians.
Neuropsychiatry, neuropsychology, and behavioral neurology. Mar 2002;15(1):44-55.
68. Schenker MB, Orenstein MR, Samuels SJ. Use of protective equipment among California
farmers. American journal of industrial medicine. Nov 2002;42(5):455-464.
69. Alavanja MCR, Sandler DP, McDonnell CJ, et al. Characteristics of pesticide use in a
pesticide applicator cohort: The Agricultural Health Study. Environmental research. Feb
1999;80(2):172-179.
70. Mirowsky J, Ross CE. Age and depression. J Health Soc Behav. Sep 1992;33(3):187-
205; discussion 206-112.
71. Stordal E, Mykletun A, Dahl AA. The association between age and depression in the
general population: a multivariate examination. Acta psychiatrica Scandinavica. Feb
2003;107(2):132-141.
72. Macfarlane E, Chapman A, Benke G, Meaklim J, Sim M, McNeil J. Training and other
predictors of personal protective equipment use in Australian grain farmers using
pesticides. Occupational and environmental medicine. Feb 2008;65(2):141-146.
73. Letz R. NES3 User's Manual. Atlanta, GA: Neurobehavioral Systems Inc.; 2000.
74. Letz R, DiIorio CK, Shafer PO, Yeager KA, Schomer DL, Henry TR. Further
standardization of some NES3 tests. Neurotoxicology. Aug 2003;24(4-5):491-501.
75. Letz R, Gerr F, Cragle D, Green RC, Watkins J, Fidler AT. Residual neurologic deficits
30 years after occupational exposure to elemental mercury. Neurotoxicology. Aug
2000;21(4):459-474.
76. Letz R, Green RC, Woodard JL. Development of a computer-based battery designed to
screen adults for neuropsychological impairment. Neurotoxicology and teratology. Jul-
Aug 1996;18(4):365-370.
77. Klove H. Clinical Neuropsychology. The Medical clinics of North America. Nov
1963;47:1647-1658.
78. Watson D, Clark LA, Tellegen A. Development and validation of brief measures of
positive and negative affect: the PANAS scales. Journal of personality and social
psychology. Jun 1988;54(6):1063-1070.
79. Belsley DA, Kuh E, Welsch RE. Regression diagnostics: identifying influential data and
sources of collinearity. New Jersey: John Wiley and Sons; 2004.
80. Engel LS, Seixas NS, Keifer MC, Longstreth WT, Jr., Checkoway H. Validity study of
self-reported pesticide exposure among orchardists. Journal of exposure analysis and
environmental epidemiology. Sep-Oct 2001;11(5):359-368.
81. Fritschi L, Siemiatycki J, Richardson L. Self-assessed versus expert-assessed
occupational exposures. Am J Epidemiol. Sep 1 1996;144(5):521-527.
82. Blair A, Tarone R, Sandler D, et al. Reliability of reporting on life-style and agricultural
factors by a sample of participants in the Agricultural Health Study from Iowa.
Epidemiology. Jan 2002;13(1):94-99.
83. Hoppin JA, Yucel F, Dosemeci M, Sandler DP. Accuracy of self-reported pesticide use
duration information from licensed pesticide applicators in the Agricultural Health Study.
Journal of exposure analysis and environmental epidemiology. Sep 2002;12(5):313-318.

Siegel
54
84. Montgomery MP, Kamel F, Hoppin JA, Beane Freeman LE, Alavanja MC, Sandler DP.
Effects of self-reported health conditions and pesticide exposures on probability of
follow-up in a prospective cohort study. American journal of industrial medicine. May
2010;53(5):486-496.
85. Rothman KJ. No adjustments are needed for multiple comparisons. Epidemiology. Jan
1990;1(1):43-46.
86. Savitz DA. Random Error. Interpreting Epidemiologic Evidence: Strategies for Study
Design & Analysis. New York, NY: Oxford University Press; 2003:252.
87. Savitz DA, Olshan AF. Multiple comparisons and related issues in the interpretation of
epidemiologic data. Am J Epidemiol. Nov 1 1995;142(9):904-908.
88. Coloma Andrews LC, Zihl J. Cognitive Reserve in Major Depression–Associations with
Cognitive Status, Age, Education, Personality, and Depression Severity. Austin J
Psychiatry Behav Sci. 2014;1(3):1015.
89. Stern Y. Cognitive reserve and Alzheimer disease. Alzheimer Dis Assoc Disord. Jul-Sep
2006;20(3 Suppl 2):S69-74.
90. Beseler CL, Stallones L. Structural equation modeling of the relationships between
pesticide poisoning, depressive symptoms and safety behaviors among Colorado farm
residents. Journal of agromedicine. 2006;11(3-4):35-46.
91. Dohrenwend BP, Dohrenwend BS. Social and cultural influences on psychopathology.
Annu Rev Psychol. 1974;25:417-452.
92. Ragas AM, Oldenkamp R, Preeker NL, Wernicke J, Schlink U. Cumulative risk
assessment of chemical exposures in urban environments. Environment international. Jul
2011;37(5):872-881.
93. National Institute for Occupational Safety and Health. Organophosphorus Pesticides,
Method 5600, Issue 1. NIOSH Manual of Analytical Methods (NMAM). Fourth ed1994.
94. Occupational Safety and Health Administration. Enforcement Exemptions and
Limitations under the Appropriations Act. Vol CPL 02-00-0511998.
95. Donham KJ, Kline AK, Kelly KM, Lange JL, Rautiainen RH. Respirator and hearing
protection use in the certified safe farm program. Journal of agromedicine.
2013;18(1):18-26.
96. Perry MJ, Layde PM. Farm pesticides: outcomes of a randomized controlled intervention
to reduce risks. American journal of preventive medicine. May 2003;24(4):310-315.

Table 1: Demographic characteristics (N=701)Age (Mean, SD) 61.3 (11.7)State (North Carolina/Iowa) (n,%)
Iowa 356 (50.8)North Carolina 345 (49.2)
Education (n,%)<High School 355 (50.6)High School+ 346 (49.4)
Marital status* (n,%)Married 620 (88.8)Single/Divorced/Widowed 78 (11.2)
Smoking (n,%)Never 403 (57.5)Current 47 (6.7)Past 251 (35.8)
Alcohol use (n,%)0 drinks/week 401 (57.2)1-7 drinks/week 231 (33.0)>7 drinks/week 69 (9.8)
Personal protective equipment use (n,%)No 97 (13.8)Yes 604 (86.2)
Off-farm job* (n,%)No 423 (60.7)Yes 274 (39.3)
Head injury (n,%)No 536 (76.5)Yes- No loss of consciousness 71 (10.1)Yes- Loss of consciousness 94 (13.4)
Solvent exposure (n,%)No 413 (58.9)Yes 288 (41.1)
Welding exposure (n,%)No 561 (80.0)Yes 140 (20.0)
Soldering exposure (n,%)No 665 (94.9)Yes 36 (5.1)
High pesticide exposure event (n, %)No 538 (76.8)Yes 163 (23.3)
Caffiene consumption (n, %)No 176 (25.1)Yes 525 (74.9)
Anti-depressant use (n, %)No 650 (92.7)Yes 51 (7.3)
Visual acuity (n, %)20/20 - 20/40 592 (84.5)20/50 - 20/200 109 (15.6)
Height: cm (Mean, SD) 179.0 (6.5)Reading ability: 0-60* (Mean, SD) 29.9 (10.2)Positive affect: 1-5 (Mean, SD) 3.5 (0.7)Negative affect: 1-5 (Mean, SD) 1.4 (0.4)
*Missing values of n<5SD: Standard deviation; OP: Organophosphate
Siegel
55

6.5 (6.4) 5.0 (0.0 - 44.0)
Low (score < 16) 634 (91.6)High (score 16+) 58 (8.4)
SD: Standard deviation*Missing N=9
Table 2: Center for Epidemiologic Studies Depression (CES-D) Scale scores across entire sample
Total Sample (N = 692)*
CES-D Score (0-60)Risk for depression
----
----
--n (%) Mean (SD) Median (Range)
Siegel
56

Table 3: Distribution of cumulative lifetime days of pesticide use for those reporting ever-use
Min. Max.Organophosphates
Acephate 166 (23.7) 51.8 (2.8) 2.5 500.5Chlorpyrifos 418 (59.6) 35.4 (3.7) 2.0 767.3Coumaphos 94 (13.4) 15.7 (4.8) 1.0 1682.5Diazinon 302 (43.1) 21.8 (3.9) 1.0 846.0Dichlorvos 128 (18.3) 80.1 (7.1) 1.0 8680.0Dimethoate 66 (9.4) 23.3 (3.2) 2.0 457.3Disulfoton 110 (15.7) 29.2 (2.5) 2.0 236.0Ethoprop 121 (17.3) 29.0 (2.6) 2.5 316.0Fonofos 201 (28.7) 32.9 (3.4) 2.0 457.3Malathion 541 (77.2) 35.4 (4.2) 2.0 2625.0Parathion 147 (21.0) 23.8 (4.8) 1.0 1667.5Phorate 230 (32.8) 30.9 (3.8) 1.0 1627.5Phosmet 101 (14.4) 33.0 (3.0) 2.5 600.0Tebupirimfos 69 (9.8) 35.4 (2.5) 4.0 250.0Terbufos 356 (50.8) 50.6 (3.7) 2.0 752.3Tetrachlorvinphos 69 (9.8) 33.0 (3.0) 3.0 581.6
CarbamatesAldicarb 131 (18.7) 36.5 (4.1) 2.0 742.3Benomyl 116 (16.5) 16.0 (6.3) 0.3 767.3Carbaryl 440 (62.8) 37.9 (4.9) 1.0 1387.5Carbofuran 290 (41.4) 23.7 (3.7) 1.0 752.3
All Organophosphate Pesticides 682 (97.3) 193.2 (4.0) 2.0 8763.3All Pesticides 700 (99.9) 984.5 (3.0) 10.0 11676.8High Pesticide Exposure Event
No 538 (76.8) -- --Yes 163 (23.3) -- --
SD: Standard deviation; GM: Geometric mean; GSD: Geometric standard deviation
Total Sample (N=701)n (%) GM (GSD)
----
Siegel
57

EVER VS. NEVER EXPOSED p-value p-valueOrganophosphates
Acephate 0.070 (0.035) 0.046 0.058 (0.036) 0.109Chlorpyrifos 0.005 (0.031) 0.869 0.013 (0.031) 0.674Coumaphos -0.079 (0.044) 0.070 -0.080 (0.044) 0.069Diazinon -0.033 (0.030) 0.274 -0.044 (0.030) 0.153Dichlorvos -0.105 (0.038) 0.006 -0.085 (0.039) 0.030Dimethoate -0.072 (0.051) 0.159 -0.074 (0.051) 0.149Disulfoton 0.098 (0.041) 0.018 0.090 (0.042) 0.031Ethoprop 0.139 (0.039) <0.001 0.128 (0.040) 0.001Fonofos -0.016 (0.033) 0.639 0.009 (0.034) 0.785Malathion -0.064 (0.036) 0.072 -0.070 (0.035) 0.049Parathion 0.027 (0.037) 0.468 0.022 (0.037) 0.551Phorate -0.047 (0.032) 0.144 -0.029 (0.032) 0.370Phosmet 0.033 (0.042) 0.440 0.056 (0.043) 0.195Tebupirimfos -0.069 (0.050) 0.165 -0.049 (0.050) 0.328Terbufos -0.011 (0.030) 0.723 -0.003 (0.030) 0.910Tetrachlorvinphos -0.068 (0.050) 0.175 -0.052 (0.050) 0.302
CarbamatesAldicarb 0.054 (0.039) 0.162 0.046 (0.039) 0.238Benomyl 0.021 (0.040) 0.608 0.003 (0.041) 0.944Carbaryl 0.014 (0.031) 0.660 -0.011 (0.032) 0.739Carbofuran -0.043 (0.030) 0.159 -0.036 (0.031) 0.240
High Pesticide Exposure Event 0.069 (0.036) 0.051 0.077 (0.036) 0.031SE: Standard error*Adjusted for age, marital status, and solvent useBolded if p < 0.05Risk (positive) correlation (higher exposure -> more depressions symptoms)Protective (negative) correlation (higher exposure -> less depressions symptoms)
Crude Adjusted*Beta (SE) Beta (SE)
Table 4: Relationship between ever-use pesticide exposures and log10-transformed CESD score (linear regression)
Siegel
58

LIFETIME DAYS OF EXPOSURE p-value p-valueOrganophosphates
Acephate 0.036 (0.020) 0.066 0.029 (0.020) 0.142Chlorpyrifos 0.006 (0.017) 0.717 0.010 (0.017) 0.552Coumaphos -0.007 (0.031) 0.809 -0.006 (0.031) 0.845Diazinon -0.010 (0.019) 0.617 -0.018 (0.020) 0.357Dichlorvos -0.043 (0.018) 0.018 -0.037 (0.018) 0.046Dimethoate -0.050 (0.034) 0.149 -0.050 (0.034) 0.143Disulfoton 0.067 (0.027) 0.014 0.061 (0.027) 0.024Ethoprop 0.082 (0.025) 0.001 0.075 (0.026) 0.004Fonofos -0.008 (0.020) 0.687 0.005 (0.020) 0.822Malathion -0.009 (0.018) 0.618 -0.013 (0.018) 0.479Parathion 0.001 (0.023) 0.965 -0.002 (0.023) 0.927Phorate -0.028 (0.019) 0.142 -0.018 (0.019) 0.344Phosmet 0.029 (0.026) 0.269 0.043 (0.027) 0.109Tebupirimfos -0.040 (0.031) 0.197 -0.027 (0.031) 0.384Terbufos -0.011 (0.016) 0.493 -0.008 (0.016) 0.603Tetrachlorvinphos -0.032 (0.031) 0.295 -0.021 (0.031) 0.495
CarbamatesAldicarb 0.029 (0.023) 0.191 0.026 (0.023) 0.252Benomyl -0.014 (0.027) 0.608 -0.020 (0.027) 0.449Carbaryl 0.011 (0.016) 0.480 -0.003 (0.017) 0.853Carbofuran -0.025 (0.019) 0.198 -0.024 (0.020) 0.218
All Organophosphate Pesticides -0.014 (0.022) 0.505 -0.010 (0.022) 0.641All Pesticides -0.024 (0.031) 0.441 -0.017 (0.031) 0.586SE: Standard error*Adjusted for age, marital status, and solvent useBolded if p < 0.05Risk (positive) correlation (higher exposure -> more depressions symptoms)Protective (negative) correlation (higher exposure -> less depressions symptoms)
Crude Adjusted*Beta (SE) Beta (SE)
Table 5: Relationship between pesticide exposures (log10-transformed lifetime days of exposure) and log10-transformed CESD score (linear regression)
Siegel
59

Any Solvents 288 (41.1) 33.1 (19.1) 36.0 (1.0 - 82.0)Gasoline 223 (31.8) 25.6 (20.0) 21.0 (1.0 - 82.0)Paint Thinner 77 (11.0) 21.5 (19.2) 17.0 (1.0 - 65.0)Petroleum Distillates 178 (25.4) 28.6 (14.8) 30.5 (1.0 - 70.0)Benzene 18 (2.6) 27.1 (23.9) 21.0 (1.0 - 70.0)Toluene 11 (1.6) 12.7 (12.3) 10.0 (1.0 - 30.0)Turpentine 5 (0.7) 38.8 (15.0) 49.0 (20.0 - 51.0)
Solvents in mixing pesticides72 (10.3)
Gasoline to clean* 282 (41.2)Solvents to clean* 193 (28.1)SD: Standard deviation*Missing values n<18
Any solventsNever use 413 (58.9)Low duration (1-36 years) 146 (20.8) 17.2 (12.2)High duration (>36 years) 142 (20.3) 49.4 (7.8)GasolineNever use 478 (68.2)Low duration (1-21 years) 115 (16.4) 8.6 (6.6)High duration (>21 years) 108 (15.4) 43.7 (11.9)Paint thinnerNever use 624 (89.0)Low duration (1-17 years) 40 (5.7) 5.9 (5.3)High duration (>17 years) 37 (5.3) 38.5 (13.5)Petroleum distillatesNever use 523 (74.6)Low duration (1-30.5 yrs) 89 (12.7) 16.3 (8.9)High duration (>30.5 yrs) 89 (12.7) 40.9 (7.4)SD: Standard deviation
--
--
n (%) Mean (SD)
Table 6.A: Lifetime years of use for all organic solvent exposure variables
Table 6.B: Solvent exposure duration categories (category year cutoffs fall at medians of ever-used values) (N=701)
--
--
--
--
Total Participants (N=701)n (%) Mean (SD) Median (Range)
----
--
--
Siegel
60

Table 7: Relationship between solvent exposures and log10-CESD score (linear regression)
p-value p-valueAny solvents
Ever vs. never 0.078 (0.030) 0.011 0.068 (0.034) 0.044Never useLow duration (1-36 years) 0.060 (0.038) 0.117 0.048 (0.041) 0.242High duration (>36 years) 0.097 (0.039) 0.013 0.090 (0.042) 0.033
GasolineEver vs. never 0.082 (0.032) 0.011 0.074 (0.036) 0.039Never useLow duration (1-21 years) 0.077 (0.041) 0.063 0.067 (0.045) 0.137High duration (>21 years) 0.088 (0.042) 0.037 0.081 (0.045) 0.070
Paint thinnerEver vs. never 0.070 (0.048) 0.146 0.064 (0.048) 0.184Never useLow duration (1-17 years) 0.052 (0.065) 0.424 0.049 (0.065) 0.454High duration (>17 years) 0.088 (0.067) 0.186 0.079 (0.066) 0.234
Petroleum distillatesEver vs. never 0.092 (0.035) 0.008 0.082 (0.037) 0.027Never useLow duration (1-30.5 years) 0.107 (0.046) 0.021 0.097 (0.048) 0.043High duration (>30.5 years) 0.077 (0.045) 0.088 0.067 (0.047) 0.158
0.000 (0.049) 0.997 0.027 (0.050) 0.5920.028 (0.031) 0.360 0.028 (0.031) 0.3700.016 (0.034) 0.633 0.004 (0.034) 0.894
SE: Standard error*Adjusted for state, age, marital status, and HPEEBolded if p < 0.05Risk (positive) correlation (higher exposure -> more depressions symptoms)Protective (negative) correlation (higher exposure -> less depressions symptoms)
Solvents in mixing pesticides (yes vs. Gasoline to clean (yes vs. no)Solvents to clean (yes vs. no)
Crude Adjusted*
Ref.Ref.
Ref. Ref.
Ref. Ref.
Ref. Ref.
Beta (SE)Beta (SE)
Siegel
61

Table 8: Distrubutions of NB test scoresN
Continuous Performance Test (CPT): ms 693 427.9 (44.9) 421.2 (318.6 - 612.3)
Digit-symbol: s (with 2 exclusions) 692 117.6 (23.1) 112.1 (73.6 - 213.6)Finger Tapping, dominant hand: # taps 695 53.6 (9.6) 55.0 (9.0 - 86.0)Grooved Pegboard, dominant hand: s 700 92.0 (24.1) 86.0 (51.0 - 180.0)Auditory Verbal Learning (AVLT) Total Recall: # correct
696 19.9 (5.1) 20.0 (5.0 - 34.0)
AVLT Delayed Recall: # correct 695 6.6 (2.8) 7.0 (0.0 - 12.0)AVLT Recognition: true positives minus false positives
694 8.3 (2.6) 9.0 (-3.0 - 12.0)
Sequences A latency: s (with 1 exclusion) 680 42.9 (14.6) 40.3 (14.8 - 93.8)
Sequences B latency: s (with 1 exclusion) 672 64.6 (21.2) 59.9 (22.8 - 144.4)
SD: Standard deviation
Mean (SD) Median (Range)
Siegel
62

Table 9: Outcome-specific base modelsNB Outcome R2
Continuous Performance Test 0.234
Digit-symbol 0.490
Finger Tapping, dominant hand
0.160
Grooved Pegboard, dominant hand
0.360
Auditory Verbal Learning (AVLT) Total Recall
0.290
AVLT Delayed Recall 0.279
AVLT Recognition 0.210
Sequences A latency 0.418Sequences B latency 0.427
Base Model
Adjusted for age, caffiene use, reading ability, positive affect, and visual acuity
Adjusted for state, age, education, smoking, reading ability, positive affect, and visual acuity
Adjusted for state, age, reading ability, and positive affect
Adjusted for state, age, education, all pesticide use, head injury, antidepressant use, reading ability, positive affect, negative affect, and visual acuity
Adjusted for state, age, education, reading ability, positive affect, and negative affect
Adjusted for state, age, reading ability, and positive affect
Adjusted for state, age, reading ability, and positive affect
Adjusted for state, age, education, PPE, welding exposure, caffiene use, reading ability, and visual acuityAdjusted for age, education, smoking, reading ability, positive affect, and negative affect
Siegel
63

Table 10: Crude relationships between solvent exposure duration and NB test performance using linear regression
Any solventsEver vs. never -4.642 (3.467) -4.224 (1.783) -2.797 (0.736) -0.608 (1.850) -0.274 (0.390) -0.318 (0.217) -0.576 (0.197) -3.793 (1.130) -4.361 (1.656)Never use1-36 years 3.957 (4.323) 2.106 (2.206) -1.068 (0.916) 4.586 (2.299) 0.728 (0.484) 0.195 (0.271) -0.207 (0.246) 0.704 (1.397) 0.318 (2.049)> 36 years -13.488 (4.369) -10.738 (2.229) -4.588 (0.928) -5.947 (2.322) -1.311 (0.491) -0.849 (0.274) -0.958 (0.250) -8.324 (1.401) -9.285 (2.088)
GasolineEver vs. never -5.281 (3.668) -6.785 (1.878) -3.400 (0.776) -3.791 (1.949) -0.824 (0.411) -0.638 (0.229) -0.665 (0.209) -5.369 (1.188) -6.980 (1.741)Never use1-21 years 0.459 (4.717) -1.836 (2.415) -2.281 (0.990) 0.332 (2.485) 0.236 (0.522) -0.421 (0.293) -0.178 (0.265) -2.081 (1.525) -3.675 (2.235)> 21 years -11.236 (4.788) -11.827 (2.433) -4.603 (1.020) -8.180 (2.549) -1.964 (0.538) -0.870 (0.302) -1.188 (0.273) -8.718 (1.536) -10.412 (2.269)
Paint thinnerEver vs. never 3.206 (5.457) 2.869 (2.807) -1.296 (1.164) 7.179 (2.897) 1.117 (0.609) 0.551 (0.341) 0.148 (0.311) 1.862 (1.776) 2.754 (2.583)Never use1-17 years 3.321 (7.417) 4.875 (3.814) -1.674 (1.573) 9.665 (3.912) 1.210 (0.823) 0.946 (0.460) 0.331 (0.420) 4.491 (2.408) 4.130 (3.506)> 17 years 3.086 (7.603) 0.755 (3.910) -0.888 (1.631) 4.492 (4.059) 1.017 (0.854) 0.123 (0.477) -0.049 (0.436) -0.909 (2.468) 1.304 (3.594)
Petroleum distillatesEver vs. never -2.140 (3.940) -2.210 (2.031) -2.224 (0.838) 2.599 (2.089) -0.115 (0.442) -0.222 (0.247) -0.441 (0.224) -2.131 (1.291) -2.257 (1.889)Never use1-30.5 years -3.413 (5.255) -1.235 (2.703) -1.536 (1.106) 4.908 (2.758) 0.085 (0.583) -0.230 (0.326) -0.742 (0.296) -1.149 (1.734) -1.983 (2.553)> 30.5 years -0.910 (5.178) -3.163 (2.676) -2.920 (1.111) 0.290 (2.758) -0.318 (0.586) -0.213 (0.327) -0.137 (0.297) -3.046 (1.683) -2.505 (2.451)
5.104 (5.586) 3.334 (2.874) 0.961 (1.200) 7.648 (2.983) 1.051 (0.628) 0.665 (0.351) 0.509 (0.320) -0.833 (1.820) 4.827 (2.673)
-2.035 (3.493) -2.269 (1.800) 0.141 (0.754) 0.709 (1.874) 0.195 (0.391) 0.170 (0.218) -0.086 (0.201) -0.734 (1.145) 0.857 (1.676)
1.279 (3.819) -0.216 (1.966) 0.299 (0.822) 1.751 (2.043) -0.358 (0.426) -0.178 (0.238) -0.430 (0.218) 0.606 (1.250) 3.141 (1.830)
SE: Standard error; AVLT: Auditory Verbal Learning; TP: True positives; FP: False positives*For the timed NB tests, beta estimates were multiplied by -1 so that negative scores always indicate poorer test performance.Bolded if p < 0.05Risk (negative) correlation (higher exposure -> worse NB performance)Protective (positive) correlation (higher exposure -> better NB performance)
Grooved Pegboard,
dominant hand: s
Sequences B latency: s
Solvents in mixing pesticides (yes vs. no)
Gasoline to clean (yes vs. no)
AVLT Total Recall: # correct
AVLT Delayed Recall: # correct
AVLT Recognition: (TP-
FP)
Sequences A latency: s
Digit-symbol: s
Beta* (SE) Beta* (SE)Beta* (SE)Beta (SE)Beta (SE)Beta* (SE)
Ref.
Solvents to clean (yes vs. no)
Continuous Performance
Test: ms
Finger Tapping, dominant hand:
# taps
Ref. Ref.
Beta (SE)Beta (SE)Beta* (SE)
Ref. Ref.Ref.Ref.Ref.Ref.Ref.Ref.
Ref. Ref. Ref. Ref.
Ref. Ref. Ref.
Ref. Ref. Ref. Ref. Ref.
Ref. Ref. Ref. Ref.
Ref. Ref. Ref. Ref.Ref. Ref. Ref. Ref. Ref.
Siegel
64

Any solventsEver vs. never -0.956 (3.077) 0.378 (1.428) -1.376 (0.758) 2.966 (1.746) 0.177 (0.334) 0.088 (0.208) -0.087 (0.197) -0.826 (0.973) 0.775 (1.419)Never use1-36 years -0.071 (3.850) 0.387 (1.728) -1.077 (0.913) 3.156 (2.055) 0.125 (0.418) 0.056 (0.251) -0.143 (0.237) -0.282 (1.175) 0.189 (1.697)> 36 years -1.940 (4.012) 0.367 (1.796) -1.715 (0.952) 2.738 (2.177) 0.233 (0.433) 0.125 (0.262) -0.023 (0.248) -1.435 (1.222) 1.457 (1.785)
GasolineEver vs. never 0.328 (3.273) -0.888 (1.522) -1.632 (0.807) 0.417 (1.833) -0.159 (0.356) -0.183 (0.222) -0.074 (0.210) -1.620 (1.035) -0.810 (1.509)Never use1-21 years 1.522 (4.181) 0.829 (1.913) -1.101 (1.004) 1.716 (2.229) 0.382 (0.451) -0.203 (0.276) 0.277 (0.260) -0.073 (1.293) 0.077 (1.881)> 21 years -0.955 (4.305) -2.556 (1.893) -2.175 (1.011) -0.994 (2.293) -0.753 (0.468) -0.162 (0.279) -0.434 (0.263) -3.135 (1.283) -1.691 (1.877)
Paint thinnerEver vs. never -3.043 (4.813) -0.614 (2.039) -2.052 (1.074) 2.539 (2.486) 0.596 (0.521) 0.361 (0.296) 0.057 (0.280) 0.004 (1.368) 0.343 (1.974)Never use1-17 years -5.916 (6.562) -1.036 (2.774) -2.915 (1.454) 2.250 (3.275) 0.392 (0.705) 0.560 (0.398) 0.113 (0.379) 1.490 (1.863) -0.061 (2.689)> 17 years -0.046 (6.695) -0.173 (2.834) -1.130 (1.500) 2.853 (3.402) 0.815 (0.729) 0.146 (0.413) -0.004 (0.392) -1.543 (1.898) 0.763 (2.740)
Petroleum distillatesEver vs. never -0.737 (3.508) 0.847 (1.586) -1.018 (0.839) 4.189 (1.866) 0.157 (0.382) 0.032 (0.230) -0.001 (0.218) 0.479 (1.075) 1.684 (1.563)Never use1-30.5 years -4.380 (4.649) -0.010 (2.044) -0.744 (1.075) 4.800 (2.373) 0.148 (0.501) -0.111 (0.294) -0.396 (0.278) 0.051 (1.395) -0.634 (2.031)> 30.5 years 2.807 (4.594) 1.685 (2.026) -1.293 (1.077) 3.585 (2.362) 0.166 (0.505) 0.176 (0.295) 0.396 (0.279) 0.881 (1.362) 3.816 (1.966)
0.555 (4.957) -0.408 (2.105) -0.153 (1.121) 3.399 (2.452) 0.854 (0.539) 0.379 (0.309) 0.342 (0.291) -2.771 (1.412) 1.151 (2.073)
-2.142 (3.086) -2.642 (1.309) -0.088 (0.696) 0.386 (1.524) 0.197 (0.331) 0.064 (0.189) -0.148 (0.181) -0.993 (0.885) 0.341 (1.287)
-0.002 (3.372) -0.970 (1.424) 0.098 (0.756) 0.900 (1.673) -0.501 (0.360) -0.260 (0.204) -0.486 (0.195) 0.073 (0.961) 2.255 (1.398)
SE: Standard error; AVLT: Auditory Verbal Learning; TP: True positives; FP: False positives*For the timed NB tests, beta estimates were multiplied by -1 so that negative scores always indicate poorer test performance.Bolded if p < 0.05Risk (negative) correlation (higher exposure -> worse NB performance)Protective (positive) correlation (higher exposure -> better NB performance)
AVLT Recognition: (TP-
FP)
Sequences A latency: s
Sequences B latency: s
Solvents in mixing pesticides (yes vs. no)
Gasoline to clean (yes vs. no)
AVLT Total Recall: # correct
AVLT Delayed Recall: # correct
Beta (SE) Beta (SE) Beta (SE) Beta* (SE) Beta* (SE)
Ref. Ref. Ref. Ref.
Solvents to clean (yes vs. no)
Continuous Performance
Test: msDigit-symbol: s
Finger Tapping, dominant hand:
# taps
Grooved Pegboard,
dominant hand: s
Beta* (SE) Beta* (SE) Beta (SE) Beta* (SE)
Ref. Ref. Ref. Ref.
Ref. Ref. Ref.
Ref.
Ref. Ref. Ref. Ref. Ref. Ref. Ref. Ref. Ref.
Table 11: Relationship between solvent exposure duration and NB test performance using multiple linear regression controlling for NB test-specific base model covariates (Table 9)
Ref.
Ref. Ref. Ref. Ref. Ref. Ref. Ref. Ref. Ref.
Ref. Ref. Ref. Ref. Ref.
Siegel
65

Appendix A: Pesticide analysis base model selectionA.1: Backwards elimination of covariates associated with continuous log10-CES-D score (linear regression)
Crude p-valueBase
model p-value
Beta - age
forced
p-value - age
forcedState 0.107 -- -- --Age 0.530 Forced 0.001 0.565Education 0.532 -- -- --Marital status 0.105 0.135 0.073 0.125Smoking 0.252 -- -- --Alcohol use 0.187 -- -- --PPE use 0.564 -- -- --Solvent use 0.011 0.014 0.074 0.016Welding 0.893 -- -- --Soldering 0.149 -- -- --Off-farm job 0.631 -- -- --Head injury 0.767 -- -- --R-sq (with age): 0.013Final base model: Adjusted for age, marital status, and solvent use
A.2: Backwards elimination of covariates associated with high- vs. low- risk for depression (logistic regression)
Crude p-valueBase
model p-value
p-value - age
forcedState 0.070 -- --Age 0.387 Forced 0.783Education 0.819 -- --Marital status 0.130 -- --Smoking 0.059 0.094 0.109Alcohol use 0.067 0.113 0.111PPE use 0.244 -- --Solvent use 0.020 0.065 0.063Welding 0.669 -- --Soldering 0.062 -- --Off-farm job 0.052 0.098 0.135Head injury 0.852 -- --ORs and 95% CIs not shownAIC (with age): 399.875Final base model: Adjusted for age, smoking, alcohol use, solvent exposure, and off-farm job
Siegel
66

Appendix B: Pesticide exposure and high- vs. low-risk for depression using logistic regression
EVER VS. NEVER EXPOSEDOrganophosphates
Acephate 1.146 (0.619 - 2.121) 0.846 (0.438 - 1.633)Chlorpyrifos 1.031 (0.595 - 1.785) 1.055 (0.598 - 1.860)Coumaphos 0.578 (0.225 - 1.485) 0.674 (0.258 - 1.761)Diazinon 0.869 (0.502 - 1.505) 0.805 (0.457 - 1.420)Dichlorvos 0.392 (0.153 - 1.001) 0.466 (0.179 - 1.216)Dimethoate 0.683 (0.239 - 1.951) 0.733 (0.252 - 2.132)Disulfoton 0.865 (0.398 - 1.880) 0.738 (0.331 - 1.645)Ethoprop 1.941 (1.052 - 3.584) 1.576 (0.825 - 3.011)Fonofos 0.778 (0.416 - 1.454) 0.975 (0.504 - 1.884)Malathion 0.764 (0.417 - 1.400) 0.812 (0.436 - 1.512)Parathion 0.591 (0.274 - 1.278) 0.579 (0.263 - 1.278)Phorate 0.620 (0.332 - 1.157) 0.784 (0.409 - 1.506)Phosmet 0.529 (0.206 - 1.357) 0.571 (0.217 - 1.502)Tebupirimfos 0.302 (0.072 - 1.267) 0.400 (0.094 - 1.709)Terbufos 0.904 (0.528 - 1.549) 0.993 (0.569 - 1.734)Tetrachlorvinphos 0.302 (0.072 - 1.267) 0.364 (0.086 - 1.550)
CarbamatesAldicarb 1.467 (0.778 - 2.768) 1.299 (0.675 - 2.499)Benomyl 1.699 (0.898 - 3.217) 1.534 (0.796 - 2.956)Carbaryl 0.908 (0.524 - 1.575) 0.715 (0.398 - 1.286)Carbofuran 0.738 (0.420 - 1.297) 0.797 (0.447 - 1.421)
High Pesticide Exposure Event* 1.573 (0.875 - 2.830) 1.577 (0.861 - 2.891)
LIFETIME DAYS OF EXPOSURE (log10)Organophosphates
Acephate 1.014 (0.715 - 1.438) 0.852 (0.584 - 1.244)Chlorpyrifos 0.981 (0.722 - 1.333) 1.000 (0.726 - 1.378)Coumaphos 0.787 (0.412 - 1.503) 0.882 (0.461 - 1.685)Diazinon 0.888 (0.619 - 1.274) 0.831 (0.575 - 1.202)Dichlorvos 0.697 (0.446 - 1.088) 0.758 (0.483 - 1.191)Dimethoate 0.688 (0.314 - 1.505) 0.720 (0.327 - 1.587)Disulfoton 0.896 (0.537 - 1.496) 0.807 (0.474 - 1.372)Ethoprop 1.422 (0.958 - 2.111) 1.226 (0.807 - 1.863)Fonofos 0.874 (0.596 - 1.280) 0.991 (0.666 - 1.474)Malathion 1.046 (0.761 - 1.437) 1.079 (0.780 - 1.493)Parathion 0.610 (0.344 - 1.085) 0.600 (0.331 - 1.088)Phorate 0.730 (0.491 - 1.086) 0.838 (0.557 - 1.261)Phosmet 0.660 (0.358 - 1.216) 0.693 (0.373 - 1.288)Tebupirimfos 0.437 (0.165 - 1.159) 0.524 (0.196 - 1.400)Terbufos 0.933 (0.699 - 1.245) 0.972 (0.723 - 1.307)Tetrachlorvinphos 0.418 (0.150 - 1.168) 0.475 (0.168 - 1.343)
CarbamatesAldicarb 1.264 (0.885 - 1.805) 1.189 (0.818 - 1.726)Benomyl 0.875 (0.516 - 1.485) 0.821 (0.476 - 1.414)Carbaryl 0.982 (0.736 - 1.310) 0.838 (0.612 - 1.148)Carbofuran 0.861 (0.596 - 1.243) 0.872 (0.604 - 1.259)
All Organophosphate Pesticides 0.697 (0.491 - 0.990) 0.742 (0.516 - 1.068)All Pesticides 0.790 (0.462 - 1.353) 0.872 (0.508 - 1.497)OR: Odds ratio; CI: Confidence interval*Adjusted for age, smoking, alcohol use, solvent exposure, and off-farm jobBolded if p < 0.05Risk (positive) correlation (higher exposure -> more depressions symptoms)Protective (negative) correlation (higher exposure -> less depressions symptoms)
B.1: Relationship between pesticide exposures (ever vs. never exposed) and high-risk for depression (logistic regression)
B.2: Relationship between pesticide exposures (log10-transformed lifetime days of exposure) and high-risk for depression (logistic regression)
OR (95% CI) OR (95% CI)
Crude Adjusted*
Crude Adjusted*
OR (95% CI) OR (95% CI)
Siegel
67

Appendix C: Further categorization of duration of most common solvent exposures
Quartiles n %Any solvents
Never use 413 58.921-18 years 76 10.8419-36 years 70 9.9937-49 years 72 10.27> 49 years 70 9.99
GasolineNever use 478 68.191-6 years 58 8.277-21 years 57 8.1322-45 years 54 7.70> 45 years 54 7.70
Siegel
68
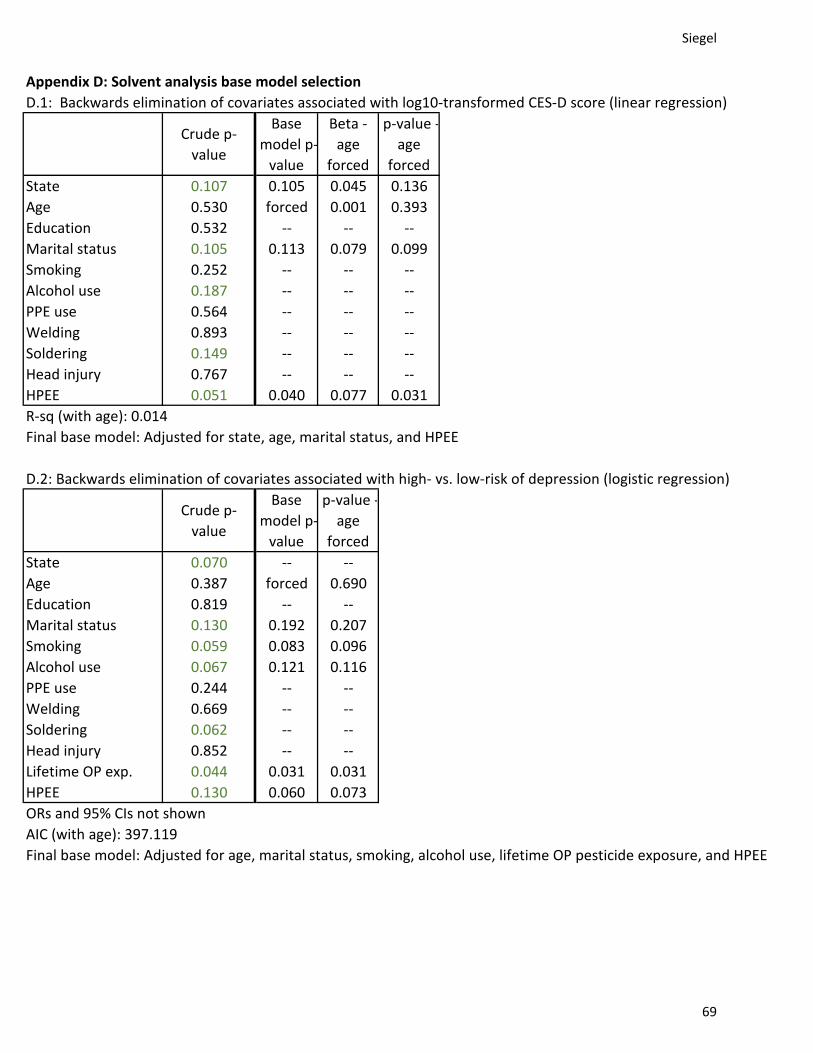
Appendix D: Solvent analysis base model selectionD.1: Backwards elimination of covariates associated with log10-transformed CES-D score (linear regression)
Crude p-value
Base model p-
value
Beta - age
forced
p-value - age
forcedState 0.107 0.105 0.045 0.136Age 0.530 forced 0.001 0.393Education 0.532 -- -- --Marital status 0.105 0.113 0.079 0.099Smoking 0.252 -- -- --Alcohol use 0.187 -- -- --PPE use 0.564 -- -- --Welding 0.893 -- -- --Soldering 0.149 -- -- --Head injury 0.767 -- -- --HPEE 0.051 0.040 0.077 0.031R-sq (with age): 0.014Final base model: Adjusted for state, age, marital status, and HPEE
D.2: Backwards elimination of covariates associated with high- vs. low-risk of depression (logistic regression)
Crude p-value
Base model p-
value
p-value - age
forcedState 0.070 -- --Age 0.387 forced 0.690Education 0.819 -- --Marital status 0.130 0.192 0.207Smoking 0.059 0.083 0.096Alcohol use 0.067 0.121 0.116PPE use 0.244 -- --Welding 0.669 -- --Soldering 0.062 -- --Head injury 0.852 -- --Lifetime OP exp. 0.044 0.031 0.031HPEE 0.130 0.060 0.073ORs and 95% CIs not shownAIC (with age): 397.119Final base model: Adjusted for age, marital status, smoking, alcohol use, lifetime OP pesticide exposure, and HPEE
Siegel
69

p-value p-valueAny solvents
Never use1-18 years (N=76) 0.060 (0.049) 0.220 0.053 (0.051) 0.29219-36 years (N=70) 0.059 (0.051) 0.249 0.042 (0.054) 0.43737-49 years (N=72) 0.160 (0.050) 0.002 0.146 (0.052) 0.005> 49 years (N=70) 0.029 (0.052) 0.568 0.023 (0.056) 0.680
GasolineNever use1-6 years (N=58) 0.059 (0.056) 0.296 0.050 (0.058) 0.3827-21 years (N=57) 0.095 (0.056) 0.087 0.083 (0.059) 0.16022-45 years (N=54) 0.069 (0.057) 0.227 0.056 (0.059) 0.344> 45 years (N=54) 0.107 (0.057) 0.060 0.109 (0.060) 0.068
SE: Standard error*Adjusted for state, age, marital status, and HPEEBolded if p < 0.05Risk (positive) correlation (higher exposure -> more depressions symptoms)Protective (negative) correlation (higher exposure -> less depressions symptoms)
Appendix E: Relationship between solvent exposures and log10-CESD score (linear regression) using smaller categories of duration
Ref. Ref.
Ref. Ref.
Crude Adjusted*Beta (SE) Beta (SE)
Siegel
70

Appendix F: Solvent exposure and high- vs. low-risk for depression using logistic regressionF.1: Relationship between solvent exposures and high-risk for depression (logistic regression)
Any solventsEver vs. never 1.903 (1.107 - 3.270) 1.791 (1.024 - 3.130)Never use1-36 years 1.866 (0.970 - 3.589) 1.700 (0.864 - 3.342)> 36 years 1.942 (1.009 - 3.739) 1.898 (0.949 - 3.795)
GasolineEver vs. never 1.613 (0.931 - 2.793) 1.522 (0.858 - 2.700)Never use1-21 years 1.427 (0.699 - 2.913) 1.278 (0.611 - 2.674)> 21 years 1.813 (0.921 - 3.569) 1.816 (0.893 - 3.690)
Paint thinnerEver vs. never 1.554 (0.731 - 3.306) 1.474 (0.677 - 3.208)Never use1-17 years 0.964 (0.287 - 3.245) 0.939 (0.271 - 3.256)> 17 years 2.240 (0.891 - 5.629) 2.060 (0.794 - 5.345)
Petroleum distillatesEver vs. never 1.532 (0.859 - 2.729) 1.335 (0.729 - 2.445)Never use1-30.5 years 2.056 (1.028 - 4.110) 1.902 (0.924 - 3.916)> 30.5 years 1.066 (0.461 - 2.465) 0.870 (0.364 - 2.079)
1.665 (0.781 - 3.549) 2.216 (0.993 - 4.941)
1.358 (0.770 - 2.394) 1.484 (0.825 - 2.671)
1.275 (0.696 - 2.335) 1.190 (0.637 - 2.222)
F.2: Relationship between solvent exposures and high-risk for depression (logistic regression) using smaller categories of solvent exposure
Any solventsNever use1-18 years (N=76) 2.019 (0.906 - 4.502) 2.080 (0.914 - 4.737)19-36 years (N=70) 1.699 (0.707 - 4.085) 1.359 (0.544 - 3.393)37-49 years (N=72) 2.428 (1.115 - 5.284) 2.130 (0.950 - 4.779)> 49 years (N=70) 1.456 (0.576 - 3.684) 1.587 (0.594 - 4.244)
GasolineNever use1-6 years (N=58) 0.748 (0.222 - 2.522) 0.705 (0.205 - 2.421)7-21 years (N=57) 2.162 (0.947 - 4.937) 1.862 (0.789 - 4.393)22-45 years (N=54) 1.351 (0.505 - 3.618) 1.265 (0.461 - 3.473)> 45 years (N=54) 2.306 (1.007 - 5.283) 2.558 (1.049 - 6.238)
OR: Odds ratio; CI: Confidence interval*Adjusted for age, marital status, smoking, alcohol use, lifetime OP pesticide exposure, and HPEEBolded if p < 0.05Risk (positive) correlation (higher exposure -> more depressions symptoms)Protective (negative) correlation (higher exposure -> less depressions symptoms)
Ref. Ref.
Ref. Ref.
Solvents to clean (yes vs. no)
Crude Adjusted*OR (95% CI) OR (95% CI)
Gasoline to clean (yes vs. no)
Crude Adjusted*
Solvents in mixing pesticides (yes vs. no)
OR (95% CI) OR (95% CI)
Ref. Ref.
Ref. Ref.
Ref. Ref.
Ref. Ref.
Siegel
71

Appendix G: NB BASE MODELS*Timed test betas multiplied by -1**If both pesticide vars are significant, continue with all-pesticide variable only
G.1: Backwards elimination of co-variates associated with Continuous Performance TestInitial crude p-
value Final Beta*Final p-value
State 0.066 -- --Age <0.001 -1.527 <0.001Education 0.001 -- --Marital status 0.963 -- --Smoking 0.574 -- --Alcohol use 0.005 -- --PPE use 0.263 -- --ALL pesticides (log cont.) 0.347 -- --OP pesticides (log cont.) 0.997 -- --Welding 0.820 -- --Soldering 0.795 -- --Caffeine 0.011 8.090 0.020Head injury 0.512 -- --Height 0.130 -- --Anti-depressant 0.973 -- --Reading ability <0.001 0.622 <0.001Positive affect <0.001 4.449 0.055Negative affect 0.314 -- --Visual acuity <0.001 -7.584 0.080
G.2: Backwards elimination of co-variates associated with Digit-Symbol Test
With exclusionsInitial crude p-
value Final Beta*Final p-value
State <0.001 -4.622 0.001Age <0.001 -1.103 <0.001Education <0.001 3.155 0.023Marital status 0.985 -- --Smoking (cur vs. nev) 0.103 -0.677 0.796Smoking (past vs. nev) 2.394 0.083Alcohol use <0.001 -- --PPE use 0.045 -- --ALL pesticides (log cont.) 0.985 -- --OP pesticides (log cont.) 0.977 -- --Welding 0.696 -- --Soldering 0.728 -- --Caffeine 0.304 -- --
Siegel
72

Head injury 0.750 -- --Height 0.055 -- --Anti-depressant 0.869 -- --Reading ability <0.001 0.427 <0.001Positive affect <0.001 4.779 <0.001Negative affect 0.401 -- --Visual acuity <0.001 -5.212 0.005
G.3: Backwards elimination of co-variates associated with Finger TappingInitial crude p-
value Final BetaFinal p-value
State <0.001 -2.297 0.001Age <0.001 -0.246 <0.001Education 0.145 -- --Marital status 0.900 -- --Smoking 0.390 -- --Alcohol use 0.006 -- --PPE use 0.397 -- --ALL pesticides (log cont.) 0.257 -- --OP pesticides (log cont.) 0.556 -- --Welding 0.497 -- --Soldering 0.986 -- --Caffeine 0.851 -- --Head injury 0.224 -- --Height 0.032 -- --Anti-depressant 0.844 -- --Reading ability <0.001 0.137 <0.001Positive affect 0.001 0.961 0.066Negative affect 0.566 -- --Visual acuity <0.001 -- --
G.4: Backwards elimination of co-variates associated with Grooved PegboardInitial crude p-
value Final Beta*Final p-value
State <0.001 -3.207 0.042Age <0.001 -1.059 <0.001Education 0.005 2.263 0.158Marital status 0.528 -- --Smoking 0.299 -- --Alcohol use 0.004 -- --PPE use 0.010 3.483 0.117ALL pesticides (log cont.) 0.801 -- --OP pesticides (log cont.) 0.936 -- --
Siegel
73

Welding 0.002 3.879 0.036Soldering 0.707 -- --Caffeine 0.019 3.456 0.042Head injury 0.341 -- --Height 0.271 -- --Anti-depressant 0.856 -- --Reading ability <0.001 0.128 0.102Positive affect 0.001 -6.365 0.003Negative affect 0.497 -- --Visual acuity <0.001 -- --
G.5: Backwards elimination of co-variates associated with Auditory Verbal Learning (AVLT) Total RecallInitial crude p-
value Final BetaFinal p-value
State 0.042 -- --Age <0.001 -0.174 <0.001Education <0.001 0.859 0.014Marital status 0.786 -- --Smoking (cur vs. nev) 0.001 0.916 0.170Smoking (past vs. nev) -0.387 0.272Alcohol use 0.061 -- --PPE use 0.113 -- --ALL pesticides (log cont.) 0.186 -- --OP pesticides (log cont.) 0.499 -- --Welding 0.368 -- --Soldering 0.362 -- --Caffeine 0.112 -- --Head injury 0.376 -- --Height 0.064 -- --Anti-depressant 0.453 -- --Reading ability <0.001 0.099 <0.001Positive affect <0.001 0.625 0.019Negative affect 0.012 -1.156 0.005Visual acuity <0.001 -- --
G.6: Backwards elimination of co-variates associated with AVLT Delayed RecallInitial crude p-
value Final BetaFinal p-value
State 0.003 -0.315 0.126Age <0.001 -0.090 <0.001Education <0.001 0.632 0.002Marital status 0.241 -- --Smoking 0.001 -- --
Siegel
74

Alcohol use 0.205 -- --PPE use 0.134 -- --ALL pesticides (log cont.)** 0.005 0.562 0.004OP pesticides (log cont.) 0.123 -- --Welding 0.342 -- --Soldering 0.719 -- --Caffeine 0.337 -- --Head injury: no loss of consc. vs. none
0.122-0.374 0.250
Head injury: loss of consc. vs. none 0.364 0.200Height 0.013 -- --Anti-depressant 0.069 0.874 0.017Reading ability <0.001 0.041 <0.001Positive affect <0.001 0.350 0.020Negative affect 0.020 -0.685 0.003Visual acuity <0.001 -0.369 0.165
G.7: Backwards elimination of co-variates associated with AVLT RecognitionInitial crude p-
value Final BetaFinal p-value
State <0.001 -0.795 <0.001Age <0.001 -0.061 <0.001Education <0.001 0.703 <0.001Marital status 0.796 -- --Smoking 0.424 -- --Alcohol use 0.296 -- --PPE use 0.032 -- --ALL pesticides (log cont.) 0.194 -- --OP pesticides (log cont.) 0.570 -- --Welding 0.633 -- --Soldering 0.686 -- --Caffeine 0.665 -- --Head injury 0.260 -- --Height 0.010 -- --Anti-depressant 0.506 -- --Reading ability <0.001 0.043 <0.001Positive affect <0.001 0.207 0.148Negative affect 0.050 -0.459 0.036Visual acuity 0.004 -- --
G.8: Backwards elimination of co-variates associated with Sequences A
Siegel
75

With exclusionInitial crude p-
value Final Beta*Final p-value
State <0.001 -2.819 0.001Age <0.001 -0.639 <0.001Education <0.001 -- --Marital status 0.835 -- --Smoking 0.044 -- --Alcohol use 0.001 -- --PPE use 0.371 -- --ALL pesticides (log cont.) 0.759 -- --OP pesticides (log cont.) 0.762 -- --Welding 0.585 -- --Soldering 0.502 -- --Caffeine 0.381 -- --Head injury 0.464 -- --Height 0.138 -- --Anti-depressant 0.644 -- --Reading ability <0.001 0.400 <0.001Positive affect <0.001 2.211 0.001Negative affect 0.548 -- --Visual acuity <0.001 -- --
G.9: Backwards elimination of co-variates associated with Sequences A
With exclusionInitial crude p-
value Final Beta*Final p-value
State <0.001 -4.936 <0.001Age <0.001 -0.954 <0.001Education <0.001 -- --Marital status 0.659 -- --Smoking 0.088 -- --Alcohol use 0.010 -- --PPE use 0.085 -- --ALL pesticides (log cont.) 0.668 -- --OP pesticides (log cont.) 0.161 -- --Welding 0.476 -- --Soldering 0.238 -- --Caffeine 0.891 -- --Head injury 0.275 -- --Height 0.003 -- --Anti-depressant 0.770 -- --Reading ability <0.001 0.530 <0.001Positive affect <0.001 4.177 <0.001Negative affect 0.897 -- --
Siegel
76

Visual acuity <0.001 -- --
Siegel
77

Appendix H: Exploring linear regression (controlling for covariates) with two largest exposure variables as quartiles
Any solventsNever use1-18 years (N=76) 2.195 (4.968) 1.261 (2.152) -1.315 (1.138) 2.728 (2.536) 1.212 (0.534) 0.425 (0.313) 0.015 (0.295) 0.904 (1.464) 2.198 (2.105)19-36 years (N=70) -2.629 (5.209) -0.654 (2.309) -0.794 (1.216) 3.632 (2.694) -1.077 (0.559) -0.375 (0.333) -0.330 (0.315) -1.686 (1.565) -2.197 (2.247)37-49 years (N=72) -2.774 (5.147) 1.567 (2.236) -1.456 (1.192) 5.219 (2.661) 0.420 (0.555) 0.137 (0.326) -0.432 (0.309) -1.335 (1.511) 2.996 (2.234)> 49 years (N=70) -0.947 (5.388) -1.059 (2.375) -1.995 (1.250) -0.118 (2.808) 0.063 (0.575) 0.097 (0.342) 0.431 (0.324) -1.600 (1.609) -0.333 (2.322)
GasolineNever use1-6 years (N=58) -3.263 (5.628) -0.804 (2.447) -0.617 (1.274) 1.081 (2.834) 1.105 (0.600) 0.012 (0.351) 0.482 (0.331) 0.497 (1.667) 1.914 (2.399)7-21 years (N=57) 6.326 (5.602) 2.594 (2.551) -1.625 (1.334) 2.395 (2.943) -0.362 (0.608) -0.446 (0.367) 0.042 (0.346) -0.684 (1.701) -1.915 (2.482)22-45 years (N=54) -5.611 (5.718) -4.502 (2.480) -1.026 (1.321) -0.391 (2.917) -1.052 (0.620) -0.401 (0.363) -0.826 (0.342) -4.132 (1.671) -4.080 (2.477)> 45 years (N=54) 3.928 (5.839) -0.476 (2.507) -3.408 (1.347) -1.626 (3.049) -0.432 (0.636) 0.074 (0.370) -0.037 (0.349) -2.128 (1.708) 0.539 (2.463)
SE: Standard error; AVLT: Auditory Verbal Learning; TP: True positives; FP: False positives*For the timed NB tests, beta estimates were multiplied by -1 so that negative scores always indicate poorer test performance.Bolded if p < 0.05Risk (negative) correlation (higher exposure -> worse NB performance)Protective (positive) correlation (higher exposure -> better NB performance)
Ref.
Ref.
Beta* (SE) Beta* (SE) Beta* (SE) Beta* (SE) Beta* (SE) Beta* (SE) Beta* (SE) Beta* (SE) Beta* (SE)
Ref.
Ref.
Ref.
Ref.
Ref.
Ref.
Ref.
Ref.
Ref.
Ref.Ref.
Ref. Ref.
Ref.
Ref.
Ref.
AVLT Recognition:
(TP - FP)
Sequences A latency: s (with
exclusion)
Sequences B latency: s (with
exclusion)
Continuous Performance
Test (CPT): ms
Digit-symbol: s (with
exclusions)
Finger Tapping, dominant
hand: # taps
Grooved Pegboard, dominant
hand: s
AVLT Total Recall: # correct
AVLT Delayed Recall: # correct
Siegel
78

Appendix I: Multivariate regression hypothetical examples
I.1: Analysis 1- Dichlorvos vs. CES-D scoreCES-D score Intercept cumulative days of exposure age marital status solvent use
(0=married; 1=single) (0=no; 1=yes)Example 1 Hypothetical value 5.14 -- 20 60 0 1(Q1) Beta -- 0.651 -0.037 0.001 0.069 0.064
Model value 0.71 0.651 -0.048 0.045 0.000 0.064Example 2 Hypothetical value 4.94 -- 57.5 60 0 1(Median) Beta -- 0.651 -0.037 0.001 0.069 0.064
Model value 0.69 0.651 -0.065 0.045 0.000 0.064Example 3 Hypothetical value 4.59 -- 421.75 60 0 1(Q3) Beta -- 0.651 -0.037 0.001 0.069 0.064
Model value 0.66 0.651 -0.097 0.045 0.000 0.064
I.2: Analysis 1- Disulfoton vs. CES-D scoreCES-D score Intercept cumulative days of exposure age marital status solvent use
(0=married; 1=single) (0=no; 1=yes)Example 1 Hypothetical value 7.74 -- 20 60 1 1(Q1) Beta -- 0.637 0.061 0.000 0.076 0.068
Model value 0.89 0.637 0.079 0.029 0.076 0.068Example 2 Hypothetical value 7.84 -- 24.5 60 1 1(Median) Beta -- 0.637 0.061 0.000 0.076 0.068
Model value 0.89 0.637 0.085 0.029 0.076 0.068Example 3 Hypothetical value 8.25 -- 56 60 1 1(Q3) Beta -- 0.637 0.061 0.000 0.076 0.068
Model value 0.92 0.637 0.107 0.029 0.076 0.068
I.3: Analysis 1- Ethoprop vs. CES-D scoreCES-D score Intercept cumulative days of exposure age marital status solvent use
(0=married; 1=single) (0=no; 1=yes)Example 1 Hypothetical value 5.62 -- 20 45 0 0(Q1) Beta -- 0.619 0.075 0.001 0.074 0.062
Model value 0.75 0.619 0.097 0.033 0.000 0.000Example 2 Hypothetical value 5.70 -- 24.5 45 0 0(Median) Beta -- 0.619 0.075 0.001 0.074 0.062
Model value 0.76 0.619 0.104 0.033 0.000 0.000Example 3 Hypothetical value 6.07 -- 56 45 0 0(Q3) Beta -- 0.619 0.075 0.001 0.074 0.062
Siegel
79
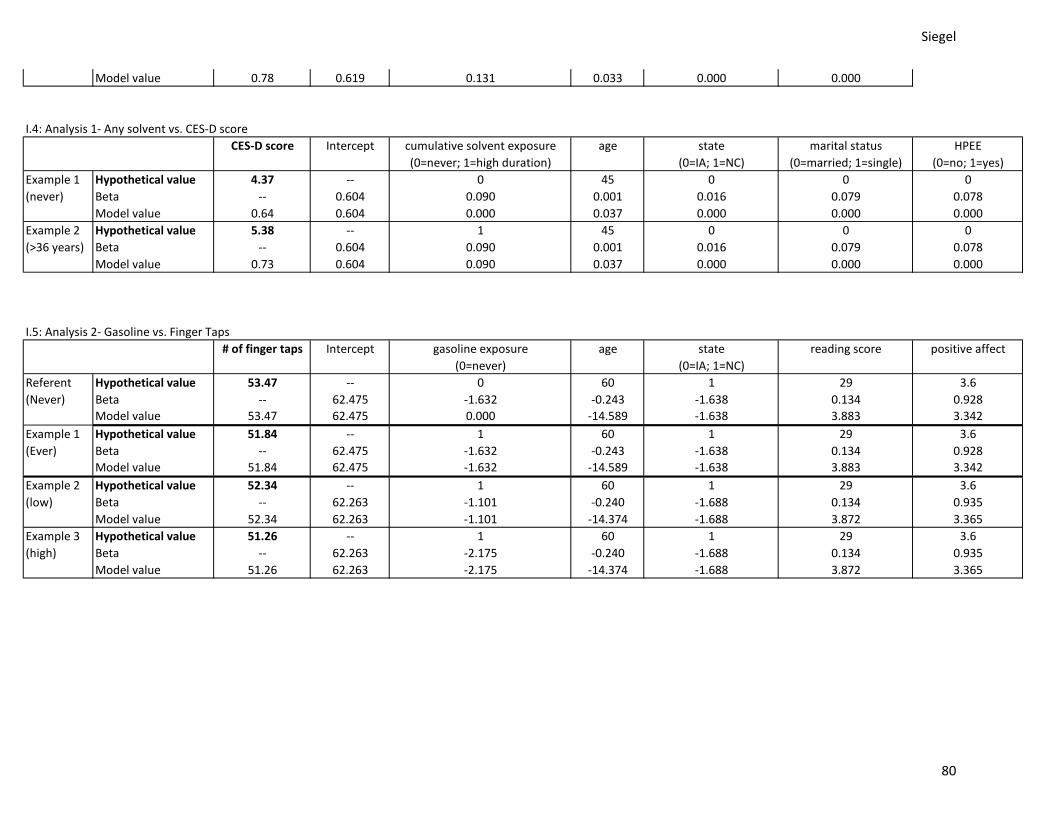
Model value 0.78 0.619 0.131 0.033 0.000 0.000
I.4: Analysis 1- Any solvent vs. CES-D scoreCES-D score Intercept cumulative solvent exposure age state marital status HPEE
(0=never; 1=high duration) (0=IA; 1=NC) (0=married; 1=single) (0=no; 1=yes)Example 1 Hypothetical value 4.37 -- 0 45 0 0 0(never) Beta -- 0.604 0.090 0.001 0.016 0.079 0.078
Model value 0.64 0.604 0.000 0.037 0.000 0.000 0.000Example 2 Hypothetical value 5.38 -- 1 45 0 0 0(>36 years) Beta -- 0.604 0.090 0.001 0.016 0.079 0.078
Model value 0.73 0.604 0.090 0.037 0.000 0.000 0.000
I.5: Analysis 2- Gasoline vs. Finger Taps# of finger taps Intercept gasoline exposure age state reading score positive affect
(0=never) (0=IA; 1=NC)Referent Hypothetical value 53.47 -- 0 60 1 29 3.6(Never) Beta -- 62.475 -1.632 -0.243 -1.638 0.134 0.928
Model value 53.47 62.475 0.000 -14.589 -1.638 3.883 3.342Example 1 Hypothetical value 51.84 -- 1 60 1 29 3.6(Ever) Beta -- 62.475 -1.632 -0.243 -1.638 0.134 0.928
Model value 51.84 62.475 -1.632 -14.589 -1.638 3.883 3.342Example 2 Hypothetical value 52.34 -- 1 60 1 29 3.6(low) Beta -- 62.263 -1.101 -0.240 -1.688 0.134 0.935
Model value 52.34 62.263 -1.101 -14.374 -1.688 3.872 3.365Example 3 Hypothetical value 51.26 -- 1 60 1 29 3.6(high) Beta -- 62.263 -2.175 -0.240 -1.688 0.134 0.935
Model value 51.26 62.263 -2.175 -14.374 -1.688 3.872 3.365
Siegel
80
Recommended