NBER WORKING PAPER SERIES
DO INDUSTRIAL RELATIONS INSTITUTIONS IMPACT ECONOMIC OUTCOMES?:INTERNATIONAL AND U.S. STATE-LEVEL EVIDENCE
Morris M. KleinerHwikwon Ham
Working Paper 8729http://www.nber.org/papers/w8729
NATIONAL BUREAU OF ECONOMIC RESEARCH1050 Massachusetts Avenue
Cambridge, MA 02138January 2002
Funding was provided in part by the Austrian Ministry of Science and Transportation. We thank SandyDonovan for her assistance with this paper, and Mario Bognanno, John Budd, Ronald B. Davies, JohnFreeman, Richard Freeman, Takao Kato, and Yijiang Wang for their comments on earlier versions of thispaper as well as participants at seminars at the Australian National University, National Bureau of EconomicResearch, University of Minnesota, and the University of Vienna. The views expressed herein are those ofthe authors and not necessarily those of the National Bureau of Economic Research.
© 2002 by Morris M. Kleiner and Hwikwon Ham. All rights reserved. Short sections of text, not to exceedtwo paragraphs, may be quoted without explicit permission provided that full credit, including © notice, isgiven to the source.

Do Industrial Relations Institutions Impact Economic Outcomes?:International and U.S. State-Level EvidenceMorris M. Kleiner and Hwikwon HamNBER Working Paper No. 8729January 2002JEL No. J5, F2, P0
ABSTRACT
The impact of government social and labor market institutions on economic outcomes have
generated a great deal of attention by economists and policymakers in the U.S. and in other nations. The
theoretical model suggests that there are trade offs of higher levels of economic outcomes with more
equity-producing labor market institutions. This study examines the impact of national levels of
unionization, strike levels, public policies toward labor, and the structure of collective bargaining within
a nation on a country's foreign direct investment (FDI). As an additional test of the relationship of labor
market institutions and state labor market policies and economic outcomes, we examine the empirical
relationship with the economic growth of U.S. states. Examining 20 OECD nations from 1985 through
1995 and all U.S. states from 1990 to 1999, our statistical analysis shows that higher levels of industrial
relations institutions are usually associated with lower levels of FDI and slower economic growth for U.S.
states. However, within the context of the model the results do not necessarily suggest that a nation or
state would be better off trading social equity through fewer restrictive industrial relations institutions for
higher levels of economic growth.
Morris M. Kleiner Hwikwon HamUniversity of Minnesota University of MinnesotaHumphrey Institute and Department of EconomicsIndustrial Relations Center 1035 Heller Hall260 Humphrey Center 1028 27th Ave South301 19th Street South Minneapolis, MN 55455Minneapolis, MN 55455 612-625-1304and NBER [email protected]@hhh.umn.edu

1
“It (exchanging equity for efficiency) is, in my view, our biggest socioeconomic tradeoff, and it plagues
us in dozens of dimensions of social policy. We can’t have our cake of market efficiency and share it
equally.”
Arthur M. Okun, 1975, p.2.
Introduction
The impact of government social and labor market institutions on economic outcomes have
generated a great deal of attention by analysts and policymakers in the U.S. and in other nations. An
integral part of the issue has been determining the appropriate level of labor market institutions. A
central question has been what is the impact of labor market institutions on the potential equity versus
efficiency trade-off in the economy that Arthur Okun referred to in the above quotation (Okun, 1975)?
Recent comparative analysis of the effect of labor market institutions on economic efficiency has stated
that a holistic approach to institutions, one that includes not just a single factor but a whole group of
laws and customs, should form the basis of the ranking of these labor market institutions (Freeman,
2000). In one of the models that Richard Freeman presents, he assumes that there are tradeoffs
between different types of labor market institutions and economic outcomes. However, in other
examples there is assumed to be multiple equilibrium with many different levels of labor market
institutions leading to optimal levels of economic efficiency. Within these alternative models trading
efficiency for equity (e.g., reducing income inequality) is small. For example, large increases in equity
are associated with small changes in efficiency as evaluated through measures of investment or
economic growth.

2
Recent studies on this issue have found contradictory theoretical and empirical results. A
theory-based analysis shows that there is much controversy about the kind of industrial relations
institutions that encourage foreign direct investment (FDI), with higher levels of centralization of labor
market institutions leading to greater levels of FDI (Leahy and Montagna, 2000). Empirical work using
U.S. states as the unit of observation shows there is considerable variation in the estimates of the impact
of state labor policies on measures of economic growth, but that greater restrictions are associated with
some declines in economic outputs (Autor, Donohue, and Schwab, 2000). In contrast, other studies
find that higher levels of overall labor market institutions have no impact on economic outcomes at the
state level (Block, Roberts, and Clarke, forthcoming). However, an analysis of the decline in the level
of U.S. labor market institutions over time shows that they impact income inequality (DiNardo, Fortin,
and Lemieux, 1996). Consequently, not only is the direction of the impact important, but also the
elasticity of labor market institutions and its effects on economic outcomes of interest in determining the
role of labor market institutions on economic outputs (Hatzius, 2000).
This study examines the economic impact of labor market institutions that affect wages, benefits,
and the “voice” of workers in the labor market as well as policies that influence the allocation of labor.
Specifically, we focus on the impact of national levels of unionization, strikes, bargaining structure,
voice-related public policies toward labor such as works councils, and the level ( i.e. plant, industry or
national) at which collective bargaining takes place within a nation on foreign direct investment (FDI).
As an additional test of the impact of labor market institutions, we examine the effect of state labor
market policies on various measures of economic growth for U.S. states. In our cross-country analysis
we assume and model that FDI in a country takes place relative to investment in the host nation and in

1 There are many additional reasons or other labor-related factors that affect FDI beyond the ones we couldquantify. Therefore, we also did some qualitative investigations by tape recording in-depth discussions with multi-national chemical manufacturing managers in two companies using a structured set of questions. In addition, facultyand Ph.D. students in Austria interviewed managers of similar companies in Germany. The dominant factors in theinterviews for FDI were the opportunities in the product market in other countries. However, several of the managersin one U.S. chemical firm stated that they had an “artificial intelligence” system or equation where the industrialrelations structure had explicit weights in the decision-making. U.S. firms we interviewed saw labor costs andrestrictions in their ability to allocate labor resources within an establishment or company as an impediment toefficiency that had to be counterbalanced by economic returns in the product market.
Other insights that were gained from our interviews with auto and chemical executives for the EU were thatEU managers were envious of the low levels of unionization and the ability to hire and fire workers in the U.S. Moreover, one auto executive mentioned that FDI was used to put pressure on local German unions by buildingnew plants in low union and low wage regions of the U.S. These interviews suggest that the economic opportunitiesoffered in the U.S. to E.U. nations appear to be relatively more attractive than the potential profits offered toAmerican firms in the E.U. Although corporate decision- makers on both sides of the Atlantic Ocean view laborcosts as only a moderately important item, restrictions in Western Europe seem to encourage outflows of FDI anddiscourage investment by Americans.
3
other developed nations. Consequently, we examine foreign investment between nations and over time.
Since we do not have measures of FDI for our U.S. state level measures, we specify estimates which
include outcomes such as gross state product, employment, and per capita income.
Labor-related factors such as methods of wage determination, strike activity, unionization,
mandated works councils, and other restrictions on management’s ability to allocate labor have often
been mentioned by business executives as important factors causing reductions in a firm’s willingness to
invest in a country1. The recent focus by groups concerned with the growth of international trade and
investment have stated that nations which compete for international capital are growing more concerned
about developing and maintaining the appropriate economic climate for the growth and maintenance of
good jobs. Since these factors together can be considered as an industrial relations system, we
develop a single measure to capture these elements into one variable consistent with the approach taken
by John Dunlop (1993). In this paper we examine the role of the industrial relations climate for those
nations deciding where to invest funds. We gather and use information on foreign direct investment

4
outflows in countries with the fewest labor market restrictions relative to countries where labor market
restrictions are much more widespread and limiting for management. We also attempt to provide
evidence on the role of these institutions for U.S. states. Although there has been much recent research
examining the determinants of U.S. investment in other countries, there has been little work comparing
the investment levels of the host relative to the receiving nation (Cooke, 1997, Cooke and Noble,
1998, and Cooke, 2000 and Bognanno et. al, 1998). Moreover, there also has been little research on
the role of labor market institutions on economic growth across U.S. states (Bartik, 1985, Block,
Roberts, Ozeki, and Roomkin, 2001).
While any one industrial relations factor may be important for a particular organization, these
factors taken together as an industrial relations system may provide the underlying latent variable that
will influence these economic decisions. The concept of an industrial relations system has been one of
the basic tenants of this field dating to the mid 1950s with publication of John Dunlop’s Industrial
Relations System in 1960 (1993). An overarching concept within the model was the view that parts
and elements of labor/management relationships and related public policies toward labor are
interdependent and may each affect other elements and the outcomes of the system as a whole
(Dunlop, 1993). Sumner Slichter noted that “ arrangements in the field of industrial relations may be
regarded as a system in the sense that each of them more or less intimately affects each of the others so
that they constitute a group of arrangements for dealing with certain matters and are collectively
responsible for certain results (Slichter, 1955).” Within this approach, public policies, bargaining
structure, and unionization would all have a prominent role to play in understanding the role of labor
market institutions. Consequently, any attempt to quantify the impact of industrial relations should be

5
taken in total rather than as a variable holding the other factors’ constant. The interactions of these
variables would be more important than each factor by itself. Unfortunately, statistical approaches that
use overall contextual variables are rare and as a result the systems approach has not been tested
regarding its relationship to economic outputs. In a manner similar to the estimates of the factors that
affect firm performance, a single independent factor may not matter, but together the industrial relations
system may affect economic outcomes (Ichniowski, Shaw, and Prennushi, 1998).
This study develops further the theory and rationale for using foreign direct investment (FDI)
decisions in both the host and receiving nation, and we discuss the role of the industrial relations system
on FDI. The model shows that firms and nations that take advantage of opportunities to invest abroad
will base those decisions in part on the costs of the industrial relations system. Further, our analysis of
states also assumes the industrial relations system impacts economic outcomes.
Theoretical Background of Firm Investment Decisions in Foreign Countries
In order to develop a model of the role of labor market institutions on economic outcomes, we
model a Nash efficient bargaining solution between labor and the owners of capital and include the
impact of labor market institutions, which in our model is the industrial relations system, as the
determinant of bargaining power.
At time period 0 a firm invests capital based on their profit maximization condition. Then at
time period 1 the firm bargains the wage contract with workers. If the bargain succeeds, the firm
produces products at their full capacity and pays bargained wage w*, which is determined by the
industrial relations system. Otherwise, it will fall back to its threat point production *f(k,1) and pay w0
to those workers willing to work at their reservation wage (Budd and Wang, 2001). * is the fraction
indicating sub-optimal production due to the quantity or quality of workers, which also is determined by
the industrial relations system.

6
The bargaining problem at time period 1 is
(w - w0)"(B - B0)1-" subject to B = f(k,1) - w ( k is a sunk cost) (1) ,k w
Max
Where w: Wage
w0 : Reservation Wage
k : Capital
B : Profit
B0 : *f(k,1) - w0 where 0 # * < 1
f(k,1) : Production function. Labor is normalized
fN >0 , fO < 0
0 # " # 1
Then the solution is w* = "(f(k,1) - B0) + (1-")w0 (2)
At time period 0 the rational firm uses this negotiated wage w* to decide on the optimum investment by
maximizing profits B = f(k,1) - rk - w.
f(k,1) - w - rk (3)k
Max
we substitute w with w* then
f(k,1) - "(f(k,1) - B0) + (1-")w0 - rk (4)k
Max
or
(1-")(f(k,1) - w0) + "B0 - rkk
Max
The first order condition is
(1-")f(k*,1)N + " *f(k*,1)N - r = 0 (5)
k* solving the first order condition is the optimum investment for the firm at time 0.

7
From here we obtain
(6)' '*
(1 ) '' '' 0f fkf f
δα α αδ
−∂∂ − += <
This implies that when a company makes investment decisions among locations which are identical
except for the industrial relations system (") , it will invest more where the industrial relations system
restrictions are fewer from management’s perspective.
A Game Theoretic Approach when the Industrial Relations System Provides Equity
The theory, thus far, has focused on the economic output aspects of FDI. In this section we
extend the model to explicitly include the equity effects of industrial relations institutions (IR). We
propose that countries also consider the industrial relations system to be an important determinate of
the social stability of a nation. For example, industrial relations institutions affect income distribution,
employee voice in the political system, and crime, which are all presumed to be elements of social well-
being (Rees, 1963, Freeman, 1994, DeNardo, Fortin and Lemieux, 1996,). Consequently, a country
may not want to engage in maximization behavior for only FDI at the expense of reducing the benefits
of having a well-developed industrial relations system. We model how countries may consider both the
industrial relations system and outputs of the economy through the level of FDI and chose an optimal
amount of each “good.”
Following a general game theoretic approach for an optimal level of labor market institutions
and its relationship to efficiency we expand upon these models to include two major players (Freeman
and Lazear, 1995, and Levine, 1995). We initially assume that there are only two countries or blocs
of countries A and B (e.g. the U.S.A. and the E.U.), and five strategies, which conform to a standard
Likert scale, with increasing values regarding the restrictiveness of the industrial relations system. The
lower values give management greater bargaining power.
The payoff is constructed as follows: Uf is the additional FDI, Uc is the additional social benefit
from implementing a specific IR system ( e.g. greater worker voice or bargaining power resulting in
more social stability). The industrial relations system is allowed to differ between countries and is

8
nonlinear. In Appendix 1 we solve for the equilibrium levels of both FDI and IR systems using a Nash
equilibrium approach. We also give examples of outcomes under conditions of efficiency but with no
social benefits as a consequence of an industrial relations system in the Appendix Table 1A. In
addition, we provide the case where there are explicit tradeoffs of equity and efficiency in the Appendix
Table 1B. The optimal solutions show that there are two pure Nash equilibrium solutions [(1,1) and
(5,5)] in our model, which are all at the extremes of either the FDI or IR ranges. The examples
provided from this model suggest that there can be multiple equilibrium levels of trade-offs of equity for
efficiency. Consequently, any further examination of this issue requires data gathering and empirical
analysis.
The Structure of the Industrial Relations System
In order to quantify the industrial relations system for a country or a state, we assume that there
is an underlying structure for the system that cannot be captured by any single variable, which is
consistent with industrial relations theory. Further, we also assume that there is an underlying structure
that goes from a lenient industrial relations policy to a more restrictive one from management’s
perspective. We further hypothesize that there is a structure to the industrial relations system which is
linked in a hierarchical manner and provides a natural scaling of industrial relations characteristics in a
nation. The degree or intensity with which those characteristics are implemented in a country forms the
basis of firm decisions to invest in that nation. In order to operationalize this structure of the industrial
relations variables, we create latent variables for the industrial relations factors in each nation and for
each state in the U.S. Each individual factor in the industrial relations system was divided into five
categories to resemble a Likert-type scale, and they are categorized from lowest to highest in terms of
their restrictiveness to employers. In order to examine the robustness of the impacts of this variable we
develop two alternative measures. In the first case we use a summated rating scale of industrial

2Direct investment capital flows are defined as “equity capital, reinvested earnings, and other capitalassociated with various intercompany debt transactions” and comprised about 8 percent of international capitalflows (Lipsey, 2001).
9
relations system variables which include extent of union coverage, days lost due to strikes per 1000
employees per year, the degree of bargaining centralization and level of bargaining structure, and the
extent of employee voice (Calmfors and Drifill, 1988 and Traxler and Kittel, 2000). This summated
rating scale is an additive one that measures the intensity of each of the factors and aggregates these
factors into one variable (Bartholomew, 1996). An alternative latent variable measure is the Rasch-
type model that places each of the variables within a logical structure. The empirical measure of the
Rasch model we use is known as a partial credit model. This approach assumes that the distance
between parameters is equal and that the categories are equal integers (Wang, 1996). Although we
obviously do not include all of the factors that might go into a fully specified structural industrial relations
system variable, we think that we can capture the major institutions which likely impact industrial
relations and economic outcomes.
Measuring Foreign Direct Investment
Firm-level investment is assumed to be an economic measure that is highly responsive to the
institutional characteristics of the firm, which includes unionization (Hirsch, 1991). By extension we
anticipate that this would also apply to national labor market institutions. Even if FDI has some
measurement problems in capturing “pure gross investment,” it does enhance the economic prospects
within a country by, at a minimum, moving resources to their optimal use (Lipsey, 2000)2.
Analyzing investment patterns across countries assumes that companies are responsive to the
economic characteristics of the home country relative to opportunities in the host country.

10
Consequently, our measure of foreign direct investment used in hypothesis testing is total direct foreign
investment from the ith country to the jth divided by the total foreign investment in the ith nation, and this
is consistent with other analysis of economic and industrial relations factors that impact U.S. FDI
(Cooke, 2000). The use of this measure of FDI allows us to capture the relative flows of FDI
between two nations based on economic differences and variations in institutions, such as the industrial
relations system in a country. However, given this construct, countries like the U.S., which has a large
share of other countries’ FDI would usually comprise a disproportionate share of FDI just by virtue of
its economic size. Nevertheless, this is generally perceived to be a better measure of the flows of FDI
than using total expenditures or gross inflows, which would have an even greater bias toward large
nations and have a greater potential for heteroskedastic error terms. Our analysis includes 20 OECD
countries using annual data for 10 years from 1985 to 1995.
In Appendix two the means and standard deviations of the economic and institutional variables
used in our model are presented. The table gives measures of the industrial relations system variable
which includes both the summated rating scale and the Rasch measure. For collective bargaining we
use national union coverage, since countries like France have “low unionization rates,” but a high
percent of coverage via the collective bargaining agreements for workers who do not belong to a union.
Since unions and works councils both influence the ability of managers to make decisions, we use a
measure of the interaction of intensity of mandated employee representation in the country and the level
of unionization ( Freeman and Lazear, 1995, Kleiner and Ay, 1996). We include the index value of the
“strike rate per thousand employees” in our analysis, since this variable affects the ability of
management to maintain a stable and consistent level of production for its workforce (Beggs and

3Even though there is controversy of this measure based on various definitions across countries, there is
no reason to believe the changes over time are similarly biased ( Beggs and Chapman, 1987)
4 In this context the Calmfors and Drifill index of the industrial relations system is of the degree of
centralization of bargaining, whereas the Traxler and Kittlel index modifies this index to include the coordination ofbargaining of national and local labor market objectives.
5Each of the factors of an industrial relations system that are in each of the countries in our sample arescaled by the intensity of use of those factors. A higher value means that a factor would reduce the likelihood thatFDI would occur in a particular nation. If there is a single dimensional ordering for the four industrial relationssystem variables, no country would have a more advanced or intense level of a policy without also having a lowerpractice. Our data fits this pattern reasonably well, but not perfectly. For example, nations that have high levels ofunion coverage are more likely to have most of the other practices, and 12 nations have this practice with at least oneother high intensity practice, which is the highest value for all the system factors. No other industrial relationssystem variables have more other high intensity levels of industrial relations coverage. Values generated usingfactor analysis found that all of these factors were highly intercorrelated, except for strike intensity, which had anegative factor loading.
11
Chapman, 1987).3 As part of our measures of the industrial relations system, we present the level of
bargaining centralization and coordination which reflects whether there is establishment, local or national
wage bargaining in a manner developed by both Calmfors and Drifill (1988) as well as a subsequent
study by Traxler and Kittlel (2000)4. The last two columns of the Table show measures from
management’s perspective of the summated rating scale and the Rasch scale for each of the countries’
industrial relations system. The summated rating scale ranges from a high of 20 for Australia to a low
of six for the United States. Our industrial relations system values use a hierarchical scaling system and
we find results which are consistent with this scaling5. Since there is no overriding statistical or
theoretical reason to use one approach over the other, we present both in most of our analysis.
Statistically, these measures of the industrial relations system are highly correlated. For the composite
index measure we found that Cronbach’s alpha measure of the inter correlation of the industrial
relations variables was .81, which was beyond the acceptable statistical threshold (Nunnally, 1978).
In order to specify a model to capture the impacts of the industrial relations system on FDI we

12
specify a reduced form model. The Data Appendix 2 shows a clear variation in the types of labor
market institutions in the U.S. versus E.U. countries. The U.S. epitomizes the “free” labor market from
management’s perspective, since both union membership and coverage are low, and other
governmental institutions that restrict managerial behavior also are minimal. If there is an equity versus
efficiency trade-off for investors, having lots of industrial relations institutions would be associated with
more FDI going to the U.S. and away from E. U. countries. In addition to many of the standard
controls found in studies of FDI, we include the tax rate of the receiving country relative to the host
country in order to control for potential tax treatment effects. We use data from the OECD volume on
“Taxing Profits in a Global Economy” ( OECD, 1992). Since we assume that countries with similar
industrial relations systems may want to invest in nations that have complementary systems, we control
for this interaction by adding a dummy variable for whether the sending and host nation has the same
quintal industrial relations system using the summated rating scale.
Extensions of the Model to U.S. States
Unfortunately, we do not have measures of outcomes, like FDI, at the state level, which are
highly responsive to economic and institutional incentives. We do, however, use a similar approach to
analyze the impact of the industrial relations system on U.S. states. One advantage of examining U.S.
states is the reduction in unobserved heterogeneity in customs, English -speaking language, common
legal framework, and standard capital markets relative to examining cross-national FDI. Yet, there is
still considerable variation among the states for measures such as unemployment benefits, minimum
wages, disability payments, right to work laws, and levels of unionization. Using a latent variable
approach similar to the one we used to examine FDI, Richard Freeman developed an index of social

13
legislation favorable to labor from a “composite worker protection index” and gathered data from
various government sources. We have modified this index to include industrial relations factors and
structured it to fit into a summated rating scale index that captures the systems approach, yet differs by
providing the scale from managements’ perspective (Freeman, 1986, Spector, 1992). In this model
levels of economic outcomes follow a standard function as specified in the equations one through six,
but the capital market is assumed to be the same across U.S. states. Instead of measures of FDI, our
estimates include gross state product, employment, and per capita income. Although there is no
agreement as to of these factors is the best measure of economic outcomes, we examine all of them to
determine whether there are trade-offs between equity and economic outcomes across all these
measures as robustness checks of our estimates. Our state level controls for economic factors that
vary across states include the log of population, overall tax rates, and the log of manufacturing
employment in the state. Since the price of capital is assumed to be the same across U.S. states there
is no control variable for this measure. The benefit of using this unit of analysis is the ability to difference
out unobservables that are not easily accomplished by attempting to estimate international differences in
economic outcomes. Moreover, the state data within the U.S. gives evidence and serves as an
additional check on the ability to generalize these findings to other political entities.
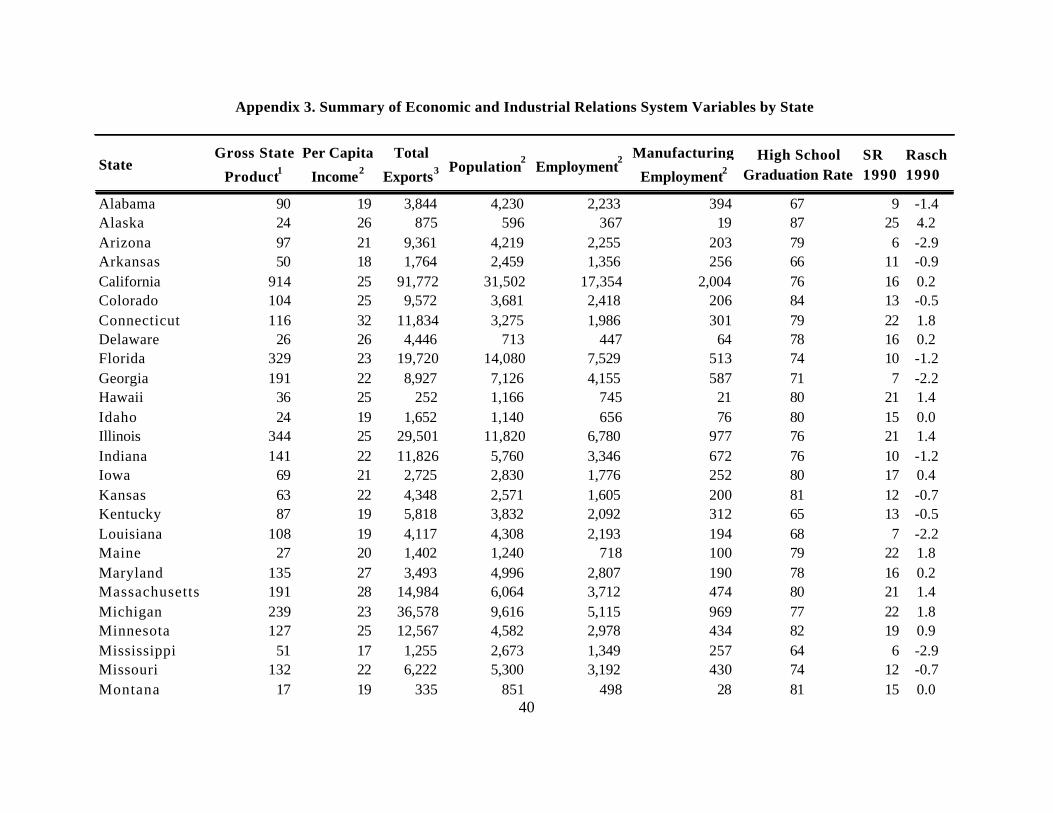
In Appendix Table 3 we give the basic values for the state level analysis. This table presents
the means for the basic changes in state output, employment, and per capita income for the time period
we analyze. These IR variables include labor union coverage density and measures of labor regulations
such as unemployment insurance coverage, workers’ compensation coverage, and minimum wages.
Again, we find a high correlation for the measures of the industrial relations variables which comprise

14
our industrial relations system measure. The Cronbach’s alpha, which measures the inter correlation of
the industrial relations variables or consistency, was .85, and this is beyond the acceptable threshold
(Nunnally, 1978)
Industrial Relations Institutions, Income Inequality, and FDI
In Figure one we show the basic country relationships between our measures of industrial relations
institutions and income inequality as measured by the Gini coefficient in panel A and the ratio of earnings
of persons in the 90th percentile relative to those at the 10th percentile in panel B. Our measure of the
industrial relations system is the summated ratings’ value for each nation. Consistent with findings in
other studies, the slope of the line is negative, suggesting that the impact of more numerous and more
intense levels of labor market institutions are associated with less inequality in the country (DiNardo,
Fortin, and Lemieux, 1996). Of course, analysis with greater controls and econometric modeling may
change the basic relationship. Nevertheless, this result is suggestive of the basic equity- efficiency trade-
off of the impact of industrial relations institutions suggested by Okun in the opening comment to this
paper.
Figure 2 presents the basic relationship between FDI outflows to other countries as a
percentage of total outflows from the U.S. in panel A and from Germany in panel B for 1990, the
midpoint of our data analysis. The vertical axis shows the percent of total FDI outflow that goes to
other nations and the horizontal axis presents the nation’s industrial relations summated rating scale.
Estimates for the U.S. show a modest negative slope in panel A, but there is a much steeper negative
slope for Germany in panel B. Perhaps countries like Germany with more restrictive industrial relations
systems are more likely to choose to invest in countries with less rigid institutions, as our interviews with

6 Since there is some controversy about the use of PPP for normalizing economic variables, we estimated
models using both adjusted and unadjusted values and found qualitatively similar results.
7 This approach estimates the coefficients using OLS and their standard errors with corrections to allow forheteroskedasticity, cross-panel heteroskedasticity and panel specific autocorrelation. In our model the number ofcross-section observations is larger than time series ones. Consequently, we can not use GLS with this errorstructure. As a result we used panel corrected standard error estimates found in several econometrics softwarepackages (Stata, SHAZAM, Limdep). For more details about this econometric approach see Beck and Katz(1995)and Greene(2000) .
15
German executives suggested. These results, however, fail to control for many of the covariates that
are likely to affect FDI.
Estimates From the FDI Model
Table 1 gives reduced form panel corrected standard error regression estimates of the equation
specified above using yearly data for the countries in our analysis. This specification is consistent with
the theoretical model using industrial relations as a determinate of FDI. In columns one and two we
give the linear specification of both the summated rating scale and the Rasch estimates. In columns
three and four we present the quadratic form of the specification by giving the linear and squared term
for both the summated rating scale and the Rasch estimates. We have year by country effects on FDI,
and our sample size of 2442 observations are based on i to j movements of FDI with adjustments for
purchasing power parity (PPP) for the specific country6. We use reduced form panel corrected
standard error estimates with three- year moving averages for the economic variables as a statistical
smoothing technique, but the use of yearly averages without smoothing shows similar qualitative results.7
The values of FDI are the outflows as a percentage of overall FDI to the countries in our sample. We
also estimated a similar model using FDI inflow as a percentage of all FDI to the nation and found
basically the same qualitative results as presented in Table 1. In Appendix 4 we present random effects

8 Estimates were made of F-levels for each of the equations with and without the industrial relations systemvariables. We found that the F-level for column 1 was 7.20 and for column 2 was 8.15, each of these values arestatistically significant at a 99 percent confidence level. We also estimated these equations with the lag of FDI andthey showed similar results.
16
specifications of our basic model and find similar results to those shown in Table 1. Further, analysis
for large trading blocs of countries like the U.S. and E.U. show similar qualitative results for the impact
of industrial relations variables on FDI (Kleiner and Ham, 2000).
The economic variable controls included in our model of FDI are yearly measures of education
using percent of the workforce having completed high school, nonpublic sector compensation
differences between the two countries, interest rate differences, gross domestic product per capita,
imports minus exports divided by gross domestic product, relative tax rate, measures of industrial
relations complementarity, and the unemployment rate. These variables largely capture the variables in
our theoretical model for the role of market factors that affect FDI. Other factors which are constant
over time include whether the nations with FDI outflows had the same native language, and the distance
in miles between the capitals of the two countries8. Our measures of the industrial relations system
remain relatively constant over time, since there were small changes in most of the relative components
of the variables, although measures such as the strike rate and union density showed some variability.
Nevertheless, the use of one variable to capture the industrial relations system, the use of yearly
economic data, and controls for capital markets should provide more consistent estimates of the overall
impact of labor institutions on FDI flows.
The results show that the summated rating scale and the Rasch measures of the industrial

9When available we used the percentage of employees covered by collective bargaining agreements. However, when this information was not available we used the percent belonging to a union in the country, anddenoted this with a dummy variable in our statistical analysis (Little and Rubin, 1987).
17
relations system are statistically significant in all of the specifications, and negatively related to FDI.9 In
the quadratic specifications the squared term is positive and statistically significant, suggesting that there
is a positive or at least a flattening out of the negative relationship between the industrial relations system
and FDI. These general results are similar to ones found for the impact of labor variables for U.S. FDI
outflows (Bognanno et. al., 1998, Cooke and Noble, 1998, and Cooke, 2000). Moreover, the
coefficients for the other control variables are consistent with other studies of FDI that focus on the
effects of taxes or exports and imports (Summers, Gruber, and Vergara, 1993, Engen,and Skinner,
1996, Blonigen and Davies, 2000).
In order to test for the robustness of our results in panel A of Table 2 we also estimated the
equations in Table 1 dropping one of the measures of the industrial relations system variables and then
examining the results. The estimates seem robust to dropping an element of the overall value of the
latent variable. In panel B we estimate the direct effect of each of the elements of the industrial
relations system on FDI and find that bargaining centralization, strikes, and mandated employee
representation is all statistically significant on their own. It appears that the overall industrial relations
system construct matters rather than any one variable, and there is a complementarity with the variables
in our overall latent variable index. To further proxy a potential “fixed effect” for a country that changed
their industrial relations institutions, we saw that large changes in labor market institutions occurred in
New Zealand during the 1990s. In that country-specific case, there were more business- sponsored
industrial relations policies implemented which resulted in large gains in imports and growth in foreign

10A country that moved in the other direction in terms of implementing more stringent levels of industrialrelations institutions was South Korea. This nation had few industrial relations institutions in 1985, but greatlyincreased the number and kinds of collective bargaining-related policies during the late 1980s and 90s.
11 We also estimated the model using state exports and found qualitatively similar results. However, upon
further examination we found that the state exporter of record is not necessarily where the product was produced. Further, the state of production is not neccesarily the exporter, but rather the point of shipment state gets credit forthe state of export. For all these reasons we decided against reporting these results given the major potential errorsin variables problems.
12Estimates using the Rasch approach showed similar statistically significant results. These estimates are
available from the authors. Estimates using end of period IR system variables showed similar results.
18
capital (Blumenfeld, Crawford, and Walsh, 2001).10
Beyond FDI activity, however, these industrial relations variable institutions seem to have
produced narrowing levels of wage and income dispersion within countries (Freeman and Katz, 1995,
DiNardo, Fortin, and Lemieux, 1996 ). Consequently, the effect of industrial relations institutions may
be to reduce the ability of managers to allocate resources, but the benefits to workers through greater
voice and labor standards for all employees may be worth the costs to a nation through less foreign
investment. However, from our game theory examples, countries may choose higher levels of industrial
relations institutions, which they see as optimal from a social perspective, even though it means lower
levels of FDI.
U.S. State Level Evidence on Measures of Economic Outcomes
Table three shows estimates of our state level model of the impact of the IR system on
measures of state economic growth, which includes employment change, change in per capita income,
and gross state product.11 We present two sets of econometric results. In Panel A we show the
estimates for changes from 1990 or 1993 to 1998 or 1999 using all 50 U.S. states, with the summated
rating scale index for the beginning year.12 Panel B we show the impact of the industrial relations

13We do not include a quadratic specification because the U.S. is at the lowest end of the IR system values. Consequently, there would be little variation among the states in comparison to the wide variance in national IRsystems.
14Estimates using an F-test for the significance of all the individual variables shows that the industrialrelations variables are statistically significant for employment changes with an F-value of 2.55 for the cross-sectionestimates from 1990 to 1999 and a Chi-squared value of 15.14 for the pooled time-series cross-section estimates.
19
variable using year by year results from 1990 or 1993 to 1998 or 1999 using panel corrected standard
error regression estimates with a sample size ranging from 400 to 450. In Appendix 5 we give
estimates from a random effect econometric approach to estimating our model and the results are
similar to those in Table 3. The estimates of the industrial relations variables in both sets of
specifications are robust for all the measures of economic outcomes using the pooled cross-section-
time series results and for most of the change in economic variables from 1990 to 199913. The
interpretation of the variables is that a one unit change in the IR system is associated with a .05 percent
reduction in the growth rate of state per capita income.14 These estimates for states are consistent with
firm level analysis using aggregate latent variable measures of human resource practices on productivity
(Ichniowski, Shaw, and Prennushi, 1998).
The consistency of the measures of economic outcomes for international comparisons of FDI
and state-level comparisons of economic growth are similar. For firms seeking profit-maximizing
investments, labor costs and the ability to allocate labor in the most efficient manner possible appears to
have an impact on key measures of economic outputs. These results are consistent with our game
theory simulation, which says that states may choose lower economic growth for the social gains of a
more equitable labor market.
Counterfactual Simulations for Countries and States

15Estimates using the Rasch approach for the coefficients for the industrial relations variables producedsimilar results for both international and state level estimates.
20
Table 4 gives the results of a simulation for both international FDI, and for changes in state per
capita income. In this model we use the coefficients from the regression estimates from Tables 1 and 3
and estimate the impact of changes from a country or state that has the lowest values of their industrial
relations system as measured by the summated rating scale relative to the other more intense
institutional arrangements in other countries or states15. These results can be thought of as a
counterfactual estimate of the impact of a change in the industrial relations system on measures of
economic outcomes relative to the one with the lowest level of these labor market institutions. In panel
A we show the effect of the countries in our sample adopting the same industrial relations system as the
U. S. on FDI. The results for the top five and bottom five affected nations show that annual FDI
inflow would be increased by more than 2 percent per year for Japan if they adopted the U.S. IR
system. In contrast, this assumed change to a U.S. industrial relations system would increase FDI
inflows from the nations in our sample by almost 10 percent per year for Australia, the country with the
highest level of industrial relations-related benefits. Panel B presents the state level estimates. The
estimates show what the impact would be on other states of a change from the industrial relations
system in Arizona, the state with the lowest worker-related benefits, relative to the five top and bottom
U.S. states. The results range from no change for a state like Mississippi to a growth of almost one
percent per year in per capita income per year for Alaska and by .72 percent for Connecticut,
Maine, Michigan and New Jersey. Worker protections and related institutions are important to the
overall state social safety net, as well as for employee well- being. However, they appear to come at a

21
price of reduced growth in per capita income.
Conclusions
This study has examined the impacts of the industrial relations system on direct foreign
investment, as well on measures of economic growth for U.S. states. We implement a systems
approach, rather than using individual variables to examine the role of industrial relations on the amount
of direct foreign investment in the destination nations. We state the rationale for this latent variable
method using industrial relations theory, rather than using a single variable or a group of individual
variables. Our theoretical model suggests that nations with higher levels of industrial relations reduce
returns to capital within a Nash model. Further, using a game theory approach shows that nations can
have multiple equilibrium when both FDI and industrial relations system voice and equity factors are
considered. The measures that we use seem to fit into this systems approach and include measures of
unionization, strike activity, centralization and level of bargaining, and mandated employee involvement.
The data and time period for our study includes 20 OECD nations for the ten years 1985 through
1995, as well as 50 U.S. states from 1990 to 1999.
Linear and quadratic estimates from the reduced form model, which is consistent with theory,
show that the industrial relations system is statistically significant and of moderate size in the
specification of the systems variable. Moreover, developing a counterfactual estimate using our model
and the industrial relations system coefficients, shows that a movement from a country with institutions
like Australia to the U.S. would diminish the host nation’s FDI by almost 10 percent per year.
However, the transactions cost of changing an industrial relations system is presumably high, although
countries like New Zealand and South Korea have done so with some economic impacts.
22
In contrast to some previous analysis our results suggest further that multinational firms in more
developed nations tend to be somewhat sensitive to the industrial relations climate, preferring ones that
provide management with a greater amount of leeway in allocating labor and setting standards at work.
Of course public policies must consider more than foreign investments by large firms and their choice of
the kinds of an industrial relations and social climate they wish to provide employees. Giving workers
an environment where they have a greater say at the workplace with higher wages and benefits may be
worth the reduction in foreign investment which is the unintended consequence of these policies.
However, policy makers and interest groups need to be aware of the efficiency consequences of their
constituents’ equity concerns (Okun, 1975, Freeman, 2000). Further examination using more nations
and time periods with changers to different systems, as well as using more microeconomic data and
field interviews of executives and other employees, may complement the insights into this issue which
can be provided by this large- scale analysis using aggregate data.

23
References
Autor, David H., John J. Donohue, and Steward J. Schwab, “The Costs of Wrongful Discharge Laws,”
National Bureau of Economic Research, Cambridge, Ma., July 2000.
Baldi, Stephane and et.al., International Education Indicators : A Time- Series
Perspective, 1985-1995. Washington, DC : U.S. Dept. of Education, 2000.
Bartholomew, David. The Statistical Approach to Social Measurement, Academic Press, London, 1996.
Bartik, Timothy, “Business Location Decisions in the United States: Estimates of the Effects of Unionization,
Taxes, and Other Characteristics of States,” Journal of Business and Economic Statistics, 3: pp. 14-
22, 1985.
Beck, Nathaniel ; Katz, Jonathan N. “What to Do (and Not to Do) with Time-Series Cross-Section Data”
American Political Science Review v89, n3 (September 1995): 634-47
Beggs, John J. and Bruce J. Chapman, “Declining Strike Activity in Australia 1983-85: An International
Phenomenon?” Economic Record Volume 63, no. 183 (December 1987): pp. 330-39.
Block, Richard, Karen Roberts, Cynthia Ozeki, and Myron J. Roomkin, “Models of International Labor
Standards,” Industrial Relations, Vol 40, No. 2, April 2001, pp. 258-292.
Block, Richard, Karen Roberts, and R. Oliver Clarke, Labor Standards in the United States and Canada,
Kalamazoo, Mi. : W.E. Upjohn Insitute for Employment Research, forthcoming.
Blonigen, Bruce, A. and Ronald B. Davies, “ The Effects of Bilateral Tax Treaties on U.S. FDI Activity”,

24
NBER Working Paper 7929, pp. 35, October 2000.
Blumenfeld, Stephen, Aaron Crawford, and Pat Walsh, “ Import Penetration and Union Membership in a
Small Open Economy: New Zealand in the 1990s”, Proceedings of the Industrial Relations Research
Association, New Orleans, January 2001, p. 317-325.
Bognanno, Mario. F., Keane, Michael. P., Yang, D. "The Influence of Wages and Industrial Relations
Environments on the Production Location Decisions of US Multinational Corporations." Working Paper,
Industrial Relations Center, University of Minnesota, 1998.
Budd, John and Yijiang Wang, “Labor Policy and Investment”, University of Minnesota, Working Paper,
2001.
Calmfors, L., Driffill, J. "Bargaining Structure, Corporation and Macroeconomic Performance." Economic
Policy, April 1988, 14-61.
Cooke, W. N. "The Influence of Industrial Relations Factors on U.S. Foreign Direct investment Abroad."
Industrial and Labor Relations Review, 1997, 50 (1), 3-17.
______ and Noble, D. S. "Industrial Relations Systems and U.S. Foreign Direct Investment Abroad." British
Journal of Industrial Relations, 1998, 51 (2), 171-186.
______ and ______ , “ The Effects of Labor Costs and Workplace Constraints on Foreign Direct Investment
Among Highly Industrialized Countries, Working Paper, Wayne State University, 2000.
Dinardo, John, Nicole Fortin, and Thomas Lemieux, “Labor Market Institutions and the Distribution of

25
Wages, 1973-1992: A Semiparametric Approach”, Econometrica, Vol. 65, September 1996, pp. 1001-
44.
Dunlop, John T. Industrial Relations Systems. Boston: Harvard Business School Press, 1993.
Engen, Eric M. and Jonathan Skinner, “Taxation and Economic Growth”, NBER Working Paper 5826,
November 1996.
Figlio, David N. ; Blonigen, Bruce A. “The Effects of Foreign Direct Investment on Local Communities”
Journal of Urban Economics v48, n2 (September 2000): 338-63
Fitzpatrick, Gary L. and Modlin, Marilyn J., Direct-line Distances. Metuchen, N.J. : Scarecrow Press, 1986.
Freeman, Richard B., "Crime and the Job Market." NBER Working Paper, w4910, October 1994.
______ , "Single Peaked Vs. Diversified Capitalism: The Relation Between Economic Institutions and
Outcomes." NBER Working Paper, w7556, February 2000.
______ , “Unionism and Protective Labor Legislation,” Industrial Relations Research Association,
Proceedings, 1986, pp. 260- 267.
______ and Katz, Lawrence F. Differences and Changes in Wage Structures. Chicago: University of
Chicago Press, 1995.
______ and Edward Lazear, “An Economic Analysis of Works Councils,” in Works Councils, ed. Joel
Rogers and Wofgang Streeck, Chicago: University of Chicago Press, 1995.

26
Fudenberg, D., and Jin Tirole. Game Theory. Cambridge, Mass. MIT Press. 1991
Gibbons, Robert. Game Theory for Applied Economists. Princeton, N.J., Princeton University Press 1992.
Golden, Miriam, Peter and Michael Wallerstein. Union Centralization Among Advanced Industrial Societies:
An Empirical Study. http://shelley.sscnet.ucla.edu/data . 11-3-1998 .
Greene, William, Econometric Analysis, Fourth Edition, Prentice-Hall, 2000
Hatzius, Jan, “Foreign Direct Investment and Factor Demand Elasticities,” European Economic Review,
44, pp. 117-143, 2000.
Hirsch, Barry, Labor Unions and the Economic Performance of Firms, W.E. Upjohn Institute for
Employment Research, Kalamazoo, Michigan, 1991.
Hufbauer, G. C. "The Multinational Corporation and Direct Investment," Kenen, Peter B. Ed., International
Trade and Finance : Frontiers for Research. Cambridge: Cambridge University, 1975.
Hsiao, Cheng. Analysis of Panel Data, Cambridge; New York and Sydney: Cambridge University Press
1986
Ichniowski, Casey, Kathryn Shaw, and Giovanna Prennushi, “The Effect of Human Resource Practices on
Productivity: A Study of Steel Finishing Lines,” American Economic Review, Vol. 87, No. 3, June 1997,
pp.291-313.
ILO Bureau of Statistics. LABORSTA. http://www.ilo.org/public/english/support/lib/dblist.htm.

27
Kleiner, Morris M. and Chang-Ruey Ay, “Unionization, Employee Representation, and Economic
Performance: Comparisons Among OECD Nations,” Advances in Industrial and Labor Relations, Vol.
7, JAI Press, pp 97- 121.
Kleiner, Morris M. and Hwikwon, Ham, “What Impact Do the Different Industrial Relations Systems in the
U.S and the European Union Have on Foreign Direct Investment?”, in Multinational Companies and
Transnational Workplace Issues, ed. W. Cooke, M.E. Sharpe Publishers, Armonk, New York, 2002,
pp. 83-94.
Leahy, Dermot ; Montagna, Catia “Unionisation and Foreign Direct Investment: Challenging Conventional
Wisdom?” Economic Journal, v110, n 462 (March 2000): pp. 80-92
Levine, David, Reinventing the Workplace, Brookings Institution, Washington, D.C. 1995.
Little, Roderick, and Daniel Rubin, Statistical Analysis with Missing Data. New York, NY: John Wiley
and Sons, 1987.
Lipsey, Robert E. “ Interpreting Developed Countries’ Foreign Direct Investment”, NBER Working Paper
7810, pp. 1-24, July 2000.
______ , Foreign Direct Investment and the Operations of Multinational Firms: Concepts, History and Data,
National Bureau of Economic Research Working Paper, 8665, Cambridge, Massachusetts, December
2001.
Nunnally, J C., Psychometric Theory. 2nd ed. New York : McGraw-Hill, 1978.

28
OECD. "Trends in Trade Union Membership," Employment Outlook. Paris: Organization for Economic Co-
operation, and Development, 1991, 97-134.
OECD. "Collective Bargaining: Levels and Coverage," Employment Outlook. Paris: Organization for
Economic Co-operation, and Development, 1994, 167-194.
OECD. "Economic Performance and the Structure of Collective Bargaining," Employment Outlook. Paris:
Organization for Economic Co-operation, and Development, 1997, 63-92.
OECD and DSI, Data Service. OECD Statistical Compendium : CD-ROM. 1998.
OECD. “ Taxing Profits in a Global Economy: Domestic and International Issues, 1992.
Okun, Arthur M,. Equality and Efficiency: The Big Tradeoff. Washington: The Brookings Institution,
1975.
Rees, Albert, “ The Effects of Unions on Resource Allocation” Journal of Law and Economics, pp.69-78,
V. I, 1963.
Slichter, S. Proceedings, of the Eighth Annual Meeting of the American Academy of Arbitrators.
Boston: Bureau of National Affairs, 1955.
Summers, Lawrence, Jonathan Gruber, and Rodrigo Vergara, “Taxation and the Structure of Labor
Markets: The Case of Corporatism”, Quarterly Journal of Economics, v108, n2 (May 1993): pp.
385-411
Spector, Paul, E., Summated Rating Scale Construction, Sage Publications, Newbury Park, Ca. 1992,.

29
Traxler, Franz and Kittel Bernhard, “The Bargaining Systems and Performance: A Comparison of 18
OECD Countries,” Comparative Political Studies, Volume 33, No. 9, 2000, pp. 1154-1190.
Wang, Andrew. “Economic Reform and State Enterprise Productivity in China: An Application of Robust
Estimation and Latent Variable Measurement Methods,” Ph.D. Thesis, Harvard University, 1997.

30
5 10 15 20
0.21
0.32
United States
Japan
Korea
Canada
Switzerland
France
United Kingdom
Netherlands
Portugal
Spain
Belgium
New Zealand
Austria
Denmark
Germany
Greece
Italy
Sweden
Australia
Norway
Figure 1. Industrial Relations System Relationship with the Gini Coefficient and Percentile Ratio 90/10 ( using the Summated Rating Scale by country)
Gin
i Coe
fficie
nt
Industrial Relations System Summated Rating Scale
Pane
l A
5 10 15 20
Industrial Relations System Summated Rating Scale
3
5
United States
Japan
Canada
Switzerland
France
United Kingdom
Netherlands
Spain
BelgiumAustriaDenmark
Germany
Italy
Sweden
Australia
Norway
Perc
entile
Rat
io 9
0/10
Pane
l B

31
5 8 11 14 17 20Industrial Relations System Summated Rating Scale
-0.05
0.10
U.S
. FD
I Out
flow
s
Germany
France Italy
Netherlands
Belgium
United KingdomDenmark
Spain
GreecePortugal
Canada
Korea
JapanAustralia
Norway
New Zealand
Sweden
Switzerland
Austria
Figure 2. FDI Outflows and the Industrial Relations System Relationships in 1990
( using the Summated Rating Scale by country)
Pane
l A
5 8 11 14 17 20Industrial Relations System Summated Rating Scale
0.06
0.14
Ger
man
FD
I Out
flow
in 1
990
France
Italy
Netherlands
Belgium
United Kingdom
Denmark
Spain
GreecePortugal
United States
Canada
Korea
Japan
AustraliaNorwayNew ZealandSweden
Switzerland
Austria
Pane
l B

32
(1) (2) (3) (4)
-.0069 * -.0479 *(.0020) (.0112)
(Summated Rating)2
.0015 *(.0004)
Host Country IR System -.0454 * -.0130 *(Rasch) (.0090) (.0159)
(Rasch)2
.0242 *(.0085)
.0815 * .0842 * .0913 * .0928 *(.0324) (.0309) (.0333) (.0312)
.0205 .0228 .0253 .0250(.0190) (.0186) (.0176) (.0162)
.0009 * .0010 * .0009 * .0010 *(.0003) (.0003) (.0004) (.0003)
-.0045 * -.0047 * -.0057 * -.0051 *(.0008) (.0008) (.0012) (.0011)
-.0003 -.0005 -.0013 -.0010(.0007) (.0007) (.0007) (.0007)
-.0021 -.0022 -.0016 -.0011(.0014) (.0013) (.0014) (.0012)
-.0092 * -.0095 * -.0106 * -.0100 *(.0032) (.0029) (.0025) (.0029)
.0065 .0033 .0004 -.0006(.0043) (.0043) (.0038) (.0042)
-.1165 -.0131 -.0446 .0141(.3081) (.2985) (.3062) (.2853)
.0031 * .0030 * .0035 * .0031(.0014) (.0014) (.0016) (.0016)
.0267 -.0280 .4095 .0370(.1050) (.1057) (.1080) (.0902)
No. of Observations 2442 2442 2442 2442
R2
.035 .037 .039 .041Note* Significant at 5% level
Table 1. Panel Corrected Standard Error Estimates of the Impact of the Industrial Relations System on the Percent of Total Net FDI Outflows (1985 - 1995)**
Unemployment Rate****
High School Graduation
Rate***
Employee Compensation
Differences****
Interest Rate Differences****
Distance Between Countries
Language Complementarities
GDP per Capita****
(Export-Import)****
***Average over Various years
**** Three Year Moving Average (1983 - 1995)
Constant
Host Country IR System (Summated Rating)
Tax Rate
IR System Complementarities
** Standard Errors in Parenthesis and all results include year dummies.

33
( . 6 1 ) ( 2 . 2 2 ) ( . 0 4 ) ( . 1 5 )P e r C a p i t a I n c o m e - . 3 2 * - 1 . 4 9 * - . 0 5 * - . 2 1 *( . 2 0 ) ( . 7 4 ) ( . 0 1 ) ( . 0 5 )
(1) (2)
-.0118 *(.0022)
Host Country IR System -.0180 *(Rasch) (.0022)
-.0038(.0023)
Host Country IR System -.0104 *(Rasch) (.0047)
-.0077 *(.0023)
Host Country IR System -.0420 *(Rasch) (.0096)
-.0090 *(.0018)
Host Country IR System -.0488 *(Rasch) (.0081)
-.0074 *(.0029)
Host Country IR System -.0483 *(Rasch) (.0122)
Without Bargaining Centralization
Without Bargaining Level
Without Worker Representation
Table 2 Responsiveness of the FDI Model to Alternative Specifications: Impact of the Industrial Relations
System on the Percent of Total Net FDI Outflows (1985 - 1995)1
Host Country IR System (Summated Rating)
Host Country IR System (Summated Rating)
Host Country IR System (Summated Rating)
Panel A
Host Country IR System (Summated Rating)
Host Country IR System (Summated Rating)
Without Union Density
Without Strike Rate
Union Density Strike RateBargaining
CentralizationBargaining
LevelWorker
Representation
.0026 -.0124 * -.0191 * -.0120 -.0299 *(.0046) (.0046) (.0084) (.0076) (.0054)
Note* Significant at 5% level1 Standard Errors in Parenthesis and all results include same control variables as in Table 1.
Panel B :Individual Variable Impacts

34
Gross State Product2 -1.39 * -6.45 * -.17 * -.76 *(.61) (2.22) (.04) (.15)
Per Capita Income -.32 * -1.49 * -.05 * -.21 *(.20) (.74) (.01) (.05)
Employment -1.11 * -4.22 * -.11 * -.39 *(.35) (1.29) (.02) (.06)
3 The industrial relations system variable uses a summated ratings scale ( See Freeman 1986)
1 All regressions include constant and control variables;high school graduation rate, log of per capita tax revenue, log of population and manufacturing employment. Standard errors are in parenthesis. Economic Data is from the BLS and BEA Website
* Significant at 5% level
2Gross State Product includes only data through1998
IR Rasch3IR SR3B. % Change over a Year (Panel 1990-1999)
Table 3. Estimates of the Impact of the Industrial Relations System on Economic Outcomes for U.S. States1
A. % change between1990-1999
IR Rasch3IR SR3

35
CountryChange in FDI
(SR)Change in FDI
(Rasch) CountryChange in FDI
(SR)Change in FDI
(Rasch)
Australia 9.69% 13.84% Switzerland 5.54% 9.76%Denmark 8.99% 13.03% United Kingdom 4.15% 8.35%Norway 8.99% 13.03% Canada 4.15% 8.35%Austria 8.99% 13.03% Japan 2.08% 5.67%Italy 8.30% 12.35% Korea 1.38% 4.45%
StateChange in Per Capita Income
(SR90)
Change in Per Capita Income
(Rasch90)State
Change in Per Capita Income
(SR99)
Change in Per Capita Income
(Rasch90)
Alaska 0.86% 1.49% Tennessee 0.09% 0.24%Connecticut 0.72% 0.98% Texas 0.09% 0.24%Maine 0.72% 0.98% Georgia 0.05% 0.15%Michigan 0.72% 0.98% Louisiana 0.05% 0.15%New Jersey 0.72% 0.98% Mississippi 0.00% 0.00%
Table 4. Simulated Impacts of Switchings the IR System on Economic Outcomes from the Country/State with the Lowest IR Value : 5 Highest and Lowest Rated Values
Panel A. Country-Effects : Changes in % Annual FDI
Panel B. State-Effects : % Changes in Annual Per Capita Income

36
5 0 0 0 0
5 5 5 5 5
5 4 0 0 0
0 4 4 4 4
5 4 3 0 0
0 0 3 3 3
5 4 3 2 0
0 0 0 2 2
5 4 3 2 1
0 0 0 0 1
1
2
3
4
5
Appendix 1A. Normal Form Game When the Payoff is FDI
B
A
1 2 3 4 5

37
6 1.5 2.24 3.34 5
6 6 6 6 6
6 5.5 2.24 3.34 5
1.5 5.5 5.5 5.5 5.5
6 5.5 5.24 3.34 5
2.24 2.24 5.24 5.24 5.24
6 5.5 5.24 5.34 5
3.34 3.34 3.34 5.34 5.34
6 5.5 5.24 5.34 6
5 5 5 5 65
Appendix 1B. Normal Form Game When the Payoff is Sum of FDI and Utility from IR Equity
B
A
1 2 3 4 5
1
2
3
4

38
CountryEmployee
CompensationPer Capita
GDP(Import-
Export)/GDPTax Rate
Interest Rate
Unemployment Rate
High School
Graduation Rate1
IR System
Summated Rating 2
IR System
Rasch2
Australia 19,665 15,806 -0.002 8.16 11.33 8.51 88.50 20 0.76(2423) (3216) (.01) (1.07) (2.33) (1.55)
Austria 22,553 19,818 -0.054 7.13 7.39 5.05 85.02 19 0.58(3776) (5939) (.01) (1.11) (0.83) (0.66)
Belgium 29,403 19,676 -0.013 6.79 8.61 11.12 79.10 16 0.14(5591) (5846) (.03) (.47) (1.14) (1.52)
Canada 25,411 18,503 0.024 8.48 9.54 9.56 70.28 12 -0.45(3827) (2548) (.01) (1.58) (1.03) (1.35)
Denmark 20,469 23,779 0.006 7.17 9.51 9.87 98.91 19 0.58(3187) (6019) (.03) (.92) (1.39) (1.58)
France 25,772 19,596 -0.007 7.89 9.15 10.41 73.62 14 -0.14(3560) (4901) (.01) (1.04) (1.40) (1.04)
Germany 23,733 19,515 0.032 6.41 7.17 7.82 87.35 17 0.28(3070) (6685) (.018) (.47) (0.83) (1.08)
Greece 13,309 7,567 -0.125 7.75 19.82 8.21 78.23 18 0.43(1294) (2007) (.02) (3.91) (2.29) (1.08)
Italy 23,904 23,274 -0.010 7.09 12.09 9.95 52.62 18 0.43(3429) (5521) (.02) (.79) (1.26) (1.09)
Japan 23,352 26,724 0.022 8.11 5.21 2.54 93.60 9 -1.04(3788) (8764) (.01) (1.55) (1.07) (0.35)
Appendix 2. Summary of Economic and Industrial Relations System Variables by Country (1985-1995) *

39
CountryEmployee
CompensationPer Capita
GDP(Import-
Export)/GDPTax Rate
Interest Rate
Unemployment Rate
High School
Graduation Rate 1
IR System
Summated Rating 2
IR System
Rasch 2
Korea 12,116 4,688 -0.024 -3 13.54 2.75 85.50 8 -1.31(3818) (1990) (.01) (1.52) (0.62)
Netherlands 26,213 18,301 0.022 7.11 7.24 7.12 73.81 16 0.14(3725) (4871) (.02) (1.41) (0.95) (1.21)
New Zealand 15,860 12,241 0.002 9.64 11.72 6.97 -3 17 0.28(2006) (2544) (.02) (1.79) (3.86) (2.50)
Norway 22,620 25,773 0.043 6.47 10.45 4.33 76.35 19 0.58(4118) (5490) (.03) (.64) (2.43) (1.55)
Portugal 12,001 6,801 -0.123 7.93 18.72 6.17 31.22 14 -0.14(2301) (2725) (.04) (1.94) (5.29) (1.64)
Spain 22,860 10,720 -0.052 8.25 12.15 20.05 63.55 15 0.00(3718) (3593) (.01) (1.94) (1.45) (2.73)
Sweden 22,057 22,829 0.020 6.42 10.92 4.04 80.75 18 0.43(3229) (4972) (.02) (1.40) (1.43) (2.72)
Switzerland 29,586 31,031 -0.024 6.85 5.03 1.90 84.56 14 -0.14(5161) (8049) (.02) (1.09) (0.93) (1.76)
U.K. 22,281 15,459 -0.025 6.98 9.58 9.10 78.20 12 -0.45(3062) (3417) (.01) (.84) (1.29) (1.99)
U.S. 29,627 23,032 -0.019 7.51 7.91 6.34 72.32 6 -2.29(3800) (3367) (.01) (1.59) (1.29) (0.78)
3 Not Available
Appendix 2. Summary of Economic and Industrial Relations System Variables by Country (1985-1995) (continued)*
* OECD Statistical Compendium Unless Otherwise Specified1 Average over Various Years (International Education Indicators)2 Based on Average over 1981-1992 (Data Source: Bognanno, Keane and Yang 1998 Golden, Peter and Michael Wallerstein 1998)
40
StateGross State
Product1Per Capita
Income2
Total
Exports3 Population2
Employment2 Manufacturing
Employment2High School
Graduation RateSR 1990
Rasch 1990
Alabama 90 19 3,844 4,230 2,233 394 67 9 -1.4Alaska 24 26 875 596 367 19 87 25 4.2Arizona 97 21 9,361 4,219 2,255 203 79 6 -2.9Arkansas 50 18 1,764 2,459 1,356 256 66 11 -0.9California 914 25 91,772 31,502 17,354 2,004 76 16 0.2Colorado 104 25 9,572 3,681 2,418 206 84 13 -0.5Connecticut 116 32 11,834 3,275 1,986 301 79 22 1.8Delaware 26 26 4,446 713 447 64 78 16 0.2Florida 329 23 19,720 14,080 7,529 513 74 10 -1.2Georgia 191 22 8,927 7,126 4,155 587 71 7 -2.2Hawaii 36 25 252 1,166 745 21 80 21 1.4Idaho 24 19 1,652 1,140 656 76 80 15 0.0Illinois 344 25 29,501 11,820 6,780 977 76 21 1.4Indiana 141 22 11,826 5,760 3,346 672 76 10 -1.2Iowa 69 21 2,725 2,830 1,776 252 80 17 0.4Kansas 63 22 4,348 2,571 1,605 200 81 12 -0.7Kentucky 87 19 5,818 3,832 2,092 312 65 13 -0.5Louisiana 108 19 4,117 4,308 2,193 194 68 7 -2.2Maine 27 20 1,402 1,240 718 100 79 22 1.8Maryland 135 27 3,493 4,996 2,807 190 78 16 0.2Massachusetts 191 28 14,984 6,064 3,712 474 80 21 1.4Michigan 239 23 36,578 9,616 5,115 969 77 22 1.8Minnesota 127 25 12,567 4,582 2,978 434 82 19 0.9Mississippi 51 17 1,255 2,673 1,349 257 64 6 -2.9Missouri 132 22 6,222 5,300 3,192 430 74 12 -0.7Montana 17 19 335 851 498 28 81 15 0.0
Appendix 3. Summary of Economic and Industrial Relations System Variables by State

41
StateGross S ta te
Product1
Per Capita
Income2
Total
Exports 3 Population2 Employment2Manufacturing
Employment2
High School Graduation Rate
S R 1 9 9 0
Rasch 1 9 9 0
Nebraska 42 22 2,195 1,627 1,073 112 82 9 -1.4N e v a d a 46 25 717 1,502 956 37 79 14 -0.3New Hampshi re 31 25 1,669 1,145 684 109 82 12 -0.7New je r sey 262 29 18,569 7,943 4,369 523 77 22 1.8N e w M e x i c o 39 18 1,268 1,650 872 50 75 9 -1.4New York 586 28 43,536 18,121 9,760 1,006 75 20 1.1North Carol ina 184 22 11,242 7,136 4,331 860 70 14 -0.3Nor th Dakota 14 19 530 638 413 22 77 14 -0.3Ohio 281 23 22,442 11,103 6,279 1,107 76 20 1.1Oklahoma 68 19 2,466 3,256 1,808 181 75 10 -1.2O r e g o n 78 22 8,463 3,105 1,839 244 82 21 1.4Pennsylvania 304 24 17,283 11,998 6,493 983 75 22 1.8R h o d e I s l a n d 25 24 1,029 994 546 89 72 22 1.8South Caro l ina 82 19 4,880 3,691 2,050 376 68 9 -1.4South Dakota 17 20 454 720 463 45 77 9 -1.4T e n n e s s e e 127 21 8,797 5,195 3,101 535 67 8 -1.8Texas 497 22 49,512 18,517 10,469 1,073 72 8 -1.8Utah 44 19 2,649 1,942 1,139 126 85 13 -0.5Vermont 14 21 2,579 580 363 50 81 18 0.6Virginia 183 24 10,445 6,554 3,934 420 75 9 -1.4W a s h i n g t o n 148 24 29,503 5,363 3,134 375 84 22 1.8West Virginia 34 18 1,055 1,810 833 87 66 15 0.0W i s c o n s i n 127 22 8,245 5,099 3,098 602 79 18 0.6W y o m i n g 15 22 128 472 298 12 83 11 -0.9
1 In Billion2 I n T h o u s a n d3 In Million
Appendix 3. Summary of Economic and Industrial Relations System Variables by State(Continued)

42
(1) (2) (3) (4)
-.0058 * -.0417 *(.0018) (.0118)
( S u m m a t e d R a t i n g )2
.0013 *(.0004)
H o s t C o u n t r y I R S y s t e m -.0390 * -.0126( R a s c h ) (.0097) (.0133)
( R a s c h )2
.0235 *(.0083)
.0951 * .0940 * .0931 * .0938 *(.0216) (.0214) (.0211) (.0210)
.0297 .0303 * .0319 * .0313 *(.0152) (.0151) (.0150) (.0148)
.0006 .0007 .0003 .0005(.0005) (.0005) (.0005) (.0005)
-.0038 * -.0040 * -.0046 * -.0043 *(.0011) (.0011) (.0011) (.0011)
-.0008 -.0010 -.0020 -.0016(.0014) (.0014) (.0015) (.0014)
-.0011 -.0012 -.0005 -.0002(.0019) (.0019) (.0019) (.0019)
-.0067 -.0067 -.0072 * -.0063 *(.0037) (.0036) (.0036) (.0036)
.0052 .0026 -.0002 -.0020(.0030) (.0032) (.0034) (.0035)
-.1210 -.0380 -.0182 .0547(.1688) (.1711) (.1697) (.1723)
.0036 * .0033 * .0034 * .0028(.0016) (.0015) (.0015) (.0015)
.0230 -.0229 .3806 .0658(.0848) (.0765) (.1431) (.0818)
N o . o f O b s e r v a t i o n s 2442 2442 2442 2442
R2
W ithin .001 .001 .001 .001 b e t w e e n .194 .208 .216 .225 overa l l .042 .045 .047 .050N o t e*S ign i f i can t a t 5% l eve l .
Appendix 4 . Random Effec t Es t imates o f the Impact o f the Industr ia l Re la t ions Sys tem on the Percent o f
T o t a l N e t F D I O u t f l o w s ( 1 9 8 5 - 1 9 9 5 )* *
* * S t a n d a r d E r r o r s i n P a r e n t h e s i s a n d a l l r e s u l t s i n c l u d e y e a r d u m m i e s .
U n e m p l o y m e n t R a t e* * * *
C o n s t a n t
I n t e r e s t R a t e D i f f e r e n c e s* * * *
T a x R a t e
GDP pe r Cap i t a* * * *
(Expor t - Impor t )* * * *
H i g h S c h o o l G r a d u a t i o n R a t e* * *
D i s t a n c e B e t w e e n C o u n t r i e s
E m p l o y e e C o m p e n s a t i o n
Di f fe rences* * * *
* * * * T h r e e Y e a r M o v i n g A v e r a g e ( 1 9 8 3 - 1 9 9 5 )
* * * A v e r a g e o v e r V a r i o u s y e a r s
H o s t C o u n t r y I R S y s t e m ( S u m m a t e d R a t i n g )
L a n g u a g e C o m p l e m e n t a r i t i e s
I R S y s t e m C o m p l e m e n t a r i t i e s

43
Gross State Product2 -1.39 * -6.45 * -.12 * -.54 *(.61) (2.22) (.03) (.10)
Per Capita Income -.32 * -1.49 * -.06 * -.24 *(.20) (.74) (.02) (.06)
Employment -1.11 * -4.22 * -.06 * -.21 *(.35) (1.29) (.01) (.05)
3 The industrial relations system variable uses a summated ratings scale ( See Freeman 1986)
* Significant at 5% level1 All regressions include constant and control variables;high school graduation rate, log of per capita tax revenue, log of population and manufacturing employment. Standard errors are in parenthesis. Economic Data is from the BLS and BEA Website2Gross State Product includes only data through1998
Appendix 5. Random Effect Estimates of the Impact of the Industrial Relations System on Economic Efficiency
for U.S. States1
A. % change between1990-1999 B. % Change over a Year (Panel 1990-1999)
IR SR3 IR Rasch3 IR SR3 IR Rasch3
Recommended