National and InternationalClimate Protection Policyfrom an Economic PolicyPerspective
Lecture by Counselor
Werner Ressing
Translation by Burghard Schmanck

Climate protection is right andimportant, but: toacknowledge factsand react rational onclimate change

Initial
Climate protection since 20 years on the political agenda
since the federal government operates active climate policy, i. e. today we don‘t start at
"zero"
Energy productivity since 1990 by around 22% increased
CO2 by 16%, all Greenhouse gases by 20,4% have fallen
Greatest Reduktion in the industrial sector by ca. 130 Mio. t
Many industries are approaching the physical limits
It is undisputed: Global problems require global solutions
Desire and reality of the emissions development
Concern about "blinkered thinking„
In the population is the impression:
"We can solve the problem alone.„
Necessary: look at the global development
8,1
3,8
5,46,1
0
1
2
3
4
5
6
7
8
9
1971 1990 2002 2030
Mrd
.M
en
sch
en
Development of the World's Population
According to the medium forecastof UN

Increase of the Consumption of Energy
Source: IEA
0,36 0,34 0,29
17,1
11,48,7
0
5
10
15
20
1990 2005 2030
Mrd
.t
Energieverbrauch Mrd. t RÖE Deutschland Energieverbrauch Mrd. t RÖE Welt
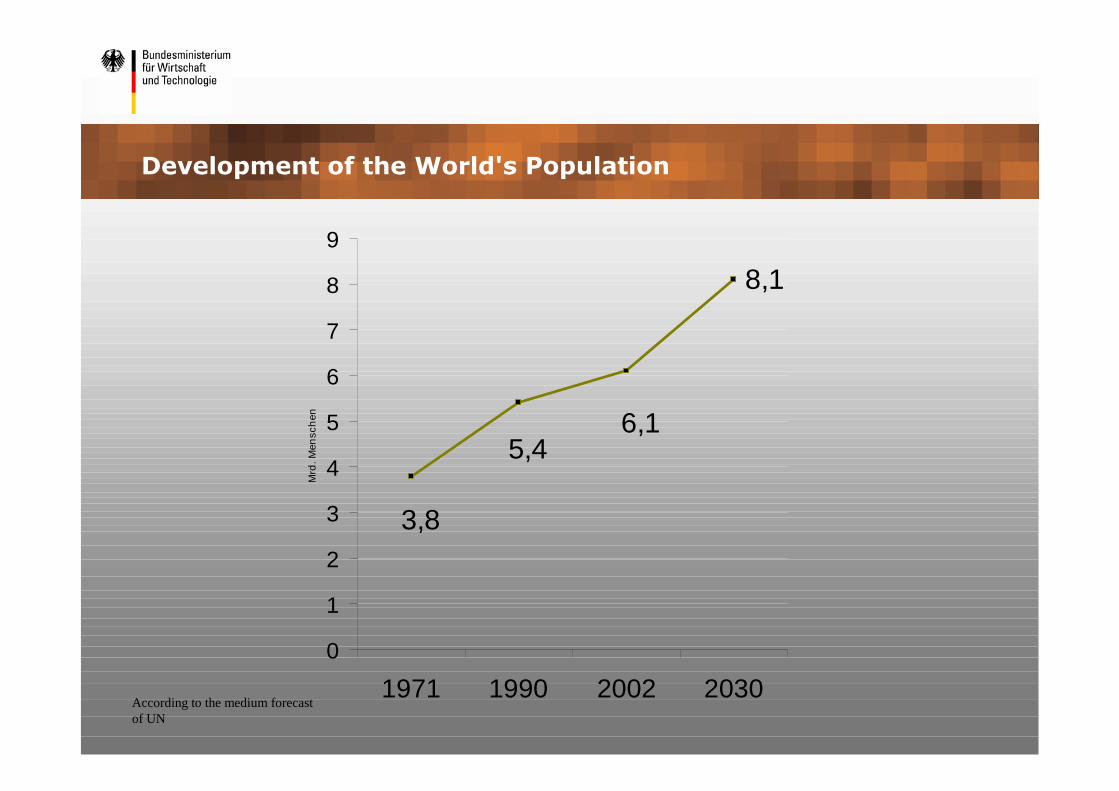
CO2-Emissions of China and India to 2030
3,3
0,61,1
1,8
11,4
8,6
5,1
2,2
0
2
4
6
8
10
12
1990 2005 2015 2030Jahr
Mrd
.t.
Indien
China
Source: IEA World Energy Outlook 2007 (Referenzszenario) and own calculations
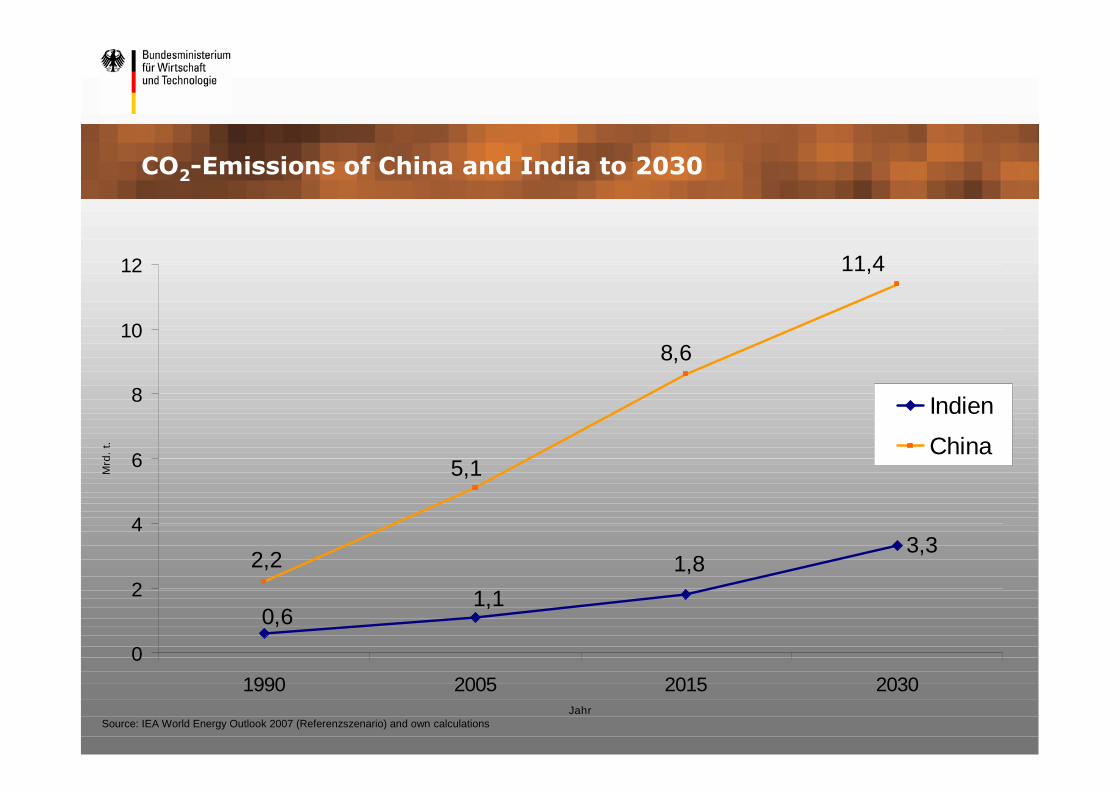
14,1
21,0
27,1
31,9
34,0
36,6
41,9
1 1,00 0,9 0,8 0,8 0,8 0,7
0
5
10
15
20
25
30
35
40
45
1971 1990 2005 2012 2015 2020 2030
Jahr
Mrd
.t.
Globale CO2-Emissionen und Prognose
CO2-Emissionen Deutschland und Prognose
Global Increase of CO2-Emissions to 2030
Source: IEA World Energy Outlook 2007 (Referenzszenario) and own calculations
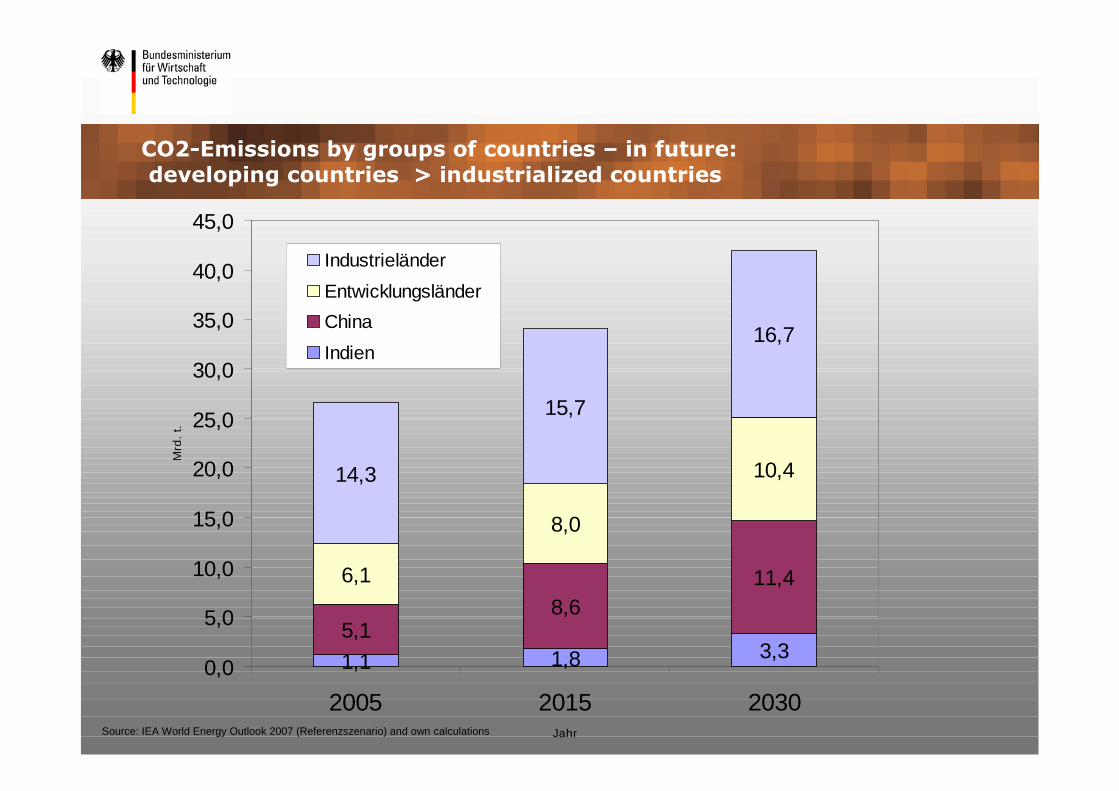
CO2-Emissions by groups of countries – in future:developing countries > industrialized countries
1,1 1,8 3,35,1
8,6
11,46,1
8,0
10,414,3
15,7
16,7
0,0
5,0
10,0
15,0
20,0
25,0
30,0
35,0
40,0
45,0
2005 2015 2030Jahr
Mrd
.t.
Industrieländer
Entwicklungsländer
China
Indien
Source: IEA World Energy Outlook 2007 (Referenzszenario) and own calculations

Increase of C02-Emissions 1990-2012 – Reduction AchievementsGermany and EU
10900
-254
-446
0
-2000
0
2000
4000
6000
8000
10000
12000
1990 2012
Jahr
Mio
.t
D
EU 27
Global
D
EU 27
Global
EU-Reduktion to 2012 is in 12months offset by global growth

27,1
21,0
31,934,0
36,641,9
0,0
5,0
10,0
15,0
20,0
25,0
30,0
35,0
40,0
45,0
1990
1992
1994
1996
1998
2000
2002
2004
2006
2008
2010
2012
2014
2016
2018
2020
2022
2024
2026
2028
2030
Jahr
Mrd
.t.
Ko
hle
nd
iox
idThe Kyoto-Protocol - even if fully implemented - would not have a noticeable effect
on the global greenhouse gas emissions' growth
Source: IEA World Energy Outlook 2007 (Referenzszenario) and own calculations

The reality
CO2 is NOT a harmful gas (it is needed by any plant)
therefore it is not justified to call it atmospheric pollution or
contamination
Global emissions are increasing by some 400 million tons per year,
or more than 1 million tons per day
It is clear that as long as the "global chimney“ open upwards, there
will be no absolute reduction in greenhouse gases enter
Even a successful implementation of the Kyoto Protocol will not
even leave a dent
Any CO2 reduction by Germany or the EU is quickly compensated
within few weeks or months
A "pilot role" does not seem to have a political impact on other
countries
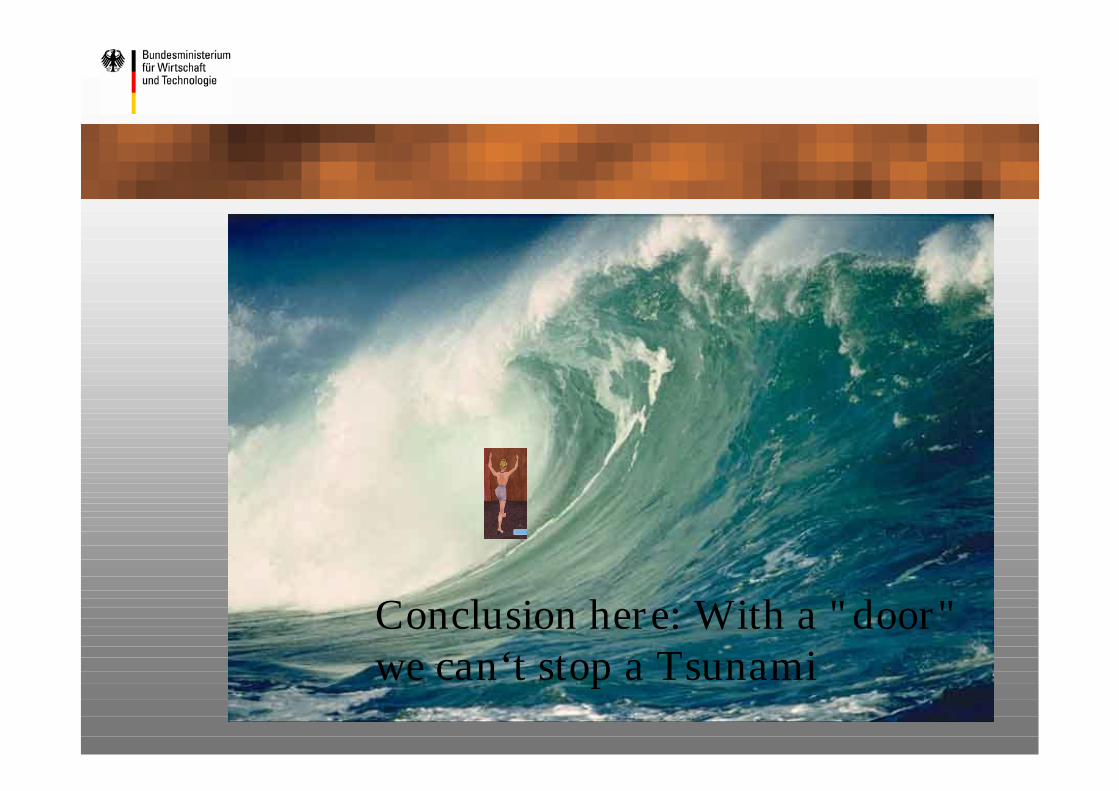
Conclusion here: With a "door"we can‘t stop a Tsunami

Targets of the EU-Climat Policy to 2020
Reduction-target GHG-20 % (-1.118 Mio. t.) based on 1990
-14 % (-733 Mio. t.) relative to 2005
EU-ETS-21 % (-464 Mio. t.)
relativeto 2005
Non-ETS-10% (-269 Mio. t.) relative
to 2005
27 Member States from -20% to +20%

Change of CO2
equivalents1990 to 2008/12EU-burden sharing
45
25
19
7
3
0
0
-4
-10
-10
-13
-15
-35
-99
-254
-341
-400 -350 -300 -250 -200 -150 -100 -50 0 50 100
Spanien
Griechenland
Portugal
Irland
Schweden
Finnland
Frankreich
Luxemburg
Österreich
Belgien
Niederlande
Dänemark
Italien
Großbritannien
Deutschland
EU insgesamt
Senkung der CO2-ÄquivalenteErhöhung derCO2-Äquivalente
Germany contributes thelion's share of 75% with254 million tonnes
Remeinder: In the EU-Climate-Bundle 2008-2012 Germany bearsthe main brunt
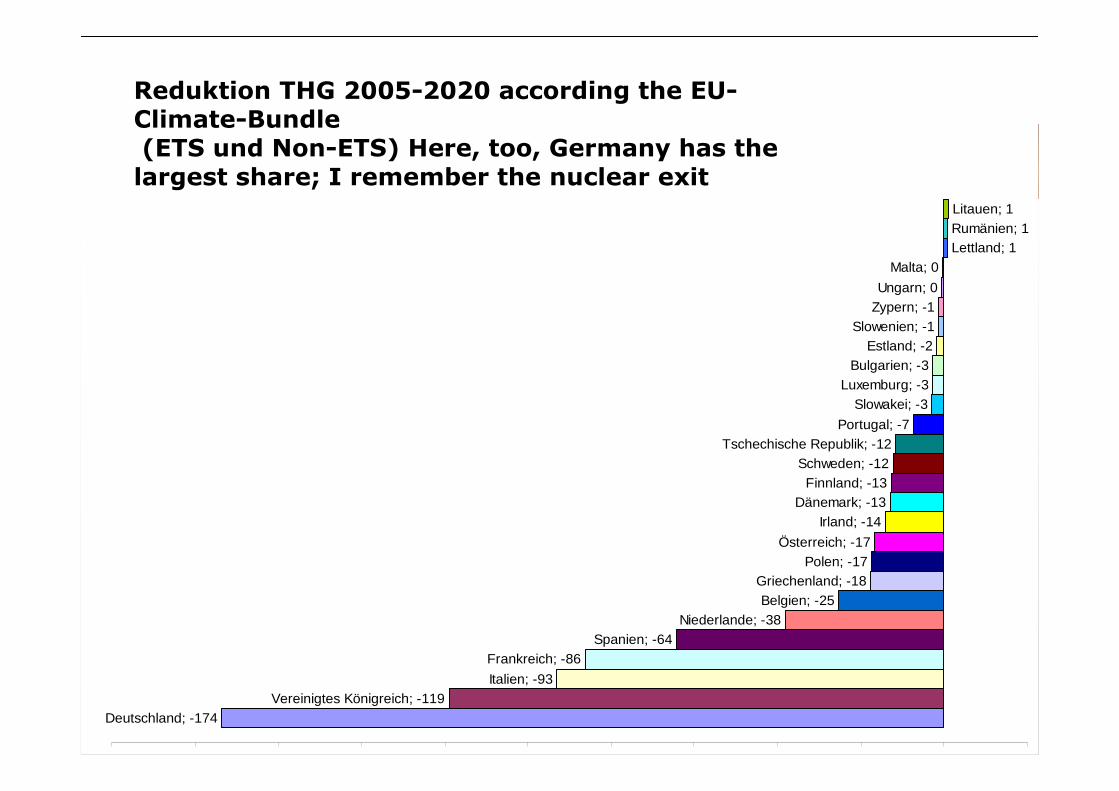
Deutschland; -174
Vereinigtes Königreich; -119
Italien; -93
Frankreich; -86
Spanien; -64
Niederlande; -38
Belgien; -25
Griechenland; -18
Polen; -17
Österreich; -17
Irland; -14
Dänemark; -13
Finnland; -13
Schweden; -12
Tschechische Republik; -12
Portugal; -7
Slowakei; -3
Luxemburg; -3
Bulgarien; -3
Estland; -2
Slowenien; -1
Zypern; -1
Ungarn; 0
Malta; 0
Lettland; 1
Rumänien; 1
Litauen; 1
-200 -180 -160 -140 -120 -100 -80 -60 -40 -20 0 20
Reduktion THG 2005-2020 according the EU-Climate-Bundle(ETS und Non-ETS) Here, too, Germany has thelargest share; I remember the nuclear exit

35,5
27,1
21,0
31,934,0
36,6
41,9
30,2
0,0
5,0
10,0
15,0
20,0
25,0
30,0
35,0
40,0
45,0
1990
1992
1994
1996
1998
2000
2002
2004
2006
2008
2010
2012
2014
2016
2018
2020
2022
2024
2026
2028
2030
Jahr
Mrd
.t.
Ko
hle
nd
ioxid
CO2-Emissionen und Prognose nach IEA
Reduktion EU 27 um 20% von 2012 bis 2020
Weltweite Reduktion um 20 % von 2012 bis 2020
Carbon Dioxide-Emission and global Impact of a reduction of20% in Europe and worldwide
Source: IEA World Energy Outlook 2007 (Referenzszenario) and own calculations

Problems of the EU-Climate-Bundle – specially the ETS
-21% reduction relative to 2005 for almost all sectors in Germany becauseof the current inputs without growth- and job-losses not affordable
Reversal of the EU-sharing (10% ETS and 21% Non-ETS makes sense)
Auction of certificates in the maufactoring industry ecologically andeconomically counter-productive (location- and job-relocation)
By „cap and trade“ ecological target „automatically“ reached
Auction leads to competitive disadvantages and even directly to the end ofsome economic sectors, such as glass, paper, lime
Economic burden for auction across all sectors at 50 €/t higher as total Eco-tax revenue (18,7 Mrd. €)
Job losses after reports not yet completed ca. 250.000 for Germany

Direct employment effect (ET-Sektors) to 2020
Altogether about 100,000 directand 150,000 further jobs will belost by a full auctioning
Source: EEFA

Economic burden of the glass industry
230 Mio. EuroProfit (estimated)
-85 Mio. EuroResult
-315 Mio. EuroTotal burden
-104 Mio. EuroCosts by electricity consumption
-211 Mio. EuroCertificates cost at 45 euro / t
Source: BV Glas
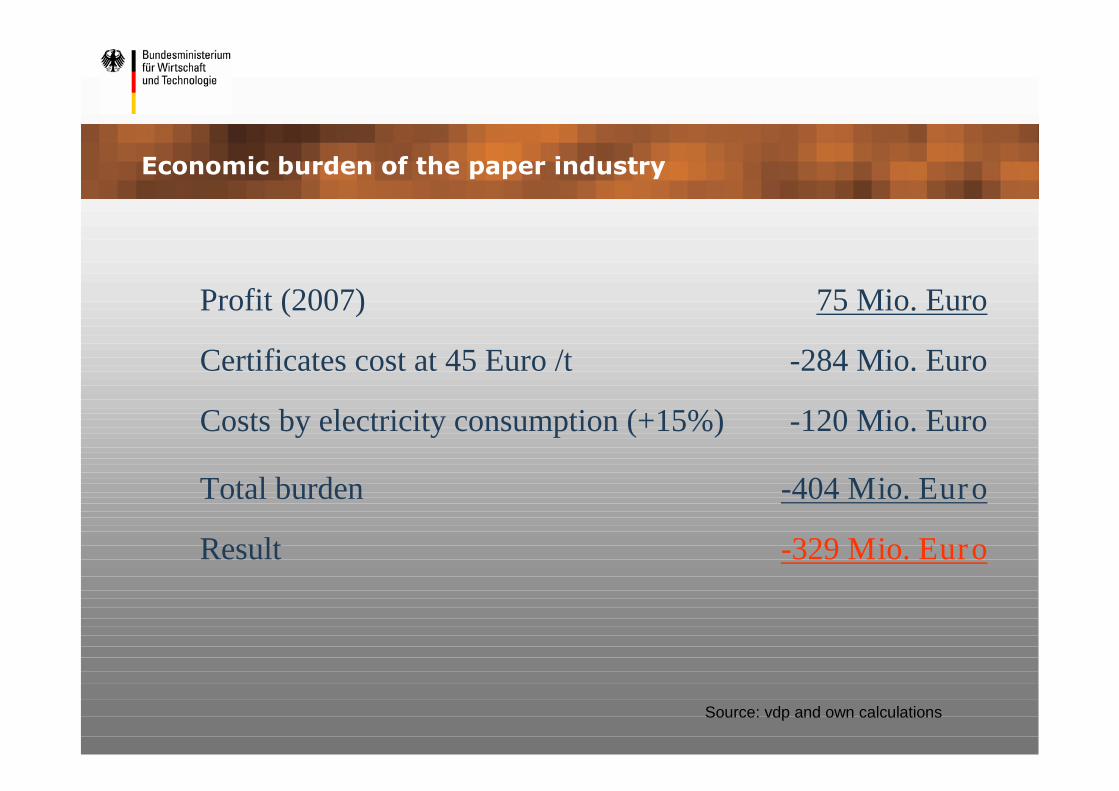
Economic burden of the paper industry
75 Mio. EuroProfit (2007)
-329 Mio. EuroResult
-404 Mio. EuroTotal burden
-120 Mio. EuroCosts by electricity consumption (+15%)
-284 Mio. EuroCertificates cost at 45 Euro /t
Source: vdp and own calculations

EU-Climate-Bundle
The federal government has recognized the problemand wants to protect the competitiveness of oureconomy
Carbon-intensive industries fully exempt from the auctioning
(simultaneous decision to climate-bundle)
Indirect effects to the electricity price by auctioning compensate
No redistribution of certificates („poor, rich“)
A CDM/JI-Rate amounting to 50% the Reduction commitment
The compliance of the Kyoto-targets require as a minimum by all
member states
Seizing Opportunities: Global Strategy for the Future design rationally
Because it is unrealistic to expect that the "global chimney" will be closedsoon:
Squeeze the "full" lemons and not the "empty", i.e. reduce where it is mostcost-effective and economical; in other words:To reach the ecological necessary in a economical efficient manner!
Therefore: Establishment of a global climate fund, starting with forexample 1$/tCO2 i. e. with dynamic volumes (currently 28 Mrd $/a) for theglobal most efficient projects (top-runnes)
Establishment of a "Climate Change Adaptation Fund" “ (CCAF) toimplement adaptions
Special energy program in the "sunbelt of the earth" CO2-free nuclear energy use unreservedly All technological options unconditionally and accelerated further develop

Thank you for yourattention!
Recommended