NASA 9-Point LDI Code Validation Experiment
Yolanda R. Hicks, Robert C. Anderson, and Randy J. Locke Abstract This presentation highlights the experimental work to date to obtain validation data using a 9-point lean direct injector (LDI) in support of the National Combustion Code. The LDI is designed to supply fuel lean, Jet-A and air directly into the combustor such that the liquid fuel atomizes and mixes rapidly to produce short flame zones and produce low levels of oxides of nitrogen and CO. We present NOx and CO emission results from gas sample data that support that aspect of the design concept. We describe this injector and show high speed movies of selected operating points. We present image-based species maps of OH, fuel, CH and NO obtained using planar laser induced fluorescence and chemiluminescence. We also present preliminary 2-component—axial and vertical—velocity vectors of the air flow obtained using particle image velocimetry and of the fuel drops in a combusting case. For the same combusting case, we show preliminary 3-component velocity vectors obtained using a phase Doppler anemometer. For the fueled, combusting cases especially, we found optical density is a technical concern that must be addressed, but that in general, these preliminary results are promising. All optical-based results confirm that this injector produces short flames, typically on the order of 5- to-7-mm long at typical cruise and high power engine cycle conditions.
https://ntrs.nasa.gov/search.jsp?R=20080005554 2018-06-16T17:56:25+00:00Z
1
National Aeronautics and Space Administration
www.nasa.gov
NASA 9-Point LDI Code Validation Experiment
Yolanda R. Hicks and Robert C. AndersonNASA Glenn Research Center
Cleveland, Ohio USA
Randy J. LockeASRC Aerospace, Inc.Cleveland, Ohio USA
Fundamental Aeronautics 2007 Annual Meeting30 October – 1 November 2007
New Orleans LA
2
National Aeronautics and Space Administration
www.nasa.gov
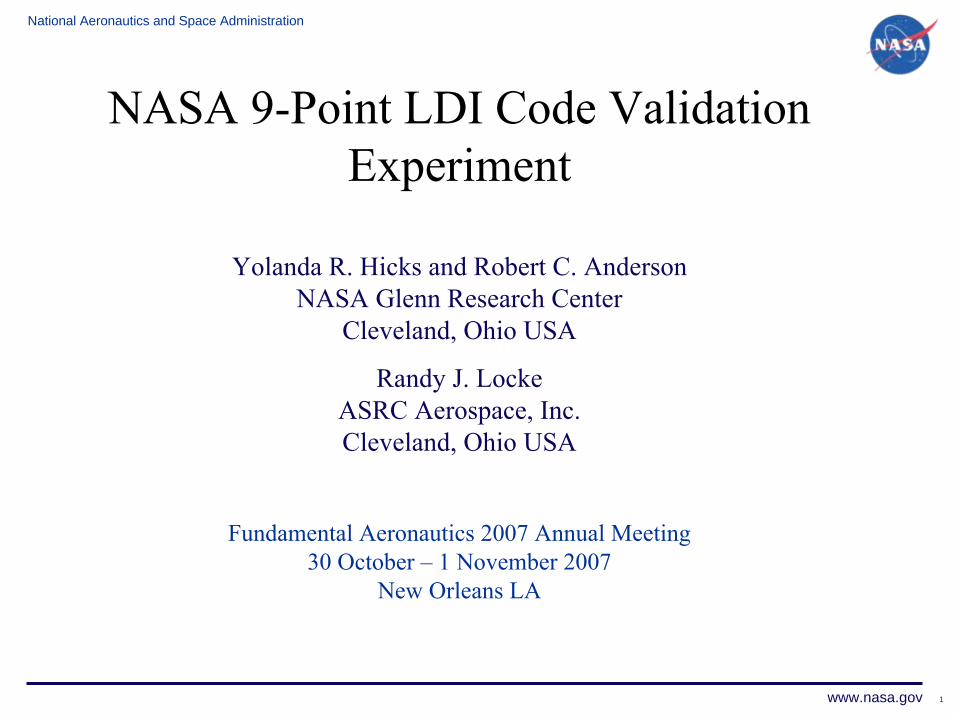
MotivationMotivationNASA GRC has initiated efforts to develop a broad measurement database to characterize an LDI injector to facilitate understanding of the fuel vaporization, turbulent mixing and combustion processes.
3
National Aeronautics and Space Administration
www.nasa.gov
MotivationMotivation
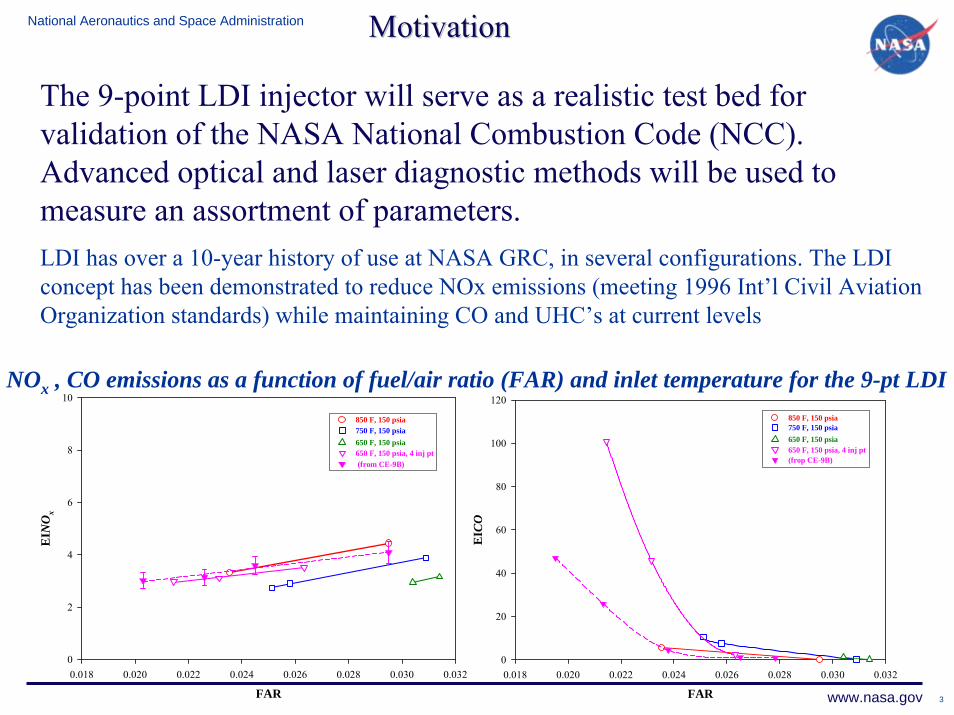
The 9-point LDI injector will serve as a realistic test bed for validation of the NASA National Combustion Code (NCC). Advanced optical and laser diagnostic methods will be used to measure an assortment of parameters.LDI has over a 10-year history of use at NASA GRC, in several configurations. The LDI concept has been demonstrated to reduce NOx emissions (meeting 1996 Int’l Civil Aviation Organization standards) while maintaining CO and UHC’s at current levels
FAR0.018 0.020 0.022 0.024 0.026 0.028 0.030 0.032
EI N
Ox
0
2
4
6
8
10
850 F, 150 psia
650 F, 150 psia, 4 inj pt650 F, 150 psia750 F, 150 psia
(from CE-9B)
FAR0.018 0.020 0.022 0.024 0.026 0.028 0.030 0.032
EI C
O
0
20
40
60
80
100
120
850 F, 150 psia
650 F, 150 psia, 4 inj pt650 F, 150 psia750 F, 150 psia
(frop CE-9B)
NOx , CO emissions as a function of fuel/air ratio (FAR) and inlet temperature for the 9-pt LDI
4
National Aeronautics and Space Administration
www.nasa.gov
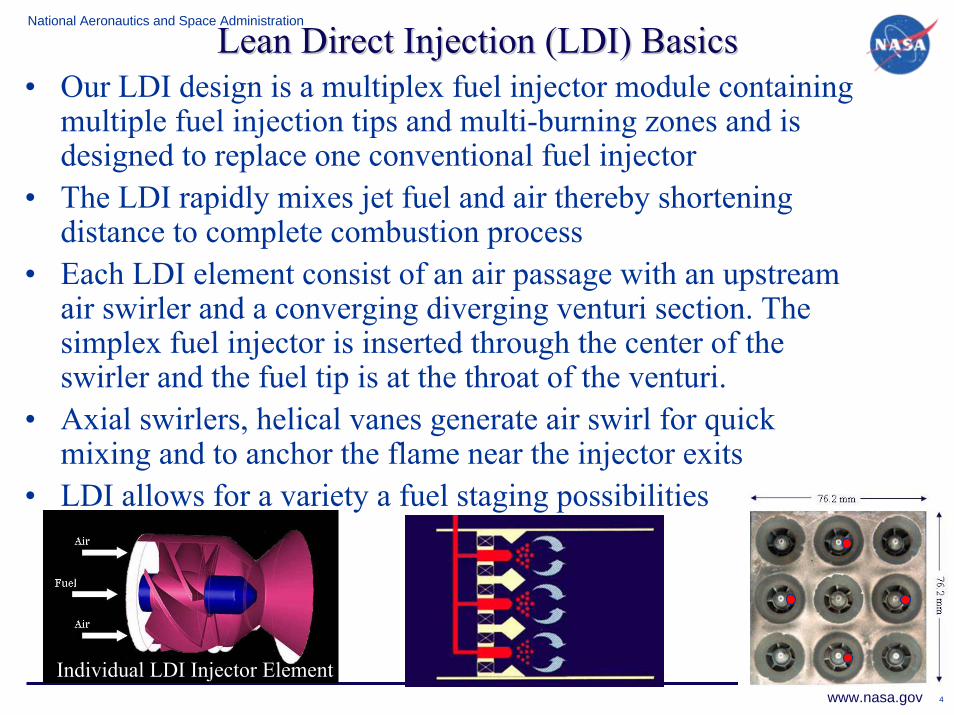
Lean Direct Injection (LDI) BasicsLean Direct Injection (LDI) Basics• Our LDI design is a multiplex fuel injector module containing
multiple fuel injection tips and multi-burning zones and is designed to replace one conventional fuel injector
• The LDI rapidly mixes jet fuel and air thereby shortening distance to complete combustion process
• Each LDI element consist of an air passage with an upstream air swirler and a converging diverging venturi section. The simplex fuel injector is inserted through the center of the swirler and the fuel tip is at the throat of the venturi.
• Axial swirlers, helical vanes generate air swirl for quick mixing and to anchor the flame near the injector exits
• LDI allows for a variety a fuel staging possibilities
Individual LDI Injector Element

5
National Aeronautics and Space Administration
www.nasa.gov
T3 = 617 K T3 = 728 K T3 = 828 K
Frames from high speed movies show a turbulent, unsteady system from which flamelets can be seen. Flow is left to right.
6
National Aeronautics and Space Administration
www.nasa.gov
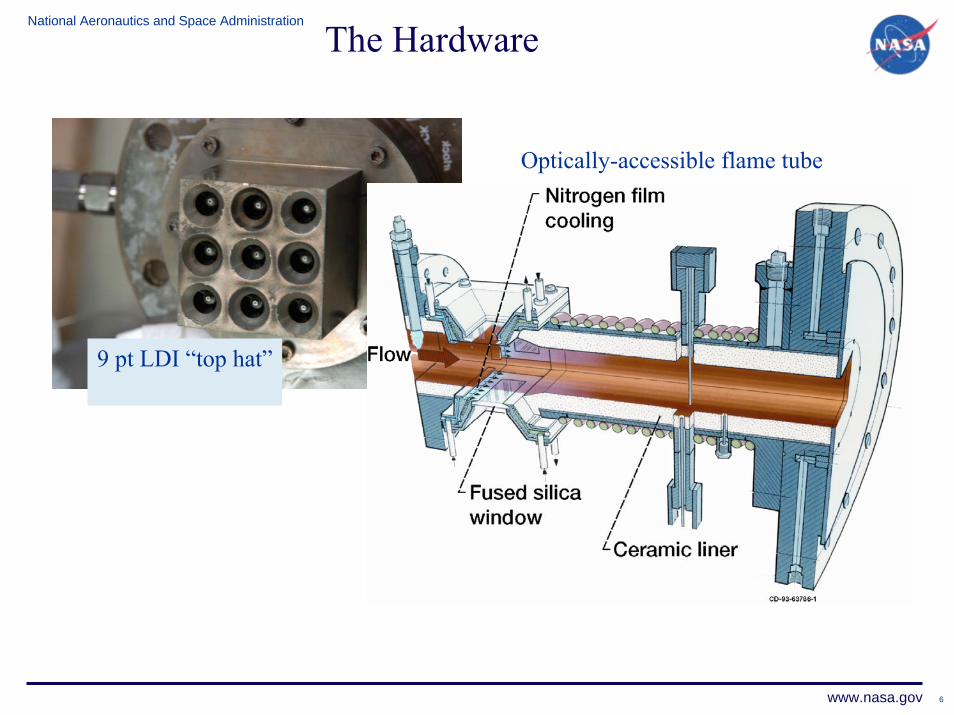
The Hardware
9 pt LDI “top hat”
Optically-accessible flame tube
7
National Aeronautics and Space Administration
www.nasa.gov
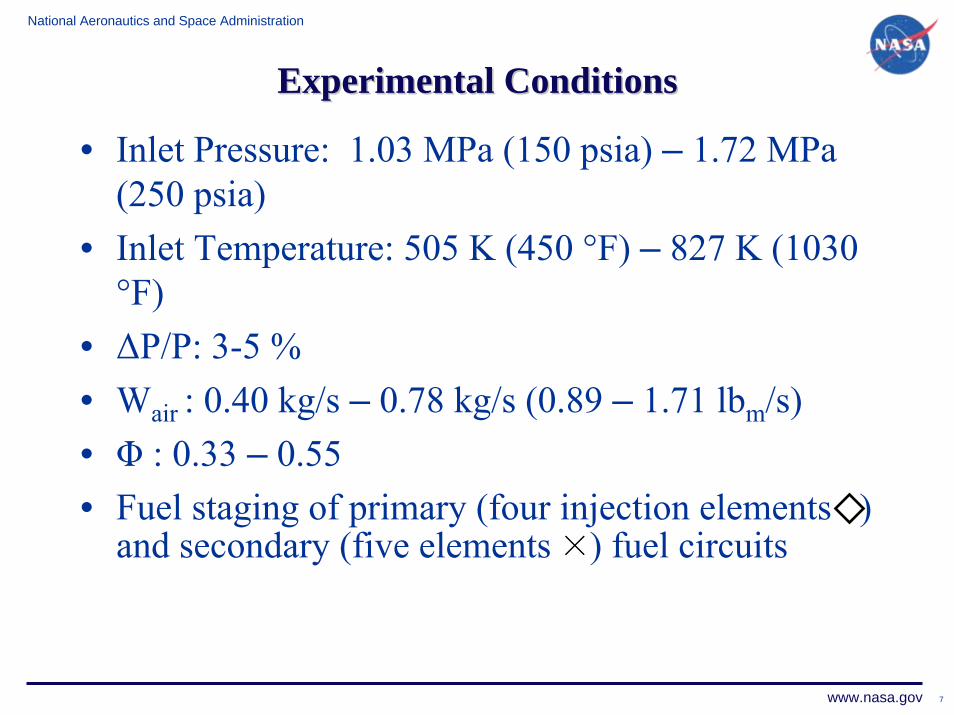
Experimental ConditionsExperimental Conditions
• Inlet Pressure: 1.03 MPa (150 psia) – 1.72 MPa (250 psia)
• Inlet Temperature: 505 K (450 °F) – 827 K (1030 °F)
• ΔP/P: 3-5 %• Wair : 0.40 kg/s – 0.78 kg/s (0.89 – 1.71 lbm/s)• Φ : 0.33 – 0.55• Fuel staging of primary (four injection elements )
and secondary (five elements G) fuel circuits
8
National Aeronautics and Space Administration
www.nasa.gov
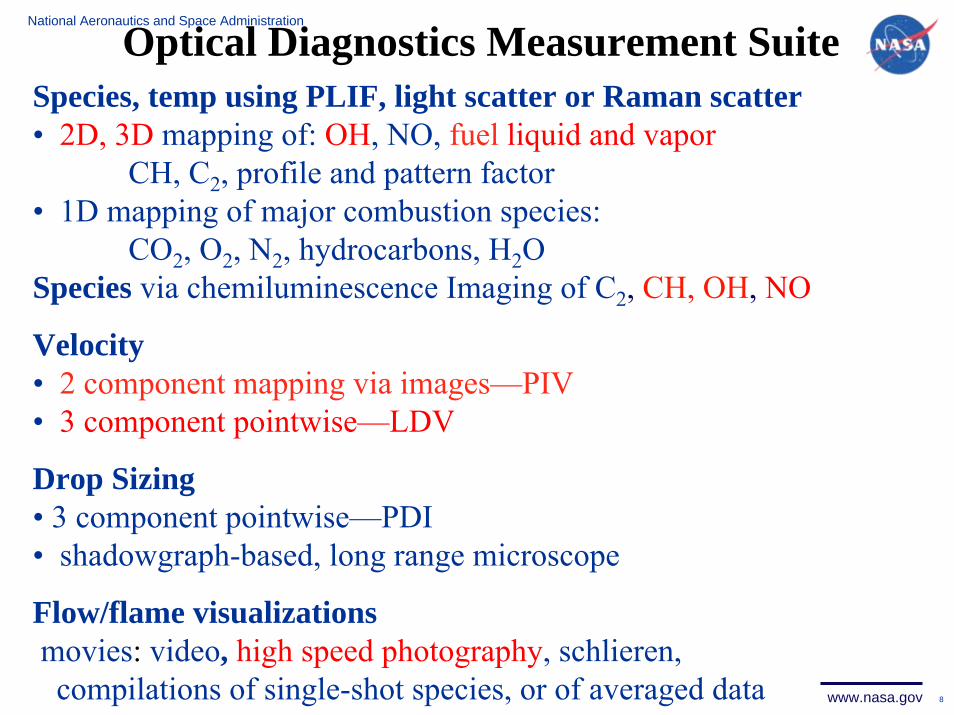
Optical Diagnostics Measurement SuiteSpecies, temp using PLIF, light scatter or Raman scatter• 2D, 3D mapping of: OH, NO, fuel liquid and vapor
CH, C2, profile and pattern factor• 1D mapping of major combustion species:
CO2, O2, N2, hydrocarbons, H2OSpecies via chemiluminescence Imaging of C2, CH, OH, NO
Velocity• 2 component mapping via images—PIV• 3 component pointwise—LDV
Drop Sizing• 3 component pointwise—PDI• shadowgraph-based, long range microscope
Flow/flame visualizationsmovies: video, high speed photography, schlieren, compilations of single-shot species, or of averaged data
9
National Aeronautics and Space Administration
www.nasa.gov
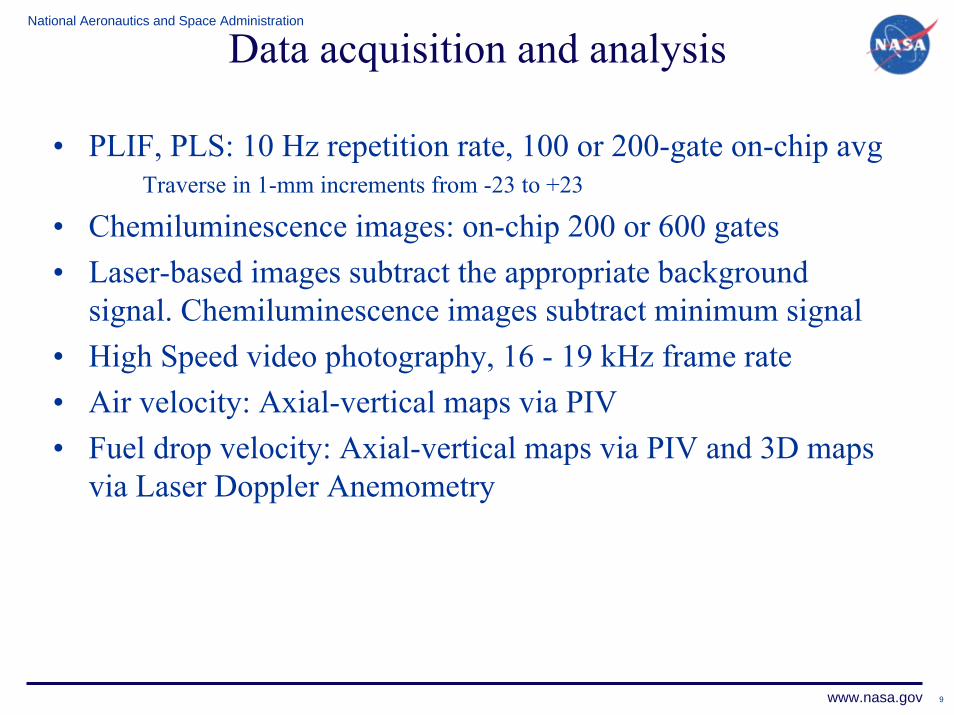
Data acquisition and analysis
• PLIF, PLS: 10 Hz repetition rate, 100 or 200-gate on-chip avgTraverse in 1-mm increments from -23 to +23
• Chemiluminescence images: on-chip 200 or 600 gates• Laser-based images subtract the appropriate background
signal. Chemiluminescence images subtract minimum signal• High Speed video photography, 16 - 19 kHz frame rate• Air velocity: Axial-vertical maps via PIV• Fuel drop velocity: Axial-vertical maps via PIV and 3D maps
via Laser Doppler Anemometry
10
National Aeronautics and Space Administration
www.nasa.gov
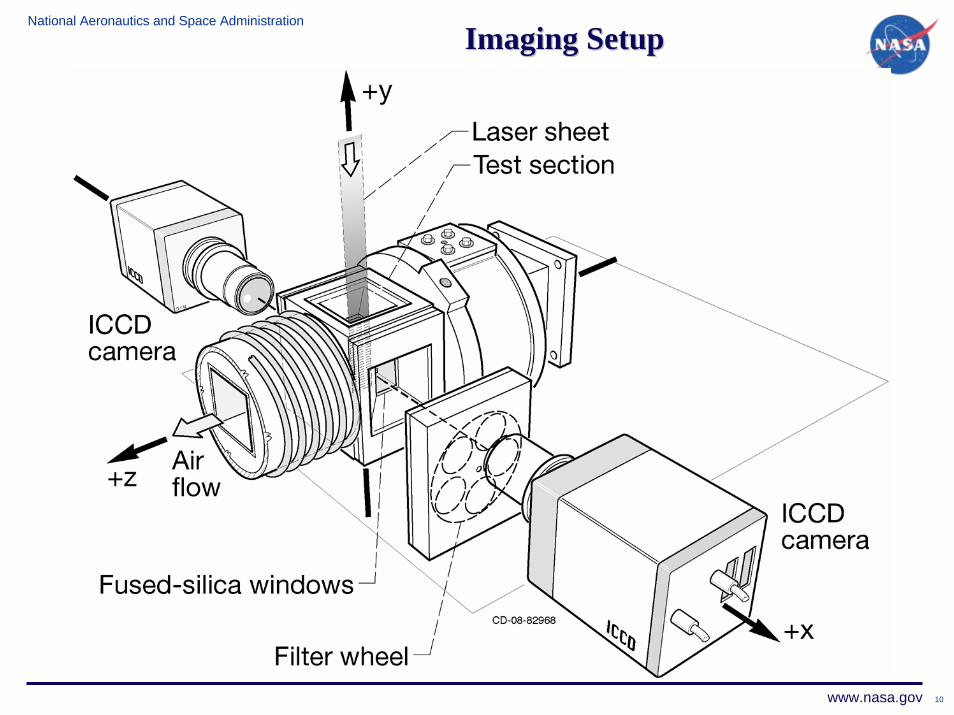
Imaging SetupImaging Setup
11
National Aeronautics and Space Administration
www.nasa.gov
CameraCamera
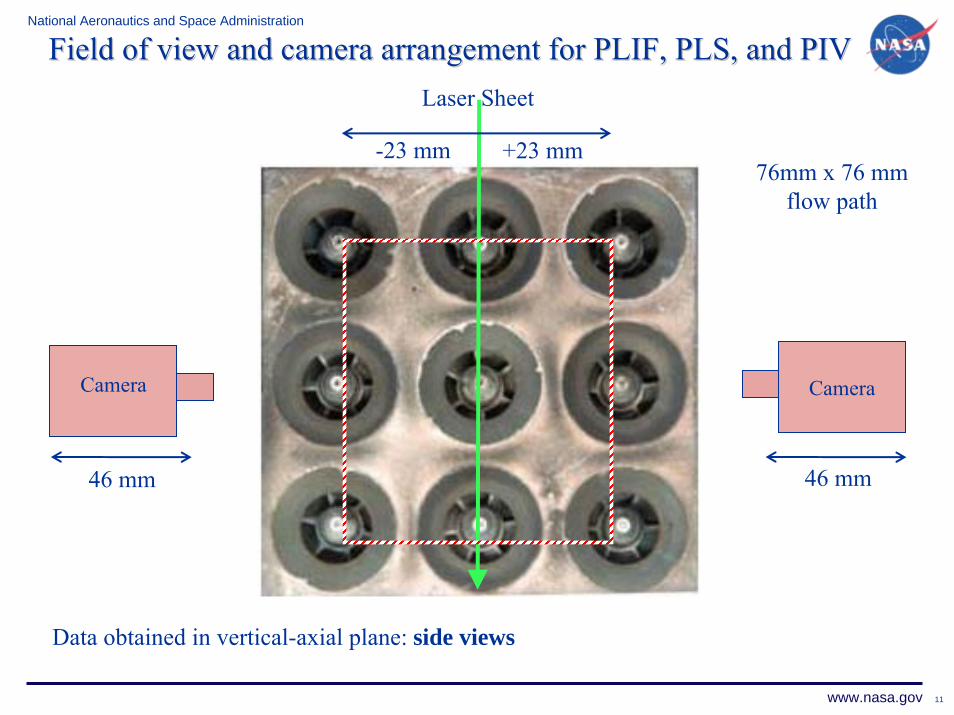
Field of view and camera arrangement for PLIF, PLS, and PIVField of view and camera arrangement for PLIF, PLS, and PIVLaser Sheet
76mm x 76 mmflow path
46 mm
+23 mm-23 mm
46 mm
Data obtained in vertical-axial plane: side views
12
National Aeronautics and Space Administration
www.nasa.gov
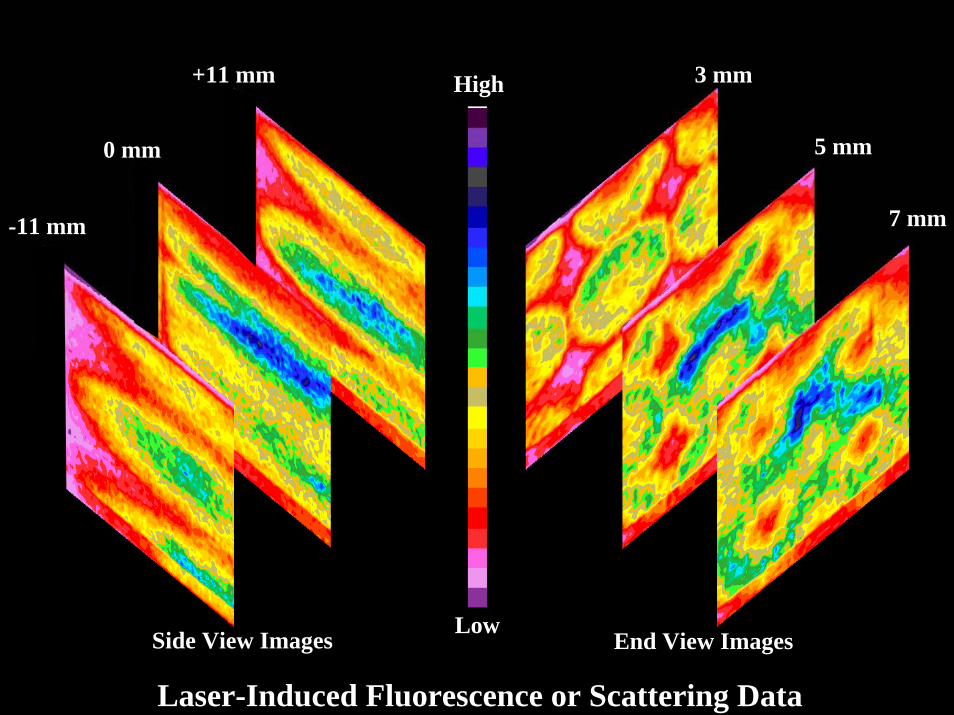
Side View Images End View Images
High
Low
Laser-Induced Fluorescence or Scattering Data
0 mm
-11 mm
+11 mm 3 mm
5 mm
7 mm

13
National Aeronautics and Space Administration
www.nasa.gov
End View Composites 7.5 mm from the Injector Exit
Inlet conditions: T = 617K, P = 1030 kPa, φ = 0.38, equal fuel split. “low” power
Total Fuel OH Liquid Fuel
Inlet conditions: T = 822K, P = 1723 kPa, φ = 0.41, equal fuel split. “high” power
Total Fuel OH Liquid Fuel
Scaled per species for entire set of inlet conditions tested
14
National Aeronautics and Space Administration
www.nasa.gov
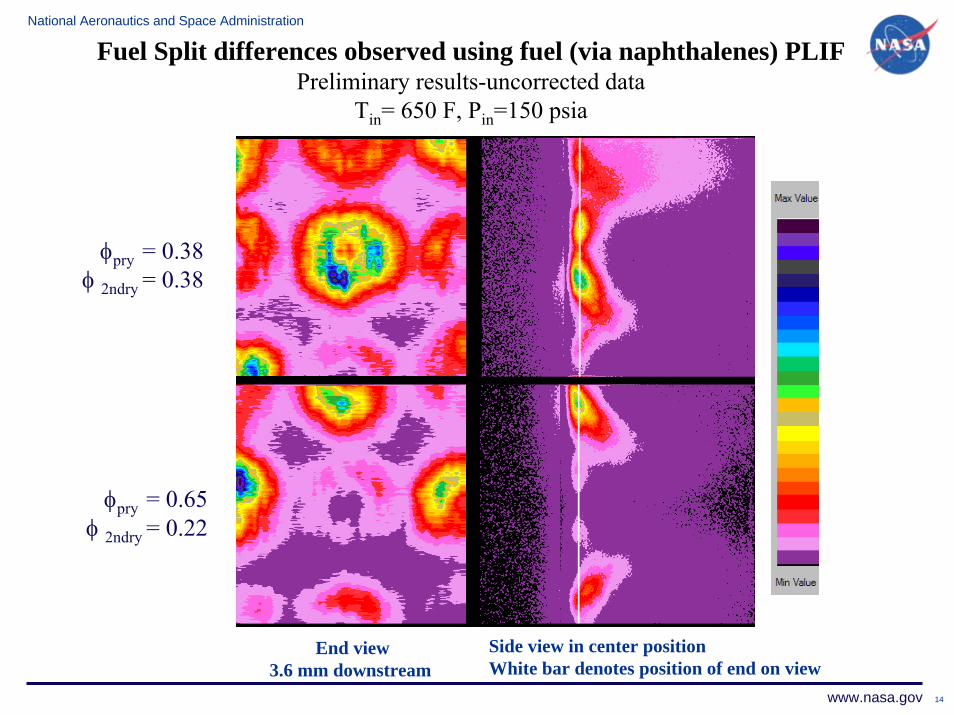
End view3.6 mm downstream
Side view in center positionWhite bar denotes position of end on view
φpry = 0.38φ 2ndry = 0.38
Fuel Split differences observed using fuel (via naphthalenes) PLIFPreliminary results-uncorrected data
Tin= 650 F, Pin=150 psia
φpry = 0.65φ 2ndry = 0.22
15
National Aeronautics and Space Administration
www.nasa.gov
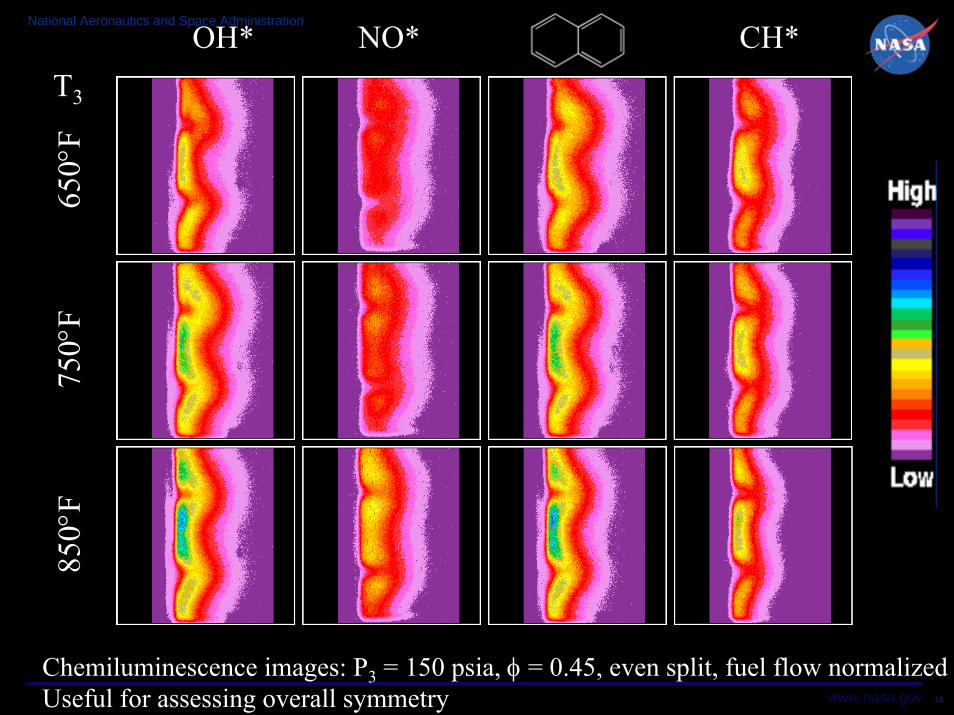
OH* NO* CH*T3
Chemiluminescence images: P3 = 150 psia, φ = 0.45, even split, fuel flow normalizedUseful for assessing overall symmetry
650°
F75
0°F
850°
F
16
National Aeronautics and Space Administration
www.nasa.gov
Distance from injector exit, mm
0 5 10 15 20 25 30
Sign
al, a
.u.
0
2
4
6
8
10
12
14
Distance from injector exit, mm
0 5 10 15 20 25 30Si
gnal
, a.u
.0
5
10
15
20
Distance from injector exit, mm
0 5 10 15 20 25 30
Sign
al, a
.u.
0
2
4
6
8
Distance from injector exit, mm
0 5 10 15 20 25 30
Sign
al, a
.u.
0
20
40
60
80
a. OH PLIF
d. CH* c. OH*
b. Fuel PLIF
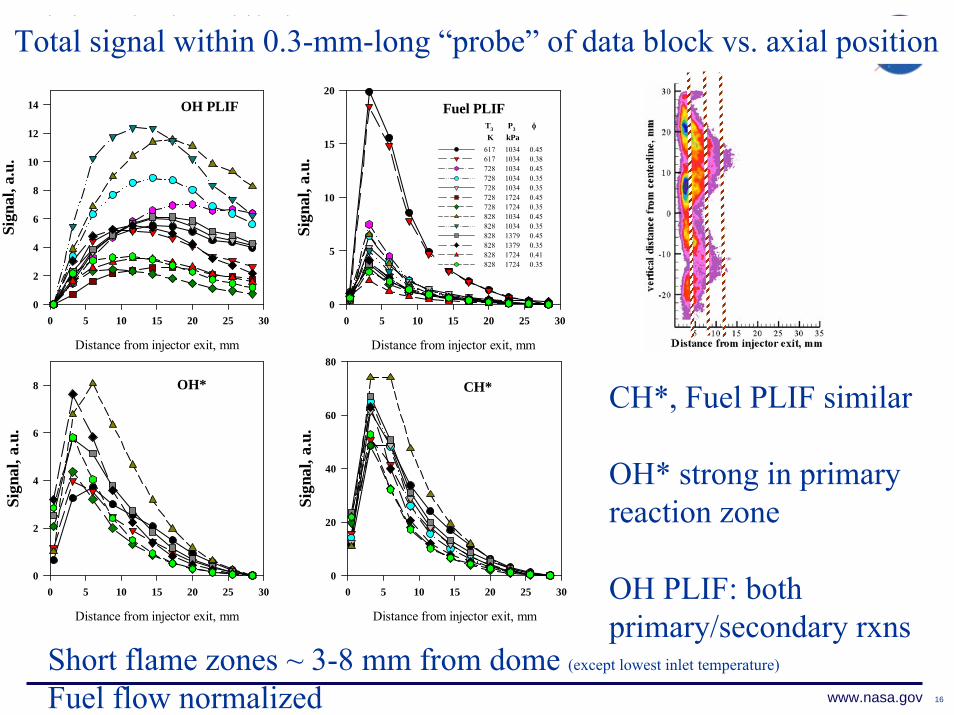
CH*, Fuel PLIF similar
OH* strong in primary reaction zone
OH PLIF: both primary/secondary rxns
Total signal within 0.3-mm-long “probe” of data block vs. axial position
617 1034 0.45617 1034 0.38728 1034 0.45728 1034 0.35728 1034 0.35728 1724 0.45728 1724 0.35828 1034 0.45828 1034 0.35828 1379 0.45828 1379 0.35828 1724 0.41828 1724 0.35
T3 P3 φ K kPa
Short flame zones ~ 3-8 mm from dome (except lowest inlet temperature)
Fuel flow normalized
17
National Aeronautics and Space Administration
www.nasa.gov
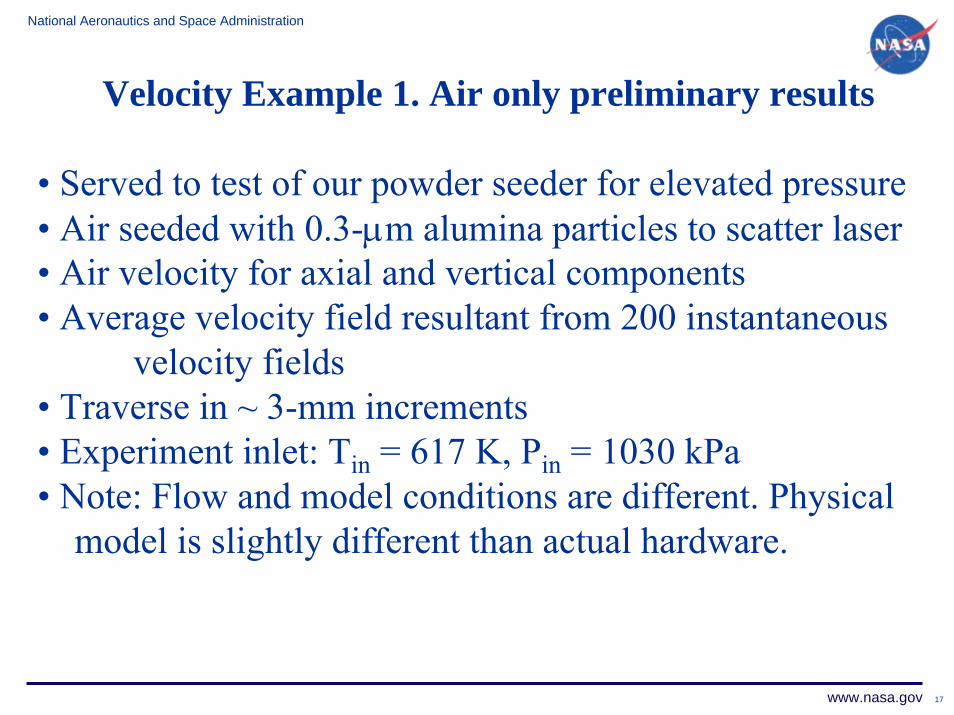
Velocity Example 1. Air only preliminary results
• Served to test of our powder seeder for elevated pressure• Air seeded with 0.3-μm alumina particles to scatter laser• Air velocity for axial and vertical components• Average velocity field resultant from 200 instantaneous
velocity fields• Traverse in ~ 3-mm increments• Experiment inlet: Tin = 617 K, Pin = 1030 kPa• Note: Flow and model conditions are different. Physical
model is slightly different than actual hardware.
distance from injector exit, mm
verti
cald
ista
nce
from
cent
erlin
e,m
m
0 5 10 15 20 25 30 35
-25
-20
-15
-10
-5
0
5
10
15
20 4644424038363432302826242220181614121086420
V, m/s
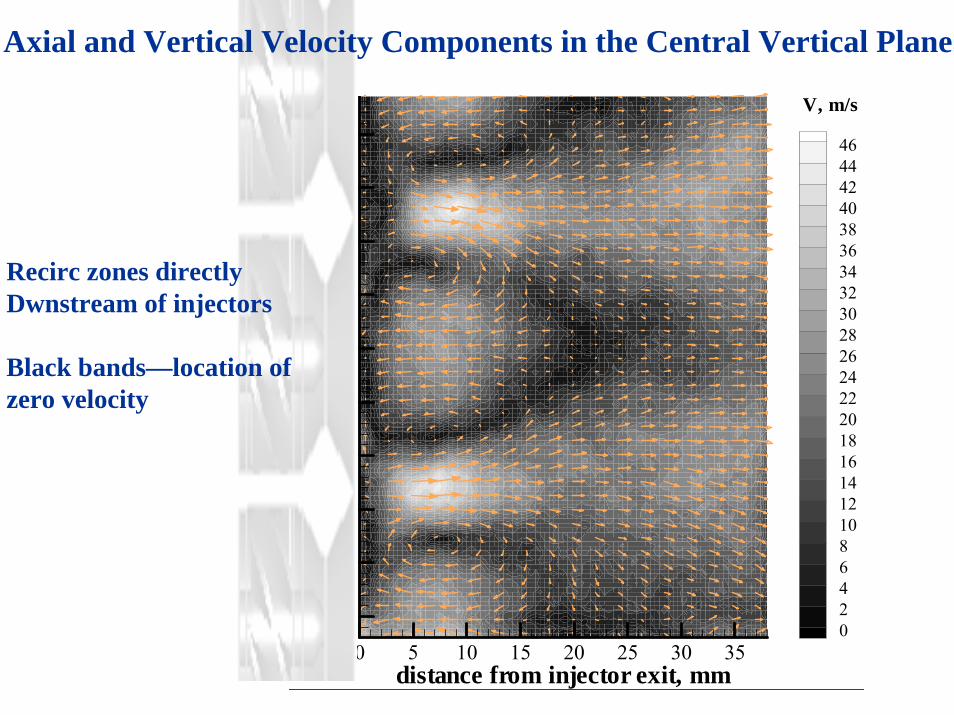
Axial and Vertical Velocity Components in the Central Vertical Plane
Recirc zones directlyDwnstream of injectors
Black bands—location of zero velocity
19
National Aeronautics and Space Administration
www.nasa.gov
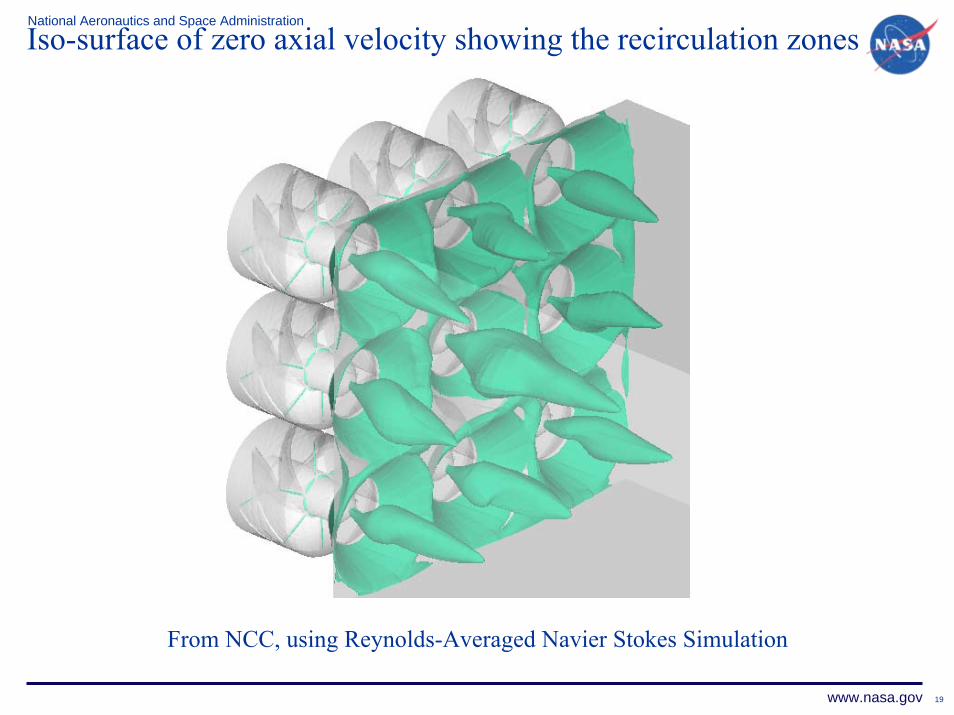
Iso-surface of zero axial velocity showing the recirculation zones
From NCC, using Reynolds-Averaged Navier Stokes Simulation
20
National Aeronautics and Space Administration
www.nasa.gov
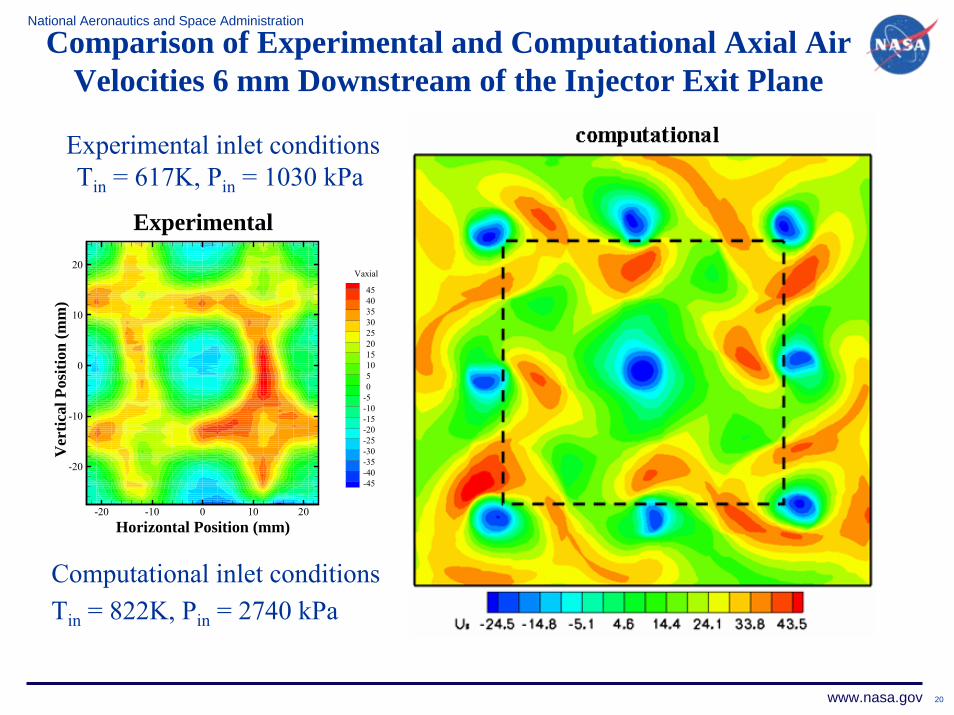
Comparison of Experimental and Computational Axial AirVelocities 6 mm Downstream of the Injector Exit Plane
Experimental inlet conditionsTin = 617K, Pin = 1030 kPa
Computational inlet conditionsTin = 822K, Pin = 2740 kPa
-20 -10 0 10 20
-20
-10
0
10
20Vaxial
454035302520151050
-5-10-15-20-25-30-35-40-45
Horizontal Position (mm)
Ver
tical
Pos
ition
(mm
)
Experimental
National Aeronautics and Space Administration
www.nasa.gov
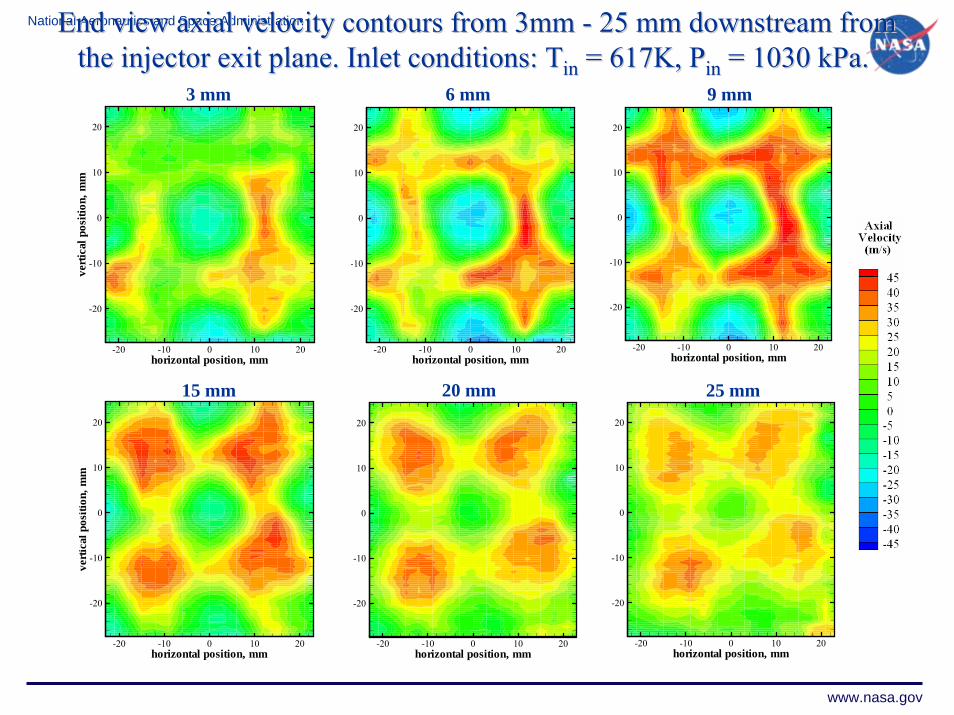
20 mm 25 mm15 mm
3 mm 9 mm6 mm
horizontal position, mm
verti
calp
ositi
on,m
m
-20 -10 0 10 20
-20
-10
0
10
20
horizontal position, mm-20 -10 0 10 20
-20
-10
0
10
20
horizontal position, mm-20 -10 0 10 20
-20
-10
0
10
20
horizontal position, mm-20 -10 0 10 20
-20
-10
0
10
20
horizontal position, mm-20 -10 0 10 20
-20
-10
0
10
20
horizontal position, mm
verti
calp
ositi
on,m
m
-20 -10 0 10 20
-20
-10
0
10
20
End view axial velocity contours from 3mm End view axial velocity contours from 3mm -- 25 mm downstream from25 mm downstream fromthe injector exit plane. Inlet conditions: Tthe injector exit plane. Inlet conditions: Tinin = 617K, P= 617K, Pinin = 1030 = 1030 kPakPa. .
22
National Aeronautics and Space Administration
www.nasa.gov
Velocity Examples 2. Fuel drops only(highly preliminary results)
• Unseeded system, combusting environment
• P3 = 150 psia, T3 = 650°F, φ = 0.45, even fuel split
• Our first PIV measurements in a combusting systemallowed us to assess shutter and timing
• Implementation issues must be resolved for PIV and LDV measurement techniques
23
National Aeronautics and Space Administration
www.nasa.gov
axial distance from injector exit, mm
verti
cald
ista
nce
from
cent
erlin
e,m
m
0 5 10 15
-10
-5
0
5
10
axial distance from injector exit, mm
verti
cald
ista
nce
from
cent
erlin
e,m
m
0 5 10 15
-10
-5
0
5
10
p q
axial distance from injector exit, mm
verti
cald
ista
nce
from
cent
erlin
e,m
m
0 5 10 15
-10
-5
0
5
10
p , , qaxial distance from injector exit, mm
verti
cald
ista
nce
from
cent
erlin
e,m
m
0 5 10 15
-10
-5
0
5
10
axial distance from injector exit, mm
verti
cald
ista
nce
from
cent
erlin
e,m
m
0 5 10 15
-10
-5
0
5
10
p q
30028026024022020018016014012010080604020
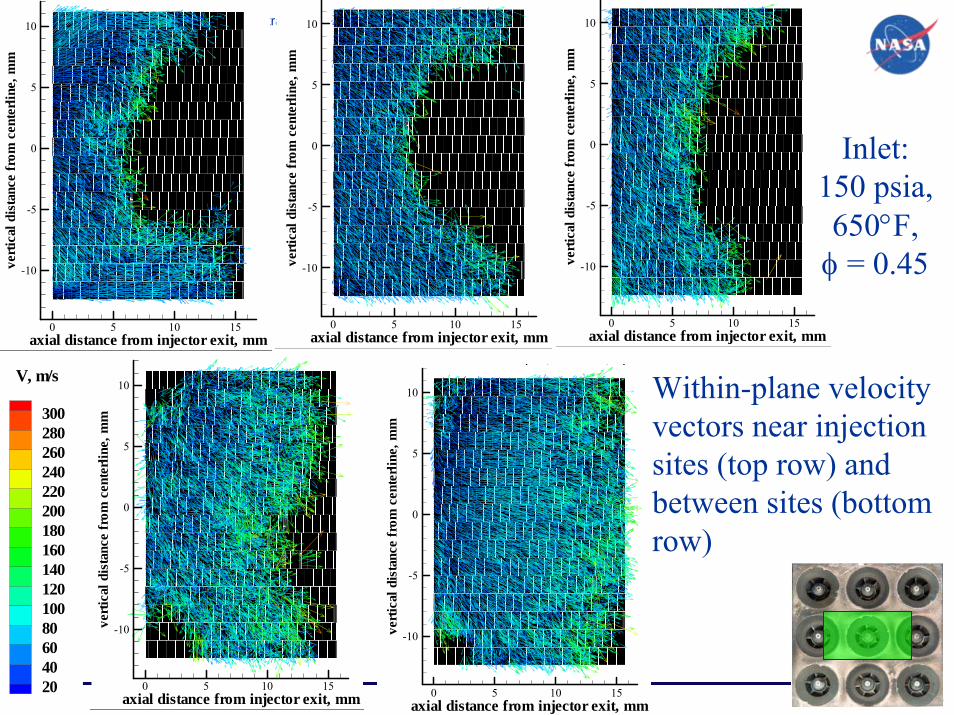
V, m/s Within-plane velocity vectors near injection sites (top row) and between sites (bottom row)
Inlet:150 psia, 650°F, φ = 0.45
24
National Aeronautics and Space Administration
www.nasa.gov
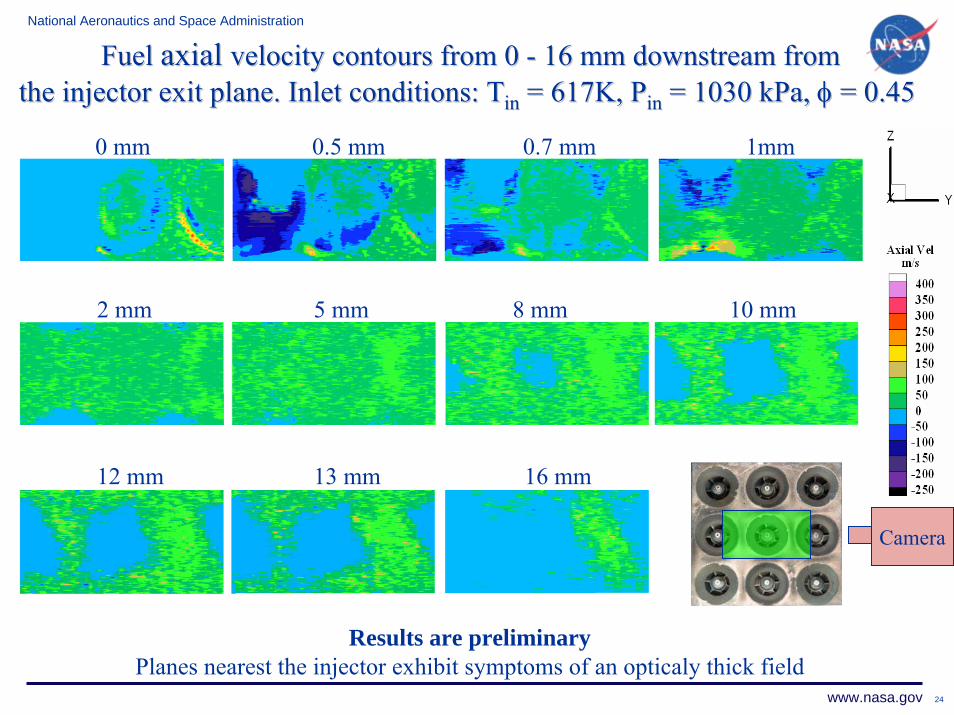
Fuel Fuel axialaxial velocity contours from 0 velocity contours from 0 -- 16 mm downstream from16 mm downstream fromthe injector exit plane. Inlet conditions: Tthe injector exit plane. Inlet conditions: Tinin = 617K, P= 617K, Pinin = 1030 = 1030 kPakPa, , φφ = = 0.45 0.45
0 mm 0.5 mm 0.7 mm 1mm
2 mm 5 mm 8 mm 10 mm
12 mm 13 mm 16 mm
Camera
Results are preliminaryPlanes nearest the injector exhibit symptoms of an opticaly thick field
25
National Aeronautics and Space Administration
www.nasa.gov
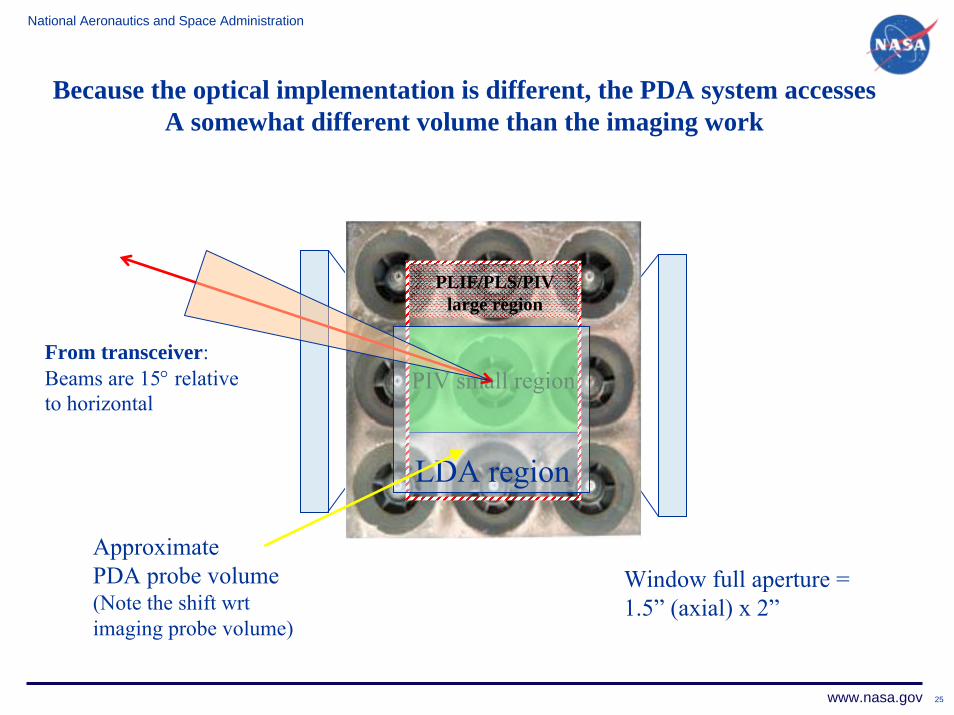
Because the optical implementation is different, the PDA system accessesA somewhat different volume than the imaging work
From transceiver:Beams are 15° relativeto horizontal
ApproximatePDA probe volume(Note the shift wrtimaging probe volume)
PIV small region
LDA region
PLIF/PLS/PIV large region
Window full aperture =1.5” (axial) x 2”

26
National Aeronautics and Space Administration
www.nasa.gov
Horizontal distance from centerline, mm
Ver
tical
dist
ance
from
cent
erlin
e,m
m
-20 -10 0 10 20
-20
-10
0
10
300m/s
33--D Velocity distribution within axial plane 5D Velocity distribution within axial plane 5--mm from exit. mm from exit. Inlet conditions: TInlet conditions: Tinin = 617K, P= 617K, Pinin = 1030 = 1030 kPakPa, , φφ = = 0.45 0.45
As with the PIV result above, the velocity distribution shown here is uncorrected for optical thickness.
Axial V:contour
27
National Aeronautics and Space Administration
www.nasa.gov
SummarySummary
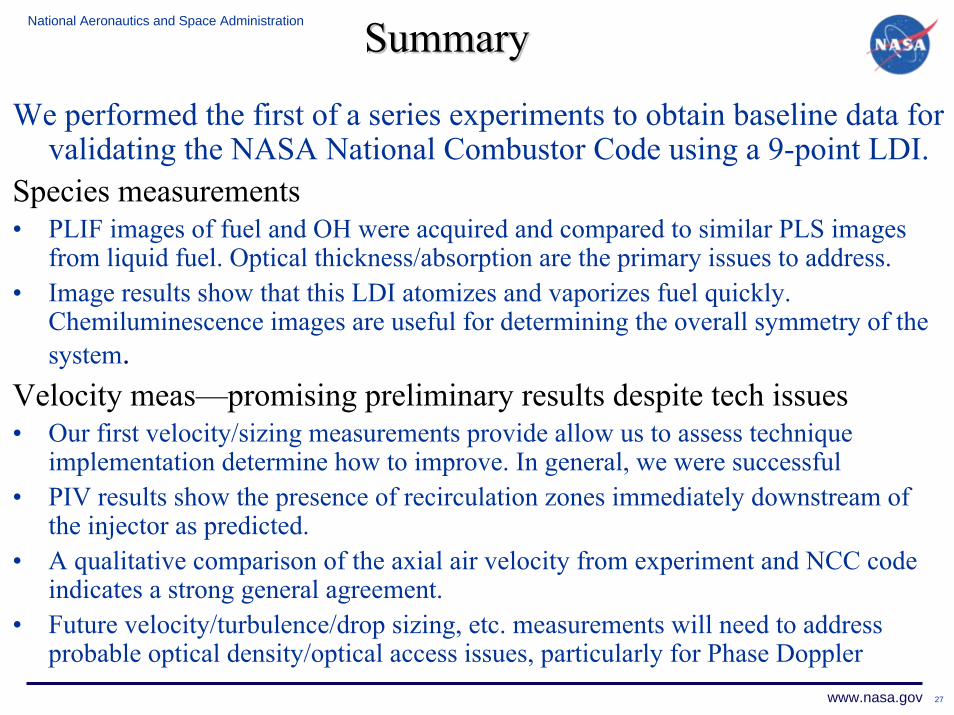
We performed the first of a series experiments to obtain baseline data for validating the NASA National Combustor Code using a 9-point LDI.
Species measurements• PLIF images of fuel and OH were acquired and compared to similar PLS images
from liquid fuel. Optical thickness/absorption are the primary issues to address.• Image results show that this LDI atomizes and vaporizes fuel quickly.
Chemiluminescence images are useful for determining the overall symmetry of the system.
Velocity meas—promising preliminary results despite tech issues • Our first velocity/sizing measurements provide allow us to assess technique
implementation determine how to improve. In general, we were successful• PIV results show the presence of recirculation zones immediately downstream of
the injector as predicted.• A qualitative comparison of the axial air velocity from experiment and NCC code
indicates a strong general agreement. • Future velocity/turbulence/drop sizing, etc. measurements will need to address
probable optical density/optical access issues, particularly for Phase Doppler
Recommended