M. A. Sibley Consulting – All Rights Reserved MTB 06 – Advanced Minitab Macros 1
MTB – 06 Advanced Minitab®
Macros
This module will cover:• Creating tables of statistics – worked example which includes:
– Creating and saving a series of similar graphs (eg. For each production line)
– How to reference specific rows
– Using constants to fine tune graphs, add date sub-titles, etc.
– Creating a text report & HTML report
• Creating a control charting macro with dynamic stages which demonstrates:
– Reading Excel® files via ODBC
• Looping through subsets
• Adding statistics to each row of a dataset
• Using Excel®’s indirect addressing capability to better access difficulty formatted files
• How to save worksheets as CSV files (readable by Excel®) or as Web Pages
• Avoiding errors which will stop autojob execution; Handling no data “subsets”
• Reference macro code to handle many macro programming situations
• Adding a different “reference” line to each panel of a graph (for a graph using a BY variable).

M. A. Sibley Consulting – All Rights Reserved MTB 06 – Advanced Minitab Macros 2
Prerequisites
Before you tackle this module you
should:
– Know how to create, save and execute
Minitab® macros
– Have set up your PC for Minitab® macro
execution

M. A. Sibley Consulting – All Rights Reserved MTB 06 – Advanced Minitab Macros 3
Using a Table of
Statistics to Create
Multiple Graphs, etc.
M. A. Sibley Consulting – All Rights Reserved MTB 06 – Advanced Minitab Macros 4
Creating a Table of Statistics
Creating a table of Summary Statistics is Minitab ®’s
version of Excel®’s Pivot Table – albeit in a non-
interactive form.
Let’s start by opening a CSV file containing the same
Wind Turbine output data we used in module 2. Using
File > Open we open:
WindByStation.csv
We start capturing the code in a macro.

Creating a Table of Statistics –
cont’d
As in Module 2 we combine the Date and Time columns to create a
Date/Time column using Calc > Calculator. We capture the code
from the session window and add it in to the macro. We add in the
command to change the format of the date to International Date
format. M. A. Sibley Consulting – All Rights Reserved MTB 06 – Advanced Minitab Macros 5
My plain text editor – EditPadPro® adds in the colour coding.

Creating a Table of Statistics –
cont’d
In the worksheet I add an asterisk – missing data
symbol – to the first row of column 12. Why? The table
of statistics in the next step will be created after the
last column in use. By putting the missing data
symbol in Column 12 we leave some blank columns in
case we want to have some more “full length” columns
created. I like to have the worksheet organized so
that the full length columns are not interspersed with
the shorter summary statistics columns.
M. A. Sibley Consulting – All Rights Reserved MTB 06 – Advanced Minitab Macros 6

Creating a Table of Statistics –
cont’d
• We now
create a
table of
Basic
Statistics:
M. A. Sibley Consulting – All Rights Reserved MTB 06 – Advanced Minitab Macros 7

Creating a Table of Statistics –
cont’d
• We capture the code from the Minitab session
window:
• And then we “pretty it up”:
• We paste it back into Minitab’s command line editor
window (accessed via Ctrl/L) and execute the
revised commands.M. A. Sibley Consulting – All Rights Reserved MTB 06 – Advanced Minitab Macros 8

Creating a Table of Statistics –
cont’d
• Using techniques from Module 2, we
create a customized graph for one of
the generating stations.
M. A. Sibley Consulting – All Rights Reserved MTB 06 – Advanced Minitab Macros 9

Creating a Table of Statistics –
cont’d
Additional
customizations:
• Change Y
Axis Title
• Removed X
axis title
• Added:
– Sub title
– Reference
line
– Grid lines
• Changed title
M. A. Sibley Consulting – All Rights Reserved MTB 06 – Advanced Minitab Macros 10

Creating a Table of Statistics –
cont’d
• While the graph
has focus, we
capture the code
to generate the
graph (Editor > Copy
Command Language)
and paste it into
the macro:
M. A. Sibley Consulting – All Rights Reserved MTB 06 – Advanced Minitab Macros 11

Creating a Table of Statistics –
cont’d
The next
steps here
are
programming
– not just
capturing
commands
from the
command
window!
M. A. Sibley Consulting – All Rights Reserved MTB 06 – Advanced Minitab Macros 12
K10 is the number of rows in the table of summary statistics – i.e. how many generating stations there are.
Minitab has a limitation on how long strings can be (80 characters) so I use 3 successive change directory commands to move to the folder that will store the JPEG’s generated by the graphing routine.

Creating a Table of Statistics –
cont’d
M. A. Sibley Consulting – All Rights Reserved MTB 06 – Advanced Minitab Macros 13
We use a DO loop to create a graph for each station – i.e. each station listed in the table of statistics.
Adding the suffix of [k11] is Minitab’s way of accessing a single row of a column – in this case the k11th
column.
The constant k12 will contain the name of the generating station.
We want plot roughly the last 2 months of data so we add this clause to the Where statement.
This clause will select one
generating station

Creating a Table of Statistics –
cont’d
M. A. Sibley Consulting – All Rights Reserved MTB 06 – Advanced Minitab Macros 14
The concatenate function allows us to create a text string constant that we can use as a title for the graph.
The now() function returns the current date time value in internal (numeric) format.
The date session command converts the number into a date/time value using the specified format.
The text command changes the date/time value to the
corresponding text string. This will allow it to become part of a text
string used as a sub-title. The next line creates the string from static text plus this just created value. The erase command gets rid of
data in the column.
Creating a Table of Statistics –
cont’d
M. A. Sibley Consulting – All Rights Reserved MTB 06 – Advanced Minitab Macros 15
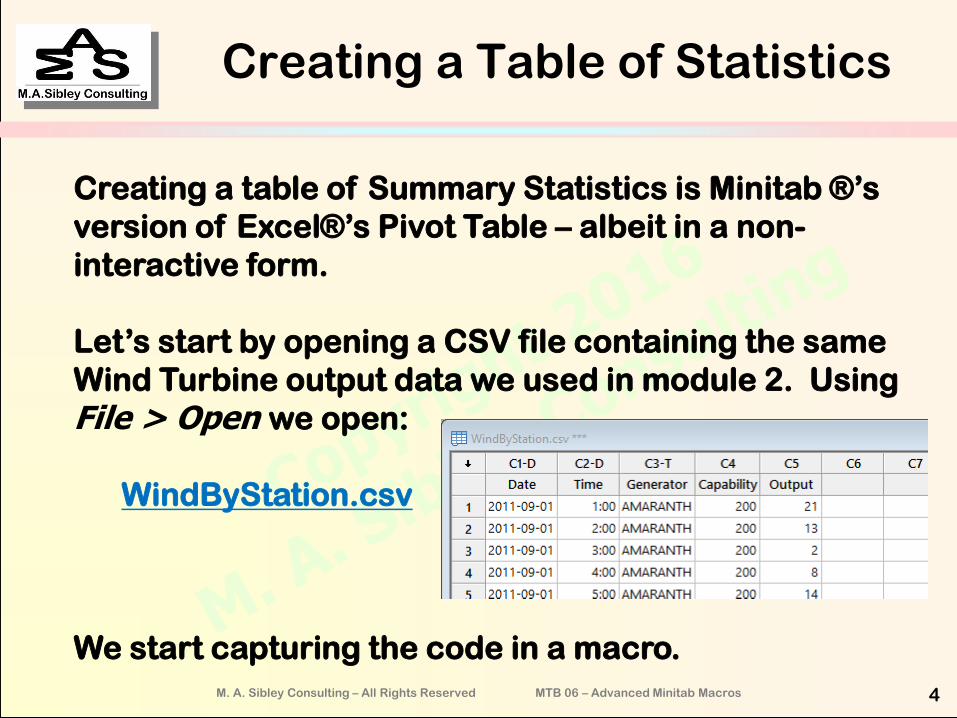
We store the average output for the station (all rows) in constant k17
We further customize the code for the Plot command by changing the Where command to use the previously created constant.
We use the previously created constant to create the title which includes the name of the station.
We change the reference command to use the value for the “current” station.
We use the previously created constant to create the sub-title which includes the last updated date/time.
We change the NoXFootnote line to end with a semi-colon and then add the sub-commands to We end the DO loop
and the Macro

Creating a Table of Statistics –
cont’d
After the
Macro
runs, we
have
created
a JPEG
graph
for each
station:
M. A. Sibley Consulting – All Rights Reserved MTB 06 – Advanced Minitab Macros 16
If the data file were to get updated (say automatically) re-running the macro would overwrite the graphs ,
creating an updated graph.

Creating a Table of Statistics –
cont’d
We can extend this macro further to:
– Add additional information to the table of statistics
– i.e. things that are not available with Calc >
Calculator.
– Create a text report saved in plain text and HTML
format
M. A. Sibley Consulting – All Rights Reserved MTB 06 – Advanced Minitab Macros 17

M. A. Sibley Consulting – All Rights Reserved MTB 06 – Advanced Minitab Macros 18
Control Charts with
“Dynamic” Stages

Control Chart Stages
This question posted to my blog looked like a
“teachable moment” so here goes…
My other question is for control charts and creating a stage gate. I know how to hard
code these values in but because I’m only working with a certain time frame, dates can
cause the code to stop running when they are no longer part of the dataset. Is there a
way to run through a date range, see if it is in the dataset, then use that date, if not
move on? I can’t seem to find a good way to make the code ‘move on’ from errors.
Here is the code I’m working with:
XbarChart 'OffsetCalc' 'Min Result Date';
Stamp 'Min Result Date';
Title “X-bar Chart for Offset”;
SubTitle “Splitter 2392”;
Include;
Where &
“'SPLITTER_EQ' =””2392” And 'Min Result Date' > TODAY() – ELAPSED(30)”;
HProcess 'Min Result Date';
Values “2/24/16” “3/6/2016” “3/13/2016”.
M. A. Sibley Consulting – All Rights Reserved MTB 06 – Advanced Minitab Macros 19

Approach
• I created
some
sample data
and saved
them in
excel files:
M. A. Sibley Consulting – All Rights Reserved MTB 06 – Advanced Minitab Macros 20
Hidden rows

Macro to Create Control Chart
This macro has some basic steps:
– Data for the control chart is read into MTB
– Data from the excel file with stage dates is read
into Minitab
– The “out of range” stage dates are set to missing
– A new column of stage dates with no missing
values is created
– The control chart is created
Note: The case of no “in range” stage dates is
handled because if you ask for stage dates that
are out of range, the macro stops with an error –
the original problem!M. A. Sibley Consulting – All Rights Reserved MTB 06 – Advanced Minitab Macros 21

The macro
M. A. Sibley Consulting – All Rights Reserved MTB 06 – Advanced Minitab Macros 22
My fancy plain text editor
(EditPad Pro) highlights the text in various
colours for readability. Much nicer
than Notepad!
See discussion next slide about this code!

Aside: Limitations of
Excel ODBC driver• It would be helpful to read in the last N days of data by adding
an appropriate where clause to the excel ODBC command.
I’ve not found the right syntax to do this. Can anyone help?
• For instance this works:ODBC;
Connect "DSN=Excel Files;DBQ=C:\Users\marka\OneDrive\Documents\MASibley Con" &
"sulting\Web Site\Control chart stages\MyControlChartData.xlsx;DefaultDir=C" &
":\Users\marka\OneDrive\Documents\MASibley Consulting\Web Site\Control char" &
"t stages;DriverId=1046;MaxBufferSize=2048;PageTimeout=5;";
SQLString "SELECT `MyDate`,`MyVar` FROM `Sheet1$` where `MyDate`<{fn CURDA" &
"TE}".
• But this does not:ODBC;
Connect "DSN=Excel Files;DBQ=C:\Users\marka\OneDrive\Documents\MASibley Con" &
"sulting\Web Site\Control chart stages\MyControlChartData.xlsx;DefaultDir=C" &
":\Users\marka\OneDrive\Documents\MASibley Consulting\Web Site\Control char" &
"t stages;DriverId=1046;MaxBufferSize=2048;PageTimeout=5;";
SQLString "SELECT `MyDate`,`MyVar` FROM `Sheet1$` where `MyDate`>{fn CURDA" &
"TE}-99".
M. A. Sibley Consulting – All Rights Reserved MTB 06 – Advanced Minitab Macros 23
The macro – cont’d
M. A. Sibley Consulting – All Rights Reserved MTB 06 – Advanced Minitab Macros 24
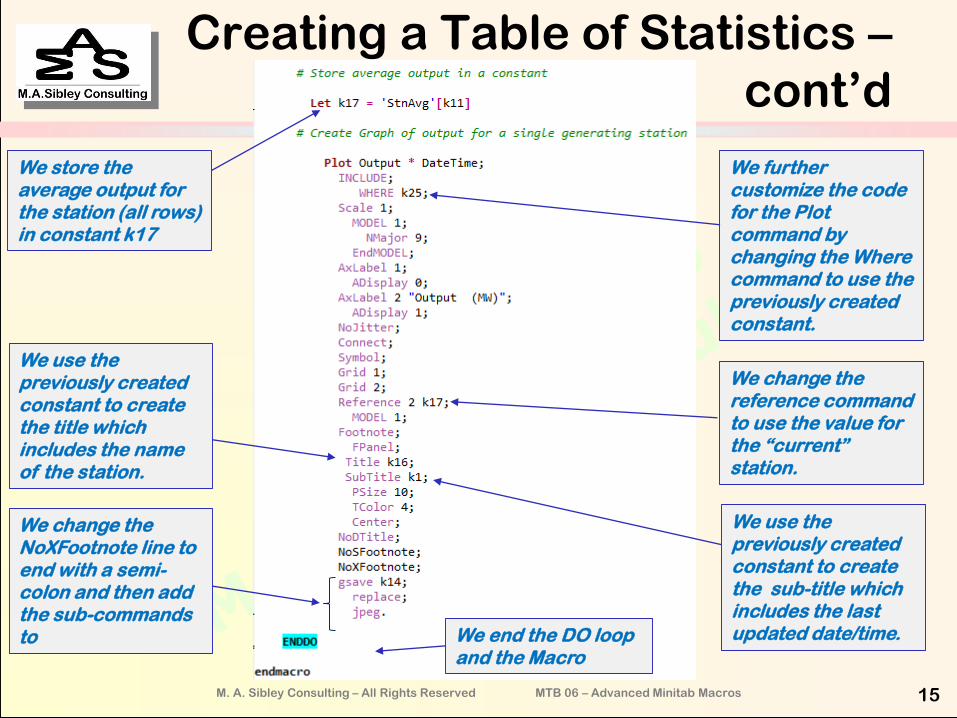
ODBC Command to read in the MyStageDates column from the Excel
file: Stages.xlsx
This code handles the case where all dates in the Stages.xlsx file are
not in range for inclusion in the control
chart. The sum of dates will be greater
than zero if any of the dates is non missing.

The macro – cont’d
M. A. Sibley Consulting – All Rights Reserved MTB 06 – Advanced Minitab Macros 25
This code sorts the out of range dates which have been set to missing to the bottom rows of the column. It then uses a DO loop to copy only non-missing rows into a new variable. It then formats the column back to date time and erases the original – no longer needed – column.
Note: The [k11] subscript is Minitab’s way of allowing you to reference a single cell in the column.

The macro – cont’d
M. A. Sibley Consulting – All Rights Reserved MTB 06 – Advanced Minitab Macros 26
We are only including “in range” dates.
We use the “in range” stage dates column to define the stages for the control chart.
If the remaining portion of the first stage of the graph is short, its label can partially obscure the label for the next stage. This code is what results if you interactively delete this first label.
The code to save the graph as a JPEG file.

The macro – cont’d
M. A. Sibley Consulting – All Rights Reserved MTB 06 – Advanced Minitab Macros 27
This remaining code is for the case where no stage dates are “in range” and so we make sure to comment out the stages related commands so they don’t generate errors and stop the macro.

The resulting Control Chart
M. A. Sibley Consulting – All Rights Reserved MTB 06 – Advanced Minitab Macros 28
Recommended