Exp Brain Res (1996) 111:271-282
Benoit G. Bardy . William H. Warren Jr. Bruce A. Kay
© Springer-Verlag 1996
Motion parallax is used to control postural sway during walking
Received: 18 September 1995/ Accepted: 29 April 1996
Abstract Three experiments tested the hypothesis that postural sway during locomotion is visually regulated by motion parallax as well as optical expansion. Oscillating displays of three-dimensional scenes were presented to participants walking on a treadmill, while postural sway was recorded. Displays simulated: (a) a cloud, in which parallax and expansion are congruent, (b) a hallway, (c) the side walls of the hallway, (d) a ground surface, (e) a wall, (f) the wall with a central hole, (g) a hall farther from the observer, and (h) a wall farther from the observer. In contrast to previous results with a hallway, responses with the cloud were isotropic and directionally specific. The other displays demonstrated that motion parallax was more effective than simple horizontal flow in eliciting lateral sway. These results are consistent with the hypothesis that adaptive control of sway during walking is based on congruent expansion and parallax in natural environments.
Key words Balance· Locomotion· Motion parallax· Postural control and sway· Vision· Human
Introduction
To maintain balance during locomotion, humans and other animals must make functionally specific postural adjustments, that is, of a direction, amplitude, and type appropriate to the postural disturbance. Optic flow at the eye of a swaying observer contains information that specifies these aspects of the required adjustments. Whereas research has demonstrated a visual contribution
B. G. Bardy (~) UMR Mouvement & Perception, Faculty of Sport Sciences, Box 910, University of the Mediterranean, 163 Avenue de Luminy, F-13009 Marseille, France; Fax: +33 91 172252, e-mail: [email protected]
W. H. Warren Jr . B. A. Kay Department of Cognitive and Linguistic Sciences, Box 1978, Brown University, Providence, RI 02912, USA; e-mail: [email protected]
to the control of standing posture (Berthoz et al. 1979; Lee and Lishman 1975; Lestienne et al. 1977; Stoffregen 1985; Van Asten et al. 1988a,b), there has been little work on the functional specificity of postural responses during stance or locomotion. Warren et al. (1996) proposed that two optical variables are used in postural control: optical expansion and differential motion due to parallax. In this article, we test the hypothesis that motion parallax is used to control postural sway. By presenting displays of an oscillating scene to an observer walking on a treadmill, we provide evidence that congruent parallax and expansion result in directionally specific postural sway, and that parallax yields greater sway than simple horizontal flow.
Visual information for postural control
Gibson (1950) observed that movement of an observer in a stationary environment generates an optic flow field, with a focus of radial expansion in the direction of selfmotion that grades into lamellar (i.e., parallel) flow in the perpendicular direction (Fig. 1 a; see Warren 1995 for a review). Research on standing posture typically assumes that the visual system uses optic flow to stabilize the head with respect to the visual surround (Dijkstra et al. 1994; Lee and Lishman 1975; Paulus et al. 1989; Schoner 1991; Stoffregen 1985; Van Asten et al. 1988a). When looking in the direction of sway, posture is thought to be controlled by radial expansion/contraction, and when looking in the orthogonal direction, by the simple horizontal flow. Under open-loop I conditions, information about the distance of the surface is necessary to scale the amplitude of sway to the magnitude of optic flow. However, under closed-loop conditions, the optic flow could be scaled by active sway, and response amplitude has been found to be independent of distance even
I Open-loop refers to conditions in which the observer's head movements have no influence on the display. Closed-loop refers to the case in which head movements feed back to update the display.
272
a
b
, -' , , , ,
, ,
o· ~
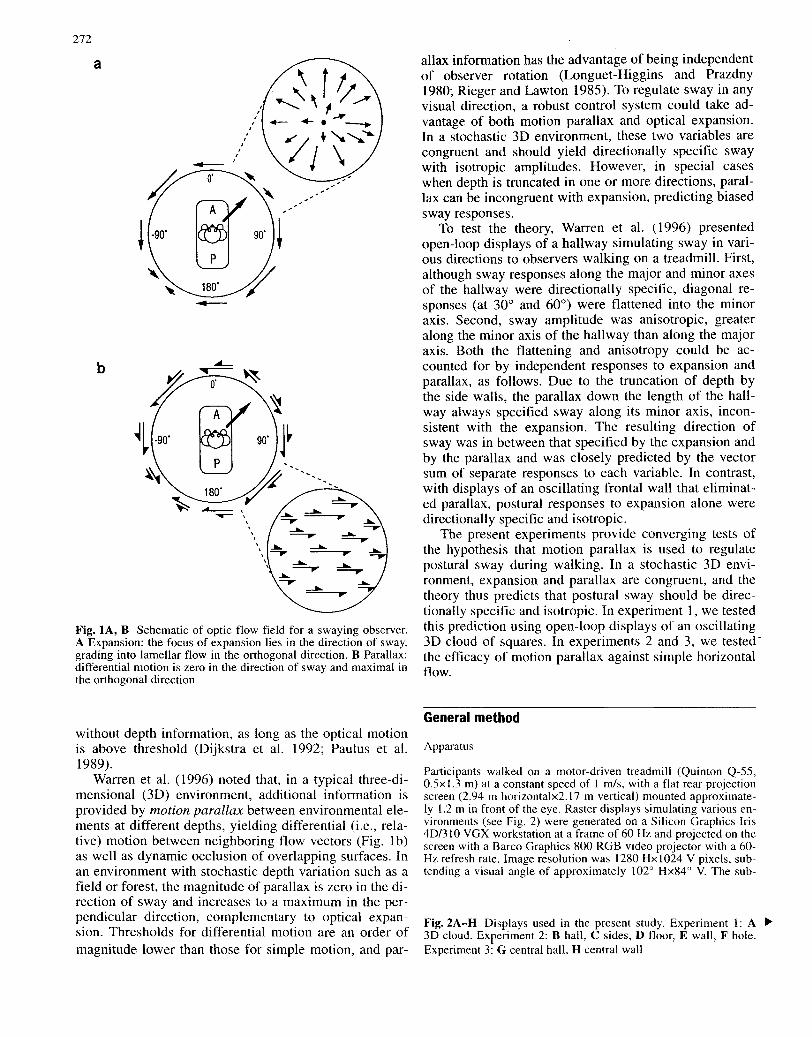
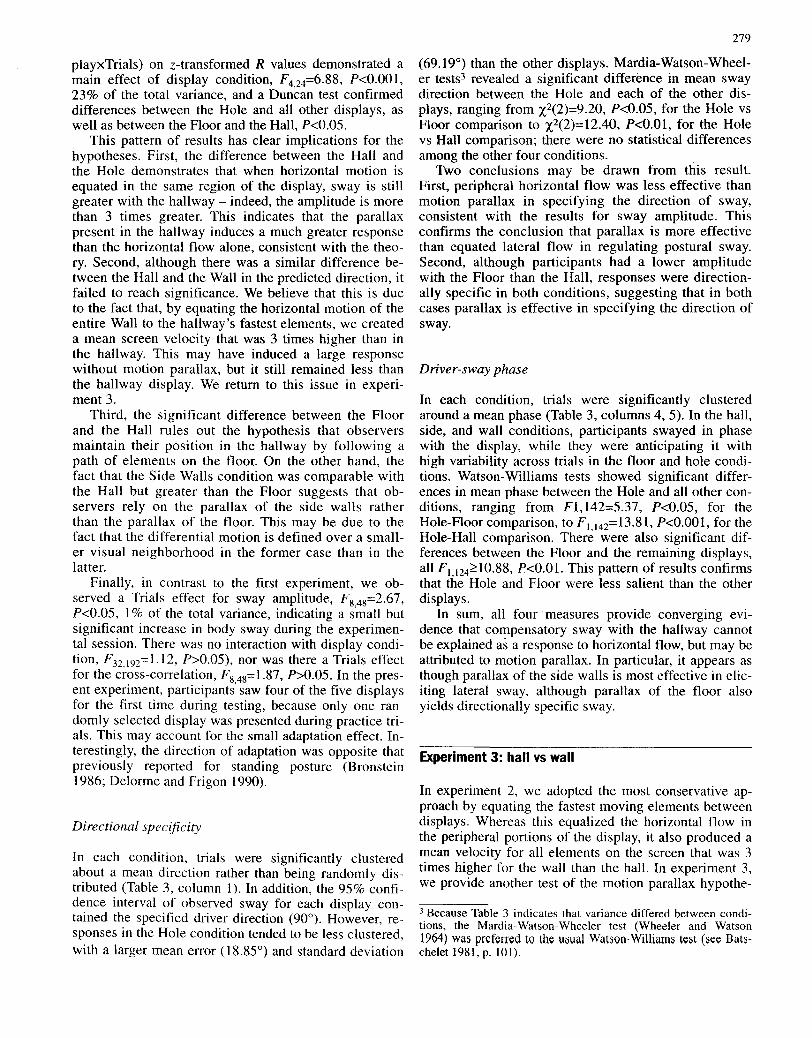
Fig. lA, B Schematic of optic flow field for a swaying observer. A Expansion: the focus of expansion lies in the direction of sway, grading into lamellar flow in the orthogonal direction. B Parallax: differential motion is zero in the direction of sway and maximal in the orthogonal direction
without depth information, as long as the optical motion is above threshold (Dijkstra et al. 1992; Paulus et al. 1989).
Warren et al. (1996) noted that, in a typical three-dimensiona� (3D) environment, additional information is provided by motion parallax between environmental elements at different depths, yielding differential (i.e., relative) motion between neighboring flow vectors (Fig. I b) as well as dynamic occlusion of overlapping surfaces. In an environment with stochastic depth variation such as a field or forest, the magnitude of parallax is zero in the direction of sway and increases to a maximum in the perpendicular direction, complementary to optical expansion. Thresholds for differential motion are an order of magnitude lower than those for simple motion, and par-
allax information has the advantage of being independent of observer rotation (Longuet-Higgins and Prazdny 1980; Rieger and Lawton 1985). To regulate sway in any visual direction, a robust control system could take advantage of both motion parallax and optical expansion. In a stochastic 3D environment, these two variables are congruent and should yield directionally specific sway with isotropic amplitudes. However, in special cases when depth is truncated in one or more directions, parallax can be incongruent with expansion, predicting biased sway responses.
To test the theory, Warren et al. (1996) presented open-loop displays of a hallway simulating sway in various directions to observers walking on a treadmill. First, although sway responses along the major and minor axes of the hallway were directionally specific, diagonal responses (at 30° and 60°) were flattened into the minor axis. Second, sway amplitude was anisotropic, greater along the minor axis of the hallway than along the major axis. Both the flattening and anisotropy could be accounted for by independent responses to expansion and parallax, as follows. Due to the truncation of depth by the side walls, the parallax down the length of the hallway always specified sway along its minor axis, inconsistent with the expansion. The resulting direction of sway was in between that specified by the expansion and by the parallax and was closely predicted by the vector sum of separate responses to each variable. In contrast, with displays of an oscillating frontal wall that eliminated parallax, postural responses to expansion alone were directionally specific and isotropic.
The present experiments provide converging tests of the hypothesis that motion parallax is used to regulate postural sway during walking. In a stochastic 3D environment, expansion and parallax are congruent, and the theory thus predicts that postural sway should be directionally specific and isotropic. In experiment 1, we tested this prediction using open-loop displays of an oscillating 3D cloud of squares. In experiments 2 and 3, we tested· the efficacy of motion parallax against simple horizontal flow.
General method
Apparatus
Participants walked on a motor-driven treadmill (Quinton Q-55, 0.5x 1.3 m) at a constant speed of I mis, with a flat rear projection screen (2.94 m horizontalx2.17 m vertical) mounted approximately 1.2 m in front of the eye. Raster displays simulating various environments (see Fig. 2) were generated on a Silicon Graphics Iris 40/310 VGX workstation at a frame of 60 Hz and projected on the screen with a Barco Graphics 800 RGB video projector with a 60-Hz refresh rate. Image resolution was 1280 Hxl024 V pixels, subtending a visual angle of approximately 102° Hx84 ° V. The sub-
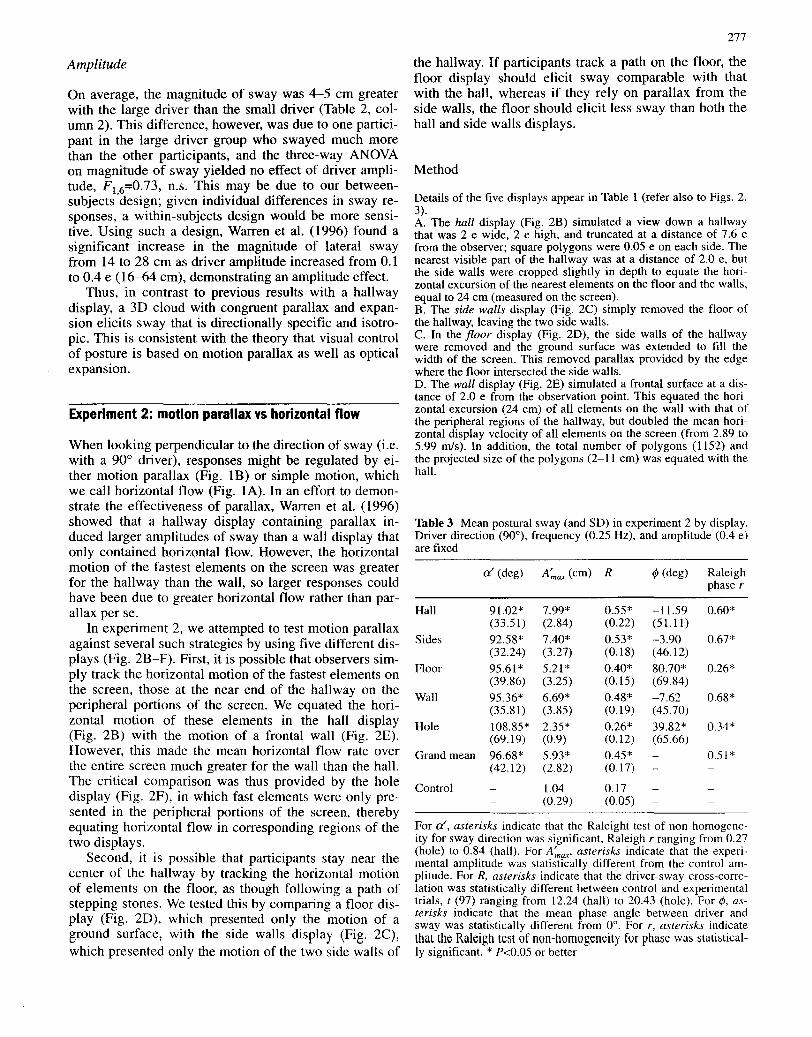
Fig. 2A-H Displays used in the present study. Experiment 1: A ~ 3D cloud. Experiment 2: B hall, C sides, D floor, E wall, F hole. Experiment 3: G central hall, H central wall

273

274
ject's field of view was restricted to the screen by .a head-m?unted sport mask, which occluded the edges of the display. Displays were geometrically correct for an observation point 1.2 m from the screen. In each experiment, a sinusoidal motion simulated translation of the eye in the horizontal plane at 0.25 Hz (the "visual driver").
Procedure
Subjects were instructed to "go with the flow," staying oriented to the depicted scene without consciously trying to anticipate the oscillatory motion.2 They fixated the middle of the screen and kept the mask positioned so that they could not see the screen edges. A familiarization period included 5 min of practice walking with the room lights on and no display, followed by 5 min of practice walking with a static display of the simulated scene, and 5 min of practice with an oscillating display.
Data acquisition and analysis
Motion of a neck marker was measured to determine the direction and amplitude of body sway. Postural adjustments have been examined in more detail by W.H. Warren, B.A. Kay, A. Hutchinson, (unpublished work), but for present purposes a single marker was sufficient to determine the direction and amplitude of the visually evoked sway response. Marker position was recorded in three dimensions with a two-camera ELITE infrared motion analysis system (Ferrigno and Pedotti 1985), at a sampling rate of 100 Hz. The two cameras were placed on the participant's left side, and measurements were accurate to 1 mm in the saggital plane and 2 mm in the lateral direction. One 1.5-cm passive reflecting marker was mounted on the left side of the subject's neck in a location that minimized motion due to the neck flexion and extension. Data samples for each trial were 40 s in duration in experiment I and 30 s in experiments 2 and 3. A sample was initiated by a signal from the Iris at the onset of a display oscillation cycle, so that the relative phase between the display and postural sway could be measured.
The general method for analyzing these data has been extensively described in Warren et al. (1996), to which the reader is referred for details. For each trial, body sway was cross-correlated with the display by fitting the time series of marker motion in the horizontal plane with a cosine function at the frequency of the visual driver:
x = A'cos(2nJr+ I/Jl (I)
where f is the driver frequency (0.25 Hz), A' the sway amplitude (centimeters), and ¢ the phase of sway relative to the display (degrees). Because sway could occur in any direction, this cross-correlation was computed at 2° intervals from -88° to +90° in the horizontal plane and the direction with the maximal amplitude a' was determined. The resulting multiple R value provided an estimate of the strength of the coupling between the driver and sway. Because R was a correlation coefficient, z-transformed R values were used in computing standard statistical tests.
Dependent variables in all experiments were (I) the direction a' having the maximal amplitude of sway, (2) the peak-to-peak amplitude A'max of sway in that direction, (3) the cross-correlation between the driver and sway in that direction (multiple R), and (4) the phase angle ¢ between driver and sway. Because sway direction and phase are circular (360°) variables, axial circular statistics (modulo 180°) were used for computing direction means, while full circular statistics (modulo 360°) were used for computing phase means, and circular correlations were used to assess the
2 Note that our interest was not in whether postural sway could be spontaneously induced by visual stimulation, but in whether the visual system could use certain information to regulate sway. Although it may be possible to anticipate sinusoidal displays, they were held constant across conditions, and unpublished work in our laboratory has found similar postural responses with upredictable sum-of-sine oscillations.
match between response direction and driver direction (Batschelet 1981). Raleigh tests of nonhomogeneity, with 95% confidence intervals, were used in order to determine whether sway direction and phase were randomly distributed over trials or significantly clustered around a mean value, and Watson-Williams F-tests, the equivalent of a one-factor ANOVA, were used to analyze circular variables.
Experiment 1: 3D cloud
In the first experiment, we tested the prediction that a stochastic 3D environment with congruent expansion and parallax would elicit postural sway that was directionally specific and isotropic. To create a scene with comparable depth variation in all visible directions, we simulated a 3D cloud of square polygons (Fig. 2A), which oscillated in three different directions. The constant velocity component associated with forward progression was removed, yielding a cloud that traveled along with the observer, since Warren et al. (1996) had previously found the same anisotropic pattern of responses in the hallway with or without this component.
Method
The cloud consisted of 1152 white squares placed at random positions and orientations on five frontal planes, against a blue background (see Fig. 3 and Table I for details). The simulated distance between the eye point and the nearest surface of the cloud was 2 eye heights (e; 1 e= 1.6 m) and the depth range of the cloud was 3 e, with a depth increment of 0.75 e between each plane. Each square was 0.2 e on a side, and its visual angle depended on the simulated distance to the observer. The motion of the cloud simulated a sinusoidal oscillation of the observation point in the horizontal plane at 1=0.25 Hz. Three directions of oscillation were used (a=O°, 30°, 90°), where 0° corresponded to the participant's anterior-posterior (AP) axis (i.e., perpendicular to the screen) and 90° to the lateral axis (i.e., parallel to the screen). Four subjects were tested with a peak-to-peak amplitude of A=0.2 e (32 cm), and four subjects with A=OA e (64 cm).
Eight subjects, aged 20 to 30 years, were paid to participate in the experiment, including seven graduate students and the first author, who was the only one informed about the aim of the study. There were six trials for each driver direction, as well as six control trials with a static cloud display, for a total of 24 trials. On each trial, the display was presented for 20 s to allow the participant to achieve a steady-state, followed by a 40-s data sample. Trials were presented in a randomized order and counterbalanced over participants, in a 1 h session.
Results
Our main interest was to determine the degree to which body sway was driven by the oscillatory display. Three sample trials appear in Fig. 4A, showing lateral sway on a control trial due to the stride cycle, and on two experimental (0-90°) trials. The discrete fourier transform (OFT) for the three trials appear in Fig. 4B, showing a major peak at the driver frequency of 0.25 Hz for the 90° condition, a minor peak in all trials at the stride frequency around 0.8 Hz, and very little activity above 1.0 Hz. Hence, the driver elicited postural sway, a result that was

>" I
I( DI----i~ \ \ I
\ I
\ I
\ I
z
~ '. 0 I i \1(' x I~I \~7' I
\ \ I I (\8i;
Screen
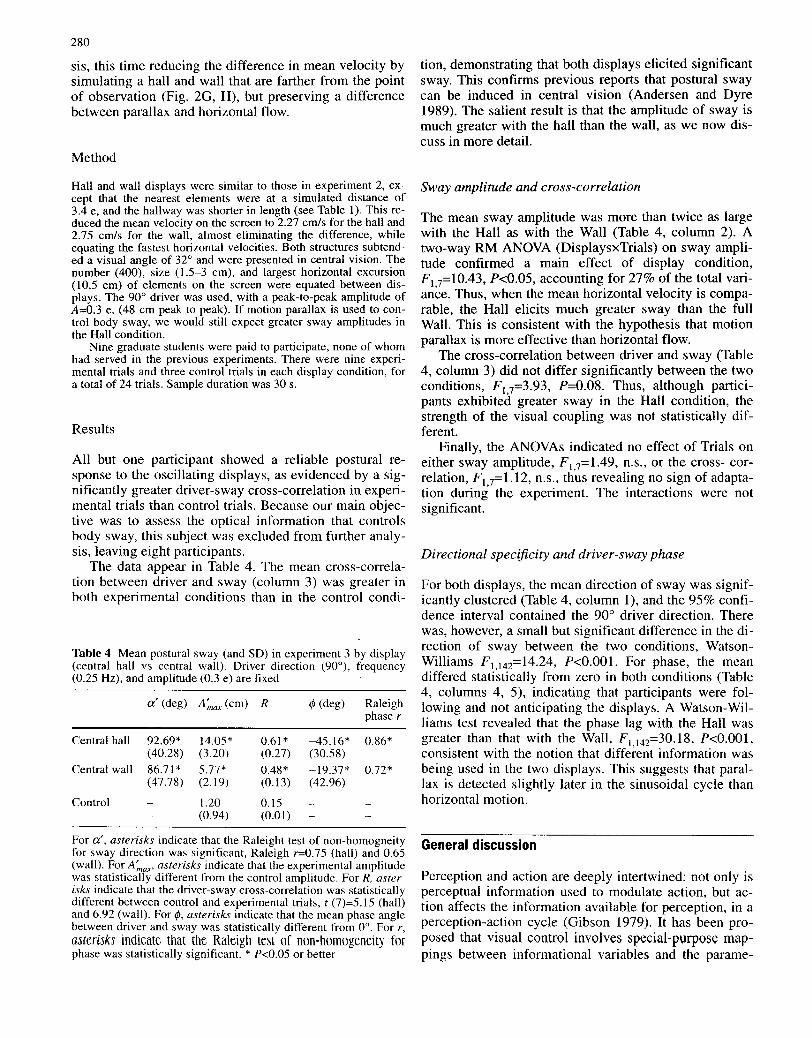
~ Fig. 3 Geometry of display projection for two elements at different distances from the observer. (Z distance from observer to nearest element, D distance from observer to screen, x largest element excursion on the screen, y smallest element excursion on the screen, e visual angle of maximal excursion, y motion parallax)
found in all the participants tested and in all conditions (Table 2, column 3). Thus, we are justified in analyzing the sway responses further.
The mean direction of greatest sway and the mean amplitude in that direction are presented in Fig. 5. Two important points should be noted: first, responses were directionally specific and, second, they were isotropic. We discuss these results in tum.
Directional specificity
The mean direction of sway was nearly identical to the driver direction in each condition (Table 2, column 1); in the critical case, the diagonal (30°) driver yielded mean sway that was only 2.4° from the visually specified direction. For each participant, there was a significant circular correlation between driver and sway direction, with a mean of r=0.97 (P<O.OOOI, n=144). Moreover, responses significantly clustered around the mean direction
driver
:1
~ I Control ~ 0 0
I" 900
\ I ' . ,"" I \.
o
15
E 10 o
-----Q) '0 :J
:t::: 0. E 5 «
... \ " I N \ \ I " \/ \ ~
\r-¥
2
..,.
4 6
Time (s)
Control
00
123
Frequency (Hz)
275
a
8 10
b
Fig. 4A, B Analysis of three typical trials (same subject) from Experiment 1. A Time series of lateral position for a control trial, a 0° trial, and a 90° trial. The driver signal is also represented; driver direction is 90° atf=0.25 Hz and A=O.4eyeheights. B Power spectrum for the same trials, showing one peak at the driver frequency (0.25 Hz) for the 90° trial, and peaks at the stride frequency for all trials (-0.8 Hz)
Table 1 Geometric characteristics of the displays used in experiments I, 2, and 3 (e eyeheight)
Cloud Hall Side Floor Wall Hole Central Central (A=0.4e) hall wall
Height (e) 2.0 2.0 2.0 2.0 2.0 2.0 2.0 Width (e) 2.0 2.0 2.0 15 2.0 2.0 2.0 2.0 Lenght (e) 5.6 5.6 5.6 1.4 Z (e)a 2.0 2.0 2.0 2.0 2.0 2.0 3.4 3.4 Largest excursion x (cm) 24 24 24 24 24 24 10.5 10.5 Smallest excursion y (cm) 9.6 6.3 6.3 6.3 7.0 Maximal elements' size on the screen (cm) 12.0 11.0 11.0 11.0 11.0 11.0 3.0 3.0 Total number of elements 1152 1152 758 1152 1152 40 400 400 Mean velocity on the screen (CIn/S) 3.80 2.89 2.89 2.89 5.99 6.00 2.27 2.75
a Z refers to the distance between the eye point and nearest part of the display, while x and y refers to the maximal and minimal peak-topeak amplitude on the screen (also see Fig. 3 for optical relations between observer and display)

276
\eA=.4e\ o A=.2e A o
180
P
Fig. 5 Polar plot of mean sway amplitude as a function of mean sway direction for the 0°, 30°, 90° drivers in experiment 1. Driver amplitude, 0.2 eyeheights (e) and 0.4 e; driver frequency, 0.25 Hz
of sway, and the 95% confidence interval for observed sway in each condition contained the driver direction. Together, these results confirmed that participants swayed in the direction specified by the driver.
Isotropy
Overall, the amplitude of sway in experimental trials was found to be significantly greater than the amplitude of sway in control trials and was similar in all directions (Table 2, column 2). A three-way ANOVA (Ampli-
tudexDirectionxTrials) with repeated measures (RM) on the last two factors showed no effect of driver direction on the magnitude of sway, F2,12=0.15, n.s. A similar ANOVA on z-transformed R values for the cross-correlation between driver and sway (Table 2, column 3) yielded no effect of direction, F2,12=3.04, n.s. Hence, neither sway amplitude nor the cross-correlation depend on the direction of the driver, consistent with isotropic responses. Finally, neither of the ANOVAs showed an effect of the trials factor on amplitude of sway, F5,30=1.12, n.s., nor on the cross-correlation, F5,30=1.31, n.s. Indeed, no sign of adaptation was observed during the experiment.
Driver-sway phase
The mean phase angle between driver and sway was also similar for the three driver directions (Table 2, column 4) and was found to be significantly clustered around a mean (Table 2, column 5), thus indicating a preferred phase angle. There was no effect of driver direction on mean phase, Watson-Williams tests yielding F2,141=1.13, n.s., in the 0.2 e amplitude condition and F2,141=3.81, n.s., in the 0.4 e amplitude condition, providing converging evidence that responses were isotropic. The mean phase was less than 0° in all conditions, suggesting that observers tended to follow the display oscillation. However, in all but two conditions (high amplitude, 0 and 30°), the 95% confidence interval for observed phase angle contained 0° phase, indicating that sway was not significantly different from in-phase with the driver.
Table 2 Mean postural sway (and SD) in experiment 1 by direction (0°, 30°, 90°) and amplitude (0.2 e vs 0.4 e)
Driver amp. (e) Driver dir. (deg) a' (deg)
0.2 0 -0.09* (11.87)
0.4 3.15* (9.53)
0.2 +30 32.37* (32.05)
0.4 27.11 * (28.75)
0.2 +90 89.56* (14.98)
0.4 91.85* (8.04)
Grand mean
Control
For a', asterisks indicate that the Raleigh test of non-homogeneity for sway direction was significant, Raleigh r=0.98, 0.95, 0.98 for the 0°, 30°, and 90° drivers, respectively. For A:"ax' asterisks indicate that the experimental amplitude was statistically different from the control amplitude. for R, asterisks indicate that the driver-sway cross-correlation was statistically different between con-
A:nax (cm) R </I (deg) Raleigh phase r
10.60* 0.73* -9.22 0.93* (5.71) (0.38) (2LI5) 15.86* 0.77* -11.66* 0.95* (11.40) (0.51) (17.14)
9.32* 0.63* -7.61 0.83* (3.43) (0.27) (33.01 ) 13.02* 0.73* -ILI2* 0.98* (7.63) (0.48) ( 10.49)
9.51 * 0.56* -3.54 0.46* (3.85) (0.27) (58.70) 15.01 * 0.76* -4.13 0.99* (9.35) (0.49) (9.78)
12.22* 0.67* -7.89 0.85* (6.90) (0.32) (50.09)
0.72 0.11 (0.37) (0.06)
trol and experimental trials. For ¢, asterisks indicate that the mean phase angle between driver and sway was statistically different from 0°. For Raleigh phase r, asterisks indicate that the Raleigh test of non-homogeneity for phase was statistically significant. * P ,,0.05 or better
Amplitude
On average, the magnitude of sway was 4-5 cm greater with the large driver than the small driver (Table 2, column 2). This difference, however, was due to one participant in the large driver group who swayed much more than the other participants, and the three-way ANOVA on magnitude of sway yielded no effect of driver amplitude, F I6=0.73, n.s. This may be due to our betweensubjects 'design; given individual differences in sway responses, a within-subjects design would be more sensitive. Using such a design, Warren et al. (1996) found a significant increase in the magnitude of lateral sway from 14 to 28 cm as driver amplitude increased from 0.1 to 0.4 e (16-64 em), demonstrating an amplitude effect.
Thus, in contrast to previous results with a hallway display, a 3D cloud with congruent parallax and expansion elicits sway that is directionally specific and isotropic. This is consistent with the theory that visual control of posture is based on motion parallax as well as optical expansion.
Experiment 2: motion parallax vs horizontal flow
When looking perpendicular to the direction of sway (i.e. with a 90° driver), responses might be regulated by either motion parallax (Fig. IB) or simple motion, which we call horizontal flow (Fig. lA). In an effort to demonstrate the effectiveness of parallax, Warren et al. (1996) showed that a hallway display containing parallax induced larger amplitudes of sway than a wall display that only contained horizontal flow. However, the horizontal motion of the fastest elements on the screen was greater for the hallway than the wall, so larger responses could have been due to greater horizontal flow rather than parallax per se.
In experiment 2, we attempted to test motion parallax against several such strategies by using five different displays (Fig. 2B-F). First, it is possible that observers simply track the horizontal motion of the fastest elements on the screen, those at the near end of the hallway on the peripheral portions of the screen. We equated the horizontal motion of these elements in the hall display (Fig. 2B) with the motion of a frontal wall (Fig. 2E). However, this made the mean horizontal flow rate over the entire screen much greater for the wall than the hall. The critical comparison was thus provided by the hole display (Fig. 2F), in which fast elements were only presented in the peripheral portions of the screen, thereby equating horizontal flow in corresponding regions of the two displays.
Second, it is possible that participants stay near the center of the hallway by tracking the horizontal motion of elements on the floor, as though following a path of stepping stones. We tested this by comparing a floor display (Fig. 2D), which presented only the motion of a ground surface, with the side walls display (Fig. 2C), which presented only the motion of the two side walls of
277
the hallway. If participants track a path on the floor, the floor display should elicit sway comparable with that with the hall, whereas if they rely on parallax from the side walls, the floor should elicit less sway than both the hall and side walls displays.
Method
Details of the five displays appear in Table 1 (refer also to Figs. 2, 3). A. The hall display (Fig. 2B) simulated a view down a hallway that was 2 e wide, 2 e high, and truncated at a distance of 7.6 e from the observer; square polygons were 0.05 e on each side. The nearest visible part of the hallway was at a distance of 2.0 e, but the side walls were cropped slightly in depth to equate the horizontal excursion of the nearest elements on the floor and the walls, equal to 24 cm (measured on the screen). B. The side walls display (Fig. 2C) simply removed the floor of the hallway, leaving the two side walls. C. In the floor display (Fig. 20), the side walls of the hallway were removed and the ground surface was extended to fill the width of the screen. This removed parallax provided by the edge where the floor intersected the side walls. D. The wall display (Fig. 2E) simulated a frontal surface at a distance of 2.0 e from the observation point. This equated the horizontal excursion (24 cm) of all elements on the wall with that of the peripheral regions of the hallway, but doubled the mean horizontal display velocity of all elements on the screen (from 2.89 to 5.99 m1s). In addition, the total number of polygons (1152) and the projected size of the polygons (2-11 cm) was equated with the hall.
Table 3 Mean postural sway (and SO) in experiment 2 by display. Driver direction (90 0
), frequency (0.25 Hz), and amplitude (0.4 e) are fixed
eX (deg) A;"ax (cm) R I/J (deg) Raleigh phase r
Hall 91.02* 7.99* 0.55* -11.59 0.60* (33.51) (2.84) (0.22) (51.11)
Sides 92.58* 7.40* 0.53* -3.90 0.67* (32.24) (3.27) (0.18) (46.12)
Floor 95.61 * 5.21* 0.40* 80.70* 0.26* (39.86) (3.25) (0.15) (69.84)
Wall 95.36* 6.69* 0.48* -7.62 0.68* (35.81) (3.85) (0.19) (45.70)
Hole 108.85* 2.35* 0.26* 39.82* 0.34* (69.19) (0.9) (0.12) (65.66)
Grand mean 96.68* 5.93* 0.45* 0.51* (42.12) (2.82) (0.17)
Control 1.04 0.17 (0.29) (0.05)
For a', asterisks indicate that the Raleight test of non-homogeneity for sway direction was significant, Raleigh r ranging from 0.27 (hole) to 0.84 (hall). For A:.w." asterisks indicate that the experimental amplitude was statistically different from the control amplitude. For R, asterisks indicate that the driver-sway cross-correlation was statistically different between control and experimental trials, t (97) ranging from 12.24 (hall) to 20.43 (hole). For I/J, asterisks indicate that the mean phase angle between driver and sway was statistically different from 0 0
• For r, asterisks indicate that the Raleigh test of non-homogeneity for phase was statistically significant. * P<0.05 or better

278
a~I
~I C 0
+::: 'w 0 a. (ij .... <I> -ro
...J
b 8
E 6 ~ Q) "0
.~ i5. E «
4
2
Driver
Control
Hall
Sides
Wall
Floor
Hole
I
0 2
-_ Hall
Sides
-- Wall
--- Floor
...... Hole
-- Control
4 6 8 10
TIME (s)
S 12
~ 10 >< ~ ~ 8 CIl LI.. 0 6 Ul 0
4 ;:::J E-< :J 2 p. ::;s ~ 0
Control Hall Sides Floor Wall Hole
CONDITIONS
Fig. 7 Mean sway amplitude and standard deviation for each display in experiment 2. Driver amplitude, 0.4 e; driver frequency, 0.25 Hz
formed about the aim of this study. Each subject received nine experimental trials and one control trial in each condition, for a total of 50 trials. Trials were blocked by condition, with condition order counterbalanced across participants. Sample duration was 30 s.
Results
Figure 6 shows one typical trial for each condition in experiment 2. Illustrated is the lateral position over time of the neck marker (Fig. 6A) and the related DFT (Fig. 6B) showing peaks at driver frequency (0.25 Hz) and stride frequency (-0.8 Hz). As illustrated by Fig. 6 and confirmed by Table 3 (columns 2, 3), every participant exhibited reliable postural responses in experimental trials, with significant cross-correlations between driver and sway with all five displays (Table 3, columns 2, 3). We thus proceed with comparisons.
Mean sway amplitude in each condition is presented
0.5 1.5 2 2.5
Frequency (Hz)
3 in Fig. 7, other measures in Table 3. Three points should be noted about the results. First, both the hole and the floor displays induced lower amplitudes of sway than the hall. Second, the direction of sway was less specific for the hole than for any of the other displays. Third, the hole and floor also exhibited larger phase lags than the other displays. We discuss these points in detail.
Fig.6A, B Analysis of six typical trials (same subject) from experiment 2. A Time series of lateral position for a control, hall, sides, wall, floor, and hole trial, respectively. The driver signal is also represented; driver direction is 90° atf=0.25 Hz and A=O.4 e. B Power spectrum for the same trials, showing peaks at driver frequency (0.25 Hz) and stride frequency (-0.8 Hz)
E. Finally, the hole display (Fig. 2F) removed a U8 exl.5 e (33°x410) rectangle from the central part of the wall, leaving a Ushaped frontal surface composed of three strips 0.18 e wide. Horizontal excursion (24 cm), number (40), density (181m2), and projected size (9-11 cm) of polygons on the screen were equated with the corresponding portions of the hall display. The hole thus mimicked the horizontal motion of the nearest part of the hall. All displays traveled with the observer while oscillating along a lateral (90°) axis atf=O.25 Hz, with a peak-to-peak amplitude of A=O.4 e (64 cm).
The first author and seven graduate students at Brown University, aged 19-24 years, were paid to participate. None of the students had participated in the first experiment, nor were they in-
Sway amplitude and cross-correlation
Figure 7 indicates that the lowest sway amplitudes were observed in the Hole and Floor conditions. A two-way RM ANOYA (DisplayxTrials) on amplitude yielded a main effect of display condition, F424=7.19, P<O.OOl, accounting for 24% of the total variance. A post hoc Duncan procedure revealed significant differences between the Hole and all other displays, and between the Floor and the Hall, P<0.05.
The cross-correlation between driver and sway followed the same pattern. A two-way RM ANOYA (Dis-
playxTrials) on z-transformed R values demonstrated a main effect of display condition, F424=6.88, P<O.OOl, 23% of the total variance, and a Duncan test confirmed differences between the Hole and all other displays, as well as between the Floor and the Hall, P<0.05.
This pattern of results has clear implications for the hypotheses. First, the difference between the Hall and the Hole demonstrates that when horizontal motion is equated in the same region of the display, sway is still greater with the hallway - indeed, the amplitude is more than 3 times greater. This indicates that the parallax present in the hallway induces a much greater response than the horizontal flow alone, consistent with the theory. Second, although there was a similar difference between the Hall and the Wall in the predicted direction, it failed to reach significance. We believe that this is due to the fact that, by equating the horizontal motion of the entire Wall to the hallway's fastest elements, we created a mean screen velocity that was 3 times higher than in the hallway. This may have induced a large response without motion parallax, but it still remained less than the hallway display. We return to this issue in experiment 3.
Third, the significant difference between the Floor and the Hall rules out the hypothesis that observers maintain their position in the hallway by following a path of elements on the floor. On the other hand, the fact that the Side Walls condition was comparable with the Hall but greater than the Floor suggests that observers rely on the parallax of the side walls rather than the parallax of the floor. This may be due to the fact that the differential motion is defined over a smaller visual neighborhood in the former case than in the latter.
Finally, in contrast to the first experiment, we observed a Trials effect for sway amplitude, F 848=2.67, P<0.05, 1 % of the total variance, indicating a s'mall but significant increase in body sway during the experimental session. There was no interaction with display condition, F32 192=1.12, P>0.05), nor was there a Trials effect for the cross-correlation, F8.48=1.87, P>0.05. In the present experiment, participants saw four of the five displays for the first time during testing, because only one randomly selected display was presented during practice trials. This may account for the small adaptation effect. Interestingly, the direction of adaptation was opposite that previously reported for standing posture (Bronstein 1986; Delorme and Frigon 1990).
Directional specificity
In each condition, trials were significantly clustered about a mean direction rather than being randomly distributed (Table 3, column 1). In addition, the 95% confidence interval of observed sway for each display contained the specified driver direction (90°). However, responses in the Hole condition tended to be less clustered, with a larger mean error (18.85°) and standard deviation
279
(69.19°) than the other displays. Mardia-Watson-Wheeler tests3 revealed a significant difference in mean sway direction between the Hole and each of the other displays, ranging from X2(2)=9.20, P<0.05, for the Hole vs Floor comparison to X2(2)=12.40, P<O.01, for the Hole vs Hall comparison; there were no statistical differences among the other four conditions.
Two conclusions may be drawn from this result. First, peripheral horizontal flow was less effective than motion parallax in specifying the direction of sway, consistent with the results for sway amplitude. This confirms the conclusion that parallax is more effective than equated lateral flow in regulating postural sway. Second, although participants had a lower amplitude with the Floor than the Hall, responses were directionally specific in both conditions, suggesting that in both cases parallax is effective in specifying the direction of sway.
Driver-sway phase
In each condition, trials were significantly clustered around a mean phase (Table 3, columns 4, 5). In the hall, side, and wall conditions, participants swayed in phase with the display, while they were anticipating it with high variability across trials in the floor and hole conditions. Watson-Williams tests showed significant differences in mean phase between the Hole and all other conditions, ranging from F1,142=5.37, P<0.05, for the Hole-Floor comparison, to FI 142=13.81, P<O.OOl, for the Hole-Hall comparison. There were also significant differences between the Floor and the remaining displays, all FI 1242:10.88, P<O.Ol. This pattern of results confirms that the Hole and Floor were less salient than the other displays.
In sum, all four measures provide converging evidence that compensatory sway with the hallway cannot be explained as a response to horizontal flow, but may be attributed to motion parallax. In particular, it appears as though parallax of the side walls is most effective in eliciting lateral sway, although parallax of the floor also yields directionally specific sway.
Experiment 3: hall YS wall
In experiment 2, we adopted the most conservative approach by equating the fastest moving elements between displays. Whereas this equalized the horizontal flow in the peripheral portions of the display, it also produced a mean velocity for all elements on the screen that was 3 times higher for the wall than the hall. In experiment 3, we provide another test of the motion parallax hypo the-
3 Because Table 3 indicates that variance differed between conditions, the Mardia-Watson-Wheeler test (Wheeler and Watson 1964) was preferred to the usual Watson-Williams test (see Batschelet 1981, p. 101).
280
sis, this time reducing the difference in mean velocity by simulating a hall and wall that are farther from the point of observation (Fig. 2G, H), but preserving a difference between parallax and horizontal flow.
Method
Hall and wall displays were similar to those in experiment 2, except that the nearest elements were at a simulated distance of 3.4 e, and the hallway was shorter in length (see Table I). This reduced the mean velocity on the screen to 2.27 cmls for the hall and 2.75 cmls for the wall, almost eliminating the difference, while equating the fastest horizontal velocities. Both structures subtended a visual angle of 32° and were presented in central vision. The number (400), size (1.5-3 cm), and largest horizontal excursion (10.5 cm) of elements on the screen were equated between displays. The 90° driver was used, with a peak-to-peak amplitude of A=0.3 e. (48 cm peak to peak). If motion parallax is used to control body sway, we would still expect greater sway amplitudes in the Hall condition.
Nine graduate students were paid to participate, none of whom had served in the previous experiments. There were nine experimental trials and three control trials in each display condition, for a total of 24 trials. Sample duration was 30 s.
Results
All but one particIpant showed a reliable postural response to the oscillating displays, as evidenced by a significantly greater driver-sway cross-correlation in experimental trials than control trials. Because our main objective was to assess the optical information that controls body sway, this subject was excluded from further analysis, leaving eight participants.
The data appear in Table 4. The mean cross-correlation between driver and sway (column 3) was greater in both experimental conditions than in the control condi-
Table 4 Mean postural sway (and SD) in experiment 3 by display (central hall vs central wall). Driver direction (90°), frequency (0.25 Hz), and amplitude (0.3 e) are fixed
a' (deg) A;"ax (cm) R ¢ (deg) Raleigh phase r
Central hall 92.69* 14.05* 0.61* -45.16* 0.86* (40.28) (3.20) (0.27) (30.58)
Central wall 86.71 * 5.77* 0.48* -19.37* 0.72* (47.78) (2.19) (0.13) (42.96)
Control 1.20 0.15 (0.94) (0.01)
For a', asterisks indicate that the Raleight test of non-homogneity for sway direction was significant, Raleigh r=0.75 (hall) and 0.65 (wall). For A:.ax, asterisks indicate that the experimental amplitude was statistically different from the control amplitude. For R, asterisks indicate that the driver-sway cross-correlation was statistically different between control and experimental trials, t (7)=5.15 (hall) and 6.92 (wall). For ¢, asterisks indicate that the mean phase angle between driver and sway was statistically different from 0°. For r, asterisks indicate that the Raleigh test of non-homogeneity for phase was statistically significant. * P<0.05 or better
tion, demonstrating that both displays elicited significant sway. This confirms previous reports that postural sway can be induced in central vision (Andersen and Dyre 1989). The salient result is that the amplitude of sway is much greater with the hall than the wall, as we now discuss in more detail.
Sway amplitude and cross-correlation
The mean sway amplitude was more than twice as large with the Hall as with the Wall (Table 4, column 2). A two-way RM ANOVA (DisplaysxTrials) on sway amplitude confirmed a main effect of display condition, F 1,7=1O.43, P<0.05, accounting for 27% of the total variance. Thus, when the mean horizontal velocity is comparable, the Hall elicits much greater sway than the full Wall. This is consistent with the hypothesis that motion parallax is more effective than horizontal flow.
The cross-correlation between driver and sway (Table 4, column 3) did not differ significantly between the two conditions, F I7=3.93, P=0.08. Thus, although participants exhibited greater sway in the Hall condition, the strength of the visual coupling was not statistically different.
Finally, the ANOVAs indicated no effect of Trials on either sway amplitude, FI 7=1.49, n.s., or the cross- correlation, F\,7=1.12, n.s., th'us revealing no sign of adaptation during the experiment. The interactions were not significant.
Directional specificity and driver-sway phase
For both displays, the mean direction of sway was significantly clustered (Table 4, column 1), and the 95% confidence interval contained the 90° driver direction. There was, however, a small but significant difference in the direction of sway between the two conditions, WatsonWilliams F 1,142=14.24, P<O.OO1. For phase, the mean differed statistically from zero in both conditions (Table 4, columns 4, 5), indicating that participants were following and not anticipating the displays. A Watson-Williams test revealed that the phase lag with the Hall was greater than that with the Wall, FI 142=30.18, P<O.OOI, consistent with the notion that different information was being used in the two displays. This suggests that parallax is detected slightly later in the sinusoidal cycle than horizontal motion.
General discussion
Perception and action are deeply intertwined: not only is perceptual information used to modulate action, but action affects the information available for perception, in a perception-action cycle (Gibson 1979). It has been proposed that visual control involves special-purpose mappings between informational variables and the parame-
ters of an action system that is organized for a particular task (Warren 1988). The present experiments were designed to investigate the informational basis for this functional coupling by testing the hypothesis that both motion parallax and optical expansion are used to control postural sway during walking. The results support this hypothesis. In experiment 1, postural responses to an oscillating 3D cloud, in which expansion and parallax are congruent, were shown to be functionally specific. By manipulating the geometry of the visual scene in experiments 2 and 3, we were able to show that motion parallax was more effective than horizontal flow in controlling sway. Let us discuss these results in more depth.
We began with the theory that postural sway is regulated by independent responses to optical expansion and motion parallax. In ordinary 3D scenes with stochastic depth variation, these two variables congruently specify the direction and relative amplitude of postural sway. When this congruency is violated, as in a hallway display, diagonal responses are flattened into the minor axis of the hallway and sway amplitudes are anisotropic (Warren et al. 1996). In contrast, when expansion and parallax are congruent, as with the 3D cloud of experiment 1, we find that AP, diagonal, and lateral responses are all directionally specific and isotropic. This is consistent with the notion that observers use both parallax and expansion to stabilize their posture.
It remains possible, however, that lateral sway is not driven by motion parallax, but by simple horizontal motion. In experiment 2, when we equated the fastest horizontal flow in the peripheral region of the screen, a hall display containing parallax elicited far greater sway than a hole display that did not. In experiment 3, when we also equalized the mean horizontal velocity on the screen by increasing the simulated distance, the hall elicited a sway amplitude more than twice that of a full wall. This confirms that parallax is used to control postural sway and provides more effective information than horizontal flow.
The present data do not reveal how postural sway was produced in detail. Specifically, motion of a single neck marker does not allow us to analyze possible translational and rotational components of the postural response independently. There is no reason, however, to expect that some displays would elicit a larger rotational component than others, for they all presented a laterally translating scene. Moreover, regardless of the precise details of the response, a single marker is sufficient to establish the conclusion that overall sway is driven by motion parallax.
Thus, posture appears to be regulated by independent responses to radial expansion and motion parallax. This is precisely what one might expect from a robust visual control system, on several counts. First, the two variables are complementary, such that the focus of expansion lies in the direction of sway, whereas parallax is greatest in the perpendicular direction. Thus, posture can be adequately stabilized using information in any visual direction. Second, unlike simple horizontal motion, parallax is
281
invariant under rotation. Third, visual thresholds for relative motion are lower than those for simple motion. Finally, the theory applies to the control of both standing posture and posture during locomotion, allowing for a constant velocity component corresponding to forward progression. Indeed, postural responses during walking are similar with and without this constant component (Warren et al. 1996).
Open-loop conditions such as those in the present study simulate only half the perception-action cycle, for movements of the observer do not reciprocally influence the display. This may account for the low gain of postural responses in such experiments. In the present case, because postural responses did not affect the motion parallax at the observer's eye and no distance information was available, the amplitude of sway could not be appropriately scaled to the simulated oscillation. However, recent data suggest that standing posture does not simply behave like a passive linear system driven by optic flow, but that movements are actively generated to match the stimulation (Dijkstra et al. 1994). Under normal closedloop conditions, such active sway will alter the parallax at the eye, allowing the observer to scale the amplitude of sway to the magnitude of parallax. We suggest that parallax may be used to modulate the dynamics of the active component, such that the direction, amplitude, frequency, and phase of sway are matched to the driver, which thereby minimizes the observed parallax. The present results demonstrate that motion parallax provides effective information that is sufficient for controlling postural sway, but further research is required to determine how such information is used under more natural closed-loop conditions.
Acknowledgements Part of this paper was written when the first author held a Georges Lurcy fellowship at Brown University (Providence, RI, USA). Preparation of this article was supported by the French Ministere de l'Education Nationale, de l'Enseignement Superieur et de la Recherche and US National Institutes of Health grant AG05223. .
References
Andersen GI, Dyre BP (1989) Spatial orientation from optical flow in the central visual field. Percept Psychophys 45:453-458
Batschelet E (1981) Circular statistics in biology. Academic, New York
Berthoz A, Lacour M, Soechting IF, Vidal PP (1979) The role of vision in the control of posture during linear motion. Prog Brain Res 50: 197-209
Bronstein AM (1986) Suppression of visually evoked postural responses. Exp Brain Res 63: 655-658
Delorme A, Frigon I-Y (1990) Postural adaptation to visual sinusoidal motion. In: Brandt T, Paulus W, Bles W, Dietrich M, Krafczyk S, Straube A (eds) Disorders of posture and gait Thieme, Stuttgart, pp 261-264
Dijkstra TMH, Gielen CCAM, Melis BIM (1992) Postural responses to stationary and moving scenes as a function of distance to the scene. Hum Mov Sci II: 195-203
Dijkstra TMH, Schoner G, Gielen CCAM (1994) Temporal stability of the action-perception cycle for postural control in a moving visual environment Exp Brain Res 97: 477-486
282
Ferrigno G, Pedotti A (1985) ELITE: a digital dedicated hardware system for movement analysis via real time TV-signal processing. IEEE Trans Biomed Eng 32: 943-950
Gibson JJ (1950) The perception of the visual world. Houghton Mifflin, Boston
Gibson JJ (1979) The ecological approach to visual perception. Houghton Mifflin, Boston
Lee DN, Lishman R (1975) Visual proprioceptive control of stance. J Hum Mov Stud 1: 87-95
Lestienne F, Soechting J, Berthoz A (1977) Postural readjustments induced by linear motion of visual scenes. Exp Brain Res 28: 363-384
Longuet-Higgins HC, Prazdny K (1980) The interpretation of a moving retinal image. Proc R Soc Lond [Bioi] 208: 385-397
Paulus W, Straube A, Krafczyk S, Brandt T (1989) Differential effects of retinal target displacement changing size and changing disparity in the control of anterior/posterior and lateral body sway. Exp Brain Res 78: 243-252
Rieger JH, Lawton DT (1985) Processing differential image motion. J Opt Soc Am [A] 2: 354-360
Schoner G (1991) Dynamic theory of perception-action patterns: the "moving room" paradigm. Bioi Cybern 64: 455-462
Stoffregen TA (1985) Flow structure versus retinal location in the optical control of stance. J Exp Psychol Hum Percept Perform 11: 554-565
Van Asten WNJC, Gielen CCAM, Denier van der Gon JJD (1988a) Postural adjustments induced by simulated motion of differently structured environments. Exp Brain Res 73: 371-383
Van Asten WNJC, Gielen CCAM, Denier van der Gon JJD (1988b) Postural movements induced by rotation of visual scenes. J Opt Soc Am [A] 5: 1781-1789
Warren WH (1988) Action modes and laws of control for the visual guidance of action In: Meijer 0, Roth K (eds) Movement behavior: the motor-action controversy. North Holland, Amsterdam, pp 339-380
Warren WH (1995) Self-motion: visual perception and visual control. In: Epstein W, Rogers SJ (eds) Perception of space and motion. (Handbook of perception and cognition) Academic, Orlando, pp 263-325
Warren WH, Kay BA, Yilmaz EH (1996) Visual control of posture during walking: functional specificity. J Exp Psychol Hum Percept Perform
Wheeler S, Watson GS (1964) A distribution-free two-sample test on a circle. Biometrics 51: 256-257
Recommended