Monitoring Kentucky’s Climate: The Kentucky Mesonet at WKU
Stuart A. Foster
State Climatologist for Kentucky
Kentucky Climate Center
Western Kentucky University
Kentucky Water Resources Board
Frankfort, Kentucky
August 29, 2016
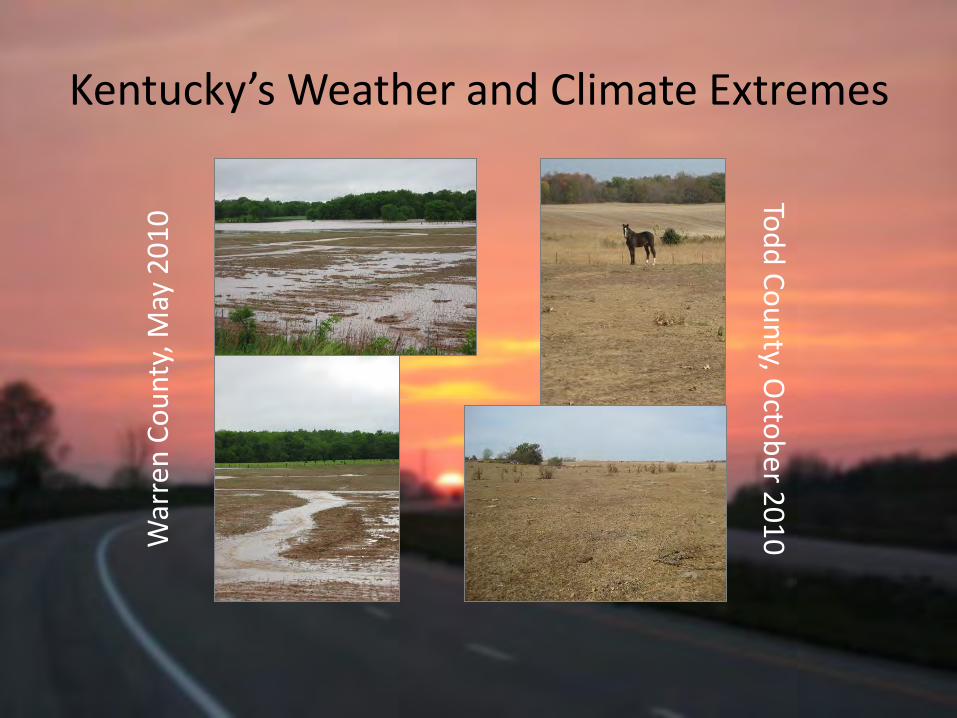
Kentucky’s Weather and Climate Extremes
War
ren
Co
un
ty, M
ay 2
01
0 To
dd
Co
un
ty, Octo
ber 2
01
0
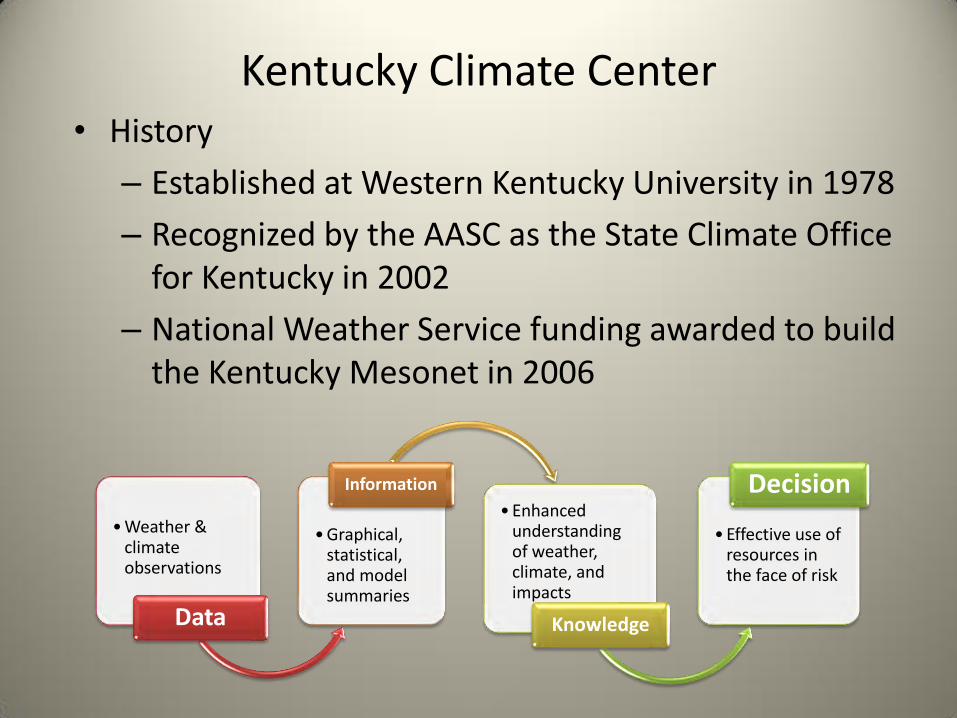
Kentucky Climate Center • History
– Established at Western Kentucky University in 1978
– Recognized by the AASC as the State Climate Office for Kentucky in 2002
– National Weather Service funding awarded to build the Kentucky Mesonet in 2006
• Weather & climate observations
Data
• Graphical, statistical, and model summaries
Information
• Enhanced understanding of weather, climate, and impacts
Knowledge
• Effective use of resources in the face of risk
Decision
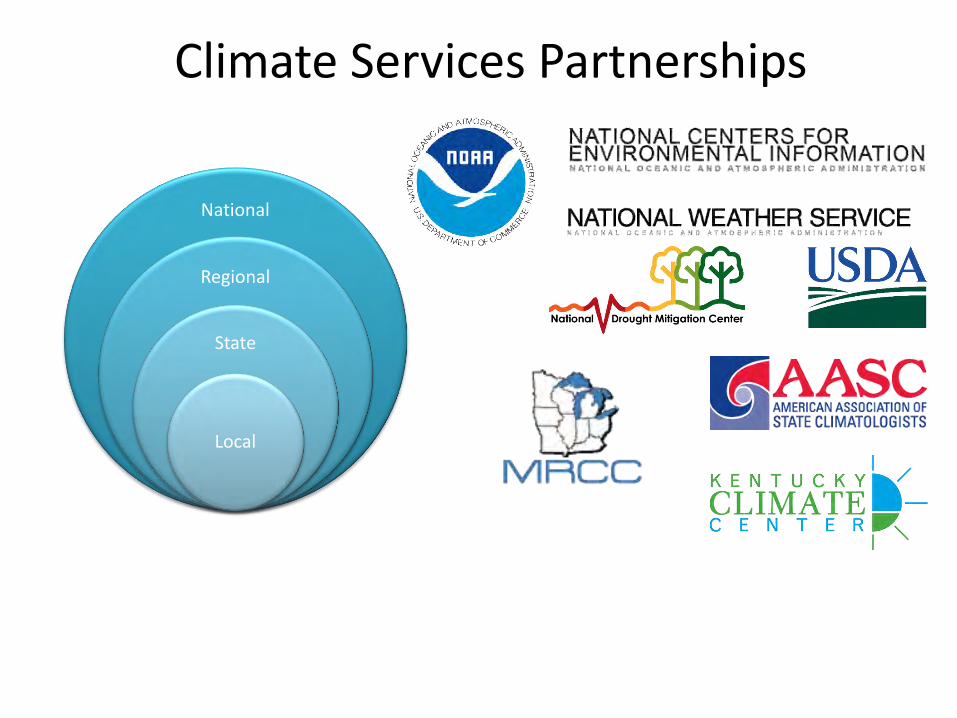
Climate Services Partnerships
National
Regional
State
Local

A Matter of Perspective
http://www.photolib.noaa.gov/htmls/spac0256.htm http://www.ruralimagecoop.org/tag/front-porch-sitting/
Geostationary Earth Observing Platforms
Remote sensing often provides a bird’s-eye view, while people see the world from their front porch.
Talking Points
• Perspectives on Drought
• Kentucky Mesonet at WKU
• Strategic Initiatives
• Questions and Discussion
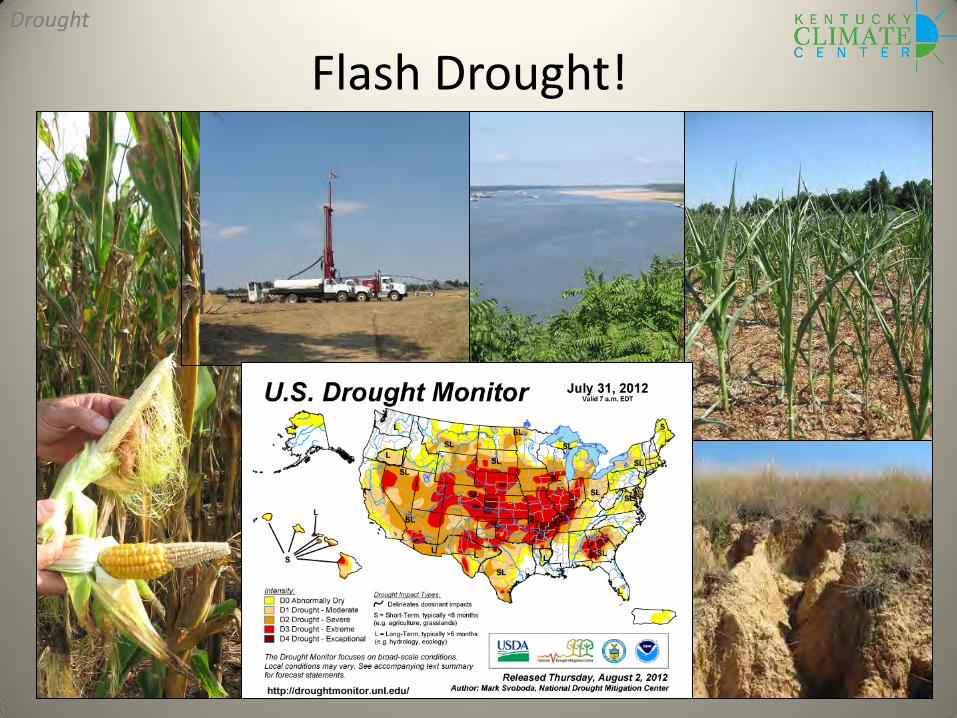
Flash Drought! Drought

August 7, 2012
http://droughtmonitor.unl.edu/MapsAndData/MapArchive.aspx
Continental Evolution of 2012 Drought
Drought
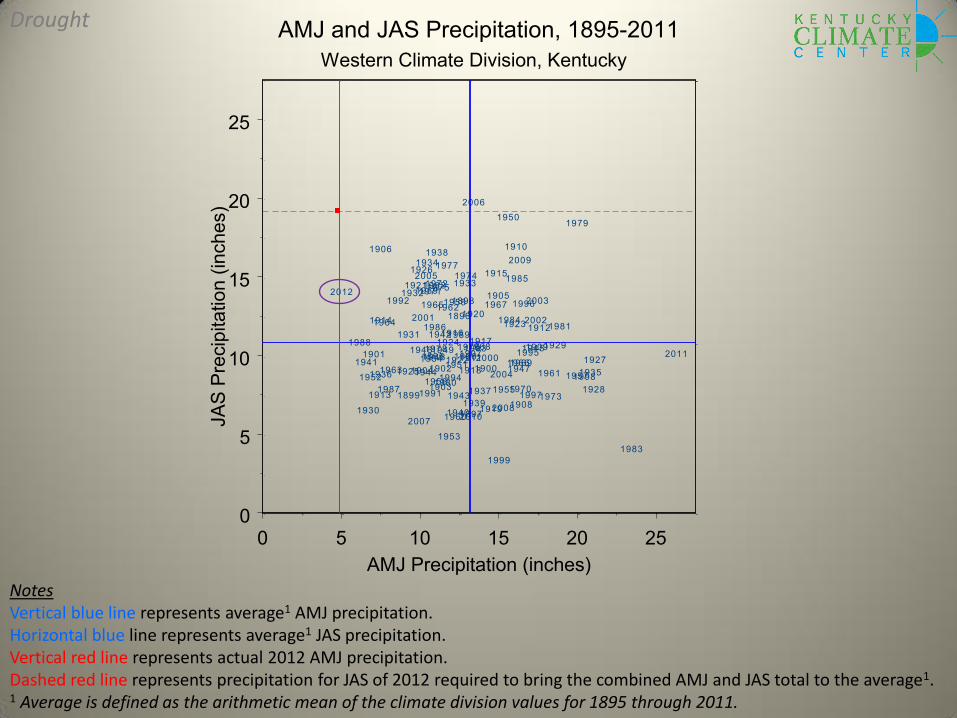
Notes Vertical blue line represents average1 AMJ precipitation. Horizontal blue line represents average1 JAS precipitation. Vertical red line represents actual 2012 AMJ precipitation. Dashed red line represents precipitation for JAS of 2012 required to bring the combined AMJ and JAS total to the average1. 1 Average is defined as the arithmetic mean of the climate division values for 1895 through 2011.
0 5 10 15 20 25AMJ Precipitation (inches)
0
5
10
15
20
25
JAS
Pre
cipi
tatio
n (in
ches
)
2012
2011
2010
2009
20082007
2006
2005
2004
2003
20022001
2000
1999
1998
1997
1996
1995
1994
1993
1992
1991
1990
19891988
1987
1986
1985
1984
1983
1982
1981
1980
1979
1978
1977
1976
19751974
1973
19721971
1970
1969
1968
1967
1966
1965
1964
1963
1962
1961
1960
19591958
195719561955
1954
1953
19521951
1950
19491948
1947
1946 1945
1944
1943
1942
1941
19401939
1938
1937
1936 1935
1934
19331932
1931
1930
1929
1928
1927
1926
1925
1924
1923
1922
1921
1920
1919
1918
19171916
1915
1914
1913
1912
1911
1910
1909
1908
1907
1906
1905
1904
1903
19021901
1900
1899
1898
1897
1896
1895
AMJ and JAS Precipitation, 1895-2011Western Climate Division, Kentucky
Drought
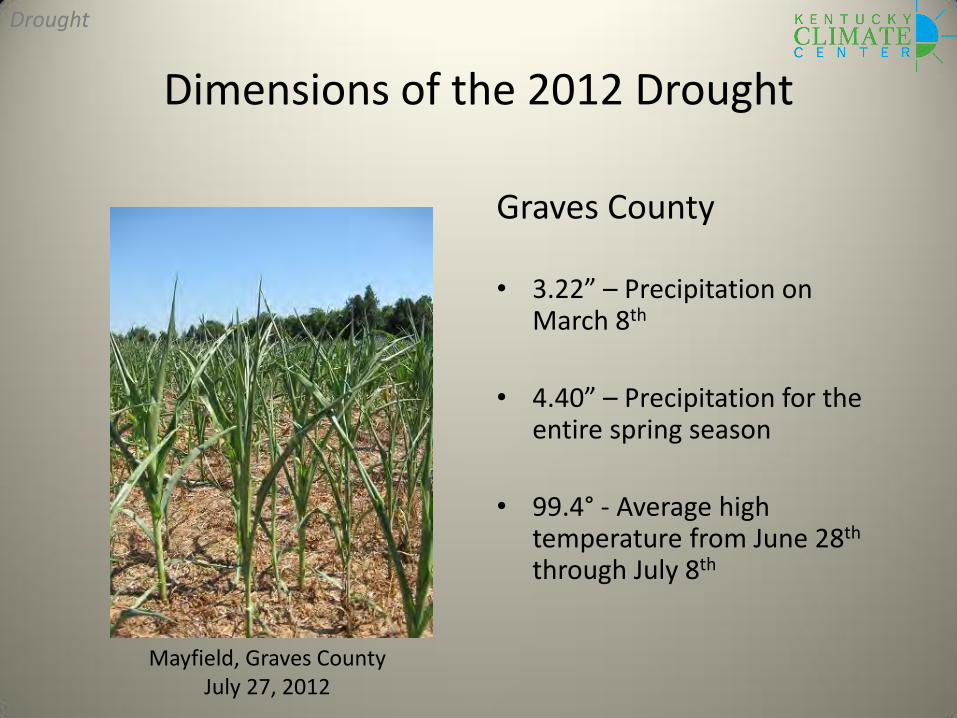
Dimensions of the 2012 Drought
Graves County
• 3.22” – Precipitation on March 8th
• 4.40” – Precipitation for the entire spring season
• 99.4° - Average high temperature from June 28th through July 8th
Mayfield, Graves County July 27, 2012
Drought
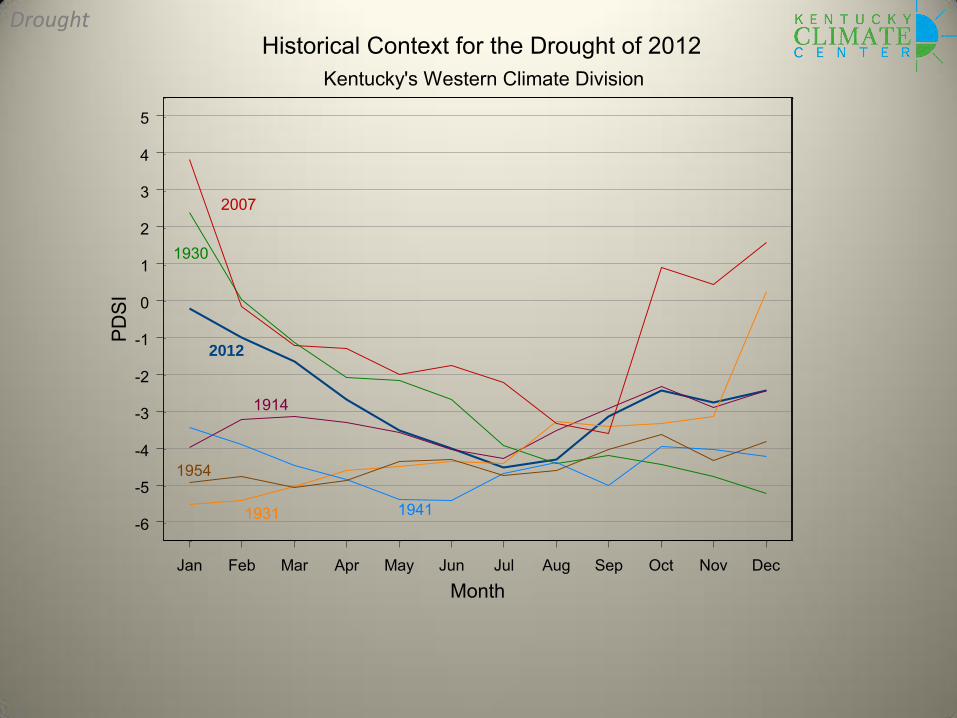
Jan Feb Mar Apr May Jun Jul Aug Sep Oct Nov Dec
Month
-6
-5
-4
-3
-2
-1
0
1
2
3
4
5P
DS
I
Historical Context for the Drought of 2012Kentucky's Western Climate Division
2012
2007
1930
1914
1931 1941
1954
Drought
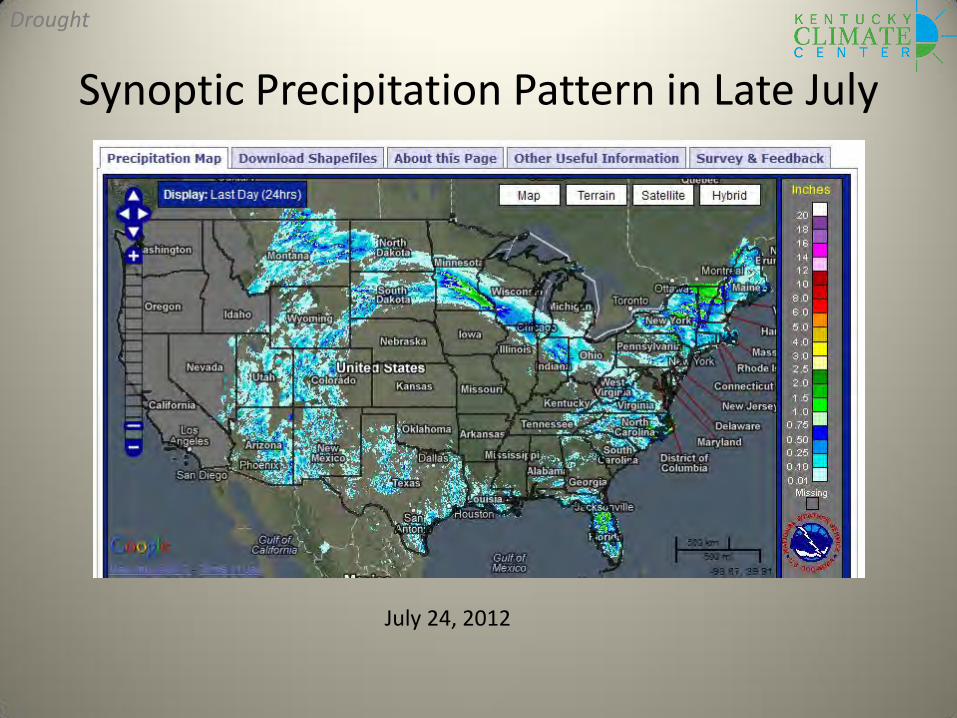
Synoptic Precipitation Pattern in Late July
July 24, 2012
Drought

Evolution of the 2012 Drought in Kentucky
Jan Feb Mar Apr May Jun Jul Aug Sep Oct Nov Dec-28
-24
-20
-16
-12
-8
-4
0
4
8
Cum
ulat
ive P
recip
itatio
n D
epar
ture
(inc
hes)
Day
Kentucky Mesonet Year: 2012Mayfield 6 SW, Graves County
Jan Feb Mar Apr May Jun Jul Aug Sep Oct Nov Dec-28
-24
-20
-16
-12
-8
-4
0
4
8
Cum
ulat
ive P
recip
itatio
n D
epar
ture
(inc
hes)
Day
Kentucky Mesonet Year: 2012Henderson 5 E, Henderson County
Jan Feb Mar Apr May Jun Jul Aug Sep Oct Nov Dec-28
-24
-20
-16
-12
-8
-4
0
4
8
Cum
ulat
ive P
recip
itatio
n D
epar
ture
(inc
hes)
Day
Kentucky Mesonet Year: 2012Winchester 3 NW, Clark County
Jan Feb Mar Apr May Jun Jul Aug Sep Oct Nov Dec-28
-24
-20
-16
-12
-8
-4
0
4
8
Cum
ulat
ive P
recip
itatio
n D
epar
ture
(inc
hes)
Day
Kentucky Mesonet Year: 2012Russellville 2 W, Logan County
Jan Feb Mar Apr May Jun Jul Aug Sep Oct Nov Dec-28
-24
-20
-16
-12
-8
-4
0
4
8
Cum
ulat
ive P
recip
itatio
n D
epar
ture
(inc
hes)
Day
Kentucky Mesonet Year: 2012Columbia 3 N, Adair County
Drought

Dimensions of Drought in Space and Time
• Onset
• Duration
• Peak Intensity
• Extent
2007
2010
2012
Drought
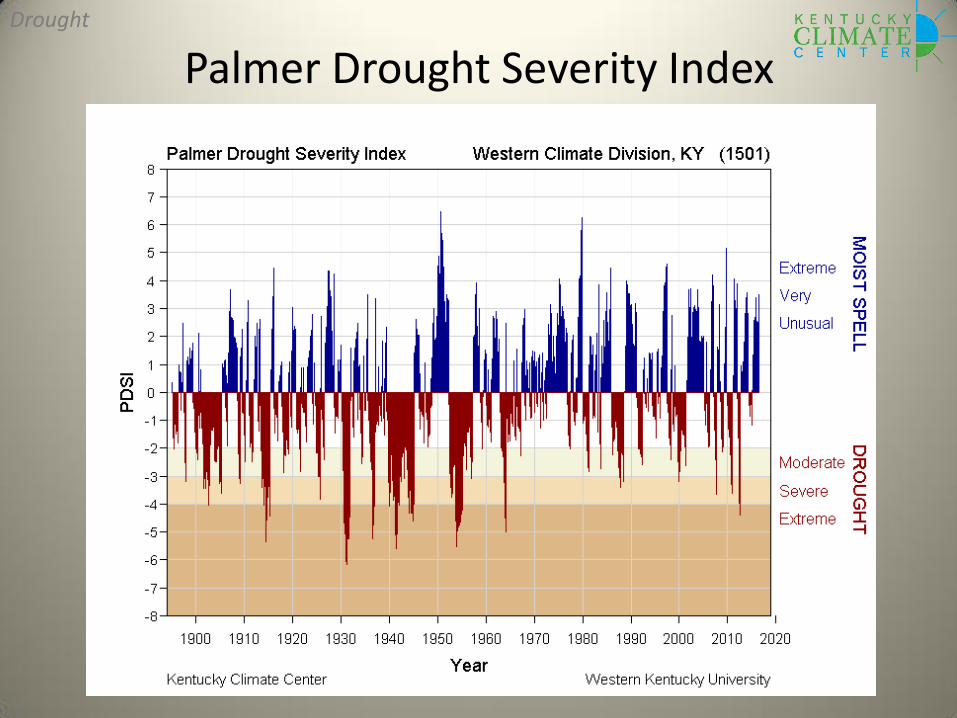
Palmer Drought Severity Index Western Climate Division, KY
Drought

Types of Drought
Sequence of drought occurrence and impacts for commonly accepted drought types. All droughts originate from a deficiency of precipitation or meteorological drought but other types of drought and impacts cascade from this deficiency. (Source: National Drought Mitigation Center, University of Nebraska-Lincoln, U.S.A.) http://drought.unl.edu/DroughtBasics/TypesofDrought.aspx
Drought
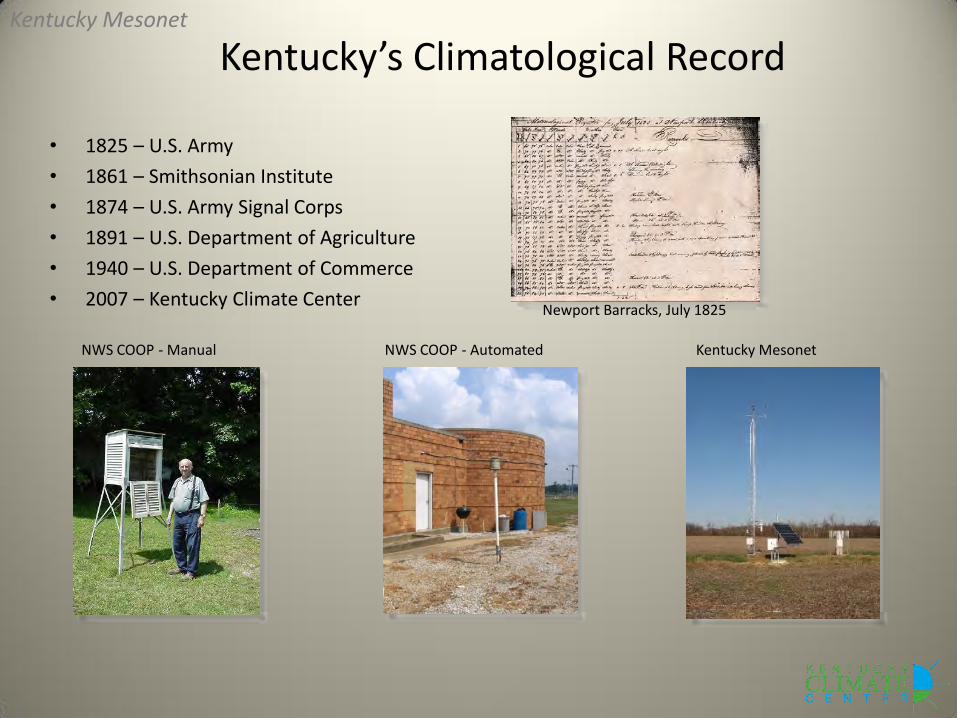
Kentucky’s Climatological Record
• 1825 – U.S. Army
• 1861 – Smithsonian Institute
• 1874 – U.S. Army Signal Corps
• 1891 – U.S. Department of Agriculture
• 1940 – U.S. Department of Commerce
• 2007 – Kentucky Climate Center Newport Barracks, July 1825
NWS COOP - Manual NWS COOP - Automated Kentucky Mesonet
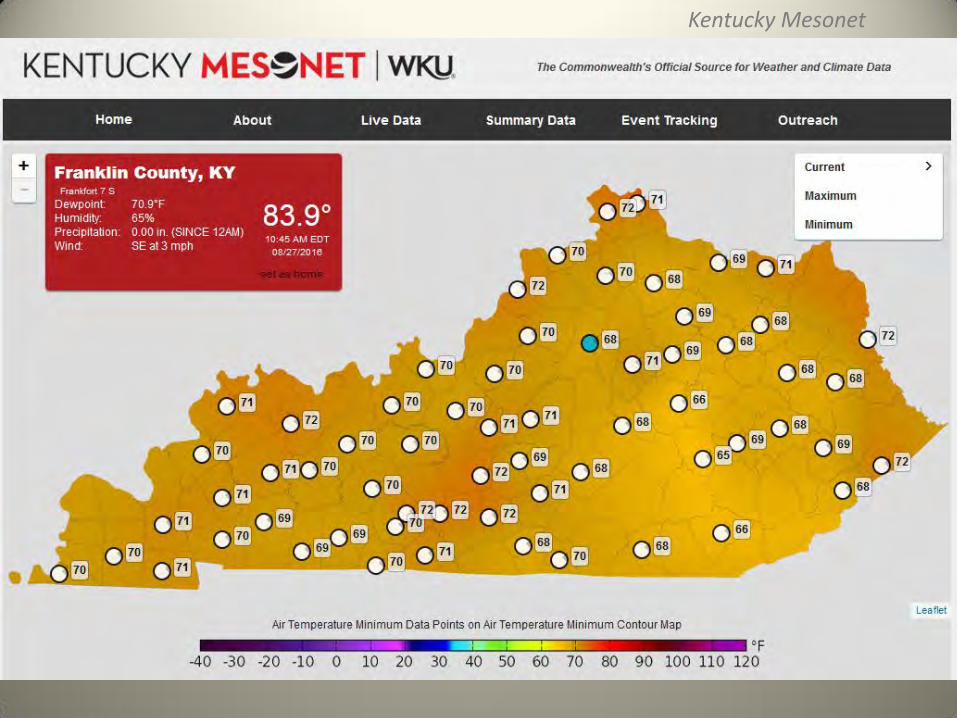
Kentucky Mesonet

Kentucky’s diverse terrain creates distinct local vulnerabilities to weather and climate
Kentucky Mesonet
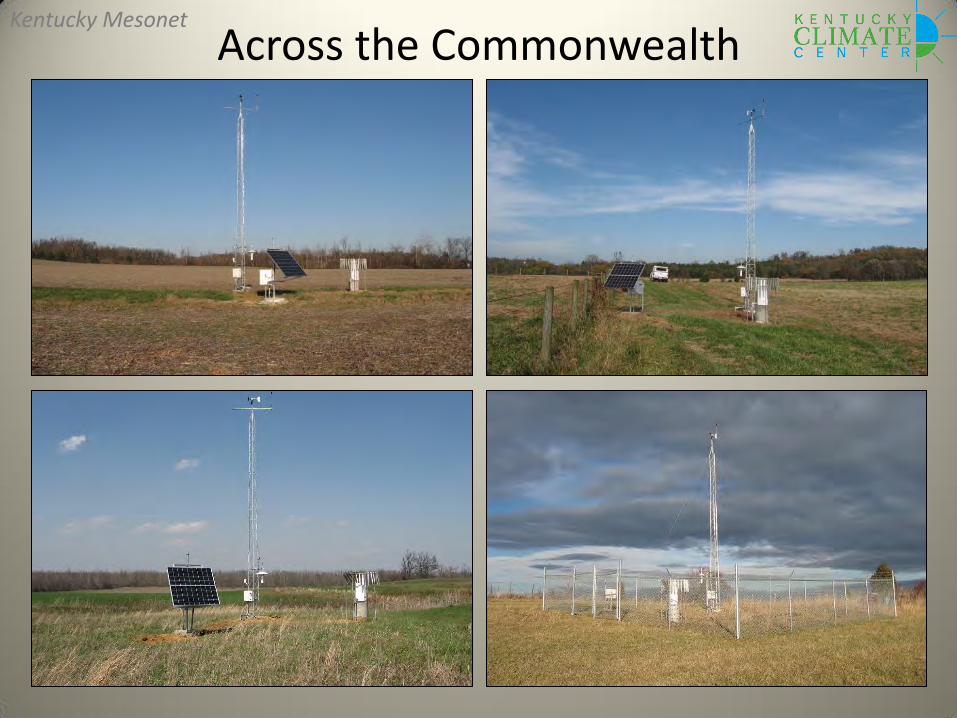
Across the Commonwealth Kentucky Mesonet
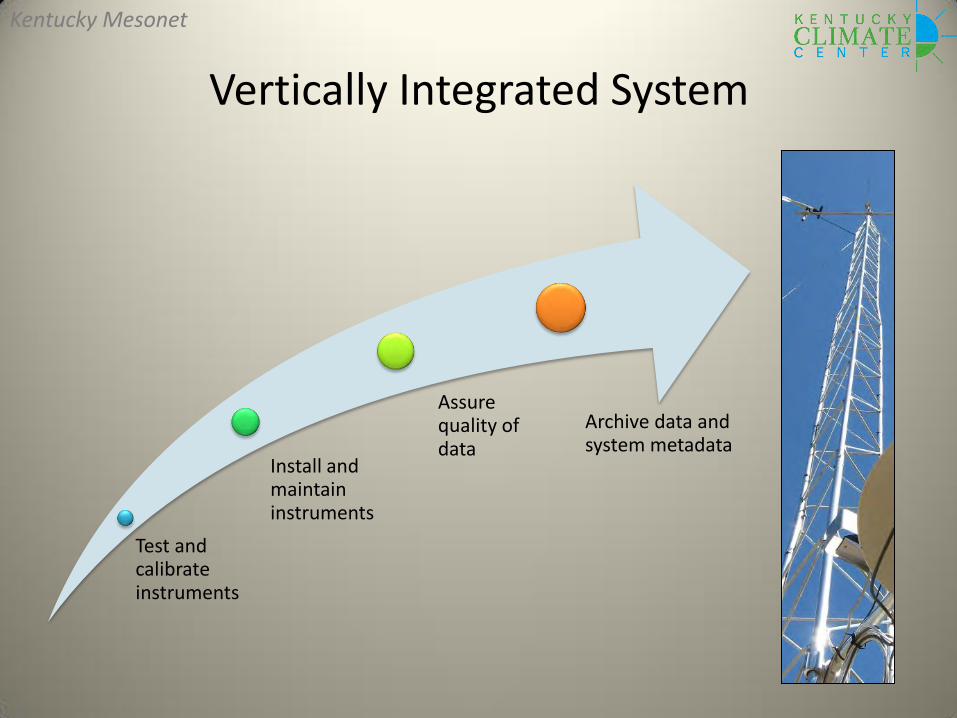
Vertically Integrated System
Test and calibrate instruments
Install and maintain instruments
Assure quality of data
Archive data and system metadata
Kentucky Mesonet
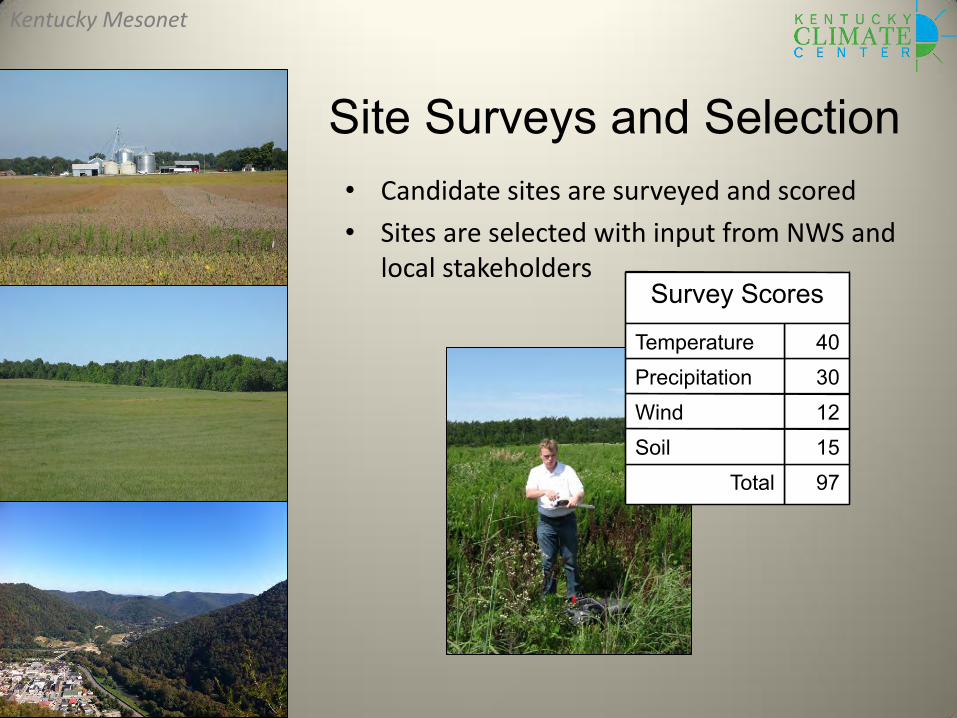
Site Surveys and Selection
Kentucky Mesonet
Survey Scores
97 Total 15 Soil 12 Wind 30 Precipitation 40 Temperature
• Candidate sites are surveyed and scored
• Sites are selected with input from NWS and local stakeholders

Station Installation and Maintenance
• Technicians install stations and instrumentation
• Technicians make spring, summer, and winter maintenance passes
• Technicians respond to “trouble tickets” when QA processes indicate problems
Kentucky Mesonet
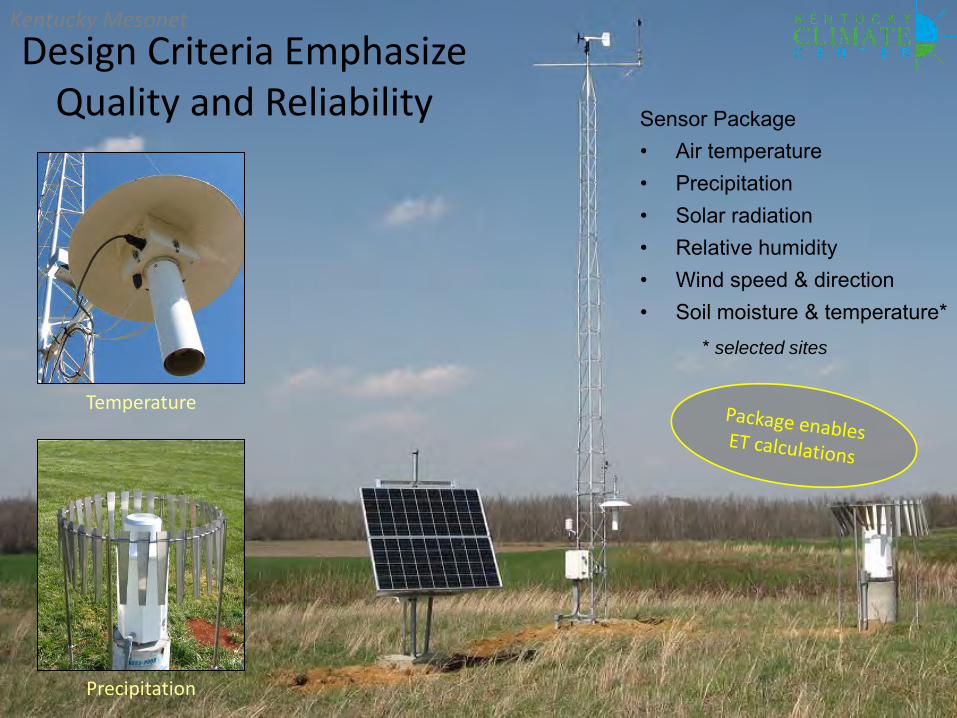
Design Criteria Emphasize Quality and Reliability
Temperature
Precipitation
Sensor Package • Air temperature • Precipitation • Solar radiation • Relative humidity • Wind speed & direction • Soil moisture & temperature* * selected sites
Kentucky Mesonet
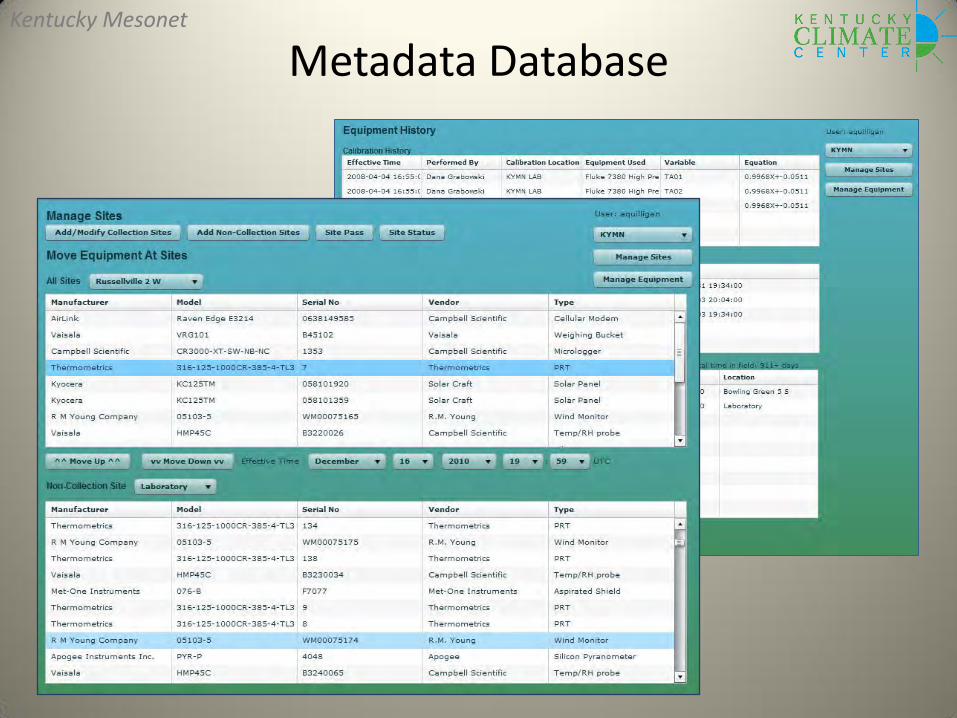
Metadata Database Kentucky Mesonet
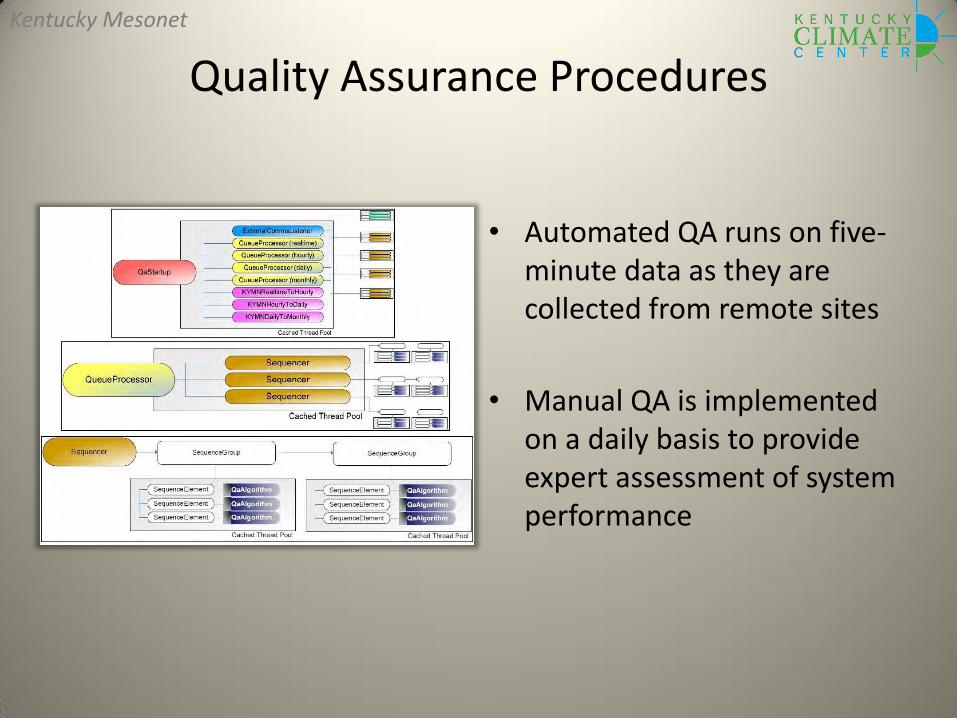
Quality Assurance Procedures
• Automated QA runs on five-minute data as they are collected from remote sites
• Manual QA is implemented on a daily basis to provide expert assessment of system performance
Kentucky Mesonet
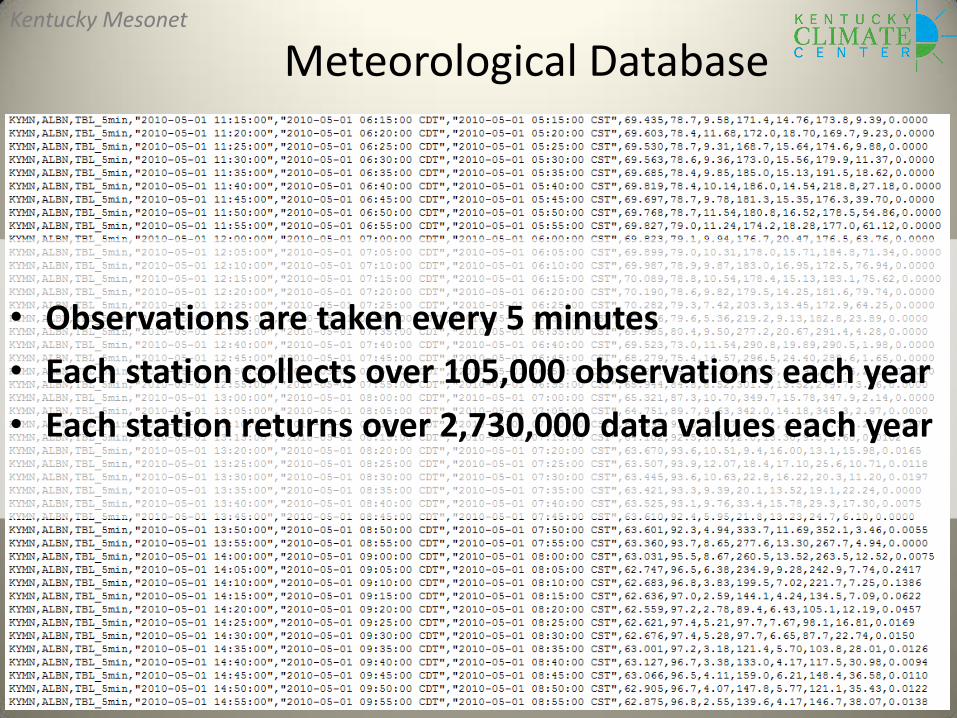
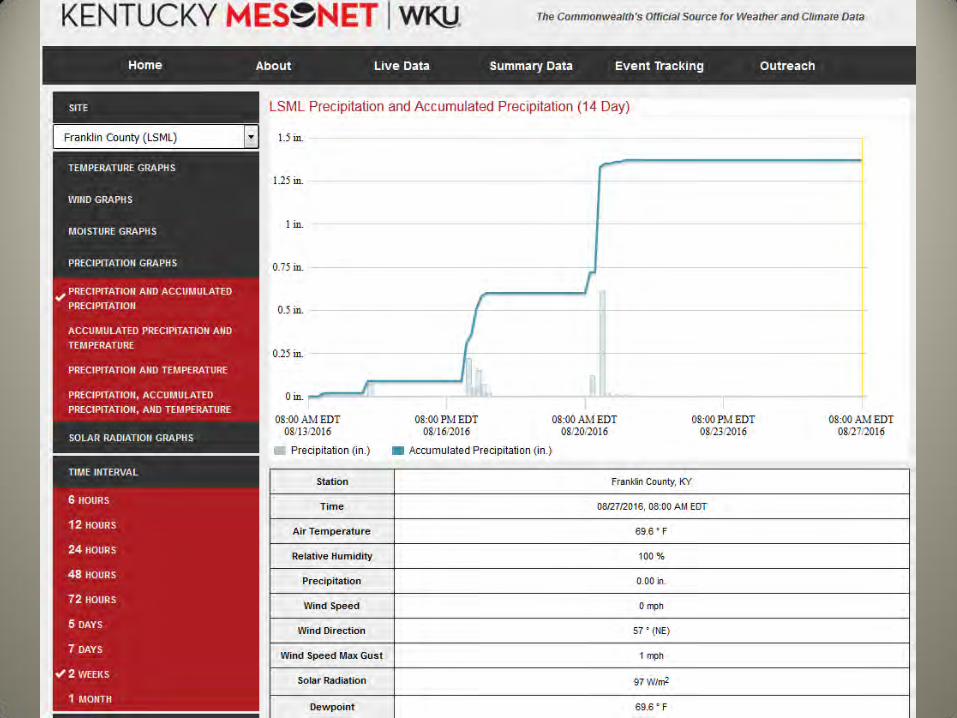
Meteorological Database
• Observations are taken every 5 minutes
• Each station collects over 105,000 observations each year
• Each station returns over 2,730,000 data values each year
Kentucky Mesonet
Kentucky Mesonet
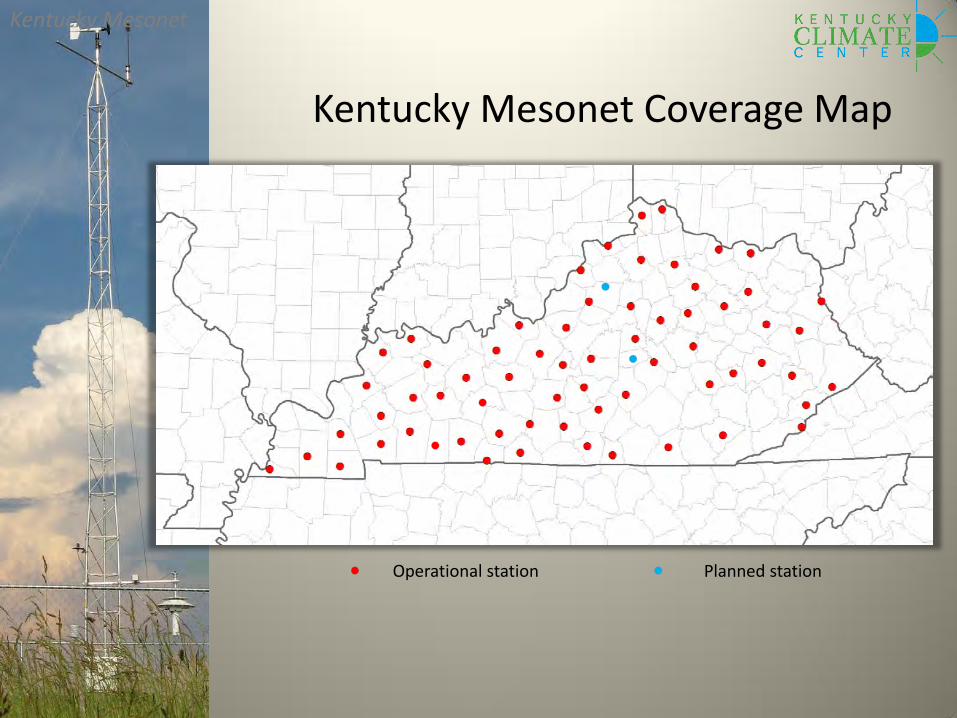
Kentucky Mesonet Coverage Map
Kentucky Mesonet
Operational station Planned station
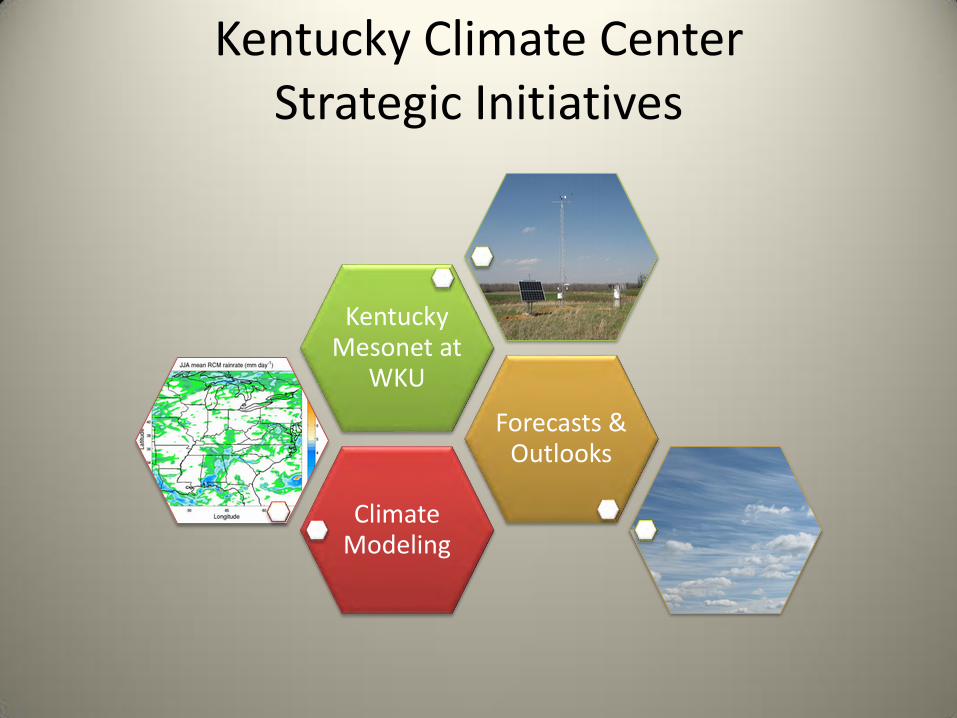
Kentucky Climate Center Strategic Initiatives
Climate Modeling
Forecasts & Outlooks
Kentucky Mesonet at
WKU
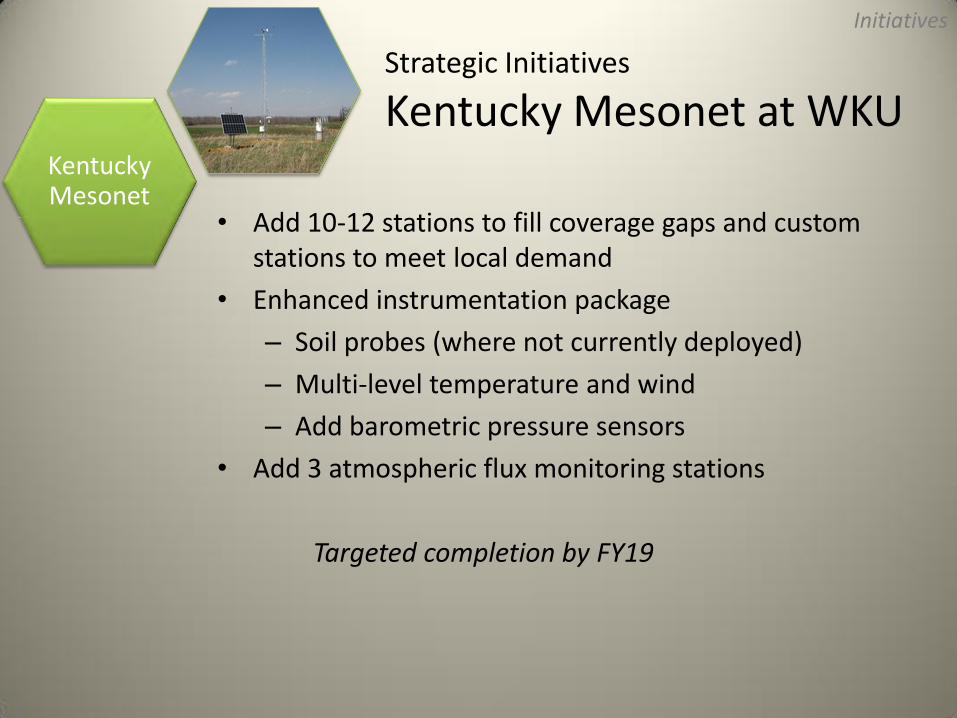
Strategic Initiatives
Kentucky Mesonet at WKU
• Add 10-12 stations to fill coverage gaps and custom stations to meet local demand
• Enhanced instrumentation package
– Soil probes (where not currently deployed)
– Multi-level temperature and wind
– Add barometric pressure sensors
• Add 3 atmospheric flux monitoring stations
Targeted completion by FY19
Kentucky Mesonet
Initiatives
Strategic Initiatives
Forecasting & Outlooks Forecasts &
Outlooks
• Develop an operational unit to provide customized weather forecasts and climate outlooks
– Hire staff meteorologist and student interns
– Utilize existing NWS forecast model output and develop option to generate forecasts incorporating mesonet data
– Provide client-focused forecast and outlook products. For agriculture, these would include
• forecasts relating to stress on crops and livestock
• outlooks for growing degree days
• forecasts for irrigation scheduling
Initiatives

Strategic Initiatives
Climate Modeling
• Conduct meso-scale simulations to model impacts of land use/land cover change on atmospheric conditions
• Provide high-resolution, downscaled climate model projections for Kentucky based on model runs reported in the most recent National Climate Assessment
– Models can be run for various time horizons
Climate Modeling
Initiatives

Questions?
Recommended