Modular LED Relative Gain Monitoring of the GlueX Barrel CalorimterI
T. Bogarta,1
aThomas Jefferson National Accelerator Facility (Jefferson Laboratory), Newport News, Virginia, 23606, USA
Abstract
The GlueX Barrel Calorimeter is one of the main components of the GlueX Detector. GlueX will be investigating gluonic degreesof freedom in Quantum Chromodynamics. The relative gain of the photodetectors for the calorimeter will be monitored usingmodular LED driver systems. The BCAL system consists of a global controller that feeds power, bias voltage and trigger signals to96 local controllers situated at the ends of the 48 BCAL modules, which drive 40 LEDs associated with the 40 light guides at theend of each module. The LEDs are mounted on small boards that will be pulsed using controller boards. 3840 blue LEDs will beused to pulse the BCAL readout cells via their light guides. The system is currently being installed on the detector and the testedperformance is presented herein.
1. Project Background1
In elementary physics forces decrease with the separation be-2
tween interacting objects, which is not the case in regards to3
the permanent confinement of quarks. The Flux-Tube Model4
explains the confinement of quarks through gluonic flux tubes5
as shown in Fig. 1.6
Figure 1: Sketch of the Flux-Tube Model as described by Quantum Chromody-namics.
When excited, these tubes can add degrees of freedom to the7
quark system. These states, where not only quarks but also8
IThis work was carried out as part of the GlueX Project at Jefferson Lab.1Student at Christopher Newport University, Newport News, Virginia,
23606, USA.
gluons effectively participate in the full dynamics, are what the9
GlueX Experiment will ultimately be searching for.10
1.1. Quantum Chromodynamics11
The GlueX Experiment in Hall D at Jefferson Lab intends12
to provide information regarding the nature of the confinement13
in Quantum Chromodynamics by searching for exotic hybrid14
mesons. Quantum Chromodynamics (QCD) provides an under-15
standing of the behavior of quarks and gluons at high energies;16
however, from predictions at low energies, it remains difficult17
to obtain a quantitative observation from QCD into the field of18
hadrons, mesons, and baryons. Gluons are elementary particles19
that operate as exchange particles that are the strong force be-20
tween quarks. As quarks make up hadrons, gluons are the force21
that binds quarks into hadrons.22
1.2. Barrel Calorimeter Overview23
The experiment will begin with physics runs starting in 2015.24
One of the key subsystems is the barrel calorimeter (BCAL).25
The BCAL consists of 48 modules of a scintillating fiber ma-26
trix embedded in lead [4]. It will circle inside of the GlueX’s27
superconducting solenoid and will act as a sampling calorime-28
ter. The BCAL will be readout using large-area arrays of Sili-29
Preprint submitted to Elsevier December 8, 2013
con Photomultipliers (SiPMs). It is important to track the gain30
for the detector. Specifically, the SiPM arrays are a novel tech-31
nology and their performance has to be monitored and studied32
extensively, in term of gain shifts and degradation of resolution.33
A Light Emitting Diode (LED) based system has been de-34
signed to meet these requirements. It has been principally de-35
signed to monitor the relative gain of the photosensors. The ab-36
solute calibration will be accomplished using cosmic rays and37
specific beam-originating interactions.38
The chosen system is modular and compact. The BCAL sys-39
tem consists of control boards that each feed power, bias and40
four trigger signals to 40 LEDs mounted on individual pulser41
boards, which also contain the driver circuits. With this de-42
sign the number of cables is minimized and the use of bulky43
coaxial cables is avoided. The LED-based monitoring system44
achieves some redundancy using a geometry where each LED45
illuminates two photosensors at opposite ends of the BCAL si-46
multaneously.47
2. BCAL Monitoring48
The BCAL consists of 48 optically isolated calorimeter mod-49
ules, each having a trapezoidal cross section and forming a hol-50
low cylinder, respectively, as depicted in Fig. 2. This detector51
is an electromagnetic sampling calorimeter, comprised of layers52
of lead sheets and scintillating fibers.53
It is important that the fibers yield the highest possible54
amount of light, measured by the sensors as photoelectrons,55
as this feature impacts the energy and timing resolutions as56
well as the detection threshold. The light transmitted by the57
fibers is collected by 40 acrylic light guides, glued at each end58
of every module (a total of 80 per module), and funneled to59
large-area. These devices offer gain as well as energy and tim-60
ing resolutions comparable to those of a PMT, are immune to61
magnetic fields, but require simple electronic amplification and62
summing circuits [6]. The 40 SiPMs, their electronics, a tem-63
perature compensation system, a cooling system and connectors64
are all integrated into a single assembly that bolts onto the alu-65
minum base plate of each module. External readout electronics66
mounted in standard crates include low-voltage bias and power67
for the preamplifiers, a flash ADC (FADC), a discriminator and68
a Time to Digital Converter (TDC).69
11.77 cm
8.51 cm
22.46 cm
BCAL end view
BCAL top half cutaway(a) (b)
(c) (d)
single moduleend
65 cm
25 cm
48 m
odules
390 cm
180 c
m 30-cm targetbeamline
BCAL
11 o126o
390 cm
65 cmBCAL
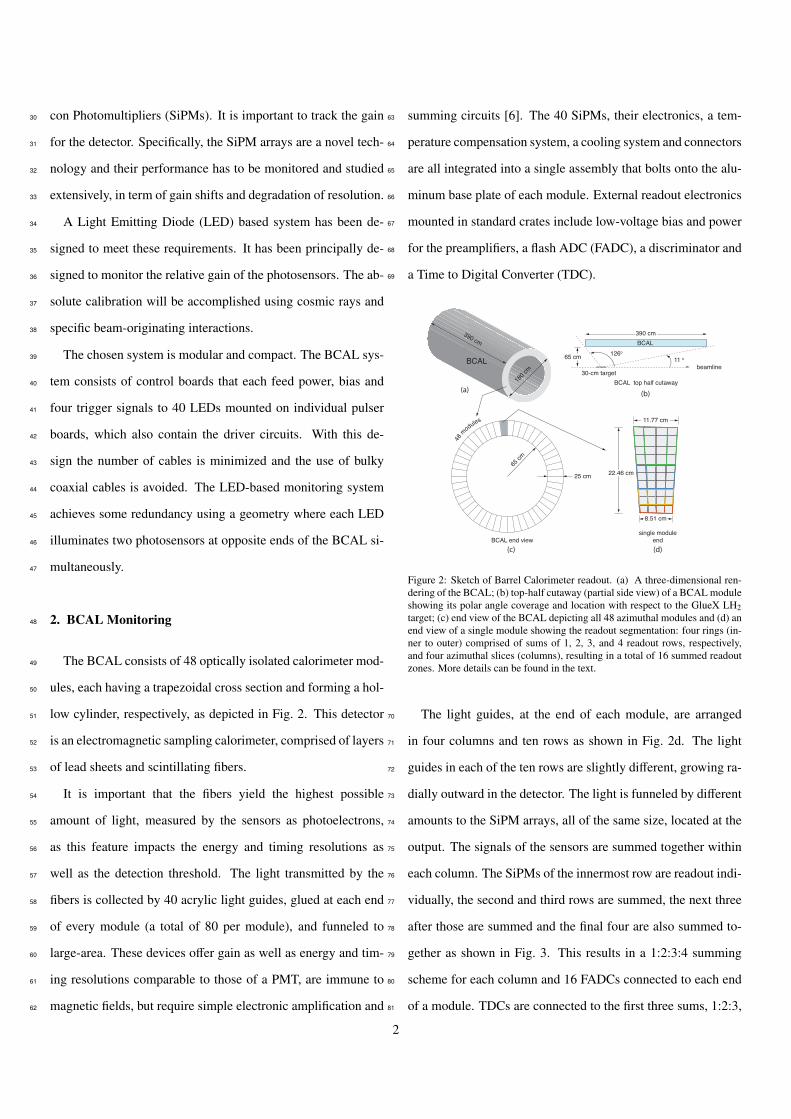
Figure 2: Sketch of Barrel Calorimeter readout. (a) A three-dimensional ren-dering of the BCAL; (b) top-half cutaway (partial side view) of a BCAL moduleshowing its polar angle coverage and location with respect to the GlueX LH2target; (c) end view of the BCAL depicting all 48 azimuthal modules and (d) anend view of a single module showing the readout segmentation: four rings (in-ner to outer) comprised of sums of 1, 2, 3, and 4 readout rows, respectively,and four azimuthal slices (columns), resulting in a total of 16 summed readoutzones. More details can be found in the text.
The light guides, at the end of each module, are arranged70
in four columns and ten rows as shown in Fig. 2d. The light71
guides in each of the ten rows are slightly different, growing ra-72
dially outward in the detector. The light is funneled by different73
amounts to the SiPM arrays, all of the same size, located at the74
output. The signals of the sensors are summed together within75
each column. The SiPMs of the innermost row are readout indi-76
vidually, the second and third rows are summed, the next three77
after those are summed and the final four are also summed to-78
gether as shown in Fig. 3. This results in a 1:2:3:4 summing79
scheme for each column and 16 FADCs connected to each end80
of a module. TDCs are connected to the first three sums, 1:2:3,81
2

for a total of 12 channels per side. The power is distributed to82
ten SiPMs at a time along rows and different summing groups,83
which allows individual SiPMs to be powered and readout dur-84
ing special runs. SiPMs are sorted according to their breakdown85
voltages first, and their bias voltage is further individualized by86
setting trim resistors.87
Figure 3: Left: Bias Map - SiPMs of the same color are those powered bya common power supply. Right: Charge summing map - SiPMs of the samecolor and shade are those which are summed and sent to one read-out channel.
2.1. BCAL LED Monitoring Design88
The monitoring system is designed to track the stability of89
the SiPM output signals about once per day between data runs.90
To minimize cabling, simplify construction and reduce size and91
cost while maintaining a degree of flexibility in its pulsing op-92
tions, a modular LED driver system has been designed in three93
levels. At the top level, a global controller feeds power, bias94
voltage and four trigger signals to 96 local controllers situated95
at the ends of the 48 BCAL modules, one controller per module96
per side. At the next level, each local controller (or BCAL con-97
troller) pulses the 40 LEDs associated with the 40 light guides98
at the end of a module as four independent trigger groups. Each99
group corresponds to one of the four columns of ten light guides100
shown in Fig. 2d. LEDs in the same group are fired simultane-101
ously by one of the four trigger signals, illuminating an entire102
column of light guides. At the third level, a miniature LED103
pulser circuit board is attached directly onto each light guide,104
directing light towards the opposite end of the module. LED105
Figure 4: Configuration of the BCAL LED monitoring system. The 335 mmbespoke flat flexible cable caters for the slightly varying pitch between lightguides.
Figure 5: Left panel: One end of a prototype BCAL module, showing two ofits four columns of light guides. The LED pulsers are mounted on the side ofthe light guides attached to a common flex cable. The free end of the flex cableconnects to the control board on the left (not shown here). Right panel: BCALLED pulser board connected to a flat flexible cable. The LED (not shown) issoldered on the bottom layer, right under the 3-pin MOSFET transistor in themiddle of the board’s bottom edge. The light beam points downwards and isparallel to the board plane.
pulser boards in groups of ten are attached to a common bus106
cable connected to the controller board. The configuration of a107
BCAL controller with 40 LED pulser boards instrumenting one108
end of one module is shown in Fig. 4.109
BCAL controllers receive the four in-coming trigger signals110
and relay each one to one column of ten LEDs using a bespoke111
flat flexible cable to carry the common trigger along with the112
bias and supply voltages, as illustrated in the left panel of Fig. 5.113
The regeneration of trigger signals at each level obviates the114
need to send fast-rising pulses over long cables, improving ro-115
bustness without compromising the emitted pulse characteris-116
tics. The LED monitoring system is independent of the SiPM117
bias distribution system, thus allowing independent monitoring118
of individual SiPMs through each readout sum. In summary,119
the BCAL system employs a total of 3840 (48 × 2 × 40) LED120
3

pulser boards, 384 flat flexible cables, and 96 (48 × 2) con-121
trollers. Details of the BCAL monitoring system can be found122
in Ref. [10].123
Major considerations in the design of the LED light pulser124
were to minimize its physical size, due to the very limited space125
available between light guides as is evident from Fig. 5. Also to126
the very low power dissipation, to minimize temperature vari-127
ations that deteriorate the performance stability of the LEDs,128
achieve nanosecond performance with a wide variety of LED129
types and wavelengths, control the emitted pulse intensity, and130
to minimize any electromagnetic interference that might affect131
the performance of SiPMs. On those grounds, and mainly the132
pulser designs based on monostable multivibrators, avalanche133
transistors or complementary regenerative switches were ex-134
cluded, and we opted for the simple, robust, inexpensive, and135
low power circuit design, measuring 12×13.5 mm2 with almost136
half of its area taken up by the flex cable connector (Fig. 5). The137
use of a connector was necessary to allow the removal and sort-138
ing of pulsers into groups of 10 with similar light intensity for139
each column of light guides.140
The pulser dissipates ≈200µW at 1 kHz, increased with fre-141
quency by ≈70 µW/kHz. The MOSFET allows a maximum142
LED bias voltage of 60 V, although practical bias voltages are143
normally lower than 15 V. The bias determines the intensity of144
the LED light flash. The small loop area of the capacitor dis-145
charge current, along with a ground plane covering the entire146
bottom side of the board, ensure that there is practically no de-147
tectable radiated or near-field interference affecting the SiPMs.148
Conducted interference is minimized by keeping the SiPM elec-149
tronics separated upstream at the level of global controller from150
those of the LED monitoring system.151
The LEDs2 come in a standard surface mount package emit-152
ting blue light at 471 nm, which is at the peak of the fiber emis-153
2Model SMS1105BWC, Bivar, Inc., CA 92618, USA (www.bivar.com)
sion spectrum [8]. Measurements were also carried out using154
green LEDs at 574 nm — where the SiPM quantum efficiency155
drops by about 25% from its peak value — in order to inves-156
tigate whether it conferred any advantage over the blue one,157
which it did not. Each LED emits light parallel to the board158
plane through the near light guide and toward the opposite side159
of the BCAL module. Light enters the fibers and is transmit-160
ted through the module to the sensor at the far end and is also161
reflected from the near end of the module back into the near162
sensor. The design goal was to have about the same light inten-163
sity on both ends of a module to facilitate gain matching. Due to164
attenuation through the module [7], the light intensity at the far165
end must be ≈3 times that at the near end in order to produce166
the same signal at both ends. This goal was achieved during167
tests on a small (58 cm long) prototype calorimeter [9], but the168
ratio ranged from 1-4 from tests on a production module, as ex-169
plained in Section 2.3. A final consideration was redundancy,170
namely171
To evaluate the capability for gain matching, blue, domed172
LEDs were positioned on two light guides glued on either end173
of a 58 cm prototype calorimeter, inside a 3 × 3 mm2 “groove”174
or a 4 mm diameter and 3 mm depth “well”, machined at 6 cm175
and 5 cm, respectively, from the large-area end of each light176
guide. The opening angle of light from the LED was 40◦ and177
the LED beam was aimed towards the calorimeter. Light was178
detected with signal amplitudes of 2.5 V and 7.15 V (ratio of179
2.86) for the near and far signals from the groove, respectively,180
and 0.83 V, 2.65 V (ratio 3.2) from the well. The measurements181
were repeated with a green LED (570 nm), and yielded 1.5 V182
and 3.6 V (ratio of 2.4). All ratios proved the design require-183
ment of equalizing approximately the LED signals on the near184
and far ends of each module.185
The placement of the LEDs on opposing light guides was car-186
ried out in a manner that allowed approximately equal amount187
4

Figure 6: Hole on the side of a light guide, where the LED is to be mounted.Dimensional details are provided in the text.
of light from each LED to arrive at the near and far SiPMs of188
its readout cell. This was done to simplify gain matching be-189
tween the two photosensors as well as for reasons of redun-190
dancy, namely to ensure that even if one LED ceased function-191
ing the other one would still illuminate both ends. The LEDs192
are glued into pockets drilled into the sides of the light guides.193
2.2. LED Monitoring Test on Calorimeter Modules194
Tests of the LED monitoring system were carried out on a195
small prototype module as well as on a production module. The196
former tests were done employing an earlier version of the read-197
out electronics that suffered from increased noise. The noise198
was due to the proximity of the ground traces on the boards and199
this was rectified for subsequent tests and the production units.200
Otherwise the system functioned well in both cases, although201
the extracted near/far ratio differed, achieving values near one202
(after correcting for the attenuation length difference between203
the prototype and the full length) but values 1-4 for the produc-204
tion module. Nevertheless, this ratio spread does not pose any205
difficulties in the main objective of gain monitoring, as the rel-206
ative stability of each ratio will be checked rather than its abso-207
lute value. Possible reasons for the ratio difference and details208
of the tests are presented below.209
The shorter calorimeter prototype, termed ”mini BCAL”,210
was fully instrumented with SiPMs and their electronics and211
was used for the first comprehensive tests of a complete LED212
system (80 LED pulsers and their two controllers) at the Ex-213
perimental Staging Building (ESB) at Jefferson Lab [11]. Its214
ends are referred to as upstream and downstream, following the215
convention relative to beam direction in Hall D.216
The SiPMs used for these tests were selected based on bin-217
ning their operational voltage for the four bias distribution lines218
per end of the module. In this manner, the common bias sup-219
plied on each line results in approximately the same gain for220
each SiPM. The same principle will be applied for sorting all221
3840 units for the full BCAL.222
During these tests the prototype upstream and downstream223
wedge boards had identical layout. However, this resulted in224
needing to use different bias lines to power the SiPMs on op-225
posite ends of the same readout cell. As this is both confusing226
to the experimenters and results in doubling the cross talk to227
adjacent cells, the production upstream and downstream boards228
will have a mirrored configuration.229
Primarily for reasons of cost, the SiPM signals for the GlueX230
experiment are summed in the following manner: the first, inner231
(to the incoming particles during the experiment) row of SiPMs232
are read individually in each column, the next two rows are233
summed, the next three after those are summed as are the last234
four rows. This is referred to as the 1:2:3:4 summing scheme for235
each column, resulting in 16 readout channels and is sketched236
in Fig. 2. All of these are directed to FADCs (16 channels per237
end per module), whereas only the 1:2:3:4 readouts are directed238
to TDCs (12 channels per end per module).239
The ESB setup included a fine-control bias supply as well240
as a chiller to keep the SiPMs at the constant temperature of241
16◦C. The operating bias was set at an overbias of +1.2 V, i.e.242
in the range from 74-75 V; the SiPM bias is referred to as high243
voltage (HV) to distinguish it from the low voltage applied to244
its electronics amplifier (<8 V).245
Preliminary testing of the HV channels were conducted by246
turning them on one at a time and observing the signals on an247
oscilloscope. During the initial tests, the downstream LEDs248
5
101
102
103
104
Mea
n Si
gnal
(AD
C ch
anne
ls)
8765LED BIas (V)
Upstream Downstream
Figure 7: ADC values of the LED light are plotted as a function of appliedLED bias. The light was detected by the SiPMs in Channels 1 and 2, respec-tively, located at opposite ends of a calorimeter readout cell in one of the middlecolumns.
were flashed first, facing the opposite side of the calorime-249
ter. Upstream-to-downstream ratios of each of the ten SiPMs250
for each column were calculated by the pulse amplitude cap-251
tured on an oscilloscope. In addition, columns adjacent to the252
flashed SiPM channels were investigated for cross talk to es-253
tablish whether the cross talk is an optical or electronic effect.254
The pedestals were determined by evaluating the first fifteen255
samples of the FADC. These values were then subtracted from256
the signal ADC values to obtain the peak values of the signals.257
As expected, a strong correlation in ADC values between cor-258
responding upstream-to-downstream SiPMs was present where259
again the downstream LED was flashing and its light is visible260
between both downstream (near) and upstream (far) SiPM. The261
LED bias was varied from 4.0 to 7.5 V. The signal was minimal262
below 5.0 V, and above this value the resulting SiPM signal263
ranged from 1000-8000 ADC channels as graphed in Fig. 8.264
Based on these results, a bias of 6.4 V (middle of the range)265
was chosen for the remainder of the tests.266
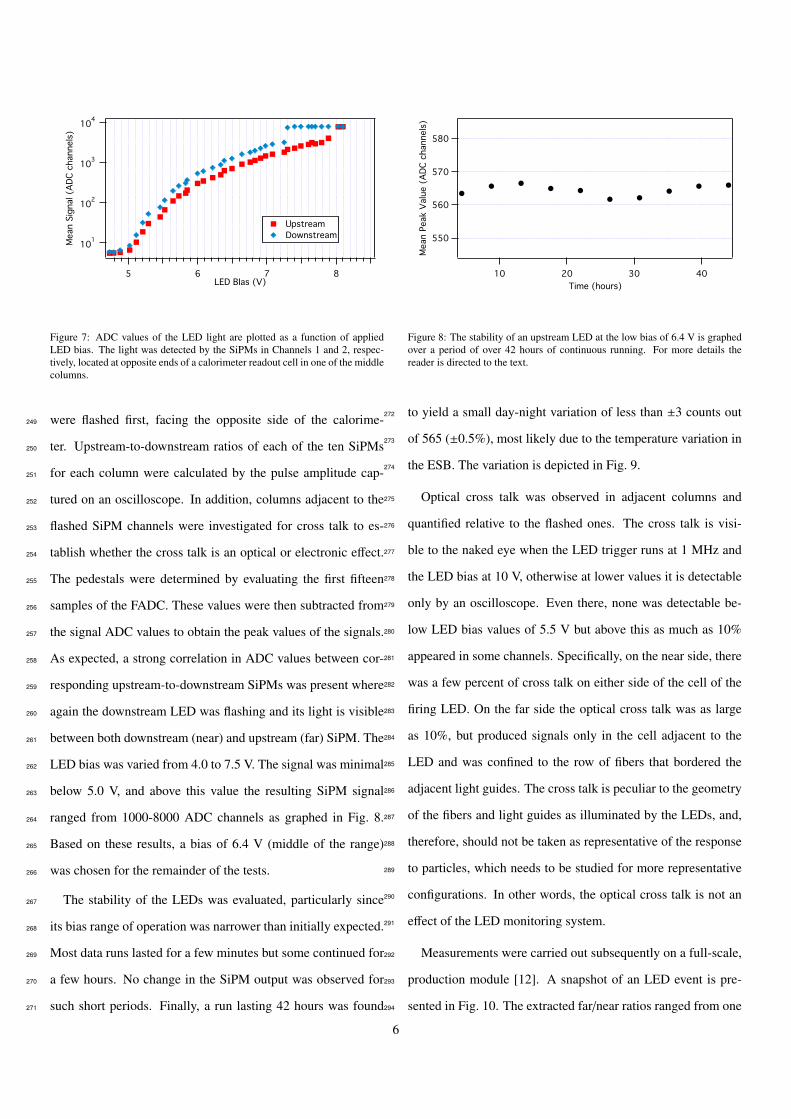
The stability of the LEDs was evaluated, particularly since267
its bias range of operation was narrower than initially expected.268
Most data runs lasted for a few minutes but some continued for269
a few hours. No change in the SiPM output was observed for270
such short periods. Finally, a run lasting 42 hours was found271
580
570
560
550
Mea
n Pe
ak V
alue
(AD
C ch
anne
ls)
40302010Time (hours)
Figure 8: The stability of an upstream LED at the low bias of 6.4 V is graphedover a period of over 42 hours of continuous running. For more details thereader is directed to the text.
to yield a small day-night variation of less than ±3 counts out272
of 565 (±0.5%), most likely due to the temperature variation in273
the ESB. The variation is depicted in Fig. 9.274
Optical cross talk was observed in adjacent columns and275
quantified relative to the flashed ones. The cross talk is visi-276
ble to the naked eye when the LED trigger runs at 1 MHz and277
the LED bias at 10 V, otherwise at lower values it is detectable278
only by an oscilloscope. Even there, none was detectable be-279
low LED bias values of 5.5 V but above this as much as 10%280
appeared in some channels. Specifically, on the near side, there281
was a few percent of cross talk on either side of the cell of the282
firing LED. On the far side the optical cross talk was as large283
as 10%, but produced signals only in the cell adjacent to the284
LED and was confined to the row of fibers that bordered the285
adjacent light guides. The cross talk is peculiar to the geometry286
of the fibers and light guides as illuminated by the LEDs, and,287
therefore, should not be taken as representative of the response288
to particles, which needs to be studied for more representative289
configurations. In other words, the optical cross talk is not an290
effect of the LED monitoring system.291
Measurements were carried out subsequently on a full-scale,292
production module [12]. A snapshot of an LED event is pre-293
sented in Fig. 10. The extracted far/near ratios ranged from one294
6

Figure 9: Typical LED pulses in a readout cell as recorded by its SiPMs, withthe far end (upstream) shown on the left and the near one (downstream) on theright, relative to the placement of the LEDs. The near plot shows a shoulderthat is most likely related to an optical reflection off one of the optical boundarybetween the light guides and the calorimeter’s fibers. Such shoulders were notalways present and in any case do not affect the operation of the monitoringsystem.
to four in all cases examined. There are several factors that295
contribute to this difference (e.g. fiber light output, light guide296
gluing) but the driving factor is most likely the precise place-297
ment and angle of the LEDs in the pockets. However, only the298
relative ratios need to be monitored during the experiment and299
thus the system will function as intended, perhaps by employ-300
ing an online software correction to place all ratios to one, for301
ease of examination by experimenters.302
These tests demonstrated that the signals resulting from303
lower LED bias show clearer signal response and that the LEDs304
can maintain a steady light output voltage of less than 0.5%305
over nearly two days of continuous operation, something well306
beyond any projected running during the experiment.307
3. Summary and Conclusions308
The relative gain of the photodetectors for the GlueX Bar-309
rel Calorimeter (BCAL) will be monitored by employing LED-310
based systems. The LED system is modular with a design311
based on controller boards, each controlling a multitude of LED312
pulser boards, comprising of single-LED boards. The key ob-313
jective is to monitor the performance of the BCAL SiPMs.314
For the entire BCAL monitoring system, 3840 LEDs are315
mounted each on its own single-LED pulser board, glued to316
the side of a light guide and coupled in groups of ten using317
flexible cables. The system was verified to not interfere elec-318
tromagnetically with the SiPMs. The light output of all of the319
LEDs was measured and the results were used to bin the LEDs320
into groups of ten, so as to ensure similar performance across321
a given section of the calorimeter. A full system of 80 LEDs322
and two controller boards were first deployed on a prototype323
module and then on a production module and was examined for324
optimum bias operation, light output and optical cross talk, re-325
vealing no issues of concern. These systems have been installed326
on all BCAL modules.327
4. Acknowledgments328
This work was supported by Jefferson Science Associates,329
LLC, who operates Jefferson Lab under U.S. DOE Contract No.330
DE-AC05-06OR23177, DOE Office of Nuclear Physics grant331
DE-FG02-05ER41374 at Indiana University and NSERC grant332
SAPJ-326516 at the University of Regina. I would like to thank333
David Lawrence for all of his patience and for all his to the334
side explanations when confusion set in; Elton Smith for his335
detailed explanations and allowing me to utilize his previous336
works. I also must give my thanks to the Jefferson Lab for337
allowing me the wonderful opportunity to enjoy my time with338
the facility, assisting the above physicists with their work and339
allowing me access to the buildings I conducted my research in,340
the Continuous Electron Beam Accelerator Facility (CEBAF)341
as well as the Experimental Science Building (ESB).342
Figure Captions343
Fig. 1. To be added later. With Figures?344
Fig. 2 ...345
[1] A.R. Dzierba, C.A. Meyer and E.S. Swanson, American Scientist, 88, 406346
(2000).347
[2] M. Dugger et al. (The GlueX Collaboration), “The GlueX Experiment348
in Hall-D”, Proposal to the Jefferson Lab Program Advisory Committee349
#36, GlueX-doc-1545 (August 2010).350
[3] V. Crede et al. (The GlueX Collaboration), “An initial study of mesons351
and baryons containing strange quarks with GlueX”, Proposal to the Jef-352
ferson Lab Program Advisory Committee #40, GlueX-doc-2198 (June353
2013).354
7

[4] B.D Leverington et al., Nucl. Instr. and Meth. A 596 (2008) 327.355
[5] K. Moriya et al., Nucl. Instr. and Meth. A 726 (2013) 60.356
[6] F. Barbosa, J.E. McKisson, J. McKisson, Y. Qiang, E. Smith, C. Zorn,357
Nucl. Instr. and Meth. A 695 (2012) 100.358
[7] A. Semenov, G.J. Lolos, Z. Papandreou, I. Semenova, “Cosmic Ray Tests359
and Light Output from BCAL”, GlueX Note GlueX-doc-1582 (September360
2010).361
[8] Z. Papandreou, B.D. Leverington, G.J. Lolos, Nucl. Instr. and Meth. A362
596 (2008) 338.363
[9] A. Semenov, G.J. Lolos, Z. Papandreou, “Method to Simultaneously Illu-364
minate both SiPMs on a BCAL Readout Cell”, GlueX Note GlueX-doc-365
1720 (April 2011).366
[10] E. Kappos, “BCAL Monitoring System User’s Guide”, GlueX Note367
GlueX-doc-2250 (May 2013).368
[11] T. Bogart, “Initial Testing of the Barrel Calorimeter Monitoring System369
of the GlueX Particle Detector”, GlueX Note GlueX-doc-2045 (August370
2012).371
[12] S. Krueger, “Testing of Glued Modules”, GlueX Note GlueX-doc-2131372
(February 2013).373
[13] B. B. Brabson et. al., Nucl. Instr. and Meth. A 332 (1993) 419.374
[14] A. Brunner, R.R. Crittenden, A.R. Dzierba, et al., Nucl. Instr. and Meth.375
A 414 (1998) 466.376
[15] E. Kappos, “FCAL Monitoring System User’s Guide”, GlueX Note377
GlueX-doc-2251 (May 2013).378
[16] K.E.Golwitzer, “The Charmonium 1P1 State (hc) Produced in Antiproton-379
Proton Annihilations”, M.Sc. thesis, University of California Irvine,380
1993.381
8
Recommended