1
Modeling chloride transport in cracked concrete: a 3-D image–based microstructure simulation
Yang Lu1, Edward Garboczi
2, Dale Bentz
3, and Jeffrey Davis
4
Abstract The prediction of the service life of concrete materials is difficult, mainly because of their
complex heterogeneous microstructure and their random nature. Studying the presence of cracks
in concrete and their effect on chloride transport and binding properties is of great interest in
civil engineering. Cracks with different widths and depths will reduce the effective cover
thickness and accelerate the transport of chloride ions. So, it is highly desirable to develop a
model predicting the chloride diffusion depth in cracked concrete while considering the real
microstructure including cement paste, voids, and aggregates. While current models consider
concrete at various levels of complexity in predicting the initiation of chloride-induced
corrosion, considering the influence of cracking is generally beyond their scope. In this study, a
3-D image-based microstructure simulation procedure was developed to model the chloride
ingress in cracked concrete. A micro-X-ray fluorescence (XRF) test was conducted to measure
the chloride concentration profile of a concrete sample. The notched concrete sample was put in
a chloride ponding test for 30 days before the micro-XRF measurement. A 2-D simulation result,
with a mesh based directly on the XRF characterization of microstructure, showed good
agreement with the micro-XRF measurement. With this validation, two different 3-D concrete
microstructures were generated and meshed in 3-D and a commercial software package was used
to accurately compute the influence of cracking on chloride diffusion with binding. The chloride
concentration gradient in the crack changed the concentration profile along the crack and nearby
irregular aggregate surfaces continuously. Comparison to micro-XRF measurement data
indicates that the contributions of the crack play a significant role in the chloride ingress.
Key words: COMSOL Multiphysics, chloride diffusion and binding, X-Ray CT, virtual concrete
model, concrete corrosion
1 Introduction To improve the service life of concrete structures and make them more durable, appropriate
mechanical and transport properties are equally necessary. Generally, common concrete
degradation processes, including corrosion of steel reinforcement, sulfate attack, alkali-silica
reaction, and damage due to freezing/thawing are strongly influenced by the diffusion of ions
modified by any binding. Thus, an applicable approach to increase concrete service life is to
reduce transport phenomena in concrete. Moreover, micro- or macro- cracks, which have a
1 Ph.D., Research Associate, Engineering Laboratory, National Institute of Standards and Technology, 100 Bureau
Drive 8615, Gaithersburg, MD 20899-8615, Phone: 301-975-5227, E-mail: [email protected] 2 NIST Fellow, Engineering Laboratory, National Institute of Standards and Technology 3 Chemical Engineer, Engineering Laboratory, National Institute of Standards and Technology 4 Materials research engineer, Material Measurement Laboratory, National Institute of Standards and Technology
2
critical negative influence on all concrete degradation processes, are almost always present in
concrete during the service life. Cracks with different widths and depths will reduce the effective
cover thickness and accelerate the migration of chloride ions. Understanding the relationships
between cracked microstructure and transport can improve the elucidation of degradation
mechanisms within concrete. While current models consider concrete at various levels of
complexity in predicting the initiation of chloride-induced corrosion, considering the influence of
cracking is generally beyond their scope. This paper develops a model to predict the chloride
diffusion depth in cracked concrete considering the real microstructure including cement paste,
voids, and aggregates.
Previous research has used the COMSOL Multiphysics package5 to model the microscale
corrosion and cracking process in reinforced concrete due to non-uniform corrosion (Pan and Lu
2012). The properties of cracked and porous media were analyzed by COMSOL (Perko et al.).
Binding and diffusion processes in a mineral rock, without considering microstructure explicitly,
were also studied by (Richter et al.). Some studies, based on non-steady state migration tests,
were described in NT BUILD 492, using an electrical field and artificial cracks (Marsavina et al.
2009). Kwon et al. (Kwon et al. 2009) obtained the relationship between diffusion coefficients
and crack widths in cracked concrete structures through field investigations; however, the crack
depth is equally important and should be considered in the model. Past research on chloride
diffusion in concrete generally focused on specimens with artificial cracks and did not express
the real condition and real shape of concrete cracks. Digital image processing technology
provides an innovative method for considering the microstructure influences on transport
properties in rock and geotechnical materials. Image analysis technology was used to represent
rock structures (Zhang et al.), and has been coupled with the finite element method for two-
dimensional mechanical analysis of geomaterials (Yue et al. 2003). However, there is no
systematic procedure available to simulate the cracked concrete corrosion process using a 3-D
digital image-based microstructure model.
In this study, approaches for obtaining an understanding of diffusion and binding in cracked
cement concrete using the COMSOL Multiphysics package are presented. Two different 3-D
microstructures with cracks were employed in the simulations. A 3-D X-Ray CT image-based
microstructure was measured and a 3-D virtual microstructure using a spherical harmonic
analysis-based approach (Garboczi 2002) was created. The 3-D image-based microstructure and
spherical harmonic based particles within the comprising microstructure both were input into
finite element mesh form using recent techniques developed for random microstructures (Lu and
Garboczi). Next, a 3-D mesh representing the true multiphase microstructure was written in
5 Certain commercial equipment and/or materials are identified in this report in order to adequately specify the
experimental procedure. In no case does such identification imply recommendation or endorsement by the National
Institute of Standards and Technology, nor does it imply that the equipment and/or materials used are necessarily the
best available for the purpose.
3
tetrahedral mesh and imported into the COMSOL Multiphysics package. Two COMSOL
interfaces, Transport of Diluted Species and User Defined ODE Mathematics, were employed in
this study to examine the influence of cracking on chloride diffusion with binding. For the
purpose of validation, a micro X-ray fluorescence (μXRF) (Janssens et al. 1996) test was
performed to measure the chloride concentration profile of a concrete sample in NIST and
compare the experimental results to simulation results. Then the 3-D X-Ray CT image-based
microstructure and the 3-D virtual microstructure were both used to study the crack effect in the
chloride transport.
2 Image–based microstructures Two different representations of microstructures with cracks were employed to compute
transport and absorption binding. The microstructure study focused on mortar composed of a
matrix of cement paste (hydrated cement), sand (aggregates), and voids (mainly entrapped air).
The two microstructures considered here are (a) X-ray computed tomography (CT) images
stacked into a 3-D digital image, and (b) real-shaped sand and gravel particles (up to 6 mm in
size), represented by spherical harmonic series, randomly placed into a 3-D box to make a virtual
concrete microstructure. Based on recent 3-D meshing procedures (Lu and Garboczi), the
microstructures with a crack could be generated.
Figure 1 Two-dimensional slices (25 mm x 25 mm mortar sample with water-to-cement ratio of 0.4) from 3-D microtomographic image data set corresponding to: (a) - original X-ray CT image slice, (b) - segmented multiphase image, and (c) - crack region is segmented from other phases and the crack area is shown with a red outline. The voxel size is 0.017 mm.
The first microstructure is a 3-D microstructural representation based on 2-D images obtained
using X-ray computed microtomography (CT). For each sample scanned, a three-dimensional
computational volume is divided into a cubic grid of voxels, where each voxel contains a single
mortar phase (mortar, crack or voids). Figure 1 provides two-dimensional slices of the X-ray CT
data set, including (a) an original X-ray CT image slice, (b) a segmented multiphase image, (c)
an image where a the crack phase has been segmented and outlined in red. The specimen
contains three readily distinguishable phases based on different intensity values (or more
correctly X-ray absorption): dark air voids and empty pores, dark crack, and bright mortar
(cement paste). The sizes and shapes of many of the individual air voids are readily observed,
both in their two-dimensional (Figures 1) and in their three-dimensional (Figure 2) forms. Most
(a) (b) (c)

4
of these empty pores were air voids entrapped during sample preparation. The largest connected
dark area is the crack phase. The crack was manufactured by putting a steel shim into the casting
specimen from the top, and then pulling it out after final set of the mortar has occurred. One
should note that individual aggregates could not be distinguished from the matrix in these
images. Optimizing the X-ray CT instrument in order to be able to see the aggregates after
segmenting is an area of future work.
Figure 2 Three-dimensional volume rendering of crack and voids from segmented images. The 3-D volume rendering image indicates regions where the top crack and voids distribution are present in the specimen.
To perform a detailed quantitative analysis, the image set was processed and analyzed as follows.
First, to reduce the random noise present in the three-dimensional image set, each image was
processed using a median filter. In applying a median filter, each voxel (image element) within
the specimen volume is replaced by the median (grey level) value for all voxels within a fixed
size cube centered on the voxel being considered. Median filters remove noise by smoothing the
data, while preserving small details and sharp edges. After filtering operations, the grey level
histogram (a plot of the number of voxels containing each grey level intensity value vs. grey
Figure 3 Three-dimensional diffusion and binding simulation procedure with an X-ray micro-tomography image set cubic specimens were 25 mm on a side.
(b) Multi-level 3D image (the three colors represent matrix, crack, voids).
(d) Simulated concentration contour of the X-ray CT microstructure
(a) Raw 2D X-ray scanning sequential images
(c) 3D tetra mesh imported into COMSOL, then boundary and initial conditions are applied
3D Reconstruction
COMSOL Simulation
Mes
h
Imp
ort
Constant Cl- concentration at the top surface
5
level intensity) was determined for this image data set. Next, the image data set was segmented
into 3 phases, voids, crack, and mortar matrix. Finally, the 3-D surface mesh and 3-D volumetric
mesh were created from the segmented three-phase images.
Figure 3(a-c) shows a schematic of 3-D reconstruction, mesh import and COMSOL simulation
for the X-ray CT image-based microstructure. Figure 3(d) plots the simulation result of the X-ray
CT image-based microstructure, the last step in the simulation procedure. This cracked mortar
sample was entirely covered by an epoxy layer except at the top surface. As shown in Figure 3,
the original image data set was 2000 x 2000 x 985 voxels, with each voxel representing 17 µm.
The intensity histogram measured on each phase in the two-dimensional images is utilized to
reconstruct a representative three-dimensional microstructure with the same voids ratio, surface
area, volume, and correlation as the original concrete. This original data set was used to create an
optimized 3-D finite element mesh (Lu and Garboczi). The final 3-D tetrahedral mesh contained
a total of 120689 nodes and 615166 tetrahedral elements, including 573691 mortar elements,
34695 crack elements, and 6780 void elements.
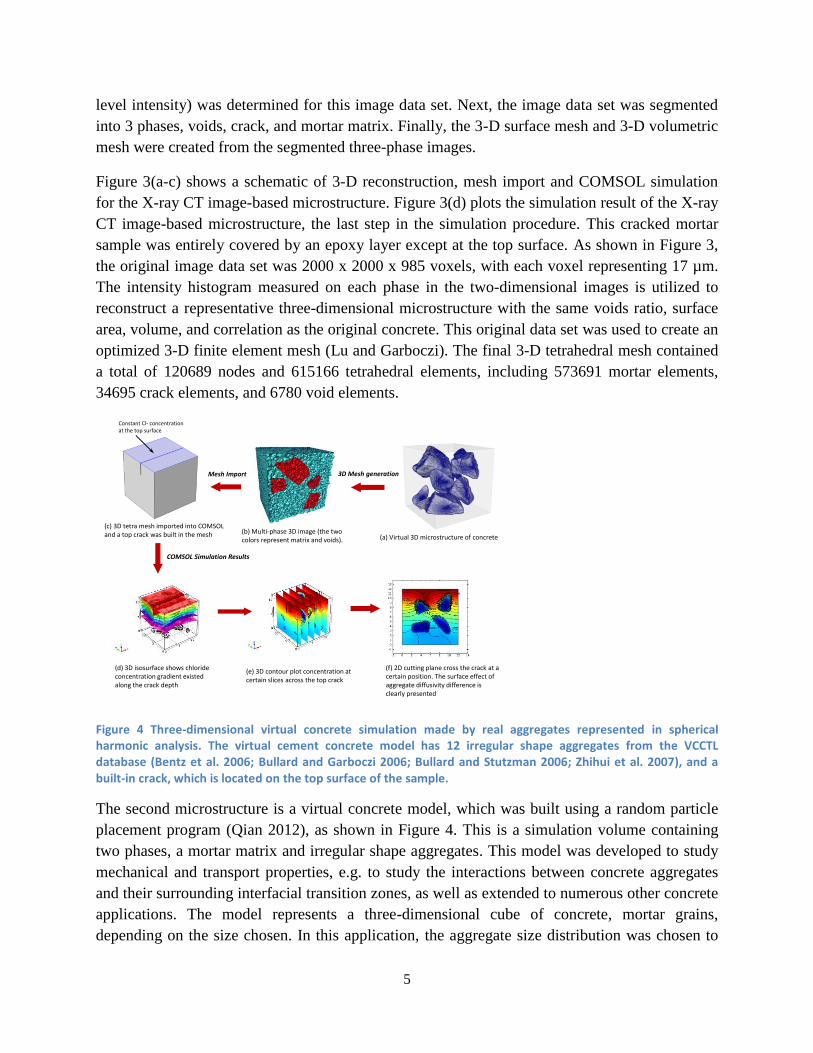
Figure 4 Three-dimensional virtual concrete simulation made by real aggregates represented in spherical harmonic analysis. The virtual cement concrete model has 12 irregular shape aggregates from the VCCTL database (Bentz et al. 2006; Bullard and Garboczi 2006; Bullard and Stutzman 2006; Zhihui et al. 2007), and a built-in crack, which is located on the top surface of the sample.
The second microstructure is a virtual concrete model, which was built using a random particle
placement program (Qian 2012), as shown in Figure 4. This is a simulation volume containing
two phases, a mortar matrix and irregular shape aggregates. This model was developed to study
mechanical and transport properties, e.g. to study the interactions between concrete aggregates
and their surrounding interfacial transition zones, as well as extended to numerous other concrete
applications. The model represents a three-dimensional cube of concrete, mortar grains,
depending on the size chosen. In this application, the aggregate size distribution was chosen to
(b) Multi-phase 3D image (the two colors represent matrix and voids).
(d) 3D isosurface shows chloride concentration gradient existed along the crack depth
(a) Virtual 3D microstructure of concrete
(c) 3D tetra mesh imported into COMSOL and a top crack was built in the mesh
3D Mesh generation
COMSOL Simulation Results
Mesh Import
(f) 2D cutting plane cross the crack at a certain position. The surface effect of aggregate diffusivity difference is clearly presented
(e) 3D contour plot concentration at certain slices across the top crack
Constant Cl- concentration at the top surface

6
match that of coarse aggregates in real concrete materials. A model representing a 12 mm x 12
mm x 12 mm cube of concrete was created, requiring 12 individual particles filled in this
specimen to represent a realistic coarse aggregate size distribution and a coarse aggregate
volume fraction of 18.2%. The matrix is assumed to be mortar. To study the influence of cracks,
one can build various shaped cracks into the virtual concrete model. In constructing the cracked
model, a rectangle crack (100 µm x 3 mm x 12 mm) was built in the specimen at the top surface.
The schematic of the 3-D virtual concrete model is also shown in Figure 4 (a-c), illustrating the
3-D mesh generation, mesh import and COMSOL simulation steps. Figure 4(d-f) schematically
plots the isosurface, sliced concentration, and 2-D cutting plane of the virtual concrete
microstructure simulation results.
3 Transport and binding model
3.1 The basic chloride diffusion equation Usually chloride ions diffuse into concrete from the external environment. The physical model
considered in this study includes diffusion and sorption binding processes, which is a non-steady
state process. Provided that concrete is a semi-infinite homogeneous medium in a saturated state,
the chloride ingress process is often described by Fick’s second law. The one-dimensional
diffusion equation can be expressed as ( art n-Pérez et al. 2000; Yuan et al. 2009):
C CD
t x x
(1)
where C is the chloride concentration and t is time, D is the effective diffusion coefficient and
the concentration is usually expressed in kilograms per cubic meter of concrete.
For the case of one-dimensional diffusion with no binding, negligible initial chloride in the
specimen, and a constant diffusion coefficient D , the following analytical solution for diffusion,
according to Fick’s second law in a semi-infinite media, can be utilized to estimate the
concentration of chloride ions as a function of depth and time (Crank 1979):
,1
2s
C x t xerf
C Dt
(2)
where is the chloride content at the depth at a given time , erf() represents the error
function, is the chloride concentration at the top surface of the concrete, and is the chloride
ion diffusion coefficient in the concrete. In this form, the utility of plotting results as
dimensionless variables, namely vs. √ , is apparent. Equation (2) provides a
convenient analytical solution to evaluate the validity of one-dimensional finite element or finite
difference models for diffusive transport. Additionally, if the chloride concentration necessary to
initiate corrosion at a known depth of reinforcement sx is supplied, along with the concrete
diffusion coefficient and the surface chloride concentration, Equation (2) can be solved to
determine the estimated service life, defined to be the time to achieve this concentration at
depth sx .
7
3.2 Chloride binding capacity Chloride binding is significant to the chloride transport process, and can be an important factor in
predicting the service life of concrete structures. The binding effect does not modify the
equilibrium state chloride diffusion coefficient, since it has no influence on chloride ion flux in
the equilibrium state (Truc et al. 2000). Chloride binding just leads to an increase in the time lag
(Bigas 1994) and thus potentially in the service life. The total chloride content includes free
chloride and bound chloride. According to the conservation of mass equation, the relationship
between total chloride and free chloride can be described by:
total bound freeC C C (3)
where freeC is the free chloride concentration, boundC is the bound chloride concentration, and
totalC is the total chloride concentration.
While the Freundlich, Langmuir, and linear isotherms (Luping and Nilsson 1993), which are
different mathematical forms representing the relation between free and bound, have all been
employed in past studies of chloride binding in concrete, for these simulations, a simple linear
isotherm was utilized to express the relationship between free and bound chlorides at equilibrium
state:
bound freeC C (4)
where α is a fitting parameter, here taken to be equal to 4, as obtained by fitting the experimental
data (30 d and 90 d exposure) for a mortar specimen with no cracks (Bentz et al. 2012). This is
the best fit value for Equation (4) when and are both expressed in units of mol
pore solution. The single isotherm equation was utilized to model the combined effects
of sorption of the chloride ions by the calcium silicate hydrate gel (C-S-H) and other hydration
products, as well as the reaction of these ions with aluminate phases present in the hydrated
cement paste. This sorption binding is implemented in COMSOL Multiphysics by adding a
binding term to the standard diffusion equation, resulting in:
( )bound
CD C k C C
t
(5)
where k represents the sorption rate constant in bulk mortar. Here, the driving force for binding
is the difference between the equilibrium bound chloride and its current value, e.g.
( )boundC C .
The simulation in COMSOL Multiphysics was performed using Equation (5), as implemented in
the Transport of Diluted Species and User Defined ODE Mathematics interfaces; the diffusion
and rate constants are provided in Table 1.
3.3 Boundary and initial conditions Both irregular and regular cracks can influence chloride ingress, since both can be included in a
general microstructure. Both the crack width and depth are important parameters that may
control the diffusion in the numerical simulation. A wider crack provides more high
concentration chloride ions, while a deeper crack provides a longer easy-diffusion channel for
the chloride ions, which affects the chloride concentration gradients within the concrete’s
interior. In reinforced concrete, a deep crack creates an easier way for chloride ions to approach
the rebar surface, causing depassivation and ultimately corrosion. The schematic of applying a
constant chloride concentration at the top surface of the two 3-D cracked microstructures are
shown in Figure 3(c) and Figure 4(c), respectively. Employing a constant concentration chloride
source fixed at the sample top surface, we simulated a ponding test of chloride ingress. For
8
chloride transport in both of the two models, the top surface of the specimen was kept at a
constant concentration of 1170 mol/m3. The other surfaces were assumed to be impermeable,
experimentally by using an epoxy layer coating, designed to block chloride diffusion during the
measurement. Therefore, we specified a zero flux boundary condition at the sample bottom and
side surfaces. Since binding only takes place within the mortar/concrete part, no binding takes
place within the crack area. The initial concentration in the crack was set to 1170 mol/m3, the
constant ponding value, because the concentration in the crack will be quickly made equal to the
ponding value via convection when the solution initially fills the crack. The concrete or mortar
microstructure can have a strong influence on the chloride concentration distribution. To study
the diffusion effects of each particular phase, a different chloride diffusivity was assigned to
different phases in both of the microstructures. There are bulk mortar, voids, and crack phases in
the X-ray CT microstructure, while the spherical harmonic-based microstructure contains bulk
mortar, non-porous (no diffusion) aggregates, and crack phases. The initial bound chloride
contents in both crack and matrix are zero, since the chloride ions do not bind until they
penetrate into the concrete. It is assumed that the aggregate is free of binding effects, so, the
binding effect only takes place in mortar region.
Table 1 Parameters used in COMSOL simulations
Parameter Calibrated value
Diffusion coefficient of bulk mortar 6x10-11
m2/s
Sorption rate constant in bulk mortar 3x10⁻⁷
s-1
Diffusion coefficient in crack 2x10⁻⁹
m2/s
Diffusion coefficient in voids 0.001 m2/s
Diffusion coefficient in non-diffusive aggregates 0.001 m2/s
α parameter in linear isotherm 4
External chloride concentration (6 % NaCl) 1170 mol/m3
Assumed porosity of mortar 0.1828
The parameters used in the COMSOL Multiphysics simulations, as obtained by calibration
against an existing experimental data set for cracked mortars (Yaman et al. 2008), are
summarized in Table 1. The calibration results are presented in work by Bentz et al. (Bentz et al.
2012). To analyze chloride ion diffusion and the resulting concentration profile, the COMSOL
Multiphysics package implements the UMFPACK direct solver. Therefore, COMSOL analyzed
the diffusion equation discussed in the model section, and coupled this with the binding equation
for the dependence of binding rate on concentration. The time step used was 0.01 s for a total
simulation time of 30 d.
4 Results
4.1 Micro-XRF technique measurement validation Valuable information for model validation was obtained by comparison of COMSOL
calculations with µXRF measurement data for the following experiment. We prepared an
experimental test with chloride ponding on the mortar specimen surface. For the purpose of
blocking the chloride from the bottom and side surfaces, an epoxy layer was coated on all
surfaces of the sample, except the top surface. Then a salt solution at a constant concentration

9
(a) Micro-XRF measurement plot for chloride (b) 2-D chloride ingress contour
Figure 5 Micro-XRF measurement result of chloride concentration contour plot and the 2-D chloride ingress simulation contour comparison
was fixed at the surface for 30 days, driving the chloride ions into the sample. The μXRF
technique rapidly measures the elemental composition of a sample by irradiating it with a thin
beam of X-rays without disturbing the sample. Using μXRF, we could detect the chlorine
concentration on the concrete sample as a function of spatial location with a resolution of about
20 µm.
The chloride concentration within an exposed mortar cube was measured following a previously
established protocol (Bentz et al. 2009). When the chloride ponding test finished, the cubic
sample was broken into half and the micro-XRF technique used to measure the chloride
concentration profile of the broken surface, without requiring any polishing or other specimen
preparation. In Figure 5, the origin is taken at the top left corner, with the X-axis running
horizontally increasing to the right and the X-axis vertically, with Z increasing in the downward
direction. The slices were 25 mm wide and 17 mm high. The relevant chloride concentration was
determined from chloride ion profile measurements obtained on the specimen, as shown in
Figure 5(a). Micro-XRF measurements were obtained along the Z at certain values of X. The top
surface crack shown as a black triangle is located at the upper part of the specimen. It is seen that
black areas, representing pores, voids, or low diffusivity aggregates, of different sizes are located
throughout the µXRF chloride image, because the chloride ions diffuse much less in those parts
than in the cement paste. The white/light yellow represents the higher concentrations, while the
dark red depicts lower concentrations. The profile changes gradually from the top to the bottom
surface. To obtain the 2-D mesh, the 2-D image data analysis technology was used on the micro-
XRF image to create an appropriate triangular mesh. Employing the diffusion and binding
parameters shown in Table 1, COMSOL simulation results depicted in Figure 5(b) shows good
agreement with the micro-XRF measurement. This implies a reasonably good solution of the
diffusion and binding physical model and a validation of the parameters in Table 1.
10
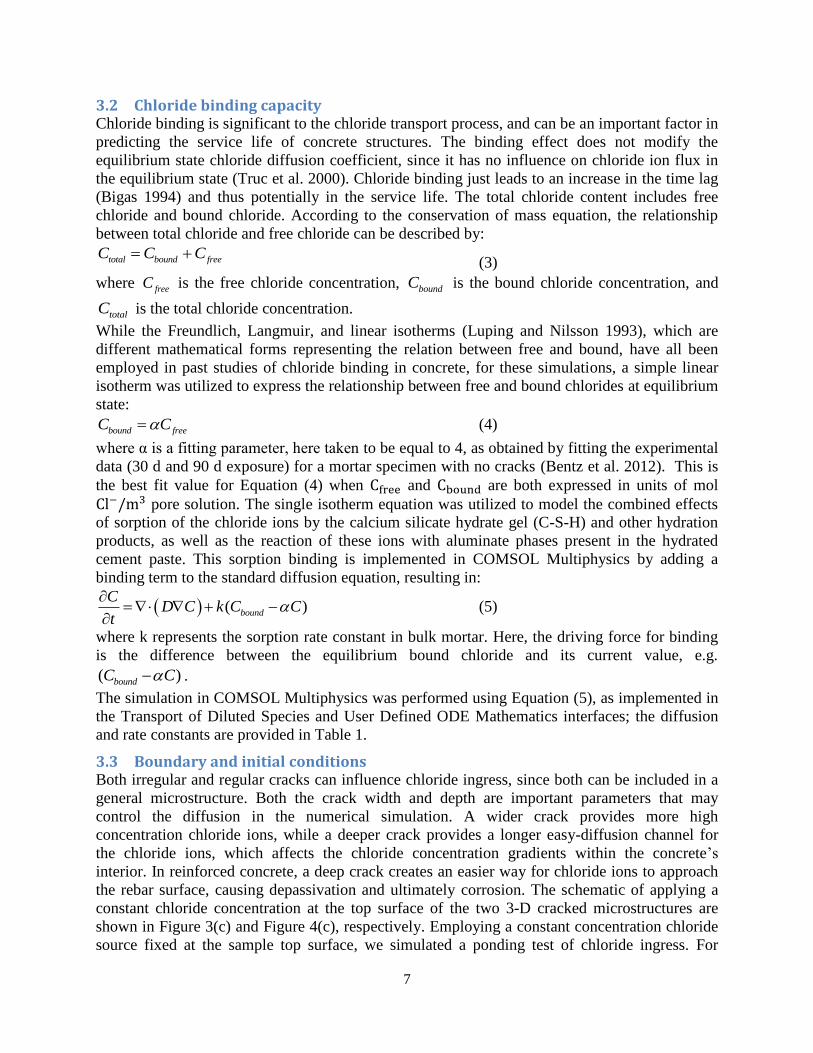
Figure 6 The concentration value at cutting line along X=11.7, 12.7, and 20.0 mm of 30 days
To compare the crack effect on the concentration gradient distribution, vertical lines located at
three different values of X were made to plot the simulation results. Figure 6 gives the plotted
simulation results of these concentration profiles. The highest curve shows the data at X=11.7
mm, which is right along the crack surface. While away from the crack surface, the other two
curves at X=12.7 mm and X=20 mm show that the concentration curve gradually drops down as
distance increases, which shows that the crack serves as an accelerated path for chloride ion
diffusion. It is noted that two abrupt steps appear in the middle curve (X=12.7 mm), representing
the numerical path traversing across the non-diffusive aggregates in the sample. The abrupt steps
shown in the other two curves (X=11.7 mm and X=20 mm) also show this non-diffusive
aggregate effect. It is also noteworthy that the chloride concentration in the µXRF measurement
image is not exactly consistent with the modeling contour, especially at the areas along both side
surfaces and the bottom surface. That was because the epoxy coating surface employed in this
first study was found to not completely block the chloride ingress in the real specimens. So
chloride ion diffusion from the sides and bottom can be seen in Figure 5(a).
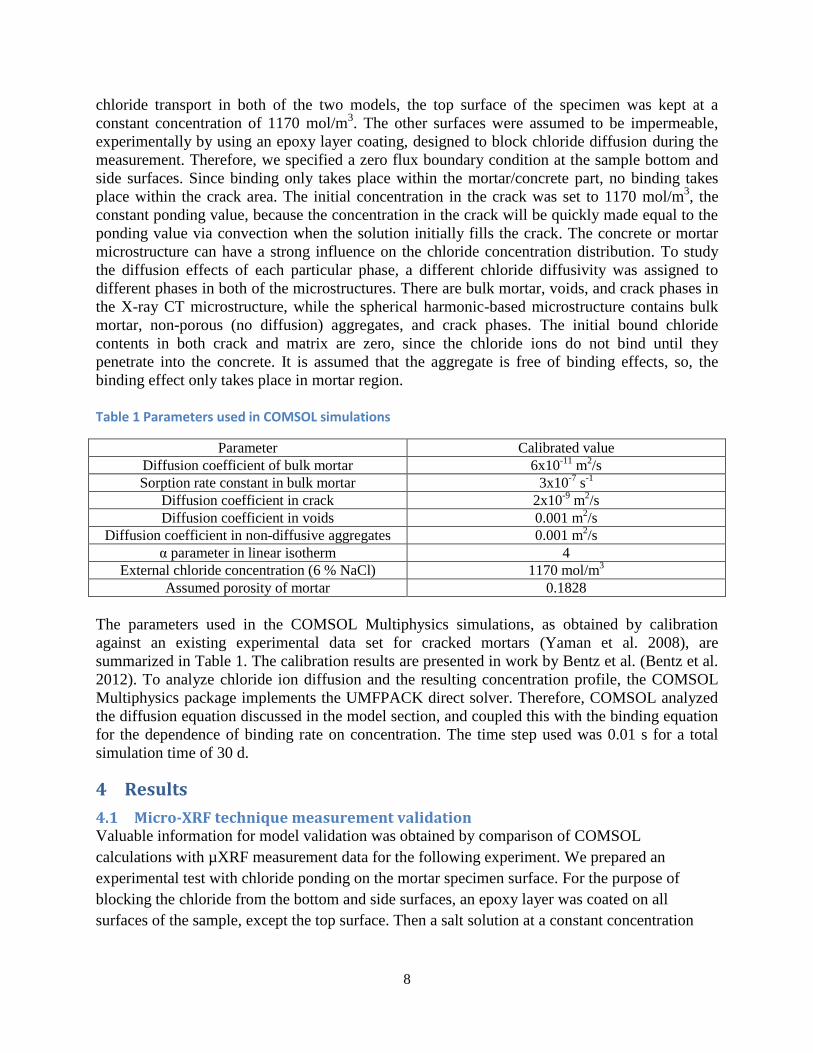
4.2 X-ray CT microstructure
Figure 7 Concentration contour plot of 3-D X-Ray image-based model at 30 day
For the 3-D X-ray CT microstructure simulation, bulk mortar, voids, and crack phases were
considered. Using the validated diffusion and binding parameters listed in Table 1, the
concentration contour plot at 30 days is shown in Figure 7. Since the constant concentration
0
200
400
600
800
1000
1200
0 5 10 15
Co
nce
ntr
atio
n (
mo
l/m
3 )
Depth along specimen (mm)
X=11.7 mm
X=12.7 mm
X=20.0 mm

11
boundary condition was applied on the top surface, there is a higher concentration in the upper
part, while exhibiting a lower value at the bottom. The crack effect can also be seen from the
contour plot. This is a roughly V-shape irregular crack, although the shapes of cracks in real
concrete structures can vary widely. It has a sharp crack tip, but the crack mouth is an open
entrance for chloride ions at the surface. Since the chloride ingress is a slow process, the chloride
concentration profile, shown in Figure 7, at the vicinity of crack tip has a sharp front and changes
smoothly which is in accord with the experimental observations, as illustrated in Figure 5(a).
(a) 2-D cutting surface at Y = 5 mm (b) 3-D sliced surfaces
Figure 8 Concentration contour plot of 3-D X-Ray image-based mortar model simulation result at 30 days
Figure 8 illustrates the concentration contour plot for X-ray CT-based simulation results, where
(a) shows the 2-D slice cutting surface at Y=5 mm and (b) depicts sliced surfaces transverse to
the crack length. From Figure 8, we can see that crack has an obvious effect on the concentration
profile serving as an ingress channel for chloride ions. These figures provide a qualitative means
to model validation.
Figure 9 Concentration profile along the crack depth, the straight cutline arranged from the closest to the farthest away from the crack area, the cutting plane at the place Y=20 mm with cutting line (X=18 mm, 20 mm, 22 mm, 26 mm, Z= cross depth)
To compare the crack effect on the concentration gradient distribution, data was sampled at four
fixed values of X direction (X=18 mm, 20 mm, 22 mm, and 26 mm). Figure 9 shows the plotted
0
200
400
600
800
1000
1200
0 2 4 6 8 10 12 14 16 18
Co
nce
ntr
atio
n (m
ol/
m3)
Depth along specimen (mm)
X = 18 mm
X = 20 mm
X = 22 mm
X = 26 mm
12
simulation results of concentration profiles along the sample depth at these four locations as a
function of z or the depth of penetration. The highest curve was taken at X =18 mm, which is
close to the crack surface. It is observed that a peak appears at three mm depth, which shows a
sharp diffusivity difference between the crack and mortar phases. While away from the crack
surface (see the other three curves at X= 20 mm, 22 mm, and 26 mm), the concentration curves
gradually decrease as the depth increases, typical of a Fickian diffusion behavior. Although a
non-diffusive void phase was considered in this simulation, it did not much affect the chloride
concentration profile due to the small size and limited number of voids in the X-ray
microstructure. Since we do not account for the non-diffusive aggregate phase, the mortar is
considered a uniform phase and individual aggregate is not recognized.
4.3 Virtual concrete microstructure To explore the diffusivity difference between aggregate and cement paste, the virtual concrete
microstructure was also simulated in the COMSOL Multiphysics package. As listed in Table 1, a
smaller diffusivity value was given to the aggregate, while a much larger value was used in the
mortar matrix. The simulation was run with a constant concentration boundary condition at the
top surface, the same as in the X-ray CT microstructure. After a simulated 30 d period, the
chloride ingress into the virtual concrete sample (12 mm x 12 mm x 12 mm cube) is shown in
Figure 10. It can be seen from the sliced contour (a) and the iso-surface (b) that aggregates with
low diffusivity result in low concentration values. The diffusion gradient can also be seen from
the top to bottom, which is similar to the X-ray CT microstructure simulation. The chloride
concentration contour was highly influenced by the built-in crack, leading to a V-shape profile
along the crack depth.
(a) Sliced concentration contour (b) Isosurface concentration
(c) 2-D concentration contour at a cutting plane (Y=5) (d) Concentration profile along the crack depth

13
Figure 10 Concentration contours of 3-D virtual concrete model simulation result, shown in sliced contour, isosurface and 2-D cutting surface, and overall profile
In addition to the 3-D overall concentration profile shown in Figure 10 (d), we also made a 2-D
cutting slice across the crack at a certain position (X = 5 mm), illustrated in Figure 10(c). The
chloride concentration changes sharply at the aggregate surface, as the low diffusivity aggregate
is clearly presented. The dense iso-surface curve at the aggregate surface shows a very sharp
concentration change. In regard to the crack effect, it is also observed that the built-in crack leads
to a quick ingress channel of saturated chloride solution. The profile slope changes sharply along
the crack depth, while returning to a flat shape with increasing distance from the crack. To study
the acceleration effect caused by the built-in crack, a sound concrete sample (no crack) was also
simulated by COMSOL. Figure 11 shows the comparison between the sound and the cracked
virtual concrete models. The results are displayed at three different locations at fixed X (X=5
mm, 6 mm, 8 mm) on the cracked sample and at X = 5 mm on the uncracked sample. Comparing
the non-crack and cracked curves, it is observed from Figure 11 that a crack in the concrete has a
severe accelerating effect on the chloride diffusion. The high concentration in the crack (X=5)
demonstrates the effect of the diffusivity difference between the crack and mortar phase. A sharp
concentration difference between the crack and mortar phase is also observed. While away from
the crack surface (see the other three curves at X= 5 mm, 6 mm, and 8 mm), the concentration
curves gradually decrease as the depth increases.
Figure 11 Concentration profile plot at the place Y=5 with cutting line long (X=5 mm, 6 mm, and 8 mm, Z = cross depth), comparing non-cracked specimen at the place Y=5 with cutting line long (X=5 mm, Z = cross depth)
5 Conclusion We presented one μXRF measurement and three examples of chloride ingress simulations. Both
X-ray CT image-based and spherical harmonic based microstructures were successfully applied
to build heterogeneous cracked concrete and mortar models. Chloride ingress processes in these
cracked heterogeneous microstructures were accurately simulated with the COMSOL
Multiphysics package. It was observed that cracks can have an accelerating effect on the chloride
diffusion, while the sorption binding generally retards the chloride penetration (Bentz et al.
0
200
400
600
800
1000
1200
0 2 4 6 8 10 12
Co
nce
ntr
atio
n (m
ol/
m3)
Depth along specimen (mm)
X= 5 mm
X = 6 mm
X = 8 mm
no crack

14
2012). In other words, the cracks would act as an accelerator (conductor), while binding would
act as a moderator. Hence, the behavior of chloride transport in cracked concrete media depends
strongly on whether there is a crack and on the inherent binding capability of the concrete.
Confidence in the simulations was gained by comparing to the µXRF measurements.
Experiments carried out to validate numerical models must have clear boundary and initial
conditions, geometry and well defined material properties. As concerns the image-based µXRF
measurements, all such requirements are met. The real microstructure of the 2-D µXRF image
was accounted for in the simulation and the simulation result shows good agreement with the
micro-XRF measurement. Hence, the chloride transport mathematical descriptions and image-
based cracked concrete microstructures were validated in terms of the ability to reproduce the
natural chloride ingress processes.
We have thus demonstrated that using the COMSOL package for the simulation of transport and
binding of chloride ions in cracked concrete produces interesting results, validated by micro-
XRF experiment, and thus is useful for the analysis of chemical ingress in fractured concrete.
References Bentz, D., Garboczi, E., Lu, Y., Martys, N., Sakulich, A., and Weiss, J. (2012). "Modeling of the
Influence of Transverse Cracking on Chloride Penetration into Concrete (submitted to Cement
and Concrete Composites)."
Bentz, D. P., Garboczi, E. J., Bullard, J. W., Ferraris, C. F., and Martys, N. S. "Virtual testing of cement
and concrete." Proc., Significance of Tests and Properties of Concrete and Concrete-Making
Materials, ASTM STP 169D
Bentz, D. P., Peltz, M. A., Snyder, K. A., and Davis, J. M. (2009). "VERDiCT: Viscosity Enhancers
Reducing Diffusion in Concrete Technology." Concrete International, 31(1), 31-36.
Bigas, J. P. (1994). "La diffusion des ions chlore dans les mortiers." Ph.D. thesis, LMDC, Toulouse,
France.
Bullard, J. W., and Garboczi, E. J. (2006). "A model investigation of the influence of particle shape on
portland cement hydration." Cement and Concrete Research, 36(6), 1007-1015.
Bullard, J. W., and Stutzman, P. E. (2006). "Analysis of CCRL proficiency cements 151 and 152 using
the virtual cement and concrete testing laboratory." Cement and Concrete Research, 36(8), 1548-
1555.
Crank, J. (1979). The mathematics of diffusion, Oxford University Press, Oxford, [Eng].
Garboczi, E. J. (2002). "Three-dimensional mathematical analysis of particle shape using X-ray
tomography and spherical harmonics: Application to aggregates used in concrete." Cement and
Concrete Research, 32(10), 1621-1638.
Janssens, K., Vekemans, B., Vincze, L., Adams, F., and Rindby, A. (1996). "A micro-XRF spectrometer
based on a rotating anode generator and capillary optics." Spectrochimica Acta Part B-Atomic
Spectroscopy, 51(13), 1661-1678.
Kwon, S. J., Na, U. J., Park, S. S., and Jung, S. H. (2009). "Service life prediction of concrete wharves
with early-aged crack: Probabilistic approach for chloride diffusion." Structural Safety, 31(1), 75-
83.
Lu, Y., and Garboczi, E. "Bridging the gap between VCCTL based CAD and CAE using STL files."
ASCE Journal of Computing in Civil Engineering (under review).
Luping, T., and Nilsson, L.-O. (1993). "Chloride binding capacity and binding isotherms of OPC pastes
and mortars." Cement and Concrete Research, 23(2), 247-253.
15
Marsavina, L., Audenaert, K., Schutter, G., Faur, N., and Marsavina, D. (2009). "Experimental and
numerical determination of the chloride penetration in cracked concrete." Construction and
Building Materials, 23(1), 264-274.
art n-Pérez, B., Zibara, H., Hooton, R. D., and Thomas, M. D. A. (2000). "A study of the effect of
chloride binding on service life predictions." Cement and Concrete Research, 30(8), 1215-1223.
Pan, T., and Lu, Y. (2012). "Stochastic Modeling of Reinforced Concrete Cracking due to Nonuniform
Corrosion: FEM-Based Cross-Scale Analysis." JOURNAL OF MATERIALS IN CIVIL
ENGINEERING, 24(6), 698-706.
Perko, J., Seetharam, S., and Mallants, D. "Verification and validation of flow and transport in cracked
saturated porous media." Proc., The Proceedings of 2011 COMSOL Conference in Stuttgart.
Qian, Z. (2012). "Multiscale Modeling of Fracture Processes in Cementitious Materials."PhD thesis, Delft
University of Technology.
Richter, M., Moenickes, S., Richter, O., and Schröder, T. "The Soil as a Bioreactor: Reaction-Diffusion
Processes and Biofilms." Proc., The Proceedings of 2011 COMSOL Conference in Stuttgart.
Truc, O., Ollivier, J. P., and Carcassès, M. (2000). "A new way for determining the chloride diffusion
coefficient in concrete from steady state migration test." Cement and Concrete Research, 30(2),
217-226.
Yaman, R. Z. G. and Ahmaran, M. (2008). "Influence of transverse crack width on reinforcement
corrosion initiation and propagation in mortar beams." Canadian Journal of Civil Engineering,
35(3), 236-245.
Yuan, Q., Shi, C., De Schutter, G., Audenaert, K., and Deng, D. (2009). "Chloride binding of cement-
based materials subjected to external chloride environment – A review." Construction and
Building Materials, 23(1), 1-13.
Yue, Z. Q., Chen, S., and Tham, L. G. (2003). "Finite element modeling of geomaterials using digital
image processing." Computers and Geotechnics, 30(5), 375-397.
Zhang, S., Saxena, N., and Barthelemy, P. "Poromechanics Investigation at Pore-scale Using Digital Rock
Physics Laboratory." Proc., The Proceedings of 2011 COMSOL Conference in Stuttgart.
Zhihui, S., Garboczi, E. J., and Shah, S. P. (2007). "Modeling the elastic properties of concrete
composites: Experiment, differential effective medium theory, and numerical simulation."
Cement and Concrete Composites, 29(1).
Recommended