MODELING AND SIMULATION OF LOW TEMPERATURE PLASMA
DISCHARGES Michael A. Lieberman
University of California, Berkeley [email protected]
DOE Center on Control of Plasma Kinetics
Annual Meeting May 2015
Download this talk: http://www.eecs.berkeley.edu/~lieber
DOE Plasma Science Center Control of Plasma Kinetics

LOW PRESSURE DISCHARGES
• 1D and 2D particle-in-cell (PIC) kinetic simulations • 2D bulk-fluid/analytic-sheath simulations • Theory Motivations: plasma processing of materials; plasma thrusters
DOE Plasma Science Center Control of Plasma Kinetics
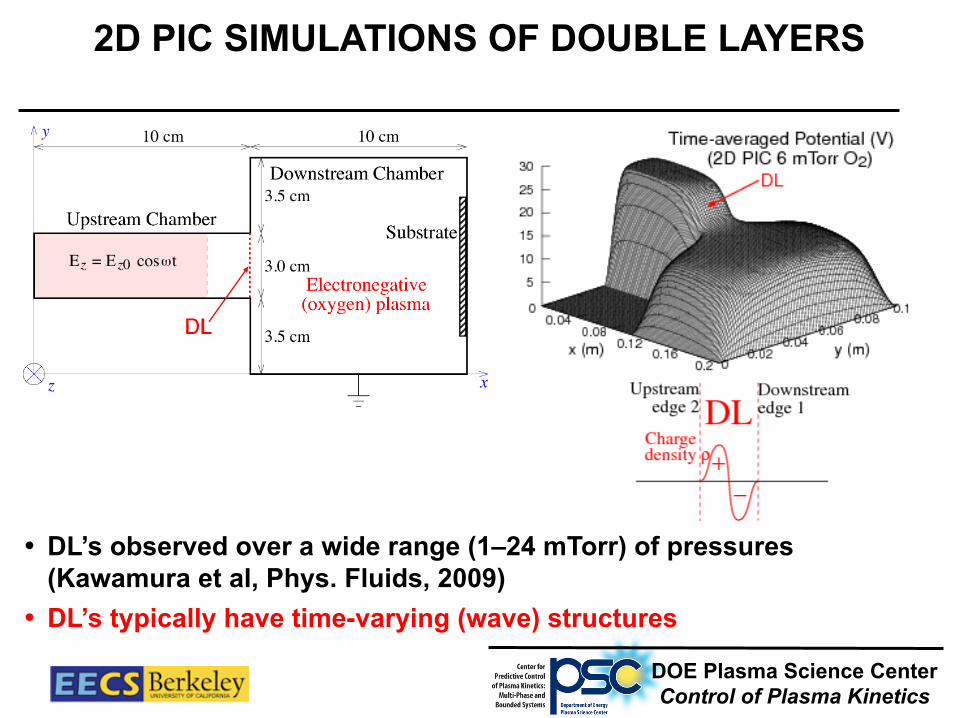
2D PIC SIMULATIONS OF DOUBLE LAYERS
• DL’s observed over a wide range (1–24 mTorr) of pressures (Kawamura et al, Phys. Fluids, 2009)
• DL’s typically have time-varying (wave) structures DOE Plasma Science Center Control of Plasma Kinetics
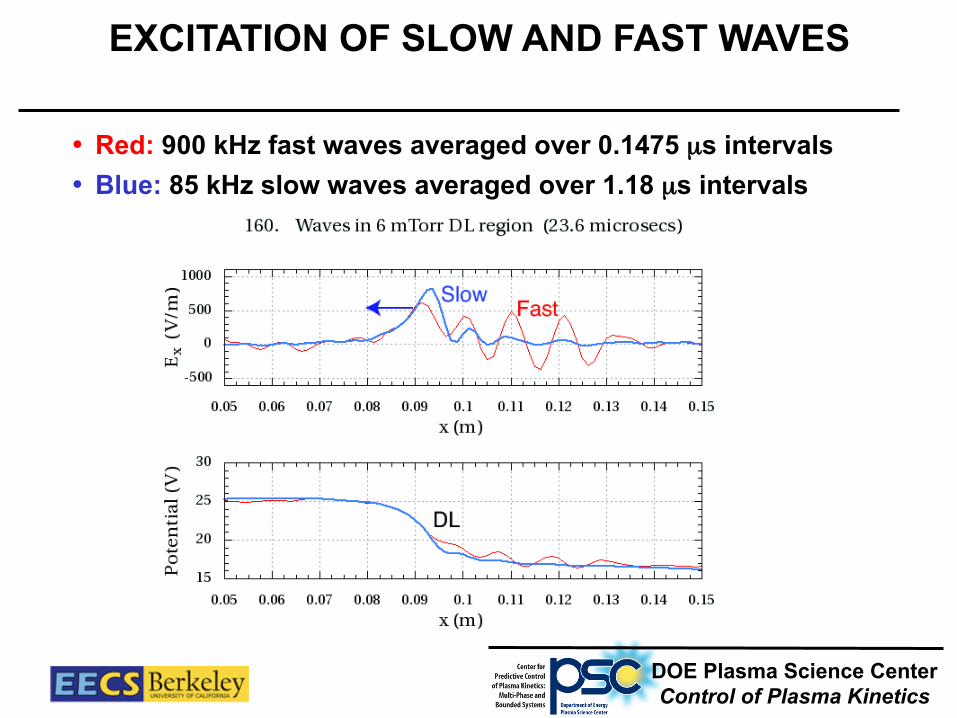
EXCITATION OF SLOW AND FAST WAVES
• Red: 900 kHz fast waves averaged over 0.1475 µs intervals • Blue: 85 kHz slow waves averaged over 1.18 µs intervals
DOE Plasma Science Center Control of Plasma Kinetics

KINETIC THEORY OF UNSTABLE WAVES
• Waves produce 20% oscillations in DL potential and position
• Electron and ion kinetic effects are important
• Most unstable slow wave at λ = 0.7 cm at 173 kHz (PIC simulation gives λ = 1 cm at 85 kHz)
• Fast wave weakly damped at λ=0.7 cm; excitation from non-uniformities and nonlinearities
(Kawamura et al, JAP 2010)
DOE Plasma Science Center Control of Plasma Kinetics

2D BULK-FLUID/ANALYTIC-SHEATH MODELS
• Inductive reactor (Malyshev and Donnelly, 2000–01)
• Electromagnetic field solve • Fluid bulk plasma model • Analytical sheath model • Flow model of reactive gas • Commercial software (COMSOL)
(Kawamura et al, PSST 2012)
DOE Plasma Science Center Control of Plasma Kinetics
• Low density capacitive (E-mode) • High density inductive (H-mode) • Attaching gas negative ions
E/H instability

E/H MODE TRANSITION IN CHLORINE
• Plasma resistance Re versus ne as Irf is varied
• A “gap” occurs between Irf = 7.5 and 8 A
DOE Plasma Science Center Control of Plasma Kinetics
• Measurements at 10 mTorr Cl2 show “gap region”
• Previous measurements (many) and global models (many) indicate instability
• First calculation of E/H instability in fluid simulations
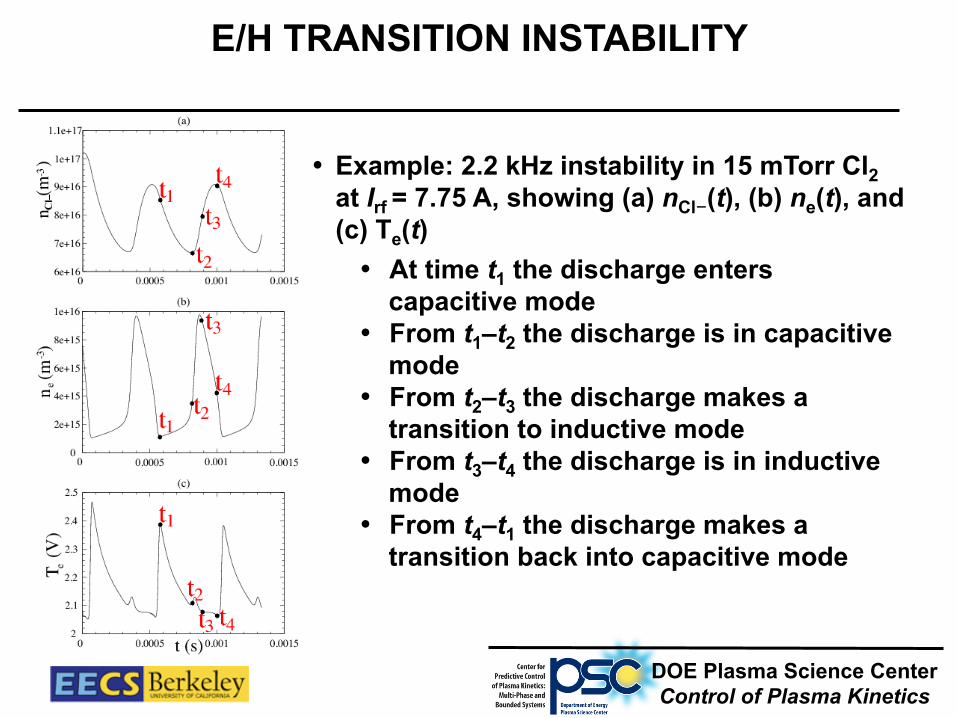
E/H TRANSITION INSTABILITY
• Example: 2.2 kHz instability in 15 mTorr Cl2 at Irf = 7.75 A, showing (a) nCl-(t), (b) ne(t), and (c) Te(t)
• At time t1 the discharge enters capacitive mode
• From t1–t2 the discharge is in capacitive mode
• From t2–t3 the discharge makes a transition to inductive mode
• From t3–t4 the discharge is in inductive mode
• From t4–t1 the discharge makes a transition back into capacitive mode
DOE Plasma Science Center Control of Plasma Kinetics

ATMOSPHERIC PRESSURE DISCHARGES
• 1D particle-in-cell (PIC) kinetic simulations • 1D bulk-fluid/analytic-sheath hybrid simulations • Theory Motivations: biomedical plasmas; plasma processing of materials
DOE Plasma Science Center Control of Plasma Kinetics

DISCHARGE CONFIGURATION
• Atmospheric pressure • He or Ar with trace reactive gases • 1D plane-parallel geometry (~0.1–1 mm gap) • RF-driven (6.78–54.24 MHz)
DOE Plasma Science Center Control of Plasma Kinetics

TWO-TEMPERATURE HYBRID DISCHARGE MODEL
• Numerical solution of particle balances for each species • dnj/dt = Gj – Lj • Gj = volume creation rate (2-body, 3-body and surfaces) • Lj = volume loss rate (2-body, 3-body and surfaces)
• Numerical solution of Penning/secondary electron multiplication in sheaths ⇒ hot Th(t), nh(t)
• Analytical solutions of • the discharge dynamics (homogeneous model) • the time-varying warm Te(t) • the effective rate coefficients <K>
• Coupling the analytical and numerical solutions • ⇒ fast solution of the discharge equilibrium (Kawamura et al, PSST 2014; Ke Ding et al, JPD 2014)
DOE Plasma Science Center Control of Plasma Kinetics
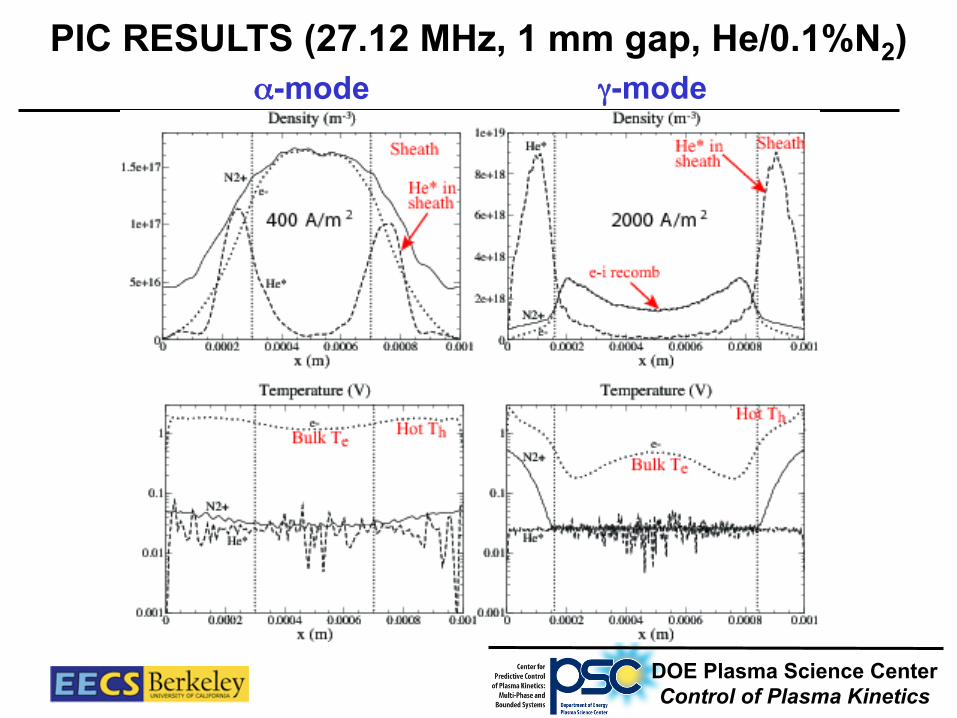
PIC RESULTS (27.12 MHz, 1 mm gap, He/0.1%N2) α-mode
DOE Plasma Science Center Control of Plasma Kinetics
γ-mode

He/0.1%N2 HYBRID – PIC COMPARISON
27.12 MHz
DOE Plasma Science Center Control of Plasma Kinetics
13.56 MHz

He/H2O ATMOSPHERIC PRESSURE DISCHARGE MODELING
• In an experiment, a 1 cm radius 0.5 mm gap discharge was embedded in a large chamber with fixed H2O concentration
(P. Bruggeman et al, J. Phys. D 43, 012003, 2010)
DOE Plasma Science Center Control of Plasma Kinetics
• In a global model (46 species, 577 reactions), particle and energy balance were solved to determine the discharge equilibrium
(D.X. Liu et al, PSST 19, 025018, 2010) • Discharge depletes external H2O density, reaction products diffuse
to axial and radial walls, sheaths cause α-to-γ transition
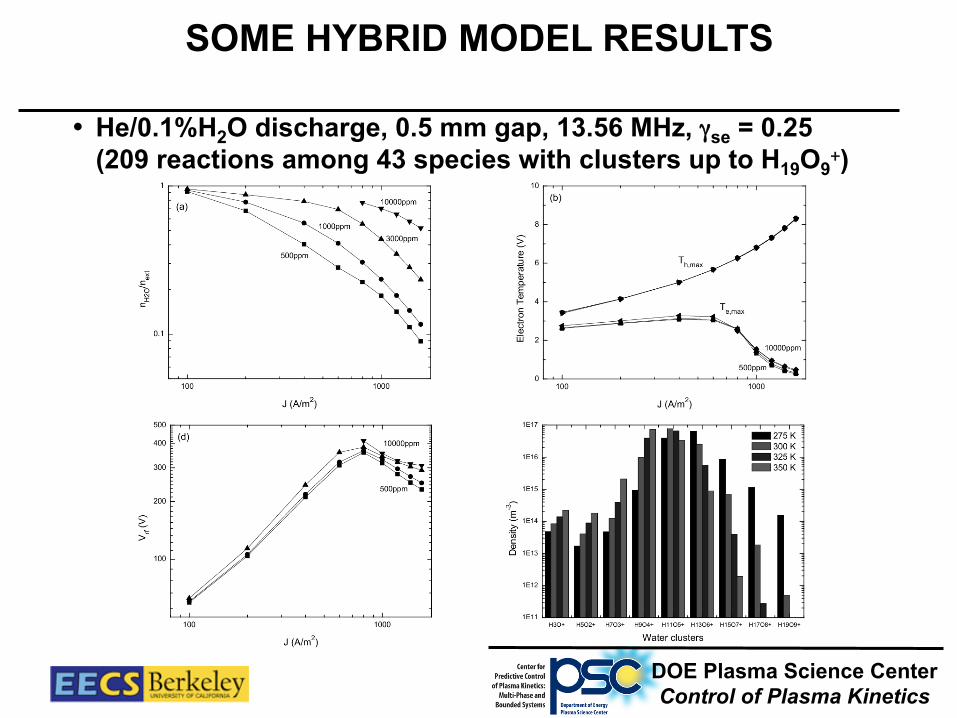
SOME HYBRID MODEL RESULTS
• He/0.1%H2O discharge, 0.5 mm gap, 13.56 MHz, γse = 0.25 (209 reactions among 43 species with clusters up to H19O9
+)
DOE Plasma Science Center Control of Plasma Kinetics

YEAR 6 RESEARCH
• Low Pressure Discharges • Fast 2D Fluid-Analytical Simulation of Ion Energies and EM
Effects in Multi-Frequency Capacitive Discharges • Electron Heating in Capacitive Discharges • Metastables in Capacitively Coupled Oxygen Discharges • Nonlinear Standing Wave Excitation by Series-Resonance
Enhanced Harmonics in Capacitive Discharges
DOE Plasma Science Center Control of Plasma Kinetics
• Atmospheric Pressure Discharges • Comparison of a Hybrid Model with Experiments in Helium and
Argon Discharges • Reaction Pathways for Bio-Active Species in He/H2O Discharges • Analytic Model of Helium/Trace Gas Penning Discharges • PIC Simulations of He/H2O Plasma Near a Water Interface

CENTRAL PLASMA NONUNIFORMITY IN LOW PRESSURE CAPACITIVE DISCHARGES
• Asymmetric argon capacitive discharge (2.5 cm gap, driven at 60 MHz), showing ne(r)
(Sawada et al, JJAP, 2014)
DOE Plasma Science Center Control of Plasma Kinetics
• Investigate coupling of series-resonance enhanced harmonics of driving frequency to standing waves using a radial transmission line model
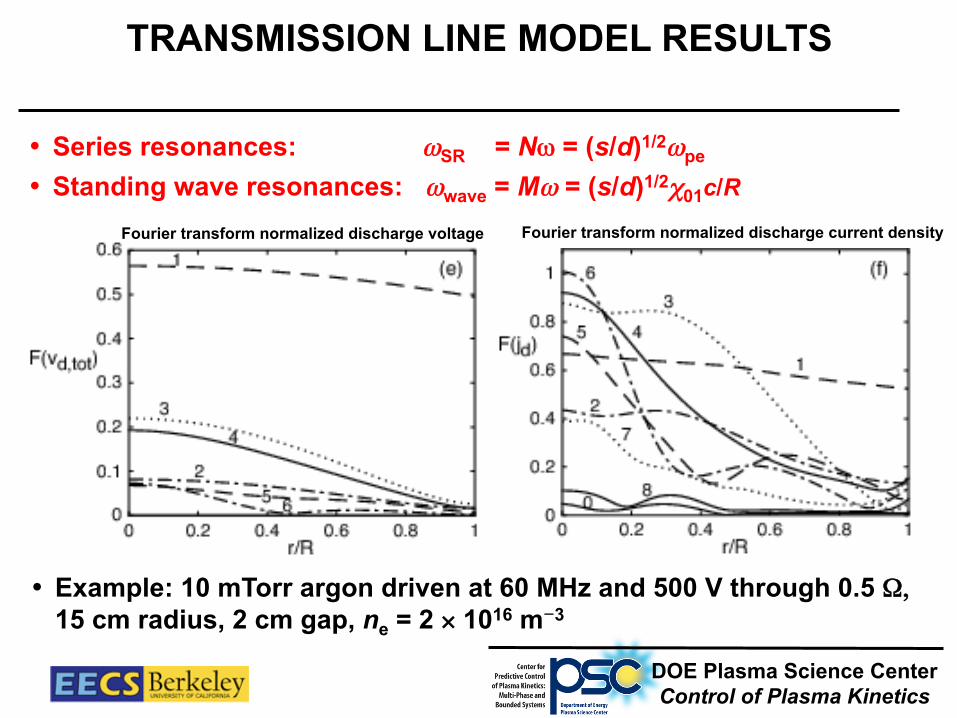
TRANSMISSION LINE MODEL RESULTS
DOE Plasma Science Center Control of Plasma Kinetics
• Series resonances: ωSR = Nω = (s/d)1/2ωpe
• Standing wave resonances: ωwave = Mω = (s/d)1/2χ01c/R
• Example: 10 mTorr argon driven at 60 MHz and 500 V through 0.5 Ω, 15 cm radius, 2 cm gap, ne = 2 × 10¹⁶ m-3
Fourier transform normalized discharge voltage Fourier transform normalized discharge current density

DISCHARGE ELECTRON POWER/AREA
DOE Plasma Science Center Control of Plasma Kinetics
• 10 mTorr argon discharge driven through 0.5 Ω, 15 cm radius, 2 cm gap • Voltage rescaled as ω2Vrf = const to keep ne = 2 × 10¹⁶ m-3
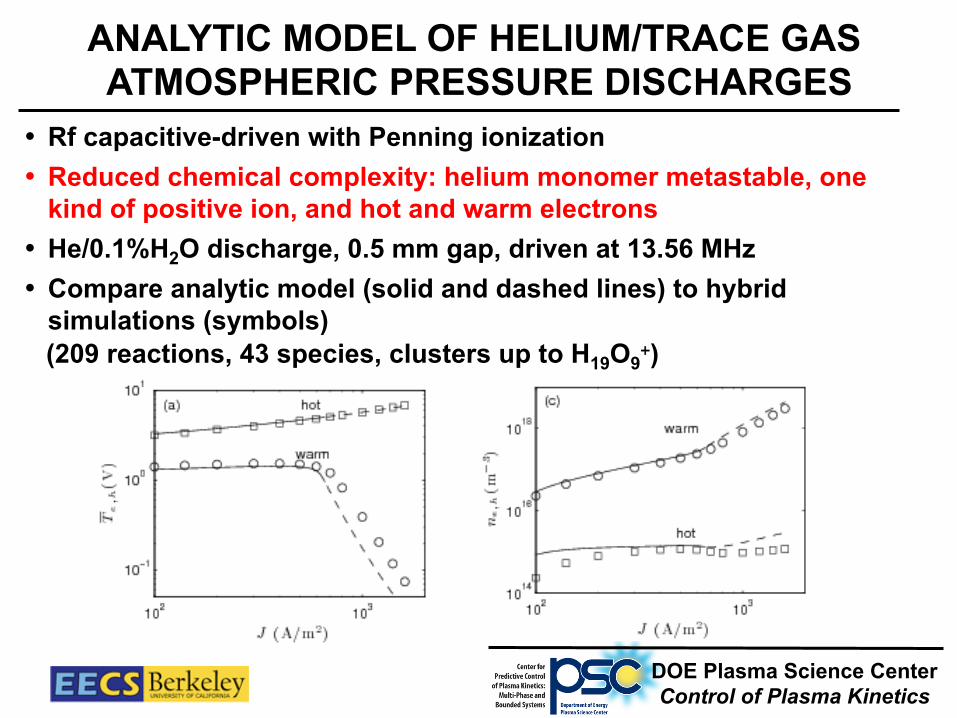
ANALYTIC MODEL OF HELIUM/TRACE GAS ATMOSPHERIC PRESSURE DISCHARGES
DOE Plasma Science Center Control of Plasma Kinetics
• Rf capacitive-driven with Penning ionization • Reduced chemical complexity: helium monomer metastable, one
kind of positive ion, and hot and warm electrons • He/0.1%H2O discharge, 0.5 mm gap, driven at 13.56 MHz • Compare analytic model (solid and dashed lines) to hybrid
simulations (symbols) (209 reactions, 43 species, clusters up to H19O9
+)

1D PIC SIMULATIONS OF ATMOSPHERIC PLASMA NEAR A WATER INTERFACE
DOE Plasma Science Center Control of Plasma Kinetics
• WHAT ARE THE OSCILLATIONS IN THE BULK?
• 1 mm gap He/2%H2O atmospheric pressure discharge in series with an 0.5 mm H2O liquid layer and a 1 mm quartz dielectric
• Hybrid model used to determine the most important species and reactions used in the PIC simulations of the discharge
• Example of 600 V at 27.12 MHz, γse = 0.15
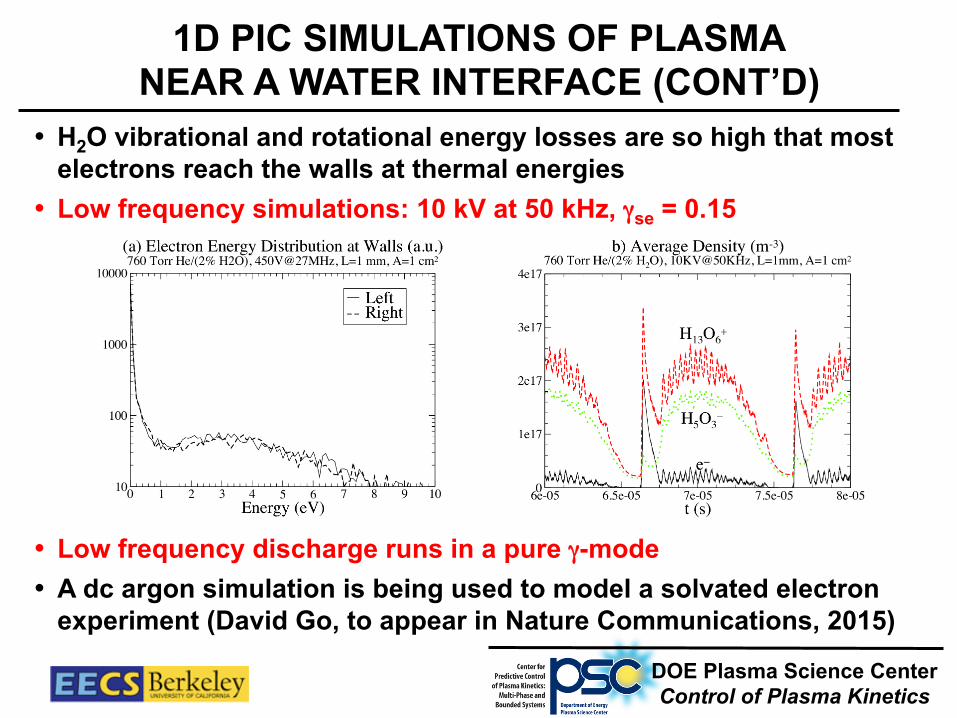
1D PIC SIMULATIONS OF PLASMA NEAR A WATER INTERFACE (CONT’D)
DOE Plasma Science Center Control of Plasma Kinetics
• H2O vibrational and rotational energy losses are so high that most electrons reach the walls at thermal energies
• Low frequency simulations: 10 kV at 50 kHz, γse = 0.15
• Low frequency discharge runs in a pure γ-mode • A dc argon simulation is being used to model a solvated electron
experiment (David Go, to appear in Nature Communications, 2015)
Recommended