Modeling and Optimization of Mobile SignalStrength in challenging Atmospheric ConditionsShilpa Choudhary ( [email protected] )
G. L. Bajaj Institute of Technology and Management https://orcid.org/0000-0003-2024-8057Abhishek Sharma
GL Bajaj Institute of Technology and ManagementKashish Srivastava
GL Bajaj Institute of Technology and Management
Research Article
Keywords: Received Signal Strength, Response surface methodology, LTE, 3G, 2G.
Posted Date: March 15th, 2021
DOI: https://doi.org/10.21203/rs.3.rs-295295/v1
License: This work is licensed under a Creative Commons Attribution 4.0 International License. Read Full License

Modeling and Optimization of Mobile Signal Strength in challenging
Atmospheric Conditions
Shilpa Choudhary1, Abhishek Sharma2, Kashish Srivastava3
1,3Department of Electronics and Communication Engineering, G L Bajaj Institute of Technology
and Management, Greater Noida, UP, India
2Department of Mechanical Engineering, G L Bajaj Institute of Technology and Management,
Greater Noida, UP, India
Corresponding author email id: [email protected]
Graphical Abstract
Abstract
For the network planning in the field of telecommunication networks received signal strength
plays an important role. The received signal strength gets affected due to the varying
environment condition through which the signal propagates and it also depends on the distance
between the location of signal transmitter and the receiver. So complete information about these
parameters are very much requires for proper mobile network planning. By keeping all these
challenges in mind, this study was aimed to determine the received signal strength for Long-
Term Evolution (LTE), Second Generation (2G) and Third Generation (3G) wireless
technologies with challenging environment conditions. All the experiments were conducted at
Lajpat Nagar residential area which is located in New Delhi. During the experiments received
signal strength for all the three above mentioned wireless technologies were monitored with

respect to varying environment conditions (Temperature, Relative Humidity and Air quality
index for Particulate Matter 2.5) and distance from the base station. Later the optimization of
received signal strength was carried out by using response surface methodology. Measurement
results showed that Second Generation (2G) signal strengths was significantly higher than Third
Generation (3G) and Long-Term Evolution (LTE) and the best values obtained for received
signal strength for Long-Term Evolution (LTE), Third Generation (3G) and Second Generation
(2G) were -77.9264dBm, -60.0345dBm and -58.1280dBm respectively. ANOVA results shows
good mathematical modeling between input and output responses.
Keywords – Received Signal Strength, Response surface methodology, LTE, 3G, 2G.
Nomenclature
Temperature TEMP
Received Signal Strength for third-
generation cellular network RSS3G
Relative Humidity RH Response Surface Methodology RSM
Air Quality Index AQI Central composite rotating design CCRD
Distance from Base Station DFBS Long Term Evolution LTE
Received Signal Strength for Long
Term Evolution RSSLTE Third-generation 3G
Received Signal Strength for
second-generation cellular
network RSS2G
Second-generation
Multiple input and multiple output
2G
MIMO
1. Introduction
Mobile plays a vital role in our day to day life from our personal stuff to connecting
people it is required in every dimension of our life. All these devices communicate through radio
waves [1]. The transmitter transmits these radio waves which are being received by the receiver
which operated within a frequency band. The received signal strength of these radio waves is an
important factor to be considered. Telecommunication had a drastic change from analog to
digital communication. There are three main components that are required to setup a
communication system and they are Transmitter, Receiver and the channel between the
two.Transmitter and receiver antenna are important part for the communication and these
channels between them plays the important role to depict the received signal strength. These
channel communication gets affected by various different reasons.There are many types of

obstacles due to which there is a loss of signal strength in the channel which is termed as path
loss. The signal which passes through this channel crosses the troposphere layer of atmosphere
of earth. Our atmosphere consists of several layers one of which is troposphere.It is that layer
which covers the earth region to 16 km from equator and 8 km from pole.This layer is
responsible for the refractivity of the air which plays an important role in signal transmission.
Although there are various other reasons that affect the propagation of waves among which the
varying atmospheric parameters in the transmission channel plays the important role. These
effects are directly or indirectly related with the troposphere layer of the atmosphere. The
refractive index of air in the troposphere and the refractivity of air varies due to the changes in
the temperature, humidity, wind speed, atmospheric pressure etc. In the study of troposphere it
was found that there is a frequent decrease in temperature with rate of 10 0C per km of the
altitude of troposphere [3]. Whereas the speed of the wind is related with the atmospheric
pressure variation in this layer, it does not effects the signal directly it can lead to disconnection
or low rate of data transmission in a network [6]. Due to some factors like refraction as discussed
above, reflection, absorption of the signal in this layer results into propagation loss and it can
also be noted that communication system is sensitive to the transmission losses. Moreover, the
additional losses are due to the Doppler Effect produced by the movement of the mobile user due
to which the base station keeps on changing for every user, resulting in attenuation of the signal
and results in reduced signal strength.
In view of all the above mentioned issues, this research work was focused to study and to
optimize the variation in received signal strength with respect to four major parameters i.e.
varying Temperature, Relative Humidity, user Distance form Base Station and Air
QuantityIndex (AQI) for Particulate Matter (PM2.5). This complete study was carried out for
three different wireless communication technologies i.e. LTE, 3G and 2G technologies.
2. Related Work
Cellphones have become an essential object of use for each and every person in the
world.It is a stepping stone to the digitalization era in which network plays an important role for
utilization of this handset.Sometimes these networks face obstacles due to the environmental
changes affecting the strength of the signal. These atmospheric distraction can be varying
humidity, temperature, wind speed and many more .There are many research works taken place

to study the relation of these atmospheric parameters and the networking system. For instances,
Ofure et al. in their work studied the impact of these parameters on GSM(Global System For
Mobile Communication) in their 19 months of experiment at the Bosso Campus of the Federal
University of Technology, Minna, Nigeria. They found that there is a positive relation between
the signal strength and atmospheric temperature and a negative relation with the humidity in the
range of 0.57 to 0.88 and -0.57 to -0.89 respectively with received strength of GSM signal [1].
Similarly Joseph in his research over atmospheric effect on ultra-high frequency at two location,
one at Cross River State Broadcasting Co-operation (4057'54.7''N, 8019'43.7''E) and in a
residence along Etta-abgor, Calabar (4057'31.7''N, 8020'49.7''E) was measured in which they
found that the signal strength is inversely proportional to atmospheric pressure,speed of the wind
and direction of the flow of the wind [2].Even Chima et al. analyzed the variation of signal
strength due to the effect of temperature and wind speed they practically performed it for five
months of duration at Enugu State University of Science and Technology (ESUT),they studied
the effect of Temperature, Pressure, Relative Humidity And Wind Speed on UHF radio waves
and they found that ducting effect is created in atmosphere due to temperature inversion and thus
effects the radio waves and the wind speed effects the bending properties of waves[3]. Usman et
al. pointed out a very important factor towards this researcher that even though the atmospheric
parameters play an important role in the signal strength but also the location as well as the
weather condition affects the network.In their research they found out that temperature has a
negative relation with the refractive gradient while humidity has a positive relation [4] . Voznak
and Rozhon in their work of over 20 thousand measurement to analyse the effect of atmospheric
parameter on GSM/UTMS signal strength and they explained a decreasing quality of speech in
the correlation between the speech signal and humidity.[5]. Zafar et al. in his work examined the
effect of wind speed humidity as well as temperature over the signal strength which was
measured at East Coast of Peninsular Malaysia and they found that the signal strength decreases
with the increase of humidity and temperature is inversely proportional to it.They performed this
analysis over varying ranges of frequency 382.5 MHz, 945 MHz, 1867.5 MHz and 2160 MHz. It
was observed that high temperature low humid weather as well as high humidity and low
temperature weather condition ,they concluded that below (00C) the temperature have negative
relation when the humidity is high on the signal strength[6]. Eli-Chukwu and Onoh in their
observation on signal strength readings mainly taken for WCDMA networking at Nigeria. They
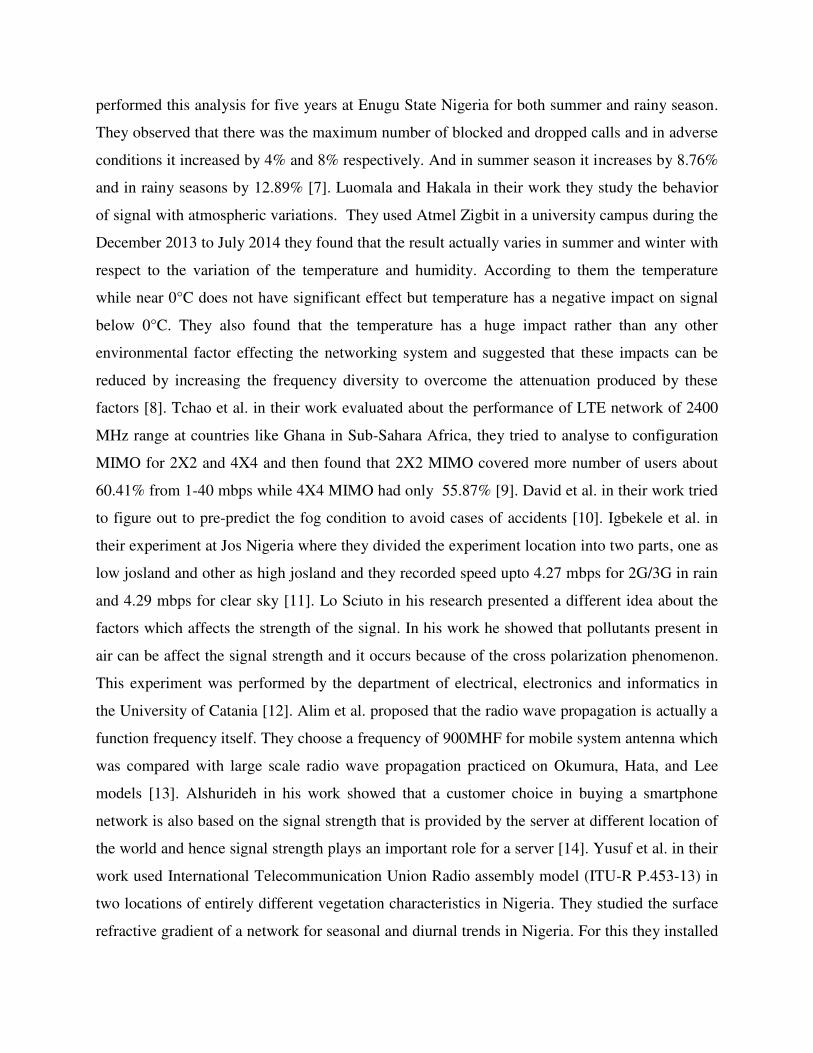
performed this analysis for five years at Enugu State Nigeria for both summer and rainy season.
They observed that there was the maximum number of blocked and dropped calls and in adverse
conditions it increased by 4% and 8% respectively. And in summer season it increases by 8.76%
and in rainy seasons by 12.89% [7]. Luomala and Hakala in their work they study the behavior
of signal with atmospheric variations. They used Atmel Zigbit in a university campus during the
December 2013 to July 2014 they found that the result actually varies in summer and winter with
respect to the variation of the temperature and humidity. According to them the temperature
while near 0°C does not have significant effect but temperature has a negative impact on signal
below 0°C. They also found that the temperature has a huge impact rather than any other
environmental factor effecting the networking system and suggested that these impacts can be
reduced by increasing the frequency diversity to overcome the attenuation produced by these
factors [8]. Tchao et al. in their work evaluated about the performance of LTE network of 2400
MHz range at countries like Ghana in Sub-Sahara Africa, they tried to analyse to configuration
MIMO for 2X2 and 4X4 and then found that 2X2 MIMO covered more number of users about
60.41% from 1-40 mbps while 4X4 MIMO had only 55.87% [9]. David et al. in their work tried
to figure out to pre-predict the fog condition to avoid cases of accidents [10]. Igbekele et al. in
their experiment at Jos Nigeria where they divided the experiment location into two parts, one as
low josland and other as high josland and they recorded speed upto 4.27 mbps for 2G/3G in rain
and 4.29 mbps for clear sky [11]. Lo Sciuto in his research presented a different idea about the
factors which affects the strength of the signal. In his work he showed that pollutants present in
air can be affect the signal strength and it occurs because of the cross polarization phenomenon.
This experiment was performed by the department of electrical, electronics and informatics in
the University of Catania [12]. Alim et al. proposed that the radio wave propagation is actually a
function frequency itself. They choose a frequency of 900MHF for mobile system antenna which
was compared with large scale radio wave propagation practiced on Okumura, Hata, and Lee
models [13]. Alshurideh in his work showed that a customer choice in buying a smartphone
network is also based on the signal strength that is provided by the server at different location of
the world and hence signal strength plays an important role for a server [14]. Yusuf et al. in their
work used International Telecommunication Union Radio assembly model (ITU-R P.453-13) in
two locations of entirely different vegetation characteristics in Nigeria. They studied the surface
refractive gradient of a network for seasonal and diurnal trends in Nigeria. For this they installed

to Automatic Weather System at a height of 3 m at Lagos and Anyigba. They concluded that
monsoon has a direct impact on the signal strength for any network [15]. Fang et al. analysed the
impact of weather condition over the GSM network. They worked on the central weather bureau
at Taiwan. They studied the distance and wind speed affecting received signal strength and
finally concluded that the strength of GSM signal keeps on decreasing as the speed of the wind
or breeze increases [16]. Pooja et al. in their research work concluded that there is a dominating
effect of atmospheric parameters on the received signal strength. For a network they studied the
variation of temperature, humidity, atmospheric pressure over the signal. In the result they found
that temperature is inversely proportional to the signal strength, atmospheric pressure has a
negative impact on the signal and also as there is an increase in the humidity it leads to the
decrease of signal strength for a network [17]. Hanchinal et al. performed a survey to analyse
factors affecting the signal strength path loss in winter season specifically and at a specific
location at different time intervals.They studied different models and concluded from their
respective results for each time interval that there is a major impact of atmospheric parameters in
the path loss for a signal[18]. Guidara et al. researched over a very different idea where they
analysed the impact of atmospheric parameters on the signal strength with the change in the
environment for indoor as well as for outdoor. They found that the signal strength has a positive
relation with relative humidity and for temperature it has a negative relation if the distance
between the transmitter and receiver is more than 5m and positive if the distance is less than or
equal to 4m[19]. Madariaga et al. in their worked showed the feasibility of the mobile signal
strength using crowded data corresponding to the server in Santigo, Chile in their study they
found the effects of gatherings over the signal strength of a system[20]. Dinc and Akan in their
work proposed that the atmospheric ducts have significant effect on the mobile signal system
especially in 2G [21]. Usman et al. in their work experimented about the propagation of
900/1800 MHZ in Bauchi at Nigeria. They showed that Egli and Hata model in appropriate to
use with the network of 900/1800 MHz [22]. Ofure et al. in their work they proposed a model to
read GSM signal strength with varying atmospheric parameter as input [23]. Engiz et al.
compared the signal strength for 2G/3G and 4G networks at a specific route of OndokuzMayis
University (OMU) Kurupelit Campus that is helpful for study of enhancement in different areas
for different mobile networks [24]. Yang et al. studied the effect of troposphere scattering and
the atmospheric duct on signal propagation. They found that over the non-uniform surface

propagation shows long distance co-channel interference as there is a change in weather
condition [25]. Choudhary et al. [26, 27] in their work they optimized the output parameters
using response surface methodology and error between the experimental and optimized results
were found to be within 5%. Apart from this, RSM is a commonly used technique to solve many
industrial challenges. Hamze et al. [28] explored that RSM is a collection of mathematical and
statistical approaches used for simulation and problem solving, where in many running or
process variables affect the response. When experiments conducted to optimize performance and
minimize emissions levels, RSM proved to be very efficient. Ma et al. [29] explaining the key
benefit of the RSM that the nature of RSM-based studies requires fewer tests and is less time-
consuming than a true experimental study. In many research reports, this technique is commonly
used and has been implemented.
From the literature review it was found that much of research work has already been done
to identify the effect of atmospheric parameters on received signal strength (RSS) of wireless
communication technologies and many path loss models have also been proposed but the main
gap which was found in the research is that no one yet have optimized the received signal
strength (for LTE, 3G and 2G technologies) with respect to be the atmospheric variations. So
keeping this aspect in mind this research work was focused for multi objective optimization of
the Received signal strength for LTE, 2G and 3G with respect to varying input parameters like
Temperature-Temp (12°C to 48°C), Relative Humidity – RH (25% to 75%), Distance from Base
Station - DFBS (98m to 300m) and Air Quality index - AQI for PM 2.5 (50 to 500).
Optimization was carried out by using response surface methodology. The RSM-based method
to desirability was used in this research work to refine input variable. For optimization
evaluation by dimensionless desirability effect, Minitab'17 software was used.
3. Materials and Methods
This research work was focused to observe the variation in received signal strength for LTE, 3G
and 2G wireless communication technologies. All these variation were observed between the
time duration from January 2019 to March 2020. This period was selected for the observation
because in this whole duration the extreme variation in the atmospheric parameters like
temperature, Relative humidity and AQI could be observed. All these observations were taken at
Lajpat Nagar (residential area), New Delhi. It is densely populated area with high rise buildings
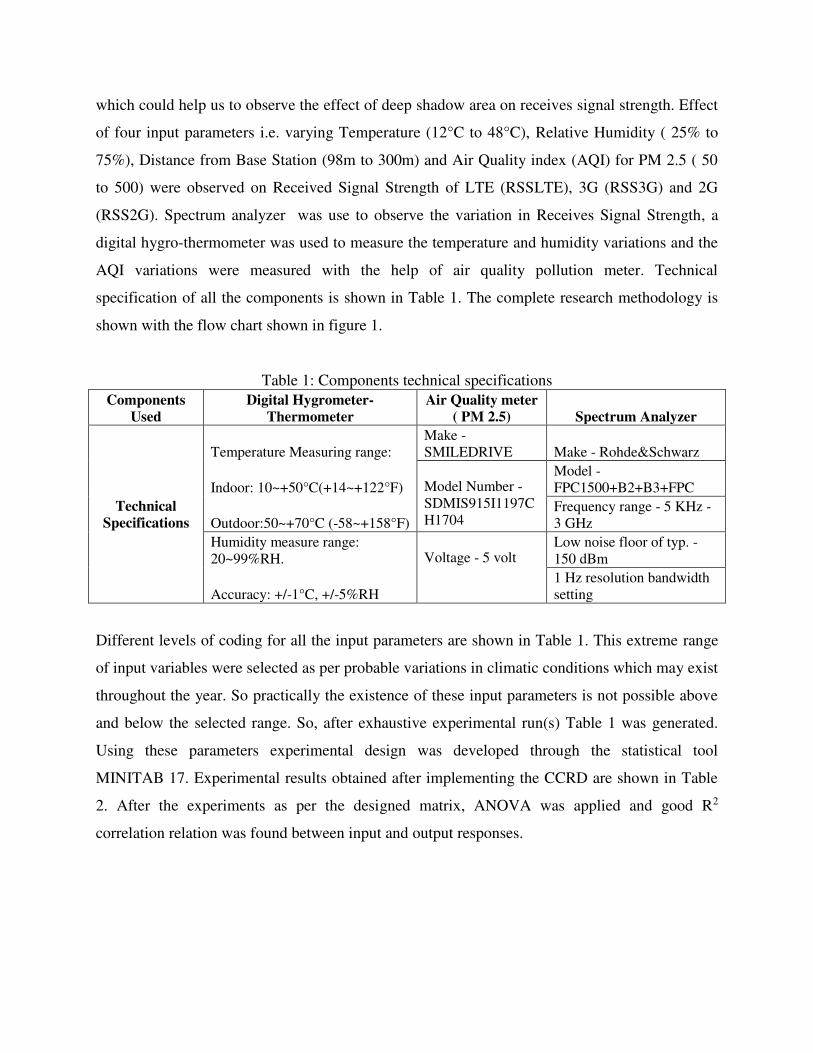
which could help us to observe the effect of deep shadow area on receives signal strength. Effect
of four input parameters i.e. varying Temperature (12°C to 48°C), Relative Humidity ( 25% to
75%), Distance from Base Station (98m to 300m) and Air Quality index (AQI) for PM 2.5 ( 50
to 500) were observed on Received Signal Strength of LTE (RSSLTE), 3G (RSS3G) and 2G
(RSS2G). Spectrum analyzer was use to observe the variation in Receives Signal Strength, a
digital hygro-thermometer was used to measure the temperature and humidity variations and the
AQI variations were measured with the help of air quality pollution meter. Technical
specification of all the components is shown in Table 1. The complete research methodology is
shown with the flow chart shown in figure 1.
Table 1: Components technical specifications
Components
Used
Digital Hygrometer-
Thermometer
Air Quality meter
( PM 2.5) Spectrum Analyzer
Technical
Specifications
Temperature Measuring range:
Make -
SMILEDRIVE Make - Rohde&Schwarz
Indoor: 10~+50°C(+14~+122°F)
Model Number -
SDMIS915I1197C
H1704
Model -
FPC1500+B2+B3+FPC
Outdoor:50~+70°C (-58~+158°F)
Frequency range - 5 KHz -
3 GHz
Humidity measure range:
20~99%RH.
Voltage - 5 volt Low noise floor of typ. -
150 dBm
Accuracy: +/-1°C, +/-5%RH
1 Hz resolution bandwidth
setting
Different levels of coding for all the input parameters are shown in Table 1. This extreme range
of input variables were selected as per probable variations in climatic conditions which may exist
throughout the year. So practically the existence of these input parameters is not possible above
and below the selected range. So, after exhaustive experimental run(s) Table 1 was generated.
Using these parameters experimental design was developed through the statistical tool
MINITAB 17. Experimental results obtained after implementing the CCRD are shown in Table
2. After the experiments as per the designed matrix, ANOVA was applied and good R2
correlation relation was found between input and output responses.

Figure 1. Methodology Flow chart

3.1. RSM Methology
With the help of Response Surface Methodology (RSM) optimum solution can be found. RSM
mathematical modelling is used to access the optimum values of input variables to obtain the
best output and that too with minimum number of tests. This technology is not application
specific and can be utilized in any field. In this work, RSM architecture that is suitable for the
CCRD matrix, which has five stages with respect to the individual factors. The most fruitful and
best among architecture available is the middle composite rotating architecture which is adept by
adding two lab experiment level along each coordinate axis at opposite direction of the origin
and at a distance same to the semi-diagonal of the hypercube of the factorial architecture and
new extreme values (low and high) for each factor added in this architecture. In RSM, the
correlation between the response variable y and the parameters x1, x2, x3.........xn is commonly
represented as.
y = f(x1, x2, x3, x4.........xn) + ε ………(1)
Where x1, x2, x3, and x4.........xn is the input variable and y is the output response needed to boost
it, ε is error or noise found in response y and f is the response surface.
In equation (1), the function f corresponds to the correlation between a response variable
and a factor that is normally unknown. Thus in RSM, the initial step is to find an adequate
approximation between the unknown factor and the response variable. The linear model is the
simplest approximation function (linear model) is used to represent the relationship between a
response variable and the unknown factor, which can be described as follows: Y = β° + ∑ βiki=1 xi + ∑ βiiki=1 xi2 + ∑ βijxixj + ε … … … … … … (2)kj≥1
Where Y is the response, xi the magnitude of the factor, β0, βi, βii and βijare the coefficient of
regression, i and j are linear and quadratic coefficients, and ε is the experimental error. Equation
2 can be assumed to be the extension of a Taylor expansion (of degree 2) of any real underlying
function.
In this model of RSM, the atmosphere Temperature (TEMP), Relative Humidity (RH),
Air Quality Index (AQI) for PM 2.5 and Distance from Base Station (DFBS) are taken as input
variables that could potentially affect the output response such as Received Signal Strength for
LTE Technology (RSSLTE), 3G Technology (RSS3G) and 2G Technology (RSS2G). The input
parameters are design variables and their limiting range are the design constraints. Here mid-
value is taken as 0 for input variables. The CCRD values assigned are -2, -1, 0, 1, and 2. System
inputs range with at different coded levels is stated in Table 2. Experimental results as per CCRD
are listed by Table 3.
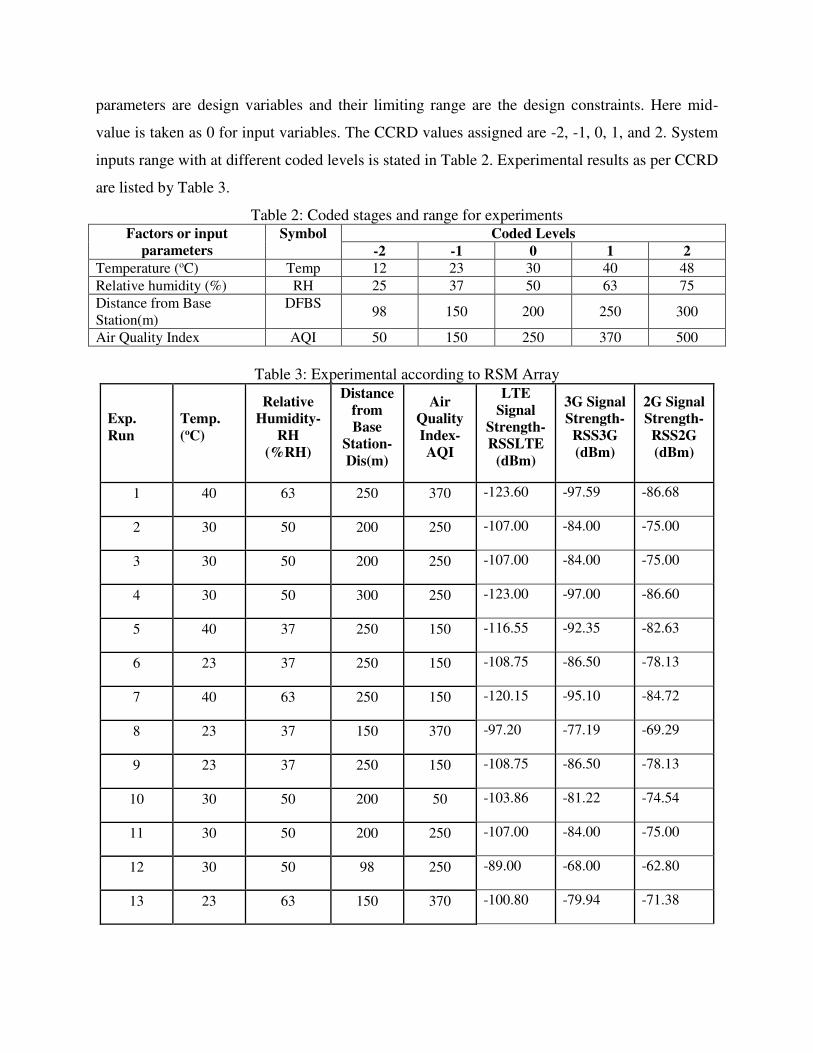
Table 2: Coded stages and range for experiments Factors or input
parameters
Symbol Coded Levels
-2 -1 0 1 2
Temperature (oC) Temp 12 23 30 40 48
Relative humidity (%) RH 25 37 50 63 75
Distance from Base
Station(m)
DFBS 98 150 200 250 300
Air Quality Index AQI 50 150 250 370 500
Table 3: Experimental according to RSM Array
Exp.
Run
Temp.
(oC)
Relative
Humidity-
RH
(%RH)
Distance
from
Base
Station-
Dis(m)
Air
Quality
Index-
AQI
LTE
Signal
Strength-
RSSLTE
(dBm)
3G Signal
Strength-
RSS3G
(dBm)
2G Signal
Strength-
RSS2G
(dBm)
1 40 63 250 370 -123.60 -97.59 -86.68
2 30 50 200 250 -107.00 -84.00 -75.00
3 30 50 200 250 -107.00 -84.00 -75.00
4 30 50 300 250 -123.00 -97.00 -86.60
5 40 37 250 150 -116.55 -92.35 -82.63
6 23 37 250 150 -108.75 -86.50 -78.13
7 40 63 250 150 -120.15 -95.10 -84.72
8 23 37 150 370 -97.20 -77.19 -69.29
9 23 37 250 150 -108.75 -86.50 -78.13
10 30 50 200 50 -103.86 -81.22 -74.54
11 30 50 200 250 -107.00 -84.00 -75.00
12 30 50 98 250 -89.00 -68.00 -62.80
13 23 63 150 370 -100.80 -79.94 -71.38

14 30 50 200 250 -107.00 -84.00 -75.00
15 30 50 200 500 -110.90 -87.00 -77.55
16 40 63 150 150 -105.15 -83.30 -73.92
17 23 63 250 370 -115.80 -91.74 -82.18
18 12 50 200 250 -102.70 -81.60 -73.50
19 23 63 250 150 -112.35 -89.10 -80.22
20 30 25 200 250 -104.00 -81.55 -73.02
21 30 75 200 250 -111.50 -87.60 -77.85
22 23 37 250 370 -112.20 -88.99 -81.09
23 30 50 200 250 -107.00 -84.00 -75.00
24 30 50 200 250 -107.00 -84.00 -75.00
25 40 37 150 370 -105.00 -83.04 -73.79
26 40 63 150 370 -108.60 -85.79 -75.88
27 40 37 250 370 -120.00 -94.84 -84.59
28 23 63 150 150 -97.35 -77.45 -69.42
29 30 50 200 250 -107.00 -84.00 -75.00
30 40 37 150 150 -101.55 -80.55 -71.83
31 48 50 200 250 -119.00 -94.50 -82.80
The objective for using RSM techniques here was to reach the proximity of the optimum quickly
and effectively. The simplest version of the model was then used, i.e., the linear model. All
association between variables was also considered to be negligible, and only primary impacts
were considered.
4. RSM Modelling Results
The ANOVA results of Received Signal Strength for LTE Technology (RSSLTE), 3G
Technology (RSS3G) and for 2G Technology (RSS2G) are shown in Tables 4. From the

ANOVA results, the p-value is considered the most important factor. Awad et al. [30] stated that
the p-value of various parameters must be not more than 0.05 and the parameters having a p-
value greater than 0.05 are considered as not important. The variables having p-values less than
0.05 indicates that the variable has a great impact on the developed model.
Table 4: ANOVA results for RSSLTE, RSS3G and RSS2G
RSSLTE RSS3G RSS2G
Sources DF Adj. SS Adj.
MS
F-value P-
value
Adj.
SS
Adj.
MS
F-
value
P-
value
Adj. SS Adj.
MS
F-
value
P-
value
Regression 4 1490 372.51 764 0.000 976.4 242.3 327.3 0.000 493.40 73.35 36.74 0.000
Temp (C) 1 37.45 37.45 76.82 0.000 28.25 28.18 38.07 0.000 221.02 221.22 6.93 0.014
RH (%) 1 9.28 9.28 19.03 0.000 4.63 4.19 5.66 0.025 78.19 78.19 2.76 0.04
DFBS (m) 1 1479.1 1479 3034.03 0.000 959.5 959.4 1296 0.000 6.04 66.04 2.07 0.02
AQI 1 7.09 7.09 14.54 0.001 3.276 3.27 4.42 0.045 42.62 22.62 11.58 0.000
Lack-of-fit 19 19 12.68 * * 19.24 1.03 * * 7.35 4.97 8.88 0.003
From Table 4, it clear that for RSSLTE, the p-value of temperature content, RH, and DFBS are
zero and for air quality index p-value is 0.001 for RSSLTE. It shows that the air quality index
have lesser impact on the RSSLTE parameter. Similarly, for RSS3G, the p-value of all
parameters is less than 0.05. For RSS2G, the p-value of temperature and RH is more than other
input parameters.
The models have also been tested using a computational approach using the decision
coefficient R2. Sarıkaya and Güllü [31] believed that that R2 values below 1 suggest that the
experimental effects are consistent with the findings of the model indicates that the reliability is
very strong form Table 5, it is showing that the finding of R2 is 99.16%, 98.05%, 96.18% for
RSSLTE, RSS3G and RSS2G respectively. These values of R2 are nearly close to 1 which
indicates that this mode gives reliable results.
Table 5: Model summary
Model S R2 (%) Adj. R2 (%) Pred. R2 (%)
RSSLTE 0.69822 99.16 99.03 98.64
RSS3G 0.86044 98.05 97.75 96.89
RSS2G 0.33612 96.18 95.05 94.26
R2: Correlation coefficient

The MINITAB 17 software is used to developed empirical correlations for RSSLTE, RSS3G and
RSS2G are mentioned below Eqs. (3-5). 𝑅𝑆𝑆𝐿𝑇𝐸(𝑑𝐵𝑚) = −61.2 + 0.14 ∗ 𝑇𝑒𝑚𝑝(°𝐶) − 0.1 ∗ 𝑅𝐻(%) − 0.22 ∗ 𝐷𝐹𝐵𝑆(𝑚) − 0.019 ∗ 𝐴𝑄𝐼− 0.004 ∗ {𝑇𝑒𝑚𝑝(°𝐶)}2 − 0.00034 ∗ {𝑅𝐻(%)}2 + 0.00011 ∗ {𝐷𝐹𝐵𝑆(𝑚)}2− 0.000001 ∗ 𝐴𝑄𝐼2 − 0.00036 ∗ 𝑇𝑒𝑚𝑝(°𝐶) ∗ 𝑅𝐻 − 0.000047 ∗ 𝑇𝑒𝑚𝑝(°𝐶)∗ 𝐷𝐹𝐵𝑆 (𝑚) − 0.00004 ∗ 𝑇𝑒𝑚𝑝(°𝐶) ∗ 𝐴𝑄𝐼 + 0.0003 ∗ 𝑅𝐻(%) ∗ 𝐷𝐹𝐵𝑆(𝑚) + 0.00016∗ 𝑅𝐻(%) ∗ 𝐴𝑄𝐼 + 0.00004 ∗ 𝐷𝐹𝐵𝑆(𝑚) ∗ 𝐴𝑄𝐼. … … … … … … … … (3)
𝑅𝑆𝑆3𝐺(𝑑𝐵𝑚) = −46.6 + 0.018 ∗ 𝑇𝑒𝑚𝑝(°𝐶) + 0.001 ∗ 𝑅𝐻(%) − 0.2 ∗ 𝐷𝐹𝐵𝑆(𝑚) − 0.01 ∗ 𝐴𝑄𝐼− 0.004 ∗ {𝑇𝑒𝑚𝑝(°𝐶)}2 − 0.001 ∗ {𝑅𝐻(%)}2 + 0.0001 ∗ {𝐷𝐹𝐵𝑆(𝑚)}2 − 0.00001∗ 𝐴𝑄𝐼2 + 0.001 ∗ 𝑇𝑒𝑚𝑝(°𝐶) ∗ 𝑅𝐻 + 0.0004 ∗ 𝑇𝑒𝑚𝑝(°𝐶) ∗ 𝐷𝐹𝐵𝑆 (𝑚) + 0.00014∗ 𝑇𝑒𝑚𝑝(°𝐶) ∗ 𝐴𝑄𝐼 + 0.00017 ∗ 𝑅𝐻(%) ∗ 𝐷𝐹𝐵𝑆(𝑚) + 0.00008 ∗ 𝑅𝐻(%) ∗ 𝐴𝑄𝐼+ 0.000027 ∗ 𝐷𝐹𝐵𝑆(𝑚) ∗ 𝐴𝑄𝐼. … … … … … … … … … … … … … … … … … … . . (4)
𝑅𝑆𝑆2𝐺(𝑑𝐵𝑚) = 122.6 − 0.1062 ∗ 𝑇𝑒𝑚𝑝(°𝐶) − 0.15 ∗ 𝑅𝐻(%) + 0.0019 ∗ 𝐷𝐹𝐵𝑆(𝑚) + 0.00093∗ 𝐴𝑄𝐼 − 0.0014 ∗ {𝑇𝑒𝑚𝑝(°𝐶)}2 + 0.000006 ∗ {𝑅𝐻(%)}2 + 0.000004 ∗ {𝐷𝐹𝐵𝑆(𝑚)}2− 0.000006 ∗ 𝐴𝑄𝐼2 + 0.0003 ∗ 𝑇𝑒𝑚𝑝(°𝐶) ∗ 𝑅𝐻 + 0.000043 ∗ 𝑇𝑒𝑚𝑝(°𝐶) ∗ 𝐷𝐹𝐵𝑆 (𝑚)+ 0.00001 ∗ 𝑇𝑒𝑚𝑝(°𝐶) ∗ 𝐴𝑄𝐼 + 0.000013 ∗ 𝑅𝐻(%) ∗ 𝐷𝐹𝐵𝑆(𝑚) + 0.000011∗ 𝑅𝐻(%) ∗ 𝐴𝑄𝐼 + 0.000002 ∗ 𝐷𝐹𝐵𝑆(𝑚) ∗ 𝐴𝑄𝐼. … … … … … … … … … … … … . (5)
To warrant RSM viability of established model, S value were seen for RSSLTE, RSS3G and
RSS2G which are 0.6922, 0.86044 and 0.33612 respectively. R2 (adj) values are 99.03%,
97.75% and 95.05%.
5. Result and Discussion
Surface and contour plots were obtained by using MINITAB17 software. In this study,
atmosphere Temperature (TEMP), Relative Humidity (RH), Air Quality Index (AQI) for PM2.5
and Distance from Base Station (DFBS) were considered as input variable. Plots were drawn
only with two input parameters while keeping other two parameters at constant or hold value and

these hold values has been mentioned at the top right corner of each surface and contour plot.
These hold values are the center values taken for each input parameter as shown in Table 1.
5.1. Impact of Varying Relative Humidity (RH) and Air Quality Index (AQI) on Signal
Strength for LTE, 3G and 2G Technology.
Figure 2(a) and Figure 2(b) shows the surface and contour plots which displays the variation in
Received Signal Strength for LTE Technology (RSSLTE) when two input variables i.e. Relative
Humidity (RH) and Air Quality Index (AQI) are varying from 25% to 75% and 50 to 500
respectively. At the same time remaining two input parameters i.e. Temperature (Temp) and
Distance from Base Station (DFBS) were kept at constant value of 30°C and 200m respectively.
From these plots it can be observed that RSSLTE keeps on reducing with the increase in RH and
from the same graph it can be observed that RSSLTE marginally reduces with increase in AQI
which is approximately negligible. Figure 2(b) shows the total variation range of RSSLTE and it
was approximately ranging from -114.5dBm to -100.5dBm. The minimum value of -114.5dBm
was observed when RH and AQI were having the value of 75% and 500 respectively and the
maximum value of -100.5dBm was observed for 25% and 50 values of RH and AQI
respectively. Variation in Received Signal Strength for 3G Technology (RSS3G) with same
input parameters has been shown in Figure 2(c) and Figure 2(d). Figure 2(c) shows the surface
plot and contour plot has been shown in Figure 3(d). From these Figures the same trend has been
observed i.e. with increasing RH, RSS3G decreases whereas the AQI has negligible effect on it.
From Figure 2(d) extreme variations in RSS3G can be observed and it is varying from -90.5dbm
to -79dBm. Figure 2(e) and Figure 2(f) are the surface and contour plots which shows the
variations in Received Signal Strength for 2G Technology (RSS2G) with respect to same input
parameters as shown in Figure 2(a) and Figure 2(b). From these Figures it can be observed that
RSS2G behaves in similar way with varying RH and AQI as RSSLTE and RSS3G does. The
only difference is variation range of RSS2G is much higher than RSSLTE and RSS3G and it can
be observed from the contour plot shown in Figure 2(e). Figure 2(e) shows that RSS2G attained
its maximum and minimum values of approximately -71dBm and -80.5dBm respectively.

(a)
(b)
(c)
(d)
(e)
(f)
Fig. 2.Effect of environment parameters on read range in presence of LTE
From all the plots shown in Figure 2 it was commonly observed that RSSLTE, RSS3G and
RSS2G reduce with increase in Relative Humidity (RH). It occurs because the radio waves are

type of electromagnetic wave so the radio waves will have same characteristics as of light. As
light beam passed through the water molecule it gets absorbed by water molecule and light
intensity decreases. It occurs because of collides with water molecule and increased air pressure.
Similarly increased humidity in atmosphere results in increased air pressure and also will
increase the number of water molecule in atmosphere which will result into weaker transmission
of radio waves and the receives signal strength reduces. Also radio wave have to face reflection,
diffraction and scattering if the high number of water molecules are present in the atmosphere
due to which signal gets attenuated and results into reduced receives signal strength. From these
Figures it was also concluded that effect of AQI is almost negligible on RSSLTE, RSS3G and
RSS. It was also observed that attenuation in RSSLTE was of 14dBm (-100.5dBm to -
114.5dBm), in RSS3G it was of 11.5dBm (-79dBm to -90.5dBm) and for RSS2G it was 9.5dBm
(-80.5dBm to -71dBm).So from the above values it was observed that the attenuation in LTE
signal was maximum, minimum attenuation was observed for the 2G signal and for 3G signal it
was observed in between. It occurs because the high frequency signal gets attenuated more easily
as compared to low frequency signal.
5.2. Impact of Varying Relative Humidity (RH) and Distance from Base Station (DFBS)
on Signal Strength for LTE, 3G and 2G Technology.
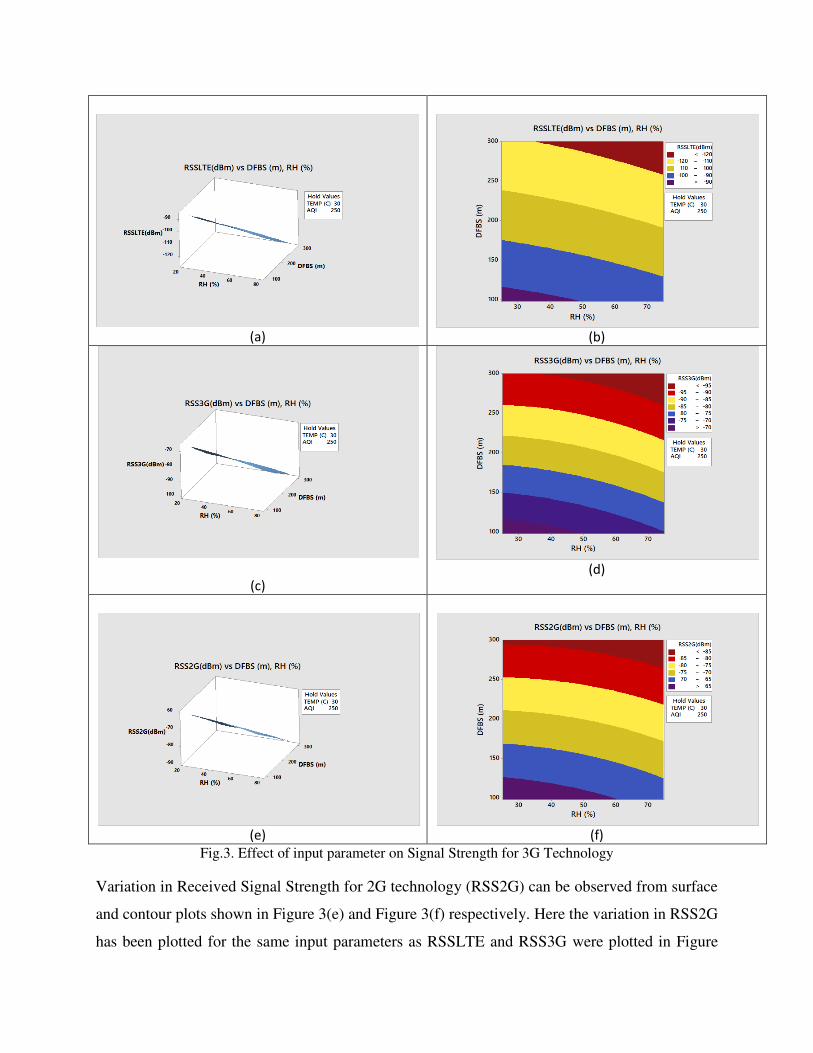
Figure 3(a) and Figure 3(b) are the surface and contour plots which shows the variation in
Received Signal Strength for LTE Technology (RSSLTE) with respect to varying Relative
Humidity (RH) and Distance From Base Station (DFBS) ranging from 25% to 75% and 98m to
300m respectively whereas the other two input parameters i.e. Temperature (TEMP) and Air
Quality Index (AQI) were at constant value of 30°C and 250 respectively. From these Figures it
can observed that RSSLTE reduces with increase in RH and same is the effect of DFBS but there
is sharp decrease in RSSLTE with respect to DFBS as compared to RH. Figure 3(b) shows that
RSSLTE can reach up to the maximum value of approximately -85dBm and can attain the
minimum value of -124dBm. Figure 3(c) and Figure 3(d) shows the Surface and contour plot
which depict the variation in Received Signal Strength for 3G Technology (RSS3G) for same
input parameters as shown in Figure 3(a) and Figure 3(b). From these Figures same trend had
been observed for the RSS3G with respect to varying RH and DFBS as it was observed for
RSSLTE. The extreme variation which RSS3G can achieve can be observed for the Figure 3(d)
and it is ranging approximately from -98dBm to -68dBm.
(a)
(b)
(c)
(d)
(e)
(f)
Fig.3. Effect of input parameter on Signal Strength for 3G Technology
Variation in Received Signal Strength for 2G technology (RSS2G) can be observed from surface
and contour plots shown in Figure 3(e) and Figure 3(f) respectively. Here the variation in RSS2G
has been plotted for the same input parameters as RSSLTE and RSS3G were plotted in Figure
3(a) to Figure 3(d). From Figure 3(e) and Figure 3(f) it can be observed that RSS2G responds to
varying RH and DFBS the similar ways as RSSLTE and RSS3G does. From Figure 3(f) it can be
observed that the maximum (-62dBm approximately) and minimum (-88dBm approximately)
values attained for RSS2G is more than RSSLTE and RSS3G.
From all the plots shown in Figure 3, it was commonly observed that RSSLTE, RSS3G and
RSS2G reduces with increase in RH and same is the effect of DFBS but there is sharp decrease
in RSSLTE, RSS3G and RSS2G with respect to DFBS as compared with respect to RH.
Decrease in RSSLTE, RSS3G and RSS2G with increase in DFBS occurs because radio wave
intensity follows the inverse square law. This means if the distance between the transmitter and
receiver is doubled the received signal power will be reduced four times. The reason behind the
sharp decrement is because the completed observations were taken in the area which comes
under the deep shadow reason (area which is densely populated and having high rise buildings
etc.) due to which signal get attenuated more easily and results in low received signal strength.
From the same Figures it was also observed that attenuation in RSSLTE was maximum i.e. of
39.5dBm (-85dBm to -124.5dBm), minimum for RSS2G and it was 26dBm (-62dBm to -88dBm)
and for RSS3G it was observed to be in between i.e. 30dBm (-68dBm to -98dbm) and it occurs
because the high frequency signals get attenuated more easily as compared to low frequency
signals.
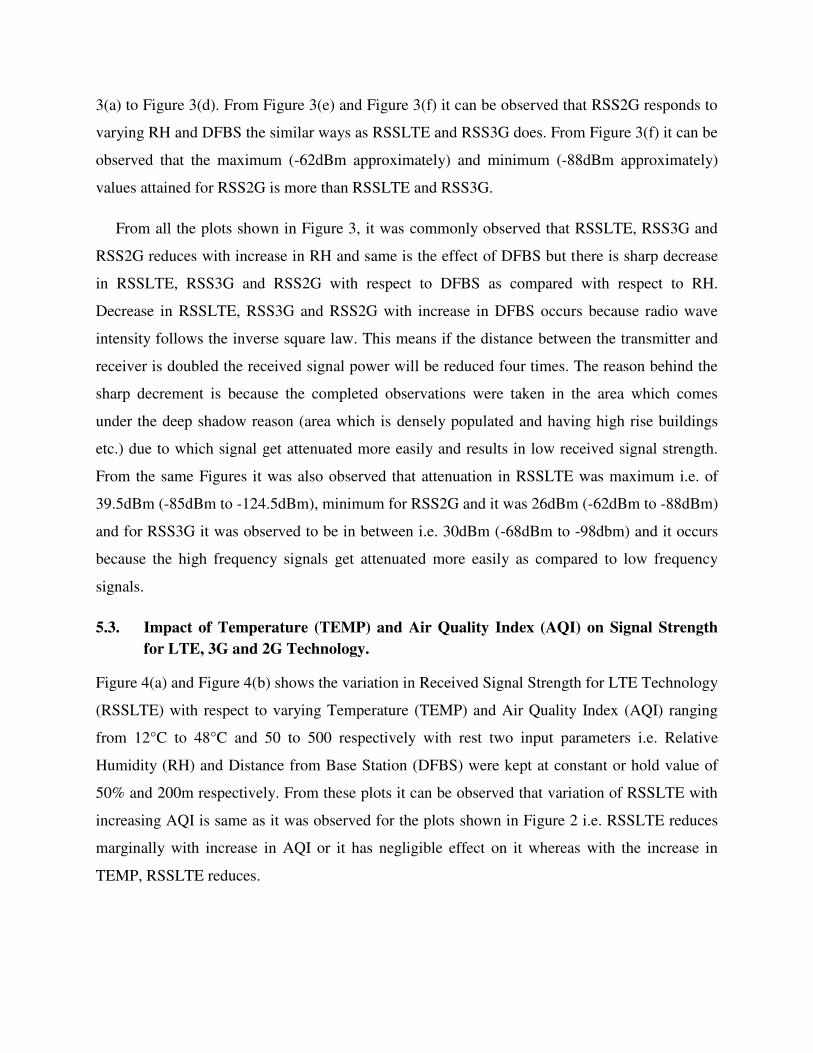
5.3. Impact of Temperature (TEMP) and Air Quality Index (AQI) on Signal Strength
for LTE, 3G and 2G Technology.
Figure 4(a) and Figure 4(b) shows the variation in Received Signal Strength for LTE Technology
(RSSLTE) with respect to varying Temperature (TEMP) and Air Quality Index (AQI) ranging
from 12°C to 48°C and 50 to 500 respectively with rest two input parameters i.e. Relative
Humidity (RH) and Distance from Base Station (DFBS) were kept at constant or hold value of
50% and 200m respectively. From these plots it can be observed that variation of RSSLTE with
increasing AQI is same as it was observed for the plots shown in Figure 2 i.e. RSSLTE reduces
marginally with increase in AQI or it has negligible effect on it whereas with the increase in
TEMP, RSSLTE reduces.

(a)
(b)
(c)
(d)
(e)
(f)
Fig.4. Effect of input parameter on Signal Strength for 2G Technology
Variations in Received Signal Strength for 3G (RSS3G) and 2G (RSS2G) with respect to same
input parameters (Used in Figure 4(a) and Figure 4(b)) has been shown in Figure 4(c), Figure
4(d) and Figure 4(e), Figure 4(f) respectively. Same trend was observed for RSS3G and RSS2G

as it was observed for RSSLTE i.e. RSS3G and RSS2G reduce with increase in TEMP and have
negligible effect of AQI. Figure 4(b), Figure 4(d) and Figure 4(f) shows the extreme variation
range for RSSLTE, RSS3G and RSS2G and these were approximately ranging from -121dBm to
-98dBm, -96dBm to -76dBm and -85dBm to -67dBm respectively.
For all the plots shown in Figure 4 it was commonly observed that RSSLTE, RSS2G and
RSS3G keeps on decreasing with increase in TEPM and it may occur because the resistivity of
medium increases with increase in temperature which results into decrease in power and current
of the device for a particular voltage. So the signal to noise for the radio transceiver decreases
with the increase in temperature and resulting in decrease in received signal strength. From the
same plots it was observed that attenuation in RSSLTE was of 23dBm (-98dBm to -121dBm), in
RSS3G it was of 20dBm (76dBm to -96dBm) and for RSS2G it was 18dBm (-67dBm to -
85dBm) and it occurs because the high frequency signals gets attenuated more easily as
compared to low frequency signal. From the same time it was observed that effect of AQI is
almost negligible on RSSLTE, RSS3G and RSS2G.
From all the plots shown in Figure 2, Figure 3 and Figure 4 it can be observed that
Received Signal Strength for 2G signal was maximum, for LTE signal it was observed to be at
minimum value and for 3G signal it lies in between the Received Signal Strength for LTE and
2G signals.
6. RSM response optimization and its validation
Figure 5 shows the RSM optimizer which is used to get the optimum values of input parameter
setting for best possible values of Received Signal Strength for LTE, 3G and 2G technologies.
The multi objective optimization was carried out with equal weightage on output responses. In
this research work, the objective was to enhance the Received Signal Strength for LTE, 3G and
2G technologies. Optimum values of atmosphere temperature (TEMP), Relative Humidity (RH),
Air Quality Index (AQI) for PM2.5 and Distance from Base Station (DFBS) were found to be
13.10°C, 27.30%, 55 and 98m respectively. At above said input setting, optimum responses were
found -77.9264dBm for (Received Signal Strength for LTE- RSSLTE); -60.0345dBm for
(Received Signal Strength for 3G- RSS3G) and -58.1280dBm for (Received Signal Strength for
2G- RSS2G).
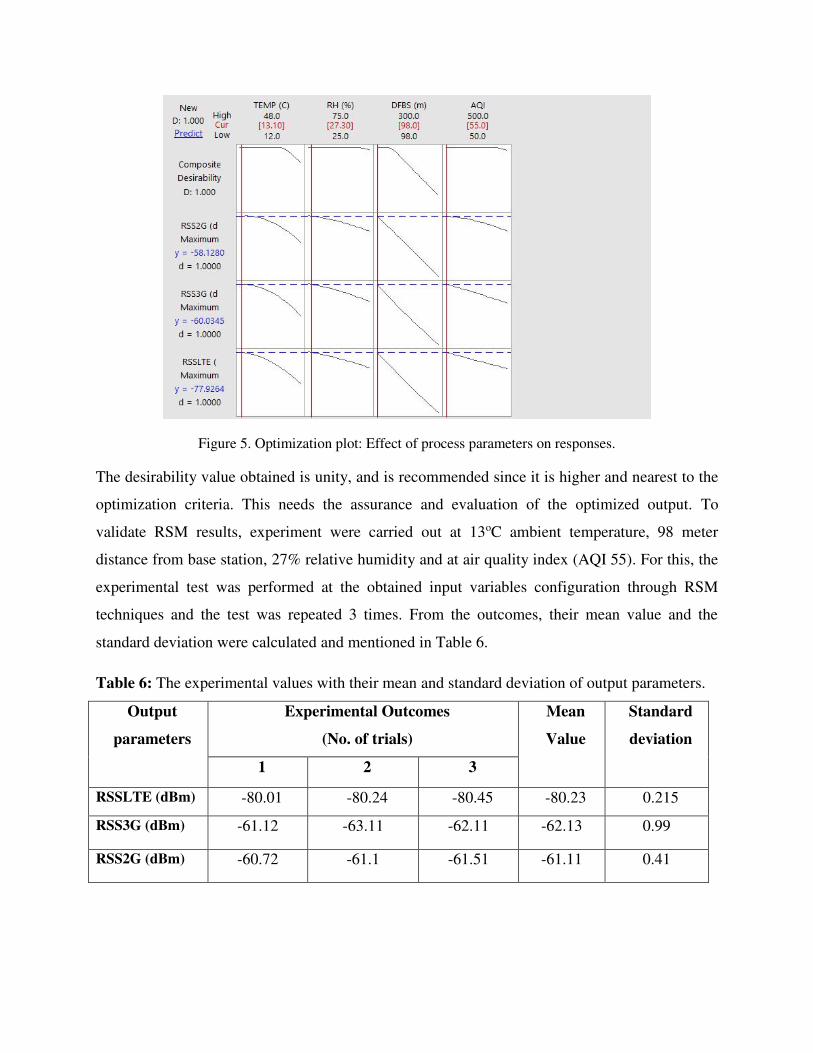
Figure 5. Optimization plot: Effect of process parameters on responses.
The desirability value obtained is unity, and is recommended since it is higher and nearest to the
optimization criteria. This needs the assurance and evaluation of the optimized output. To
validate RSM results, experiment were carried out at 13oC ambient temperature, 98 meter
distance from base station, 27% relative humidity and at air quality index (AQI 55). For this, the
experimental test was performed at the obtained input variables configuration through RSM
techniques and the test was repeated 3 times. From the outcomes, their mean value and the
standard deviation were calculated and mentioned in Table 6.
Table 6: The experimental values with their mean and standard deviation of output parameters.
Output
parameters
Experimental Outcomes
(No. of trials)
Mean
Value
Standard
deviation
1 2 3
RSSLTE (dBm) -80.01 -80.24 -80.45 -80.23 0.215
RSS3G (dBm) -61.12 -63.11 -62.11 -62.13 0.99
RSS2G (dBm) -60.72 -61.1 -61.51 -61.11 0.41

The lab examination details are shown in Table 7 shows the response for RSSLTE, RSS3G and
RSS2G. Experimental responses were compared with the RSM optimizer values.
Table 7: Validation test
Response at 13oC, 98 DFBS, 27% RH, with 55 AQI
Response Predicted Actual % Error
RSSLTE (dBm) -77.926 -80.23 2.96
RSS3G (dBm) -60.034 -62.13 3.5
RSS2G (dBm) -58.128 -61.11 5.11
The error percentage for RSSLTE, RSS3G and RSS2G are 2.96, 3.5 and 5.11 respectively, and
within the limits.
7. Conclusions
As the received signal strength gets affected due to the varying environment condition present in
the channel through which the signal propagates and it also depends on the distance between the
location of signal transmitter and the receiver. So, this research work was carried out to monitor
the received signal strength for LTE, 2G and 3G wireless communication technologies and to
mitigate the effect of varying environment conditions which these signals have to face. Later on
the optimization was carried out by using RSM technology. Complete details of the input
parameters used for optimization and the received optimized responses are as follows -
The significant input parameters for the analysis of Received Signal Strength for LTE,
3G and 2G Technologies were Temperature (12°C to 48°C), Relative Humidity (25%RH
to 75%RH), Distance from Base Station (98m to 300m) and Air Quality Index (50 to
500).
Optimum conditions were recovered when environment parametersTemperature(TEMP),
Relative Humidity (RH), Air Quality Index (AQI) for PM2.5 and Distance from Base
Station (DFBS) were found to be 13.10°C, 27.30%, 55 and 98m respectively
Received Signal Strength for LTE- RSSLTE, Received Signal Strength for 3G - RSS3G
and Received Signal Strength for 2G - RSS2G werefound to be -77.9264dBm, -
60.0345dBm and -58.1280dBm respectively.

S value was obtained for RSSLTE, RSS3G and RSS2G which are 0.69822, 0.86044 and
0.33612 respectively defined closer to regression line.
Regression coefficient (R2 value) are 99.16%, 98.05% and 96.18%, respectively for
RSSLTE, RSS3G and RSS2G shows good mathematical modelling among input and
output parameters.
Optimized RSM results were validated though the confirmation trial. The error between
actual and predicted was found to be within the range of 5%.
In this research work the optimization was carried with response surface methodology. By using
response surface methodology, optimization can be done with minimum experiment runs and it
is not application specific. From this study after the completion of experiment and optimization it
is clear that the mobile with any of the three wireless communication technologies i.e. LTE, 3G
or 2G can provide maximum Received Signal Strength for the combinations of environment
parameters as mentioned above.
Declaration
Funding (information that explains whether and by whom the research was supported) -
NA
Conflicts of interest/Competing interests (include appropriate disclosures)- NA
Availability of data and material (data transparency) - Yes
Code availability (software application or custom code) - NA
References
[1] Ofure, E. J., David, O. O., Oludare, A. M. and Musa, A. A. ( 2017). Impact of some atmospheric
parameters on GSM signals. 2017 13th International Conference on Electronics, Computer and
Computation (ICECCO), Abuja, 1-7, doi: 10.1109/ICECCO.2017.8333335.
[2] Joseph, A. (2016). Atmospheric Pressure Bearing on (UHF). Radio Signal. Department of Physics,
University of Calabar, International Journal of Scientific Engineering and Technology, 5(3), 131-
133.
[3] Chima, A.I., Onyia, A.I., and Udegbe,S.U. (2018). The Effects of Atmospheric Temperature and
Wind Speed on Uhf Radio Signal; a Case Study of ESUT Community and Its Environs in Enugu
State. IOSR Journal of Applied Physics (IOSR-JAP), 10(2), 83-9.

[4] Usman, A.U., Okereke, O. U. & Omizegba, E. E. (2015).Instantaneous GSM Signal
StrengthVariation with Weather and Environmental Factors. American Journal of Engineering
Research (AJER), 4(3), 104-115.
[5] Voznak, M. and Rozhon, J. (2012). Influence of Atmospheric Parameters on Speech Quality in
GSM/UMTS. International Journal Of Mathematical Models And Methods In Applied Sciences,
6(4), 575-582.
[6] Zafar, S. N. A. S., Sabri, N. H., Umar, R & Ibrahim, Z. A. (2019). Radio Frequency Interference on
Nearby Radio Astronomical Lines: Relationship between Wind Speed and Radio Signal Strength
Measured at East Coast of Peninsular Malaysia. Sains Malaysiana, 48(1), 183–189.
[7] Eli-Chukwu, N. C. and Onoh, G. N. (2019). Experimental Study on the Impact of Weather
Conditions on Wide Code Division Multiple Access Signals in Nigeria. Engineering, Technology
& Applied Science Research, 9(2), 3998-4001.
[8] Luomala, J. and Hakala, I. (2015). Effects of temperature and humidity on radio signal strength in
outdoor wireless sensor networks. 2015 Federated Conference on Computer Science and
Information Systems (FedCSIS), Lodz, 1247-1255, doi: 10.15439/2015F241.
[9] Tchao, E.T., Gadze, J.D., Agyapong, J. O. (2018) Performance Evaluation of a Deployed 4G
LTE Network. International Journal of Advanced Computer Science and Applications, 9(3), 165-
78, 2018, doi: 10.14569/IJACSA.2018.090325.
[10] David, N. and Gao, H. O. (2017). Using Cell-Phone Tower Signals for Detecting the Precursors of
Fog. Journal of Geophysical Research: Atmospheres, 123(2), 1325-1338, 10.1002/2017JD027360.
[11] Igbekele, O. J., Kwaha, B. J., Ogherohwo, E. P. and Zhimwang, J. T. (2020). Performance
Analysis of the Impact of Rain Attenuated Signal on Mobile Cellular Terrestrial Links in Jos,
Nigeria. Physical Science International Journal, 24(1), 14-26.
[12] Lo Sciuto, G. (2019). Air pollution effects on the intensity of received signal in 3G/4G mobile
terminal. Int J Energy Environ Eng, 10, 221–229.
[13] Alim, M. A., Rahman, M. M., Hossain, M. M., Al-Nahid, A. (2010). Analysis of Large-Scale
Propagation Models for Mobile Communications in Urban Area. International Journal of Computer
Science and Information Security, 7(1), 135-139.
[14] Alshurideh, M. T. (2016). Exploring the Main Factors Affecting Consumer Choice of Mobile Phone
Service Provider Contracts. Int. J. Communications, Network and System Sciences, 9(12), 563-581,
doi: 10.4236/ijcns.2016.912044.
[15] Yusuf, N., Ekpe, O. E., Said, R. S., Ayantunji, B. G., Umahi, A. E. (2020). Seasonal and diurnal
trends of surface refractivity in a tropical environment using ground-based automatic weather
stations. Meteorol Atmos Phys, 132, pp: 327–340, https://doi.org/10.1007/s00703-019-00693-6.
[16] Fang, S. and Yang, Y. S. (2016). The Impact of Weather Condition on Radio-Based Distance
Estimation: A Case Study in GSM Networks with Mobile Measurements. IEEE Transactions on
Vehicular Technology, 65(8), 6444-6453, doi: 10.1109/TVT.2015.2479591.

[17] Pooja.N, Anitha.R, Hanchinal, C.S (2018). Optimized Path loss model for the effects of
Environmental Factors on Mobile Signal Strength. International Research Journal of Engineering
and Technology (IRJET), 05(4), 4513-4516.
[18] Hanchinal, C. S., Muralidhara, K.N. (2016). A Survey on the Atmospheric Effects on Radio Path
Loss in Cellular Mobile Communication System. International Journal of Computer Science And
Technology, 7(1), 120-124.
[19] Guidara, A., Fersi, G., Derbel, F., Jema, M. B. (2018). Impacts of Temperature and Humidity
variations on RSSI in indoor Wireless Sensor Networks. 22nd International Conference on
Knowledge-Based and Intelligent Information & Engineering Systems, Procedia Computer Science,
126, 1072–1081.
[20] Madariaga, D., Panza, M. and Bustos-Jimenéz, J. (2018). I'm Only Unhappy when it Rains:
Forecasting Mobile QoS with Weather Conditions. 2018 Network Traffic Measurement and
Analysis Conference (TMA), Vienna, 1-6, doi: 10.23919/TMA.2018.8506509.
[21] Dinc, E. and Akan, O. B. (2014). Beyond-line-of-sight communications with ducting layer," IEEE
Communications Magazine, 52(10), 37-43, doi: 10.1109/MCOM.2014.6917399.
[22] Usman, A.U., Okereke, O.U., Omizegba, E.E. (2011). Comparative Analysis of Path Loss Model
Predictions with Measurements Taken for GSM 900/1800 MHz Networks in Bauchi Suburbs of
Nigeria. The IUP Journal of Telecommunications, 3(4), 7-17.
[23] Ofure, E. J., David, O. O., Oludare, A. M., Musa, A. A. (2017). Artificial Neural Network model for
the determination of GSM Rxlevel from atmospheric parameters. Engineering Science and
Technology, an International Journal, 20(2), 795-804.
[24] Begum Korunur Engiz, Cetin Kurnaz, “Comparison of Signal Strengths of 2G/3G/4G Services on a
University Campus”, International Journal of Applied Mathematics, Electronics and Computers, pp: 37-42, special issue, December 2016, ISSN: 2147-82282, , doi: 10.18100.
[25] Yang, K. and Wu, Z. (2018). Analysis of the Co-channel Interference caused by Atmospheric Duct
and Tropospheric scattering. 2018 12th International Symposium on Antennas, Propagation and
EM Theory (ISAPE), Hangzhou, China, 1-4, doi: 10.1109/ISAPE.2018.8634125.
[26] Choudhary, S., Sharma, A., Gupta, S., Purohit, H., Sachan, S (2020) Use of RSM Technology for
the Optimization of Received Signal Strength for LTE Signals Under the Influence of Varying
Atmospheric Conditions. EVERGREEN Joint Journal of Novel Carbon Resource Sciences & Green
Asia Strategy, 7(4), 500-509.
[27] Choudhary, S., Sharma, A., Srivastava, K., Purohit, H., Vats, M (2020). Read Range Optimization
of Low Frequency RFID System in Hostile Environmental Conditions by Using RSM Approach.
EVERGREEN Joint Journal of Novel Carbon Resource Sciences & Green Asia Strategy, 7(3), 396-
403.
[28] Hamze, H., Akia, M. and Yazdani, F. (2015). Optimization of biodiesel production from the waste
cooking oil using response surface methodology. Process Safety and Environmental Protection, 94,
1-10.

[29] Ma, L., Han, Y., Sun, K., Lu, J. and Ding, J. (2015). Optimization of acidified oil esterification
catalyzed by sulfonated cation exchange resin using response surface methodology. Energy
Conversion and Management, 98, 46-53.
[30] Awad, O.I., Mamat, R., Ali, O.M., Azmi, W.H., Kadirgama, K., Yusri, I.M., Leman, A.M. and
Yusaf, T. (2017). Response surface methodology (RSM) based multi-objective optimization of fuel
oil-gasoline blends at different water content in SI engine. Energy Conversion and Management,
150, 222-241.
[31] Sarıkaya, M. and Güllü, A. (2014). Taguchi design and response surface methodology based
analysis of machining parameters in CNC turning under MQL. Journal of Cleaner Production, 65,
604-616.
.

Figures
Figure 1
Methodology Flow chart

Figure 2
Effect of environment parameters on read range in presence of LTE

Figure 3
Effect of input parameter on Signal Strength for 3G Technology

Figure 4
Effect of input parameter on Signal Strength for 2G Technology

Figure 5
Optimization plot: Effect of process parameters on responses.
Supplementary Files
This is a list of supplementary �les associated with this preprint. Click to download.
�oatimage1.jpeg
Recommended