Budapest University of Technology and EconomicsFaculty of Electrical Engineering and Informatics
Department of Control Engineering and Information Technology
Model reference control of a
steer–by–wire steering system
MSc Thesis
Agoston Lorincz
2004

Alulırott Lorincz Agoston, a Budapesti Muszaki es Gazdasagtudomanyi Egyetem
hallgatoja kijelentem, hogy ezen diplomatervet meg nem engedett segıtseg nelkul,
sajat magam keszıtettem, es a diplomatervben csak a megadott forrasokat hasznaltam
fel. Minden olyan reszt, melyet szo szerint, vagy azonos ertelemben, de atfogalmazva
mas forrasbol atvettem, egyertelmuen a forras megadasaval megjeloltem.
I

Tartalmi osszefoglalo
A diplomadolgozat egy modellkoveto szabalyozast ismertet steer–by–wire
kormanyrendszeren. A rendszerkomponensek bemutatasa mellett azok jellemzo
tulajdonsagai es a kormanyzasi mechanizmus mukodesehez szukseges szabalyozasi
korok kerulnek bemutatasra.
A modellezesi folyamat soran a mechanikai alkatreszek fizikai kolcsonhatasait
linearis matematikai modszerekkel ırja le. Meggondolasok alapjan linearis
idoinvarians modelleket allıt a folyamatra, es azok parametereit ARMAX identi-
fikacios modszerrel kozelıti.
Az ezt koveto fejezetek az identifikalt szakasz vizsgalataval, es a mod-
ellkoveto szabalyozas tervezesevel foglalkoznak. A kovetendo linearis modell
atviteli fuggvenyeit masoltatjuk le a szabalyozoval. Elosszor a hagyomanyos
kormanyrendszert altalanos megfontolasok alapjan [3] masoltuk le. A rendszerre
ezutan modell koveto masodfoku szabalyozot terveztunk, majd ennek a rendszernek
a kiegeszıtesevel foglalkoztunk adaptıv modell koveto szabalyozasa (MRAC).
II
Abstract
The present work presents a model following control method for steer-by-wire steer-
ing system. It contains the representation of the components and explains the
characteristic features and control loops generated by the steering mechanisms of
the system.
It describes the interactions produced by the physical contact of the mechanical
parts with linear mathematical methods. Based upon considerations it follows the
process with linear models, and approaches their parameters with ARMAX identi-
fication methods.
The last chapters examine the identified system and handle with the planning
of a model reference control mechanism. We made the controller copy the transfer
functions of the linear model which has to be followed. First we reproduced the
conventional steering system based on general considerations. Thereafter, we cre-
ated a system following two–degree–of–freedom controller, and introduced a model
reference adaptive control on its basis.
III

Ezuton szeretnem kifejezni halas koszonetem Harmati Istannak es Janosi
Istvannak folyamatos segıtsegugert es konzultacios munkajukert. Koszonom Wahl
Istvannak, hogy lehetove tette az elektromos szervokormany fejleszteseben valo
reszvetelem, valamint a ThyssenKrupp Nothelfer Kft Kutato es Fejleszto Intezetenek
alkalmazottainak, hogy segıtsegukkel es tanacsaikkal elosegıtettek szakmai fejlodesem.
Kulonosen halas vagyok Szuleimnek tanulmanyaim tamogatasaert.
I wish to express my sincerest gratitude to Istvan Harmati and Istvan Janosi for
their persistent tutoring and consultation. I thank Istvan Wahl the opportunity to
work on electronic steering systems and I also wish to tank all the employees of
ThyssenKrupp Nothelfer Research and Development Institute for their help and ad-
vices, which ensured my professional development. I am especially grateful to my
parents for supporting my studies.
IV

Contents
1 Introduction 1
2 System Description 2
3 System Identification 4
3.1 Mathematical model . . . . . . . . . . . . . . . . . . . . . . . . . . . 6
3.1.1 Hand wheel system . . . . . . . . . . . . . . . . . . . . . . . . 7
3.1.2 Road wheel system . . . . . . . . . . . . . . . . . . . . . . . . 7
3.1.3 System Ordinary Differential Equations . . . . . . . . . . . . . 9
3.2 ARMAX Model . . . . . . . . . . . . . . . . . . . . . . . . . . . . . . 11
3.3 Simulink model of the system . . . . . . . . . . . . . . . . . . . . . . 17
4 Model Reference Control 18
4.1 Power Assisted Steering System . . . . . . . . . . . . . . . . . . . . . 19
4.2 Concept of making steer–by–wire feeling . . . . . . . . . . . . . . . . 21
4.3 Model reference controller . . . . . . . . . . . . . . . . . . . . . . . . 30
4.3.1 Two–degree–of–freedom controller . . . . . . . . . . . . . . . 32
4.3.2 Model Reference Adaptive Control (MRAC) . . . . . . . . . . 41
5 Conclusion 50
6 Appendix A
6.1 Notations of variables and parameters . . . . . . . . . . . . . . . . . . A
V

Chapter 1
Introduction
In next generation vehicles, mechanical and hydraulic subsystems are being replaced
by electrical motors and controls. The feature called drive–by–wire may include
brake-by-wire and steer-by-wire subsystems, which may boost performance, enhance
safety. Steer–by–wire offers wide flexibility in the tuning of vehicle handling by
software. The lack of steering column makes it possible to design better energy-
absorbing structures. The system must be carefully analyzed and verified for safety
because it is new and complex. Safety is intimately connected to the notion of risk
and popularly means a relatively high degree of freedom from harm.
In steer-by-wire systems the force feedback is necessary, since the road feel is one
of the most important input for driver, after vision. Force feedback results in the
need for large driver forces to steer the system. It is essential for the control strategy
to ensure that the force feedback can be adjusted to a comfortable driving environ-
ment. An obvious solution is to copy the properties of a conventional hydraulic
steering system. This gives a stable system in spite of the uncertain biomechanic
dynamics of the driver and vehicle dynamics, that depends on the vehicle iteration
with the street.
The goal defined above makes it necessary an exact model of the whole system.
If it is not available the steer–by–wire system has to be identified. Thus, this the-
sis starts with an ARMAX type identification. Then, a control strategy had been
designed based on the general concept of [3]. This controller could not cancel the
steady state error caused by uncertainties. Therefore , we created a system follow-
ing two–degree–of–freedom controller, and introduced a model reference adaptive
control on its basis.
1

Chapter 2
System Description
The purpose of using the steer–by–wire steering systems is to make steering more
convenient and safe.
The steering system can be divided into three major parts. The first is the hand
wheel system, containing the steering wheel, that keeps contact with the driver using
an electric motor. An angle sensor provides information about the driver steering
input, by resolution 8192 per turn. The steering wheel actuator is accountable for
the road–feel and for changing the steering dynamics.
The next part is the road wheel system that includes the road wheel actuator,
which transmits the steering wheel’s angle to the position of the rack. The rotational
motion of the motor is converted to translational motion of the rack by a ball-screw
drive with a gear of 7 · 10−3m per turn. An angle sensor gives the motor position to
the control, by scaling 4096 per turn. Considering the gear ratio between the rack
and the motor it means a resolution of 585143 per meter for the displacement of the
rack.
The third part is the electronic control unit (ECU). This part has the task to
generate the actuator inputs, in the end of view the driver steering input, force
feedback, road–feel, vehicle and control stability, and importance of safety.
The actuators have additional control loops providing the motor currents by a
time constant around 1ms.
2

CHAPTER 2. SYSTEM DESCRIPTION 3
Steering wheel actuatorQQs
Steering wheel -
Road wheel actuator£
££
££
££°
ECU
Figure 2.1: Volkswagen steer–by–wire mechanical system

Chapter 3
System Identification
In order to control the system it is necessary to define control outputs, and objec-
tives. In most control systems the object is a physical system, where outputs are
significant, observable and usually measurable signals of the system. Inputs are ex-
ternal signals that are possible to be manipulated. The control objective is to follow
traces labeled as reference-signals.
So as to design a control for the system it is necessary to assume a relationship
between the inputs and outputs [5]. Many systems do not need more than a mental
model, without any exact mathematical formalization. These systems are usually
controlled by human muscle and brain. Several systems can be described by graph-
ical models. In many cases at linear models it is sufficient to use their frequency
functions, or impulse responses. This model might be the easiest method to describe
some non-linearities, too.
In control theory a mathematical model of the system is commonly used for
system description. Physical attributes of a system can be described by ordinary
differential equations or ODEs. It is possible to decompose these higher-order equa-
tions into first-order ones. These linear first-order differential equations are often
used for process analysis, and are called state equations.
In control, linear time-invariant systems are often modeled by their transfer
functions. Transfer functions are defined as the Laplace transform of the impulse
response, with zero valued initial conditions. In systems theory, transfer function is
often called the frequency domain representation of the system. It describes com-
pletely how the system processes the input signals to produce the output signals.
Thus, control systems are often designed to meet transfer function specifications.
Transfer functions are complex-valued, frequency-dependent quantities, so it is eas-
ier to appreciate a systems function by examining the magnitude and phase of its
4

CHAPTER 3. SYSTEM IDENTIFICATION 5
transfer function. Bode diagrams show magnitude and phase with respect to fre-
quency. Usually they use a logarithmic scale for the frequency, and a decibel scale
for the magnitude’s great alterations.
Models are constructed from observations. Mental models uses empirical infor-
mation, graphical models are created from measurements. Analytical model can be
developed by stripping it to subsystems are known a priori.
There is another way to get mathematical models: some models are based di-
rectly on the measurement of the input and output signals of the process. It is nec-
essary to create a particular model structure with several parameters which should
be valued during the identification.
In the following section we introduce the mathematical model of the system used
for the identification and the results gained with the ARMAX method.
CHAPTER 3. SYSTEM IDENTIFICATION 6
3.1 Mathematical model
The steering system has both mechanical and electrical components as it is showed
in Chapter 2. The electrical parts are well known and understood behaviour. It is
designed for enlarging robust and allowing fast closed-loop performance, via motor
currents. These inner control loops have smaller time constants than the mechanical
parts. Therefore we created a model containing only the mechanical subsystems.
The mechanical parts consists of two main parts. The hand wheel system is able
to actuate rotational movements, the road wheel system is capable of translational
motions. Both systems has only one degree of freedom. Thus, it is possible to
describe the systems with a linear model using the Newton’s law
∑
F = M · x (3.1a)∑
T = Θ · ϕ. (3.1b)
Where x is the acceleration. That is the effect of the sum of the forces∑
Fwhich
are acting on the system’s mass M . In a similar way ϕ is the acceleration of the
angle ϕ. This acceleration is caused by the torques acting on the inertia Θ.
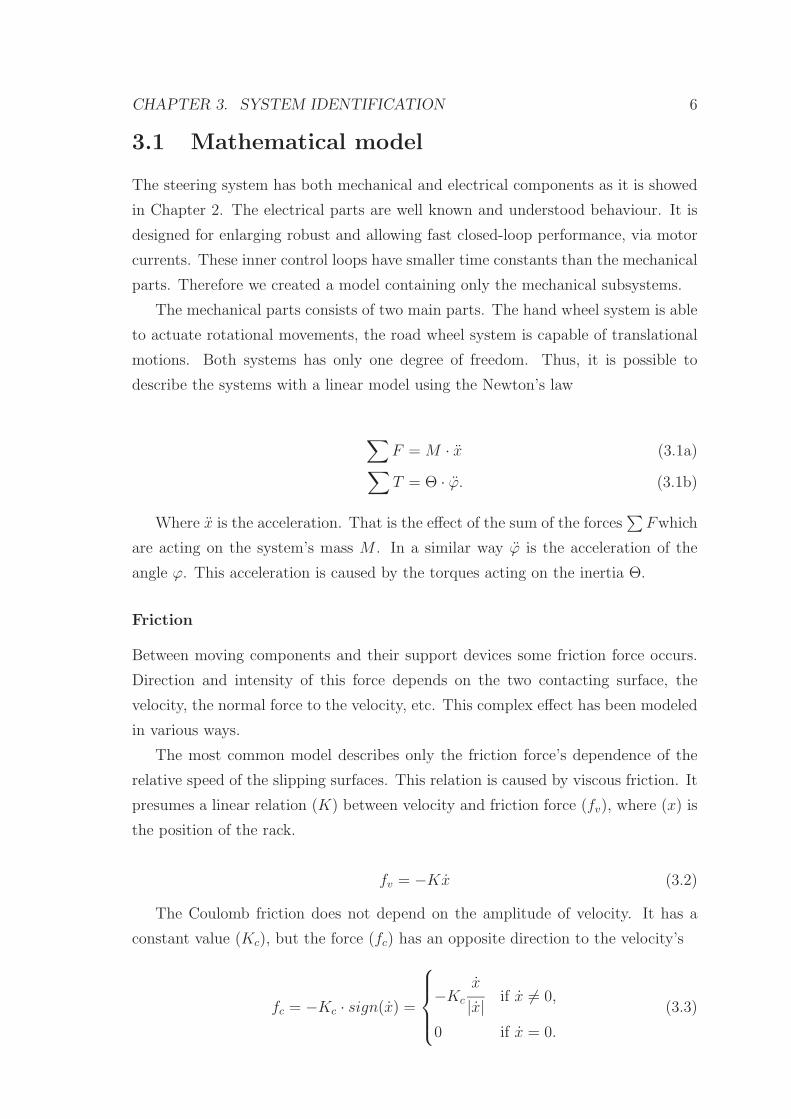
Friction
Between moving components and their support devices some friction force occurs.
Direction and intensity of this force depends on the two contacting surface, the
velocity, the normal force to the velocity, etc. This complex effect has been modeled
in various ways.
The most common model describes only the friction force’s dependence of the
relative speed of the slipping surfaces. This relation is caused by viscous friction. It
presumes a linear relation (K) between velocity and friction force (fv), where (x) is
the position of the rack.
fv = −Kx (3.2)
The Coulomb friction does not depend on the amplitude of velocity. It has a
constant value (Kc), but the force (fc) has an opposite direction to the velocity’s
fc = −Kc · sign(x) =
−Kc
x
|x|if x 6= 0,
0 if x = 0.
(3.3)
CHAPTER 3. SYSTEM IDENTIFICATION 7
The whole friction is the sum value of the viscous and the Coulomb friction.
In many cases types of friction modeling mentioned above are not effective, and
it is necessary to use more phenomena — like static friction — to get more sufficient
results. In our study these friction models gave satisfactory results.
Spring
The identification gave better results when a spring was modeled in the system. The
value of the spring force (fb) and its direction linearly (−B) depends on the mass
position
fb = −B · x (3.4)
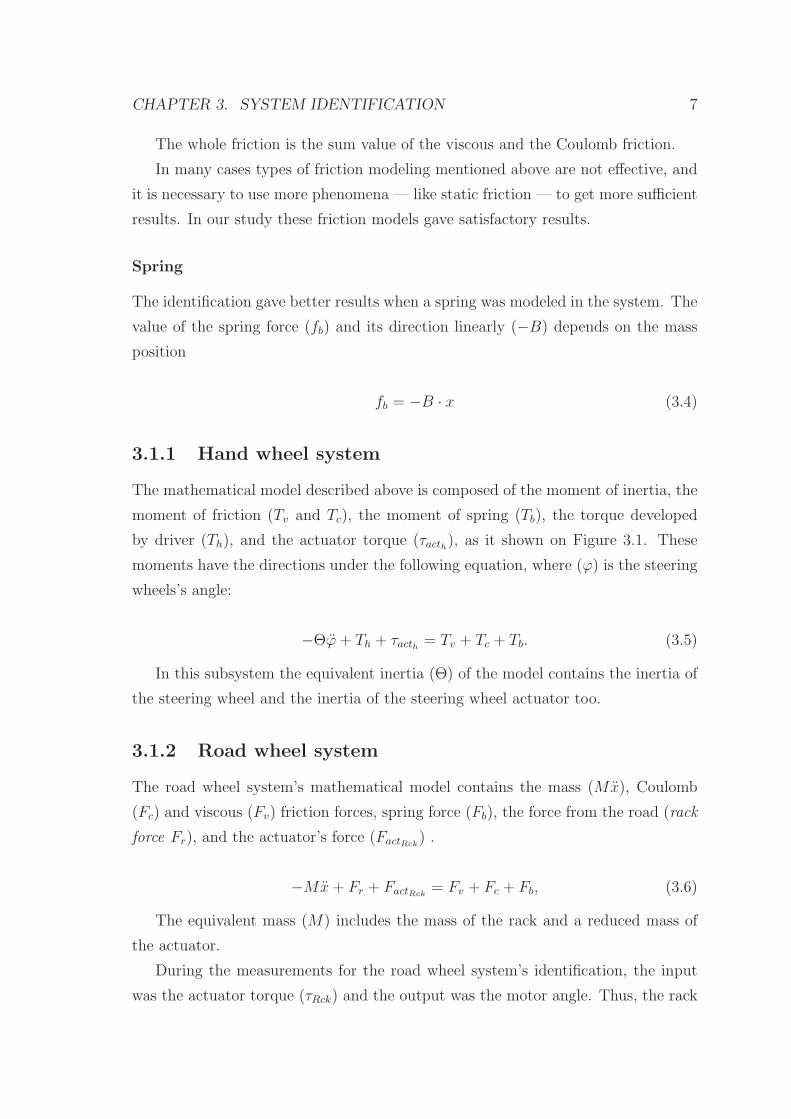
3.1.1 Hand wheel system
The mathematical model described above is composed of the moment of inertia, the
moment of friction (Tv and Tc), the moment of spring (Tb), the torque developed
by driver (Th), and the actuator torque (τacth), as it shown on Figure 3.1. These
moments have the directions under the following equation, where (ϕ) is the steering
wheels’s angle:
−Θϕ + Th + τacth = Tv + Tc + Tb. (3.5)
In this subsystem the equivalent inertia (Θ) of the model contains the inertia of
the steering wheel and the inertia of the steering wheel actuator too.
3.1.2 Road wheel system
The road wheel system’s mathematical model contains the mass (Mx), Coulomb
(Fc) and viscous (Fv) friction forces, spring force (Fb), the force from the road (rack
force Fr), and the actuator’s force (FactRck) .
−Mx + Fr + FactRck= Fv + Fc + Fb, (3.6)
The equivalent mass (M) includes the mass of the rack and a reduced mass of
the actuator.
During the measurements for the road wheel system’s identification, the input
was the actuator torque (τRck) and the output was the motor angle. Thus, the rack

CHAPTER 3. SYSTEM IDENTIFICATION 8
ΘTInStw = Th + τacth
Tv + Tc
Tb
iTh
+τacth
RR
Figure 3.1: Understanding the hand wheel subsystem’s mathematical model
forces should be converted into torques on the actuator’s mean, the rack motion
needs to be transformed to motor angle, see Figure 3.2.
For these calculations there is a linear transformation between xRck and ϕRck
xRck = isϕRck. (3.7)
Where is is the transmission of the ball-screw drive described in Chapter 2
is =7 · 10−3
2π
m
rad. (3.8)
Via this transmission all parallel forces actuating on the rack can be transformed
into torque with effect on the mean of the motor.
TRack = FRack · is (3.9)
The equation (3.9) shows the relation between an arbitrary torque TRack and the
force FRack belongs to that.
Hence, instead of (3.6) a mathematical model described in the following form
will be used for identification.
−ΘRck · ϕRck + TRck + τRck = TvRck+ TcRck
+ TbRck(3.10)

CHAPTER 3. SYSTEM IDENTIFICATION 9
Where ΘRck is the equivalent inertia of the rack. The actuator’s angle is ϕRck, the
acceleration of this angle is ϕRck. The the rack force equivalent torque is TRck, the
actuator torque is τRck. The viscous friction torque is TvRck, the Coulomb–friction
torque is TcRck, and the spring torque is TbRck
.
M Fr + FactRck
Fv + Fc
Fb
iaa
Fr
sτRck
Figure 3.2: Understanding the road wheel subsystem’s mathematical model
3.1.3 System Ordinary Differential Equations
Inasmuch as the forces acting in the system are known, it is possible to create the
system ODEs to see the dynamics in an analytical form.
τacth + Th = Θϕ + KStwϕ + KcStwsign(ϕ) + BStwϕ (3.11a)
τRck + TRck = ΘRckϕRck + KRckϕRck + KcRcksign(ϕRck) + BRckϕ (3.11b)
Where ϕRck is the velocity of rack actuator angle, and similarly ϕStw is the
velocity of the steering wheel angle. The Coulomb–frictions are represented as KcStw
on the steering wheel subsystem, and KcRck on the road wheel subsystem. Similarly
KStw is the viscous friction on steering wheel subsystem and KRck is the viscous
friction on road wheel subsystem. The spring is modeled by BStw and BRck.
Both subsystems have two inputs, one external torque — the driver on the
steering wheel subsystem and the wheel load on the road wheel subsystem— and

CHAPTER 3. SYSTEM IDENTIFICATION 10
one applied actuator torque. The two torques effect the same inertia therefore one
can define TInStw and TInRck as the sum of system inputs.
TInStw = τacth + Th (3.12a)
TInRck = τRck + TRck (3.12b)
It is important for control, that there is only one controllable input in both
subsystems. The TRck and Th signals are not controllable, but they are reference
signals.
Transfer functions (Sh ,WRck) can be reached by Laplace transforming equations
(3.11) with the negligence of the Coulomb friction. The transfer function Sr describes
the system with TInStw input, and angle output. Transfer function WRck has TInRck
input, and motor angle output. The road wheel subsystem’s equation contains
another transfer function SR, that is describing the subsystem using force input and
position output.
Sh(s) =ϕ
TInStw
=1
Θs2 + KStws + BStw
(3.13a)
WRck = SR(s) · iS =ϕRck
TInRck
=1
ΘRcks2 + KRcks + BRck
(3.13b)
In cognition of Sh(s) and SR(s) it is possible to describe the system in the
following form, that is based on equations (3.12) and (3.13). That is an appropriate
description showing the architecture of the steer–by–wire system.
ϕ = Sh(s) (Th + τacth) (3.14a)
x = SR(s)
(
τRck
iS+ Fr
)
(3.14b)
CHAPTER 3. SYSTEM IDENTIFICATION 11
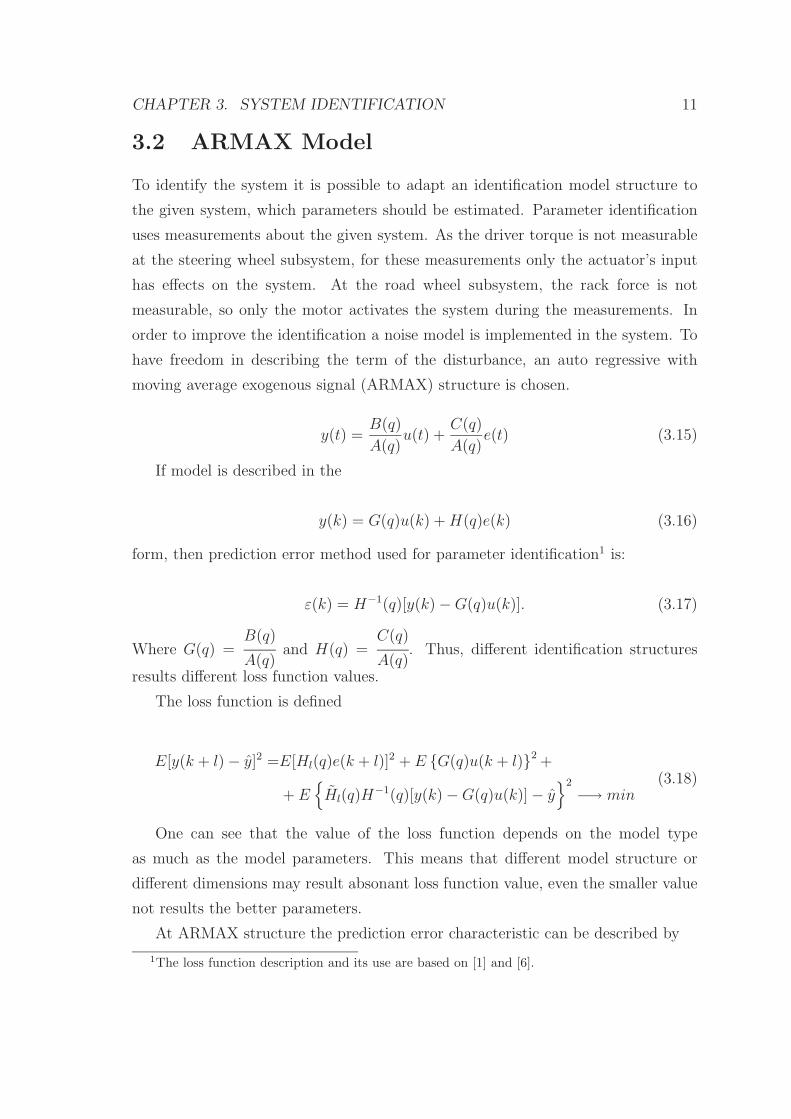
3.2 ARMAX Model
To identify the system it is possible to adapt an identification model structure to
the given system, which parameters should be estimated. Parameter identification
uses measurements about the given system. As the driver torque is not measurable
at the steering wheel subsystem, for these measurements only the actuator’s input
has effects on the system. At the road wheel subsystem, the rack force is not
measurable, so only the motor activates the system during the measurements. In
order to improve the identification a noise model is implemented in the system. To
have freedom in describing the term of the disturbance, an auto regressive with
moving average exogenous signal (ARMAX) structure is chosen.
y(t) =B(q)
A(q)u(t) +
C(q)
A(q)e(t) (3.15)
If model is described in the
y(k) = G(q)u(k) + H(q)e(k) (3.16)
form, then prediction error method used for parameter identification1 is:
ε(k) = H−1(q)[y(k) − G(q)u(k)]. (3.17)
Where G(q) =B(q)
A(q)and H(q) =
C(q)
A(q). Thus, different identification structures
results different loss function values.
The loss function is defined
E[y(k + l) − y]2 =E[Hl(q)e(k + l)]2 + E {G(q)u(k + l)}2 +
+ E{
Hl(q)H−1(q)[y(k) − G(q)u(k)] − y
}2
−→ min(3.18)
One can see that the value of the loss function depends on the model type
as much as the model parameters. This means that different model structure or
different dimensions may result absonant loss function value, even the smaller value
not results the better parameters.
At ARMAX structure the prediction error characteristic can be described by
1The loss function description and its use are based on [1] and [6].

CHAPTER 3. SYSTEM IDENTIFICATION 12
ϑ =[
a1 a2 . . . anab1 b2 . . . bnb
c1 c2 . . . cnc
]T
(3.19a)
VN(ϑ, ZN) =1
N
N∑
t=1
1
2|εF (t, ϑ)|2 (3.19b)
V′
N(ϑ, ZN) = −1
N
N∑
t=1
Ψ(t, ϑ)εF (t, ϑ), (3.19c)
where ϑ is a raw vector containing the actual parameter values. We can define
the first derivative of ε by ϑ as −Ψ(t, ϑ). Thus, it is possible to define V′
N(ϑ, ZN) as
the first derivative of the error characteristic.
V′′
N(ϑ, ZN) =1
N
N∑
t=1
Ψ(t, ϑ)ΨT (t, ϑ) (3.20)
Where V′′
N(ϑ, ZN) is called Hess-matrix. This allows to use the quasi-Newton
formula, that usually establishes a good and fast convergence. Ψ is described as:
Ψ(t) =1
C(q)·
·[
−y(t − 1) · · · − y(t − na) u(t) . . . u(t − nb + 1) ε(t − 1) . . . ε(t − nc)]T
(3.21)
The first step of the identification is to measure the input and output signals. It
was not possible to carry out new measurements, only to use existing data. At these
measurement inputs were sinusoid signals with different amplitude and frequency,
with the sample time T = 10−3s. Both frequency and amplitude have limitations
based on the physical constraints, for example backstop. The small amplitude causes
little velocity, and it highlights the friction non-linearities, so we neglected the mea-
surements which were hazardous in the aspect of this effect. Another disadvantage
of the existing measurements is that we are not able to make data sets for special
examination of a parameter. It is an easy way to determine the value of Coulomb–
friction by measuring the input value when the position starts changing, but in this
case we had to find another way to reach this parameter.
The models resulted from the identification were simulated with the measured
input, which was used for the identification itself. This way one could compare
the parameters of the measured outputs, and the simulation results, the outputs’
fit. Thus, it is possible to classify identified parameters by the loss function, and
simulation results, too.
CHAPTER 3. SYSTEM IDENTIFICATION 13
It is important to chose the model’s dimensions. At ARMAX model three di-
mension is have to be defined, the polynomial order of the polynomial A(q) is na,
the polynomial order of B(q) is nb, and C(q) has polynomial order nc. Proceeding
equations (3.13) the ARMAX model dimensions were chosen as na = 2 and nb = 1.
In order to identify the polynomial order of the moving average noise more values
were tried. We had to examine this dimension influence on the outputs’ fit. Small
dimensions had not resulted adequate fit, so a value nc = 10 was chosen for both
the steering wheel and the road wheel subsystems. The necessity of this accurate
disturbance model shows, that the systems have bad signal-to-noise ratios, or their
non-linearity is big.
Let us estimate the Coulomb–friction next. Coulomb–friction is realizable as an
additive torque on the system. One can reduce it from the measured inputs using a
simple subtraction. As the interpretable model structure is not changing, the best
Coulomb–friction value causes the smallest loss function value as it described in
equation (3.18). If one summarizes the loss function values resulted from a given
value of the Coulomb–friction on all measurement of the given system, the result
is a value that shows a type of goodness of the Coulomb–friction value. One can
determine the value resulting the smallest summation by using the MATLAB’s fmin-
search [4] command. This function is able to find a minimum of a scalar function of
several variables. It uses a simplex algorithm that does not depend on the gradient,
it changes the values directly, and keeps the resulting smaller value on the scalar
function. The loss function’s sum as the scalar function resulted different minimums
at variant initial states. Presumably the function finds a local minimum point —
that depends on initial values — and stops there. Hence the function resulting the
loss functions’ sum has run in a wide range of Coulomb–friction values. One can plot
the resulting values as the function of the Coulomb-friction. It is possible to find
the minimum of the loss function on that figure, and to get the Coulomb–friction
which belongs to that.
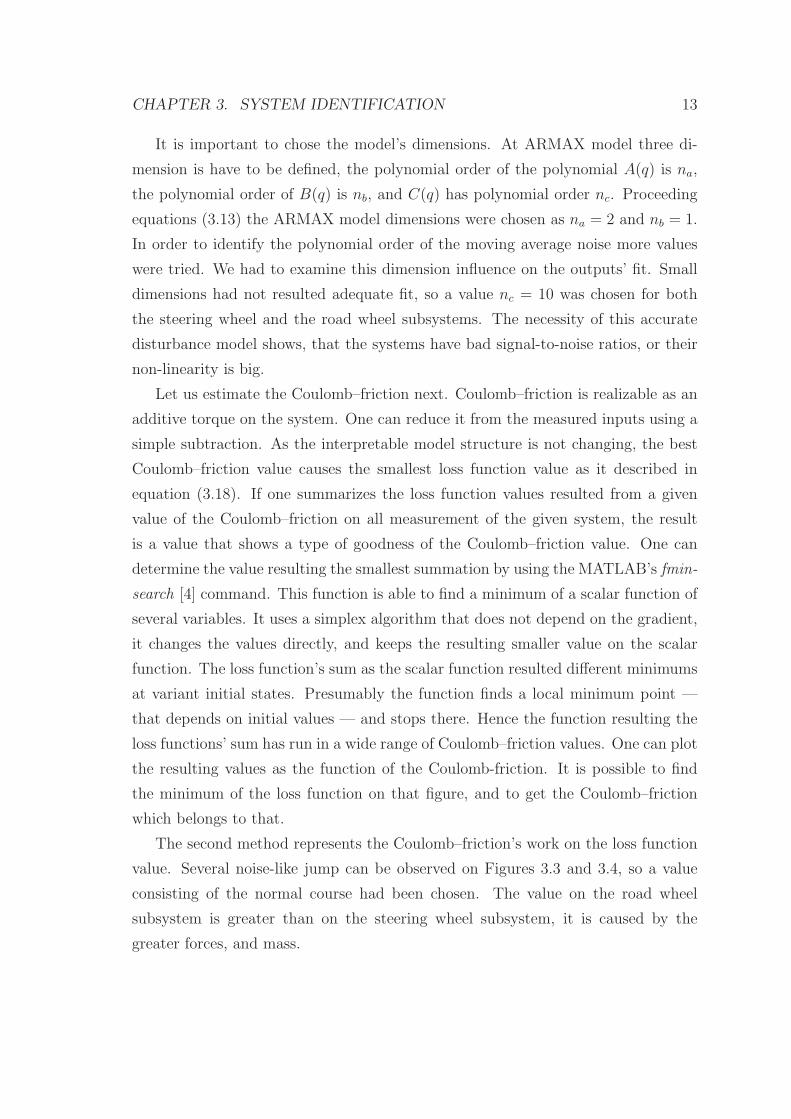
The second method represents the Coulomb–friction’s work on the loss function
value. Several noise-like jump can be observed on Figures 3.3 and 3.4, so a value
consisting of the normal course had been chosen. The value on the road wheel
subsystem is greater than on the steering wheel subsystem, it is caused by the
greater forces, and mass.

CHAPTER 3. SYSTEM IDENTIFICATION 14
KCoulombStw = 0.192Nm (3.22a)
KCoulombRckθ = 0.368Nm (3.22b)
−1 −0.8 −0.6 −0.4 −0.2 0 0.2 0.4 0.6 0.8 19.76
9.78
9.8
9.82
9.84
9.86
9.88
9.9
9.92x 10
−10
[Nm]
Val
ue
ofth
elo
ss–f
unct
ion
Figure 3.3: Loss-function final values based on Road-wheel Coulomb–friction
As there are more measurements for each subsystems, the linear transfer
functions — obtained from the ARMAX method, feed–forwarding the identified
Coulomb–friction values — are not the same. Presumably this effect is caused by
other non-linearities. Like by the estimation of the Coulomb–friction the decision
between these models based on error minimizing. Thus, the task is to choose the
model which causes the smallest error covariance under all measured data for that
subsystem. Hence, these models have been used to describe the system, and control
developing had been based on these models, too.
Steering wheel
The above identified discrete time transfer function is:
ShDiscrete =2.605 · 10−5
z2 − 1.9988z + 0.9988(3.23)
The transfer functions derived from the identification of other measurements had
parameter differences in the values’ last two decimals.
CHAPTER 3. SYSTEM IDENTIFICATION 15
0 0.1 0.2 0.3 0.4 0.5 0.6 0.7 0.8 0.9 13.165
3.17
3.175
3.18
3.185
3.19
3.195
3.2
3.205
3.21x 10
−6
[Nm]
Val
ue
ofth
elo
ss–f
unct
ion
Figure 3.4: Loss-function final values based on Steering-wheel Coulomb–friction
This transfer function can be transformed to continuous time. Assuming zero
order hold on its input, the transformation only bases on z = e−sT , and can be
computed by the MATLAB’s d2c command. The zero order hold inserts a zero in
the continuous time transfer function compared to (3.13). The polynomial element
−0.01303 · s on the numerator of the continuous time, can be neglected, because of
its small value.
Sh =−0.01303s + 2.606
s2 + 1.153s + 0.0567(3.24)
Thus, from equation (3.13) and (3.24) parameters introduced in section 3.1 are
able to be assigned.
Θ = 0.0384kgm2
KStw = 0.0443Nms
rad(3.25)
BStw = 0.0022Nm

CHAPTER 3. SYSTEM IDENTIFICATION 16
Rack
The discrete time transfer function for the road wheel subsystem identified by the
ARMAX method is described in equation
WRckDiscrete =6.613 · 10−7
z2 − 1.9922z + 0.9922. (3.26)
The transfer functions derived from the identification of other measurements had
parameter differences in the values’ last two decimals.
Analogous to steering wheel subsystem, this transfer function can be transformed
to continuous time. The continuous transfer function
WRck =−0.0003s + 0.6639
s2 + 7.861s + 0.8585(3.27)
describes the system’s dynamics between the actuator’s torque and the motor angle.
To get the equivalent rack mass, it is necessary to convert the transfer function input
into force and output into position. This force-to-position transfer function contains
the parameters have been shown in section 3.1
M = 1352kg
KxRck = 10629Ns
m(3.28)
BxRck = 1161N
m
The big value of the mass is caused the reduced motor inertia.
The Coulomb–friction’s value has to be converted to attain a full set of param-
eters about the forces actuating the road wheel subsystem.
KxcRck = 330.316Ns
m(3.29)

CHAPTER 3. SYSTEM IDENTIFICATION 17
3.3 Simulink model of the system
Using Simulink environment to examine the identified steer–by–wire system’s ability,
it is important to create a Simulink model.
The easiest method for modeling the system is the usage of continuous transfer
function blocks. It is possible to describe the whole system with two transfer func-
tion blocks. This architecture makes impossible to examine all signals, such as the
velocity of the rack’s position, or the value of the friction force.
In this case it is recommended to use another block diagram, that relies on the
ordinary differential equations of the system. The model’s input (see on Figure
3.5) is the superposition of the external forces, for example at the steering wheel
subsystem it is TInStw see equations (3.12). This force is reduced with the friction
force and the spring force. Consequently, it equals numerically to the product of the
mass and the acceleration. Thus, the output of the system is the second integral of
the acceleration, that is the position. All other signals modeled in section 3.1 are
possible to be measured. For example the friction force can be measured after the
light blue gain block, K.
1
position
1s
Integrator1
1s
Integrator
1/Theta
B
K
1
Torque
1
position
1s
Integrator1
1s
Integrator
1/M
B
K
1
Force
Figure 3.5: Create steer–by–wire model in Simulink environment

Chapter 4
Model Reference Control
As it have been indicated in section 1, simple force feedback requires excessing
torque from the driver, so it is important — in the aspect of choosing the control
structure — to create the possibility of decreasing the driver’s torque. Another
problem is— as a common requirement for control — that the system must be
stable despite of the uncertain biomechanical dynamics of the driver, or uncertain
vehicle dynamics. An obvious solution is to copy the properties of a conventional
steering system. This conventional steering system might be a mechanical steering
system without power assistance, or a modern car, with hydraulic power assistance
(HPAS), electro–hydraulic power assistance (EHPAS), or electric power assistance
(EPAS). The whole system can be divided into two parts from the control’s point of
view. The first part is the manual steering, which can be approximately described
with a linear model. The other part, the power steering part is generally non-linear.
This subsystem is missing at mechanical steering systems.
The proposition is to copy the dynamics of another system means, that all dy-
namics of the steer–by–wire systems may be change. This might allow to the driver
to adjust the dynamics, even the power assist to its condition, driving habits or to
the weather conditions, making the steering more comfortable, safe and enjoyable.
The following section first introduces the power assisted steering system model,
and describes the three control methods developed in the diploma.
18

CHAPTER 4. MODEL REFERENCE CONTROL 19
4.1 Power Assisted Steering System
In order to create a control over the steer–by–wire system which copies the dynamics
of a power steering system, it is inevitable to know a mathematical model about
that. In this thesis the power assisted steering system (power system) model is
divided into three parts.
The first part — like at the steer–by–wire system — is the steering wheel part. Its
dynamics are described by a moment of inertia, and friction moment. The external
forces acting in this part are the driver torque and another torque from the torsion
bar.
The second part is the torsion bar, that accomplishes force and position rela-
tionship between steering wheel, and road wheel subsystems. In reality this spring
has end–stops to prevent the torsion bar from irreversible deformations, so it can
usually not be modeled by linear characteristic, but only big external torque enable
to the spring to reach this external frame, so we mostly used a linear spring model
for it
TTS = PP (s)
(
ϕPS −xr
iP
)
, (4.1)
where PP (s) is a constant in linear cases. Another constant in this equation is ip,
that is the transmission constant between rack and steering column.
iP =0.05047
2π
m
rad(4.2)
The third part is the road wheel subsystem. Like the steering wheel subsystem
in the power system, it is modeled by a mass and friction. It has actuating forces
from the torsion bar, from the road, and — if it is not a model of a mechanical
steering — there is the assist force Fa,PS, that usually acts on the rack.
Now, the power system can be described with the following mathematical model:
ϕPS = Ph(s) (Th − TTS) (4.3)
xrPS = PR(s)
(
TTS
iP+ Fa,PS + Fr
)
. (4.4)
TTS is the torsion bar’s torque, it has an opposite direction to the driver’s torque.
Ph is a transfer function from torque to angle on the steering wheel subsystem, PR
is a transfer function from force to position on the road wheel subsystem.

CHAPTER 4. MODEL REFERENCE CONTROL 20
TTS
ΘPS MPS
KrPSKhPS
Figure 4.1: Power system’s mathematical model
The power system’s exact values, and Ph, PR transfer functions are described in
the following equations
Ph =1
ΘPS · s2 + KhPS · s=
22.22
s2 + 0.2222 · s(4.5)
PR =1
MPS · s2 + KrPS · s=
0.0007143
s2 + 0.001357 · s(4.6)
PP = 91.67Nm
rad(4.7)
CHAPTER 4. MODEL REFERENCE CONTROL 21
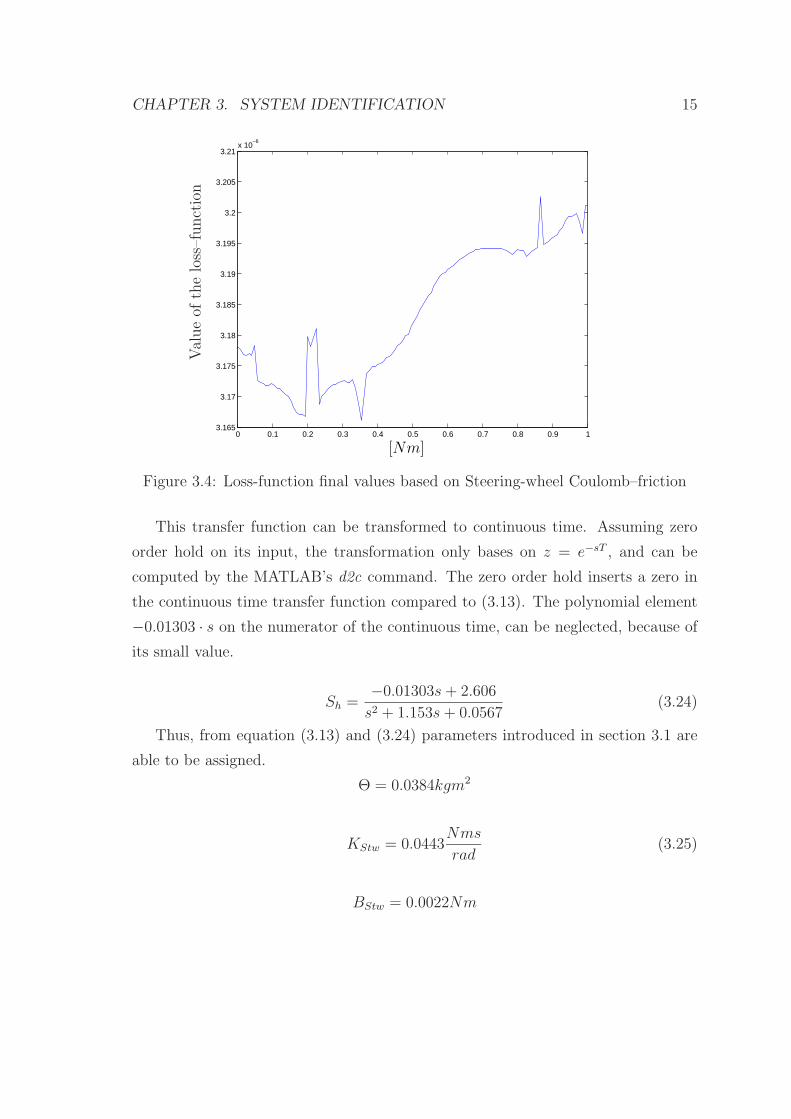
4.2 Concept of making steer–by–wire feeling
We follow the concept of [3] to copy the properties of a conventional steering system,
which means the equivalence of positions and forces between steering wheel and road
wheel subsystems in both directions. This equivalence might be mathematically
reached, if the equivalence of both external inputs — the τacth and τRck — call forth
equivalence of rack position and steering wheel angle.
Thus, one can evaluate from equations (4.1) – (4.4) for the power system:
Th = ϕPS
(
1
Ph
+ PP
)
− xr
PP
iP(4.8a)
Fr = xrPS
(
1
PR
+PP
iP2
)
−PP
iPϕPS − Fa. (4.8b)
Assimilating the steer–by–wire system with the power system, the actuator’s
torque has to simulate the torque from the spring. Another task of each actuator
is to change the given subsystem’s dynamics to the copied conventional system’s
dynamics, and the road wheel actuator already has the same objective as on the
power system to generate the assist force. Thus, the torque of the steering wheel
actuator depends on the steering wheel angle — torque for changing the dynamics
— and rack position — torque of the torsion bar. Similarly, the torque of the road
wheel actuator depends on the steering wheel angle — torque of the torsion bar —
and rack position — torque for changing the dynamics. The superposition of these
torques gives the steer–by–wire actuators torque:
[
τacth
τRck
]
=
[
C11 C12
C21 C22
][
ϕ
x
]
+
[
0
C25
]
Fa (4.9)
Where Cxy is a transfer function between position and requested torque.
In order to reach the equivalence of the two systems, these Cxy functions should
be determined. The problem can be resolved by transforming the steer–by–wire
equations (3.14) and (4.9) into a form similar to the power system’s equation (4.8),
where Sh and Sr are the identified steering system’s transfer functions.
Th = ϕ
(
1
Sh
+ C11
)
+ C12xr (4.10a)
Fr = x
(
1
SR
−C22
iS
)
−1
iS(ϕC21 + C25Fa) (4.10b)
Making equations (4.8) and (4.10) equal the functions which ensure that the
systems’ equality can be accomplished:

CHAPTER 4. MODEL REFERENCE CONTROL 22
C11 = PP +1
Ph
−1
Sh
= (4.11a)
=3.84s2 − 19.84s + 5.309 · 104
579.2
C12 = −PP
iP S= −1.141 · 104 (4.11b)
C21 =iSPP
iP= 12.71 (4.11c)
C22 = −iSPP
iP2 + iS
(
PR − SR
PRSR
)
= (4.11d)
=−4.101 · 10−12s2 + 6.477 · 10−6s − 0.0008653
5.471 · 10−7
C25 = iS = 1.114 · 10−3 (4.11e)
Since C11 and C22 have larger dimensions on their numerator than on their
denumerator, these transfer functions are acausals, that means that the signal values
from the future are used for computing the output. According to [3] it is possible to
solve this problem by inserting a second order low–pass filter with transfer function,
where ξ = 1 and T = (2π500)−1:
WLowPass =1
T 2s2 + Tξs + 1=
1
1.013e · 10−7s2 + 0.0003183s + 1(4.12)
According to the previous discussion, four transfer functions can exactly deter-
mine the power system. One of these transfer functions converts the driver’s torque
to steering wheel’s angle (P11), the other one is the transfer function that converts
the driver’s torque to rack position (P12). There are two transfer functions that
describe the effects of the rack force, one of them actuates the rack itself (P22), and
the other one effects on the steering wheel (P21). An additional transfer function
should be added to this system to describe the effect of the assist force on the rack.
Thus, equation
[
ϕ
x
]
=
[
P11 P21
P12 P22
][
Th
Fr
]
+
[
0
P23
]
Fa (4.13)
can describe the complete power steering system. The steer–by–wire control de-
scribed above can be rated, if the power system’s transfer functions can be cor-
responded — with the same inputs and outputs — to the ones of steer–by–wire
system.

CHAPTER 4. MODEL REFERENCE CONTROL 23
Th
2phi_PS1
1x_PS
1/i_P
1/i_P
1/i_P
P_R
−1
−1
1/i_P
P_P
P_P
P_PP_P
P_h
2T_h
1F_r
phi_PSphi_PS
x_PS
x_PS
x_PS
Figure 4.2: The power system model in MATLAB Simulink environment
Figure 4.2 shows the power system’s block–diagram. Using this figure it is pos-
sible to create Pio (input-output) transfer functions.
As figure shows, both subsystems have two feedbacks, one is across the torsion
bar (PP ) to itself, and a second one across the other subsystem — with the other
subsystem’s first feedback — and the torsion bar. The block–diagram becomes
simpler if this first feedback integrated into the system blocks, as it follows
PhB =Ph
1 + Ph · PP
(4.14a)
PRB =PR
1 +PR · PP
iP2
. (4.14b)
Thus, PhB describes a system with driver torque input, steering wheel output
across Ph, and a negative feedback PP . Similarly to this PRB describes a system with
input rack force, output rack position, across PR, and negative feedback PP /iP2.
Using these simplifications on the transfer functions for equation (4.13) we get:
CHAPTER 4. MODEL REFERENCE CONTROL 24
P11 =PhB
1 −PhB · P 2
P · PRB
iP2
=22.22s2 + 0.03123s + 23350
s4 + 0.2263s3 + 3088s2 + 236.4s(4.15a)
P12 =
PhB · PP · PRB
iP
1 −PhB · P 2
P · PRB
iP2
=187.6
s4 + 0.2236s3 + 3088s2 + 236.4s(4.15b)
P21 =
PhB · PP · PRB
iP
1 −PhB · P 2
P · PRB
iP2
=187.6
s4 + 0.2236s3 + 3088s2 + 236.4s(4.15c)
P22 =−PRB
1 −PhB · P 2
P · PRB
iP2
==−0.0007396s2 − 0.0001644s − 1.507
s4 + 0.2236s3 + 3088s2 + 236.4s(4.15d)
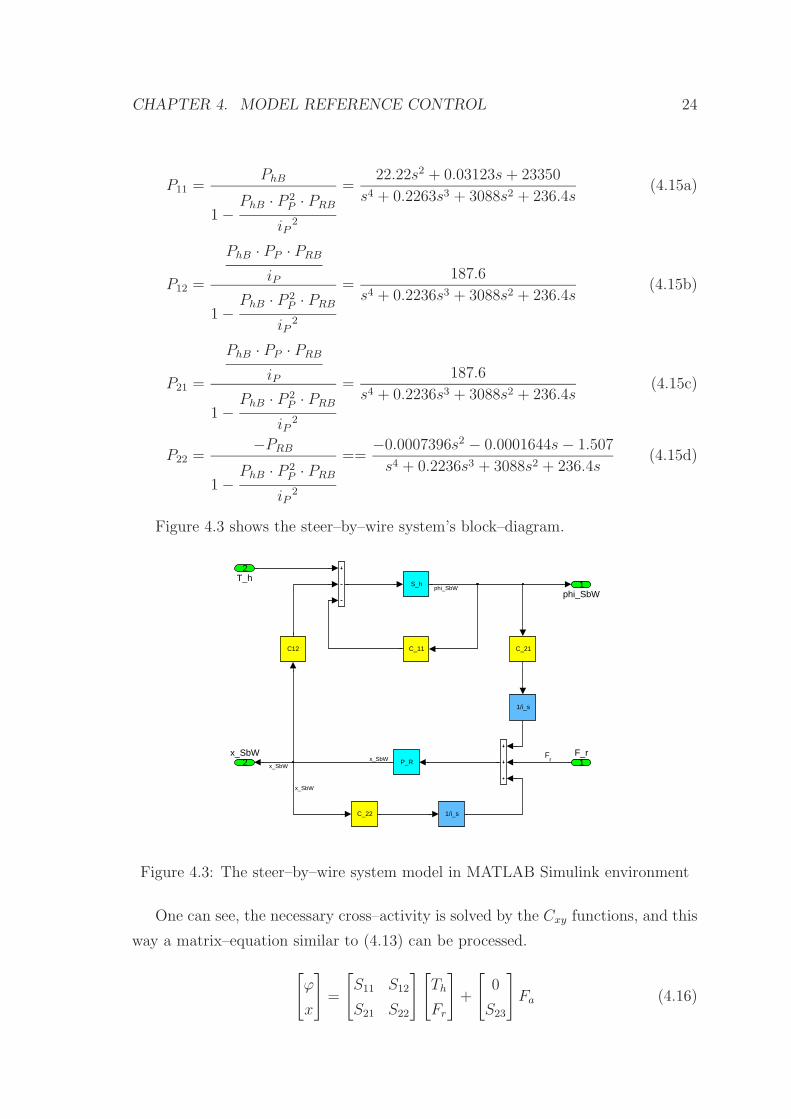
Figure 4.3 shows the steer–by–wire system’s block–diagram.
Fr2
x_SbW
1phi_SbW
1
Gain2
1
Gain1
1/i_s
1/i_s
P_R
C12
C_22
C_21C_11
S_h
2T_h
1F_r
phi_SbW
x_SbW
x_SbW
x_SbW
Figure 4.3: The steer–by–wire system model in MATLAB Simulink environment
One can see, the necessary cross–activity is solved by the Cxy functions, and this
way a matrix–equation similar to (4.13) can be processed.
[
ϕ
x
]
=
[
S11 S12
S21 S22
] [
Th
Fr
]
+
[
0
S23
]
Fa (4.16)

CHAPTER 4. MODEL REFERENCE CONTROL 25
Similarly to power system’s transfer functions this figure might be reduced by
defining inner feedbacks. The inner feedbacks contain the C11 or C22 transfer func-
tions:
ShB =Sh
1 + Sh · C11
(4.17a)
SRB =SR
1 +SR · C22
is
(4.17b)
Where Sh and SR transfer functions are identified in section 3.2.
Based on the short-circuit block–diagram the transfer functions Sio were possible
to be counted in the form:
S11 =ShB
1 +ShB · C12 · SRB · C21
is
(4.18a)
S12 =−ShB · C12 · SRB
1 +ShB · C12 · SRB · C21
is
(4.18b)
S21 =
ShB · C21 · SRB
is
1 +ShB · C12 · SRB · C21
is
(4.18c)
S22 =−SRB
1 +ShB · C12 · SRB · C21
is
(4.18d)
The equality of the assist forces depends on another effect. Especially, the assist
force of the power system is —as described above —a generically non-linear function.
Its variables might be for example the torque of the torsion bar, the steering wheel’s
angle and the vehicle speed. All the signals it uses as variables are measurable on
the steer–by–wire system, or they appear on the outputs of the C12 and C21 transfer
functions, so S23 needs to be equal to P23 in order to copy the power system’s
characteristics.
Now, all transfer functions of the two linear systems — the power steering system
and the steer–by–wire system — are known. With drawing the Bode-plots of com-
pounding transfer functions, it is possible to get information about the similarity of
the two systems.

CHAPTER 4. MODEL REFERENCE CONTROL 26
−60
−50
−40
−30
−20
−10
0
10
20
30
40M
agni
tude
(dB
)
100
101
102
103
−90
−45
0
45
90
Pha
se (
deg)
Bode Diagram
Frequency (rad/sec)
(a) P11 and S11
−150
−100
−50
0
Mag
nitu
de (
dB)
100
101
102
103
−270
−225
−180
−135
−90
−45
Pha
se (
deg)
Bode Diagram
Frequency (rad/sec)
(b) P12 and S12
−150
−100
−50
0
Mag
nitu
de (
dB)
100
101
102
103
−270
−225
−180
−135
−90
−45
Pha
se (
deg)
Bode Diagram
Frequency (rad/sec)
(c) P21 and S21
−140
−130
−120
−110
−100
−90
−80
−70
−60
−50
−40
Mag
nitu
de (
dB)
100
101
102
103
90
135
180
225
270
Pha
se (
deg)
Bode Diagram
Frequency (rad/sec)
(d) P22 and S22
Figure 4.4: Compare the Bode-diagram of compounding transfer functions
As it can be seen on Figure 4.4 in frequency domain the compounding transfer
functions are the same in the examined range, that encompasses the interval of
the usual driving. In MATLAB Simulink environment it is possible to test the
two systems. To examine the equality of the power system, and the steer–by–wire
system, both systems are driven by the same driver (the Simulink block diagram is
illustrated on Figure 4.6). The driver is modeled with a PID controller, that has
the transfer function WPID.
WPID = 501 +500
s+ 1s (4.19)
Both of the PID controllers have got the same reference signal for steering wheel’s
angle. The measured signals are the angle, the rack’s position, and the driver’s
torque to test the feeling equality. The results — are shown in Figure 4.5 — show
small difference between the conventional steering system and steer–by–wire system.
In section 3.2 it was shown, that the not modeled non-linearities can cause un-
certainty in the steer–by–wire system’s parameters. These uncertainties might cause

CHAPTER 4. MODEL REFERENCE CONTROL 27
0 1 2 3 4 5 6 7 8 9 10−1
−0.5
0
0.5
1Steering Wheel Angle
time [sec]
Ang
le [r
ad]
0 1 2 3 4 5 6 7 8 9 10
−2
0
2
x 10−4
time [sec]
Ang
le d
iffer
ence
[rad
]
(a) The steering wheel angles
0 1 2 3 4 5 6 7 8 9 10−30
−20
−10
0
10
20
30Driver Torque
time [sec]
Tor
que
[Nm
]
0 1 2 3 4 5 6 7 8 9 10−0.2
−0.15
−0.1
−0.05
0
0.05
0.1
0.15
time [sec]
Fee
ling
erro
r [N
m]
(b) The driver’s torques
0 1 2 3 4 5 6 7 8 9 10−6
−4
−2
0
2
4
6x 10
−3 Rack position
time [sec]
Rac
k po
sitio
ns [m
]
0 1 2 3 4 5 6 7 8 9 10−1
−0.5
0
0.5
1x 10
−5
time [sec]
posi
tions
diff
eren
ce [m
]
(c) The rack’s positions
Figure 4.5: Compare the power system and the steer–by–wire system
steady state error in the feeling. The control designed above has not got the ability
to eliminate this error. It is usual to examine the effected parameter fluctuations by
changing the system’s parameters manually by ±25% of its values in the simulation,
but using the original controller designed for nominal system. Transfer functions
for Bode-plots can be computed by using Cxy for the original system, and the other
transfer functions in steer–by–wire system are used with the changed parameters.
Decreasing parameters by 25% cause a positive offset on the system’s Bode–plot,
and it increases the feeling error as well as the steering wheel position and the rack
position does not match the values on the power system.
As it was shown in this section this control strategy ensures a high level of
equivalence while the system parameters have no uncertainty.

CHAPTER 4. MODEL REFERENCE CONTROL 28
In1
In2
Xrck1
In1
In2
Torq_D
In1
In2
StASine Wave1
Tq_SteWhl
An_SteWhl
x_rack
SbW_Controlled1
Tq_SteWhl
An_SteWhl
x_rack
PowerSystem
PID
PID
D2R
D2R1
C25
Figure 4.6: The Simulink environment block diagram testing the equality
−150
−100
−50
0
Mag
nitu
de (
dB)
100
101
102
103
−270
−180
−90
0
Pha
se (
deg)
Bode Diagram
Frequency (rad/sec)
(a) P11 and S11
−150
−100
−50
0
Mag
nitu
de (
dB)
100
101
102
103
−270
−180
−90
0
Pha
se (
deg)
Bode Diagram
Frequency (rad/sec)
(b) P12 and S12
−150
−100
−50
0
Mag
nitu
de (
dB)
100
101
102
103
−270
−180
−90
0
Pha
se (
deg)
Bode Diagram
Frequency (rad/sec)
(c) P21 and S21
−140
−130
−120
−110
−100
−90
−80
−70
−60
−50
−40
Mag
nitu
de (
dB)
100
101
102
103
90
135
180
225
270
Pha
se (
deg)
Bode Diagram
Frequency (rad/sec)
(d) P22 and S22
Figure 4.7:
Bode-diagrams of power system’s (blue) and steer–by–wire system’s (green) if
system parameters are reduced by 25%

CHAPTER 4. MODEL REFERENCE CONTROL 29
0 1 2 3 4 5 6 7 8 9 10−1
−0.5
0
0.5
1Steering Wheel Angle
time [sec]
Ang
le [r
ad]
0 1 2 3 4 5 6 7 8 9 10−0.02
−0.015
−0.01
−0.005
0
0.005
0.01
0.015
time [sec]
Ang
le d
iffer
ence
[rad
]
(a) The steering wheel angles
0 1 2 3 4 5 6 7 8 9 10−30
−20
−10
0
10
20
30Driver Torque
time [sec]
Tor
que
[Nm
]
0 1 2 3 4 5 6 7 8 9 10−10
−5
0
5
10
time [sec]
Fee
ling
erro
r [N
m]
(b) The driver’s torques
0 1 2 3 4 5 6 7 8 9 10−6
−4
−2
0
2
4
6x 10
−3 Rack position
time [sec]
Rac
k po
sitio
ns [m
]
0 1 2 3 4 5 6 7 8 9 10−6
−4
−2
0
2
4
6x 10
−4
time [sec]
posi
tions
diff
eren
ce [m
]
(c) The rack’s positions
Figure 4.8:
Compare the power system (blue) and the steer–by–wire system (green) if system
parameters are reduced by 25%

CHAPTER 4. MODEL REFERENCE CONTROL 30
4.3 Model reference controller
As it was stated in section 4.2, the linear power system can be described by using
four transfer functions. These four transfer functions are defined in equation (4.15).
In the practical use of control systems it is common to specify the closed–loop
performance. In our case there are four separated transfer functions, even tough the
inputs or outputs are not completely independent. As a consequence of these four
transfer functions, the control loop has four controllers as well, four closed–loops.
The system is represented in equation (4.18). Thus, since steer–by–wire has only
two transfer functions, both of them needs to be controlled by two controllers. For
example the steering wheel subsystem has one transfer function on steer–by–wire,
but its output — based on the equality — dependens on both the driver’s angle and
the rack’s force. These two external inputs affect only one transfer function, that
similarly has two different specified closed–loop performances. This two–control–
for–one–process system is shown on Figure 4.9.
phi
urh
uhr
urr
2
x
1
phi
1
Gain3
uhh
uhr+urr
uhh
uhr+urr
urh
uhh+urh
uhh
uhh+urh
Control_12
1
Control_22
Control_21
Control_11
S_r
S_h
2
F_r
1
T_h
x
uhh
Figure 4.9: The Simulink environment block diagram testing the equality
By examing the closed–loop performance it is necessary to know the effect of

CHAPTER 4. MODEL REFERENCE CONTROL 31
the coherent input. It is possible to share the output value on the basis of the
proportions measured on the inputs, using the linear system’s superposition ability.
On the other hand it is not possible to measure the values of the external inputs
(rack force and driver torque) for counting its weights. This problem might be solved
by a load estimation [1] for the inputs Th and Fr. The controller described in section
4.2 does not need numerical information about these inputs. Figure 4.10 shows the
block diagram of the MRAC system complemented by the load estimation.
r_est
External Force
Load Estimator
Model Reference Controller
Process
Reference Model
y_m
y
y
actuator_force
r
Figure 4.10: The block diagram of the adaptive control with load change

CHAPTER 4. MODEL REFERENCE CONTROL 32
4.3.1 Two–degree–of–freedom controller
This model reference controller bases on a two–degree-of–freedom controller [1]. This
controller has a feedback compensator and a feedforward compensator, that means
there are two degrees of freedom on designing the closed–loop performance. Another
advantage of this controller is that it possibly offers more flexibility than other single
cascade compensations.
1y
T(s)
R(s)
S(s)
R(s)
B(s)
A(s)
1r
u
Figure 4.11: The Simulink environment block diagram testing the equality
This controller allows to describe a transfer function Bm/Am for the closed–loop.
This transfer function is called reference model, which is the same like the sufficient
Pio transfer function.
Wclosed−loop =
T
R
B
A
1 +B
A
S
R
=BT
AR + BS=
Bm
Am
= Pio (4.20)
Notice that B/A is the controlled system (Sh or SR), and polynomials R, S and
T should be designed during this procedure.
Introducing an observer polynomial Ao equation (4.20) can be written in the
following form
BT
AslR′
1 + BS=
Bm
Am
·Ao
Ao
. (4.21)
With the neglegances described in section 3.2 the equations (3.24) and (3.27)
shows that both Sh and SR transfer functions have constant numerators. Thus,
based on equation (4.21), the zeros of transfer function Pio must be among the roots
of the polynomial T . Thus, polynomial T is:
T =BmAo
B, (4.22)

CHAPTER 4. MODEL REFERENCE CONTROL 33
Usually integral action control is used which allows to separate the R polynomial
— where l is the number of the integrators —
R = slR′
1, (4.23)
and the following condition is given:
AslR′
1 + BS = AmAo (4.24)
A few polynomial order conditions have to be defined for causality.
The polynomial order of a polynomial X is shown by the value of grX.
Different power system transfer functions have different dimensions as it is shown
in Table 4.1.
P11 and P22 P12 and P21
grAm 4 4
grBm 2 0
grA 2 2
grB 0 0
Table 4.1: Polynomial orders of power system and steer–by–wire system
As Table 4.1 shows grA > grB. For the controller causality, it is necessary to
grR ≥ grS. Based on these two facts the expression below can be deducted using
equation (4.20).
gr(AR) = gr(AR + BS) = grB + grAm + grAo
gr(AR) = grA + grB ⇒ grR = grB + grAm + grAo − grA (4.25)
grR′
1 = grR − grB − l (4.26)
The values of grT is achieved using equation (4.22).
grT = grBm + grAo (4.27)
Another assumption for the controller causality is that grR > grT . In order to
resolve R′
1 and S in equation (4.24), the following condition must be realized:
grS < grA + l ⇒ grS := grA + l − 1 (4.28)

CHAPTER 4. MODEL REFERENCE CONTROL 34
Now the grR ≥ grS assumption gives the following inequality for the polynomial
Ao.
grB + grAm + grAo − grA ≥ grA + l − 1
grAo ≥ 2grA − grAm − grB − 1 + l (4.29)
The above mentioned integrator might have the effect to cancel the steady state
error on the closed–loop. At the power system, all the four transfer functions contain
an integrator. Thus, to get the mentioned effect of the integrator the closed–loop
should contain an additive one, so l = 2 was chosen. Another admissible parameter
is the value of grAo, and the value of its polynomial. As grAo ≥ 0 equation (4.29)
has no limitation about this value. A value of grAo = 2 was chosen, with the
parameters
Ao = s + 60. (4.30)
It is possible to find a basic difference between polynomials. If the first coefficient
is 1 than one can say, it is a monic. The following procedure utilises that the
polynomials A, R, Am and Ao are monics.
The next step is to solve equation (4.24). The solution for this equation provides
a solution for polynomials R′
1 and S. This equation is a Diophanthine-equation:
AD · X + BD · Y = CD (4.31)
Where AD ,BD CD is known as follows.
AD = Asl = As (4.32a)
BD = B (4.32b)
CD = AmAo (4.32c)
It is now important to view the exact polynomial orders of R′
1 and S to solve
the Diophanthine-equation. Thus, using equations (4.26) and (4.28), one gets the
values:
grR′
1 = 1 (4.33a)
grS = 3 (4.33b)

CHAPTER 4. MODEL REFERENCE CONTROL 35
P11 and P22 P12 and P21
grR′
1 1 1
grS 3 3
grR 3 3
grT 3 1
Table 4.2: Polynomial orders of the two–degree-of–freedom controller
Thus, the polynomial orders collected in Table 4.2.
All polynomial orders are known for the Diophanthine-equation, so these poly-
nomials are able to be written in the following form
R′
1 = 1s + R1 (4.34a)
S = S1s3 + S2s
2 + S3s + S4 (4.34b)
AD = s5 + A1s4 + A2s
3 (4.34c)
CD = s6 + C1s5 + C2s
4 + C3s3 + C4s
2 + C5s + C6. (4.34d)
Over these informations about the Diophanthine-equation, it can be transformed
to the following matrix form
CM = AM · BM .
C1 − A1
C2 − A2
C3
C4
C5
=
1 0 0 0 0
A1 B 0 0 0
A2 0 B 0 0
0 0 0 B 0
0 0 0 0 B
·
R1
S1
S2
S3
S4
(4.35)
Based on the fact that AD is a square–matrix, which can be inverted, so the
result vector BD is got by using the equation
BM = AM−1 · CM . (4.36)
Since polynomials S and T are defined above, only the value of R is not known,
but it is achieved in
R = B+ · R′
1 · sl. (4.37)

CHAPTER 4. MODEL REFERENCE CONTROL 36
An easy way to test the designed parameters is when the Bode-plots —the one
of the reference transfer function and the other of the closed–loop — are compared.
Shown on Figure 4.12.
−150
−100
−50
0
50
100
150
Mag
nitu
de (
dB)
10−3
10−2
10−1
100
101
102
103
−180
−135
−90
−45
0
Pha
se (
deg)
Bode Diagram
Frequency (rad/sec)
(a) P11 and S11
−200
−150
−100
−50
0
50
100
Mag
nitu
de (
dB)
10−3
10−2
10−1
100
101
102
103
−360
−270
−180
−90
Pha
se (
deg)
Bode Diagram
Frequency (rad/sec)
(b) P12 and S12
−200
−150
−100
−50
0
50
100
Mag
nitu
de (
dB)
10−3
10−2
10−1
100
101
102
103
−360
−270
−180
−90
Pha
se (
deg)
Bode Diagram
Frequency (rad/sec)
(c) P21 and S21
−200
−150
−100
−50
0
50
Mag
nitu
de (
dB)
10−3
10−2
10−1
100
101
102
103
0
45
90
135
180
Pha
se (
deg)
Bode Diagram
Frequency (rad/sec)
(d) P22 and S22
Figure 4.12:
Bode-diagrams of power system’s (blue) and steer–by–wire system’s with
two–degree–of–freedom (green)
In MATLAB Simulink environment it is possible to simulate the system without
the load estimation, using the real values from the model. The results — are shown
in Figure 4.13 — show improvement compared to the controller described in previous
section.
It is possible to model disturbances on the input and on the output of the steer–
by–wire system, in order to examine their effect on the closed–loop.
In this system the output depends on the signals r, d and e. another disturbance
is able to be modeled — the parameters’ uncertainty — that can be signed as
Wuncertainty = B/A. The relation is possible to be described in
y =B
A
(
T
Rr −
S
Ry + d
)
+ e. (4.38)

CHAPTER 4. MODEL REFERENCE CONTROL 37
0 1 2 3 4 5 6 7 8 9 10−1
−0.5
0
0.5
1Steering Wheel Angle
time [sec]
Ang
le [r
ad]
0 1 2 3 4 5 6 7 8 9 10−1
−0.5
0
0.5
1x 10
−11
time [sec]
Ang
le d
iffer
ence
[rad
]
(a) The steering wheel angles
0 1 2 3 4 5 6 7 8 9 10−40
−20
0
20
40Driver Torque
time [sec]
Tor
que
[Nm
]
0 1 2 3 4 5 6 7 8 9 10−6
−4
−2
0
2
4
6x 10
−9
time [sec]
Fee
ling
erro
r [N
m]
(b) The driver’s torques
0 1 2 3 4 5 6 7 8 9 10−0.01
−0.005
0
0.005
0.01Rack position
time [sec]
Rac
k po
sitio
ns [m
]
0 1 2 3 4 5 6 7 8 9 10−6
−4
−2
0
2
4x 10
−13
time [sec]
posi
tions
diff
eren
ce [m
]
(c) The rack’s positions
Figure 4.13:
Compare the derived power system (blue) and the 2DoF controlled steer–by–wire
system (green)
d e
1
y
T(s)
R(s)
S(s)
R(s)
B(s)
A(s)
3
e
2
d
1
ru
yyy
Figure 4.14: Two–degree–of–freedom controller with disturbances

CHAPTER 4. MODEL REFERENCE CONTROL 38
The three additional inputs — r, d and e — have three different transfer functions
on the system. These are described as:
y =BT
AR + BSr +
BR
AR + BSd +
AR
AR + BSe. (4.39)
Assuming a stable system, the effect of the uncertainties for step signals at time
infinity is accomplished by using the formula
hs = y(t → ∞) = lims→0
[
s ·y(s)
s
]
. (4.40)
Hence the closed–loop contains integrators the value of polynomial R at time
infinity is R(s = 0) = 0.
r = 1(t) ⇒yr(s → 0) =T (s → 0)
S(s → 0)(4.41a)
d = 1(t) ⇒yd(s → 0) = 0 (4.41b)
e = 1(t) ⇒ye(s → 0) = 0 (4.41c)
Thus, this controller has the property to compensate the steady state error, and
parameter uncertainty. The following figures (Figure 4.15 and 4.16) are illustrating
the integrator’s effect on uncertain model parameters. As above, at section 4.2, a
controller have been planned for the identified system, and another system — with
the nominal system parameters increased by 25% — has been used for computing
the closed–loop’s Bode–diagram (see Figure 4.15), and for running the simulation
with.
Bode-diagram on Figure 4.15 shows, that the closed-loop has only a small error
in frequency domain. On lower frequencies the difference is smaller, that is caused
by the integrator. This effect can be seen on Figure 4.16, too.
On the other hand the closed–loop’s stability depends on the roots of the equation
AR + BS = 0 (4.42)
Thus it depends on the rate of the uncertainties. Note, that the contemplation
of the controller using this polynomial method does not promise the stability of the
controller. It is possible to reach an unstable controller that is not realisable. Sim-
ulating with a growing frequency reference angle, the controller becomes unstable.
As it can be seen by the simulations (for example on Figure 4.16), without
assistance force, the driver needs to drive using big torque. This assist force, at this

CHAPTER 4. MODEL REFERENCE CONTROL 39
−150
−100
−50
0
50
100
150
Mag
nitu
de (
dB)
10−3
10−2
10−1
100
101
102
103
−225
−180
−135
−90
−45
0
Pha
se (
deg)
Bode Diagram
Frequency (rad/sec)
(a) P11 and S11
−200
−150
−100
−50
0
50
100
Mag
nitu
de (
dB)
10−3
10−2
10−1
100
101
102
103
−360
−270
−180
−90
Pha
se (
deg)
Bode Diagram
Frequency (rad/sec)
(b) P12 and S12
−200
−150
−100
−50
0
50
100
Mag
nitu
de (
dB)
10−3
10−2
10−1
100
101
102
103
−360
−270
−180
−90
Pha
se (
deg)
Bode Diagram
Frequency (rad/sec)
(c) P21 and S21
−200
−150
−100
−50
0
50
Mag
nitu
de (
dB)
10−3
10−2
10−1
100
101
102
103
−45
0
45
90
135
180
Pha
se (
deg)
Bode Diagram
Frequency (rad/sec)
(d) P22 and S22
Figure 4.15:
Bode-diagrams of power system’s (blue) and 2DoF controlled steer–by–wire
system’s (green)
control strategy can not be an arbitrary non–linearity, because the closed–loop must
be linear (see equation (4.20)).
There are several other possibilities for this assistance:
• The assist force can be described by a linear function K with driver torque
input. This way the transfer function P ′
12 can be defined in the form:
P ′
12 = K(s) · P12(s). (4.43)
• The assist force is a non–linear function, but its effect on the rack’s position
must be well known. This effect needs to be reduced from the rack’s position,
because it is important to close the loop with the feedback value it caused (see
Figure 4.9.)
Thus, the two–degree–of–freedom controller is able to make static uncertainties
disappear, but changing disturbances possibly make it unstable.

CHAPTER 4. MODEL REFERENCE CONTROL 40
0 1 2 3 4 5 6 7 8 9 10−4
−2
0
2
4Steering Wheel Angle
time [sec]
Ang
le [r
ad]
0 1 2 3 4 5 6 7 8 9 10−0.04
−0.02
0
0.02
0.04
0.06
0.08
time [sec]
Ang
le d
iffer
ence
[rad
]
(a) The steering wheel angles
0 1 2 3 4 5 6 7 8 9 10−100
−50
0
50
100Driver Torque
time [sec]
Tor
que
[Nm
]
0 1 2 3 4 5 6 7 8 9 10−40
−30
−20
−10
0
10
20
time [sec]
Fee
ling
erro
r [N
m]
(b) The driver’s torques
0 1 2 3 4 5 6 7 8 9 10−0.03
−0.02
−0.01
0
0.01
0.02
0.03Rack position
time [sec]
Rac
k po
sitio
ns [m
]
0 1 2 3 4 5 6 7 8 9 10−2
−1
0
1
2x 10
−3
time [sec]
posi
tions
diff
eren
ce [m
]
(c) The rack’s positions
Figure 4.16:
Compare the power system (blue) and the 2DoF controlled steer–by–wire system
(green) with parameters increased by 25%

CHAPTER 4. MODEL REFERENCE CONTROL 41
4.3.2 Model Reference Adaptive Control (MRAC)
The procedure described here is based on [2]. Many dynamic systems to be controlled
have both parametric and dynamic uncertainties. Adaptive control is an approach
for controlling such systems. Today, techniques from adaptive control are being used
to augment many of the existing controllers that have already a proven performance
for a certain range of parameters, and adaptation is being used to improve the
performance beyond those limits.
A control has been chosen to handle the uncertainties of the steer–by–wire system
called model reference adaptive control. This control is based on the above men-
tioned two–degree–of–freedom controller that has the ability to describe a transfer
function for the closed–loop. Thus, it is adjusting the parameters of the polynomial
R, T , and S, in order to achieve the reference transfer function. The adaptation law
is
dϑ
dt= γϕadaptivee. (4.44)
That depends on the gradient of the error e, on the value of the learning rate
γ, and on a sort of measured signals ϕadaptive. This adaptation method works for
strictly positive real systems.
Definition 1. A rational transfer function G with real coefficients is positive real if
Re G(s) ≥ 0 for Re s ≥ 0. A transfer function G is strictly positive real (SPR) if
G(s − ε) is positive real for some real ε > 0.
• The function has no poles in the right half-plane.
• G(s) has no poles or zeros on the imaginary axis.
• The real part of G(s) is nonnegative along the iω axis, that is, Re (G(iω)) ≥ 0
The error is the difference between the required and the current systems’ output.
Thus, this system requires the reference model’s real–time simulation to the control.
This simulation requires to know the exact values of the inputs driver’s torque and
rack’s force. Thus, a load estimation needs to be designed into the real loop.
The reference system is ym = Pior. The steer–by–wire system is described with
transfer functions Sh and SR, theirs input u, as it shown in Figure 4.11. Thus, the
controller can be written as follows:
u =T
Rr −
S
Ry. (4.45)
CHAPTER 4. MODEL REFERENCE CONTROL 42
Equation (4.20) can be adjusted to the following form:
AoAmy = (AslR′
1 + BS)y = R′
1(Asly) + BSy =
= R′
1sl(Bu) + BSy = B(Ru + Sy).
(4.46)
AoAmym = AoBmr = BTr (4.47)
Define the error as e(t) = ym(t) − y(t). Using equations (4.47) and (4.46), this
error can be expressed as a function of r, u and y:
AoAme = BTr − B(Ru + Sy) (4.48a)
e =B
AoAm
(Tr − Ru − Sy) (4.48b)
The transfer functionB
AoAm
in e is not SPR in all cases, so an error-filtering is
used.
ef :=Q
Pe (4.49)
Where Q should satisfy:
grQ ≤ gr(AoAm) (4.50a)
Q
AoAm
→ SPR (4.50b)
It is an easy way to design Q for AoAm if Q = AoAm. Polynomial P = P1P2.
Where grP1 > grP2, grP2 = grR = k, grS = l and grT = m, and P2 is monic. It is
possible to write R/P in the following form:
R
P=
R − P2 + P2
P1P2
=1
P1
+R − P2
P(4.51)
Now equation (4.49) can be converted into the form:
ef =Q
Pe =
BQ
AoAm
(
−u
P1
−R − P2
Pu −
S
P+
T
Pr
)
(4.52)
By parameterizing the filtered error, two vectors are possible to be defined.
ϑ0 := (r′
1, r′
2, . . . , r′
k, s0, s1, . . . , sl, t0, t1, . . . , tm)T (4.53)

CHAPTER 4. MODEL REFERENCE CONTROL 43
ϕadaptive :=
(
−pk−1
P (p)u, . . . ,−
1
P (p)u,−
pl
P (p)y, . . . ,−
1
P (p)y,
pm
P (p)r, . . . ,
1
P (p)r
)
(4.54)
Where p =d
dtis a differential operator. This simplifies the (4.52) expression.
ef =BQ
AoAm
(
−u
P1
+ ϕTadaptiveϑ0
)
(4.55)
The control law is chosen as u := ϑT (P1ϕadaptive) that is realizable. Thus, one
can make further expression for filtered error.
ef =BQ
AoAm
(
ϕTadaptiveϑ −
1
P1
ϑT (P1ϕadaptive)
)
=
=BQ
AoAm
ϕTadaptive(ϑ0 − ϑ) −
BQ
AoAm
(
1
P1
u − ϕTadaptiveϑ
) (4.56)
The error augmentation is η =
1
P1
u − ϕTadaptiveϑ
. The augmented error is ε,
described as:
ε := ef +BQ
AoAm
η (4.57)
It is possible to define variables ϕf and uf filtered signals.
ϕf =Q
AoAm
ϕadaptive (4.58a)
uf =Q
AoAmP1
u (4.58b)
The parameter adaptation law should be chosen to minimize the expression:
V =1
2ε2
p → min (4.59)
Where εp = ef − ef = ef − B(ϕTf ϑ − uf ) is the error of the prediction.
dϑ
dt= γϕfεp (4.60a)
dB
dt= γ0
(
ϕTf ϑ − uf
)
εp (4.60b)
The block diagram of the MRAC system is can seen on Figure (4.17).

CHAPTER 4. MODEL REFERENCE CONTROL 44
efeps
y_m
1Out1
−K−
gamma
u
u_c
y
P1fi
fi
u/P1
FILTER
MatrixMultiply
P_11
Shm_c
MatrixMultiply
1s
uT
uT
P11.Q(s)
P11.P(s)
P11.b0*P11.Q(s)
conv(P11.Ao,P11.Am)(s)
1r
e
d_teta
tetafi
fi
nu
Figure 4.17: Realization of the MRAC in Simulink environment
For the realization of this controller it is necessary to get the signals P1ϕadaptive,
ϕadaptive andu
P1
. These signals can be derived using r, u and y signals. The
polynomial form of P1 and P2 is:
P1 = pn + α1pn−1 + · · · + αn−1p + αn (4.61a)
P2 = pk + β1pk−1 + · · · + βk−1p + βk (4.61b)
Thus, the above mentioned problem can be solved as a special case of the fol-
lowing one:
P1ϕu∗= (x1, . . . , xk)
T , x1 =pk−1
P2
u∗, . . . , xk =1
P2
u∗ (4.62)
The generic solution requires two state–equations, and the results are going to
implemented as (x, z)u∗. These two differential equations in matrix form have the
polynomial companion matrix of the polynomials:

CHAPTER 4. MODEL REFERENCE CONTROL 45
x1
x2
x3
...
xk
=
−β1 −β2 . . . −βk−1 −βk
1 0 . . . 0 0
0 1 . . . 0 0...
. . ....
0 0 . . . 1 0
x1
x2
x3
...
xk
+
1
0
0...
0
u∗ (4.63a)
z1
z2
z3
...
zn
=
−α1 −α2 . . . −αn−1 −αn
1 0 . . . 0 0
0 1 . . . 0 0... 0
. . .... 0
0 0 . . . 1 0
z1
z2
z3
...
zn
+
1
0
0...
0
xk (4.63b)
One can see that the second state–space representation has the input equal to
the first state–space description’s last state, so it is solvable in case the first state–
equation is solved. The required signs are possible to be yielded using the following
equations, where the value of dimϕu∗is for example k for input u:
ϕu∗=
(
zn−(dimϕu∗−1), . . . , zn
)T(4.64a)
P1ϕu∗=
(
xk−(dimϕu∗−1), . . . , xk
)T(4.64b)
u∗
P1
=zn−k + β1zn−k+1 + · · · + βkzn (4.64c)
The final values of this signals are the interlink of the three (z, x)−u, (z, x)−y and
(z, x)r blocks.
The Simulink environment based realization of the filter is can be seen on Figure
4.18.
Let us now realize the MRAC controller. Based on the two–degree-of–freedom
controller, the polynomial orders of polyinomials S, T and R are known, and the
vector ϑ0 is also known. The adjustable parameter quantities can be seen in Table
4.3. Then, the task is to realize the filter. As it can be seen, all state-space blocks x
have grR = k = 3 pieces of inner states. The signal P1ϕu∗has dimϕu∗
dimensions.
Its quantities are countable from equation (4.54), and can be seen on Table 4.4.
The controller can not be realized using these parameters. The assumption of
the realization is to enhance the states of filter x. This value depends on grP2. As
grP2 is equal to grR, the polynomial order of R should be increased at least with
one order, in the view that grS and grT values need to be less than this increased

CHAPTER 4. MODEL REFERENCE CONTROL 46
3
u/P1
2
fi
1
P1fi
K*uvec
u/P1_m
K*uvec
u/P1_l
K*uvec
u/P1_k−1
In1 Out1
Z(−u)2
In1 Out1
Z(−u)1
In1 Out1
Z(−u)
In1 Out1
X(u_c)
In1 Out1
X(−y)
In1 Out1
X(−u)Selector9
Selector8
Selector7
Selector6
Selector5
Selector4
Selector3
Selector2
Selector11
Selector10
Selector1
Selector
−1
−y
−1
−u
3
y
2
u_c
1
u
P1fi_k−1
P1fi_l
P1fi_m
fi_k−1
fi_l
fi_m
Figure 4.18: Realization of the filter block in Simulink environment
P11 and P22 P12 and P21
R 3 3
S 4 4
T 4 2
Table 4.3: Number of adjustable parameters depends on the reference model
value of grR. The only way to reach this — based on equations (4.25), (4.27) and
(4.28) — is to step up the polynomial order of Am.
The polynomial Am is the denumerator part of the desired transfer function,
Pio. If it is changing, the power system’s parameters are changing, but the aim is
to create a controller that assures the same road feel like the power system. It is
possible to create negligible pole on the transfer functions, that raises the value of
grAm, but makes a minimal change on the frequency domain. Thus, during the
design procedure, the transfer functions Pio are modified with an additive pole:
PioDesign = Pio ·2πf
s + 2πf(4.65)
The value f = 100Hz was chosen, because this frequency is over the driver’s
detection limit, and force ability.
The effect of this change can be shown by plotting the bode-diagram of Pio and

CHAPTER 4. MODEL REFERENCE CONTROL 47
P11 and P22 P12 and P21
r 4 2
u 3 3
y 4 4
Table 4.4: The values of dimϕu∗
PioDesign, see Figure 4.19.
−200
−150
−100
−50
0
50
100
150
200
Mag
nitu
de (
dB)
10−3
10−2
10−1
100
101
102
103
104
−270
−180
−90
0
Pha
se (
deg)
Bode Diagram
Frequency (rad/sec)
(a) P11 and P11Design
−300
−250
−200
−150
−100
−50
0
50
100
Mag
nitu
de (
dB)
10−3
10−2
10−1
100
101
102
103
104
−450
−360
−270
−180
−90
Pha
se (
deg)
Bode Diagram
Frequency (rad/sec)
(b) P12 and P12Design
−300
−250
−200
−150
−100
−50
0
50
100
Mag
nitu
de (
dB)
10−3
10−2
10−1
100
101
102
103
104
−450
−360
−270
−180
−90
Pha
se (
deg)
Bode Diagram
Frequency (rad/sec)
(c) P21 and P21Design
−250
−200
−150
−100
−50
0
50
Mag
nitu
de (
dB)
10−3
10−2
10−1
100
101
102
103
104
−90
0
90
180
Pha
se (
deg)
Bode Diagram
Frequency (rad/sec)
(d) P22 and P22Design
Figure 4.19: Bode-diagrams Pio (blue) and PioDesign(green)
Using this power system, the polynomial orders became the value that can be
seen on Table 4.5. The quantity of adjustable parameters and the value of dimϕu∗
can be seen on Table 4.6. One can see that the controller is realizable now referring
to the polynomial orders.
The model reference adaptive controller described above was interpreted on the
identified transfer functions, Sh and SR, with the reference models Pio. As men-
tioned, the steer–by–wire system’s transfer functions have two controllers, two ref-
erence models. Thus, Sh has the reference models P11 and P21. Similarly, SR has
the reference models P22 and P12. These four model reference controllers were repre-
sented in MATLAB Simulink environment. The result on the nominal steer–by–wire
system can be seen on Figure 4.20. To view the effects of the parameters’ uncer-
tainty a simulation was run with changed steer–by–wire parameters. The parameters
were increased by 25% — (see Figure 4.21) — but the controller had the ability to

CHAPTER 4. MODEL REFERENCE CONTROL 48
P11 and P22 P12 and P21
grAm 5 5
grBm 2 0
grA 2 2
grB 0 0
grR 4 4
grS 3 3
grT 3 1
Table 4.5: Polynomial orders with reference models PioDesign
0 0.5 1 1.5 2 2.5 3 3.5 40
20
40
60
80
100
Time [s]
φ [r
ad]
MRAC with reference model P11
0 0.5 1 1.5 2 2.5 3 3.5 4−0.06
−0.04
−0.02
0
0.02
0.04
0.06
0.08
Time [s]
erro
r in
out
put φ
[rad
]
(a) MRAC with reference P11
0 0.5 1 1.5 2 2.5 3 3.5 40
0.1
0.2
0.3
0.4
0.5
0.6
0.7
Time [s]
x [m
]
MRAC with reference model P12
0 0.5 1 1.5 2 2.5 3 3.5 4−2
0
2
4
6
8x 10
−4
Time [s]
erro
r in
out
put x
[m]
(b) MRAC with reference P12
0 0.5 1 1.5 2 2.5 3 3.5 40
0.1
0.2
0.3
0.4
0.5
0.6
0.7
Time [s]
φ [r
ad]
MRAC with reference model P21
0 0.5 1 1.5 2 2.5 3 3.5 4−2
0
2
4
6
8x 10
−4
Time [s]
erro
r in
out
put φ
[rad
]
(c) MRAC with reference P21
0 0.5 1 1.5 2 2.5 3 3.5 40
1
2
3
4
5
6x 10
−3
Time [s]
x [m
]
MRAC with reference model P22
0 0.5 1 1.5 2 2.5 3 3.5 4−5
−4
−3
−2
−1
0
1x 10
−6
Time [s]
erro
r in
out
put x
[m]
(d) MRAC with reference P22
Figure 4.20:
Implemented MRAC (blue) on the four transfer function (green) with nominal
system
suppress the steady state error.
The model reference adaptive controller has not been managed yet. During
the simulation the controller becomes instable. This effect is possibly caused by an
additive signal that is detectable on the controller output. This signal can be viewed
on the error signals on Figures 4.20 and 4.21, and has a frequency that depends on
the input signal. Our future task is to find the origin of this additive signal.

CHAPTER 4. MODEL REFERENCE CONTROL 49
(a) Values of adjustable parameters
P11 and P22 P12 and P21
R 4 4
S 4 4
T 4 2
(b) Values of dimϕu∗
P11 and P22 P12 and P21
u 4 4
y 4 4
r 4 2
Table 4.6: The value of adjustable variables and dimϕu∗
0 0.5 1 1.5 2 2.5 3 3.5 40
20
40
60
80
100
Time [s]
φ [r
ad]
MRAC with reference model P11
0 0.5 1 1.5 2 2.5 3 3.5 4−0.05
0
0.05
0.1
0.15
0.2
Time [s]
erro
r in
out
put φ
[rad
]
(a) MRAC with reference P11
0 0.5 1 1.5 2 2.5 3 3.5 40
0.1
0.2
0.3
0.4
0.5
0.6
0.7
Time [s]
x [m
]
MRAC with reference model P12
0 0.5 1 1.5 2 2.5 3 3.5 4−2
0
2
4
6
8x 10
−4
Time [s]
erro
r in
out
put x
[m]
(b) MRAC with reference P12
0 0.5 1 1.5 2 2.5 3 3.5 40
0.1
0.2
0.3
0.4
0.5
0.6
0.7
Time [s]
φ [r
ad]
MRAC with reference model P21
0 0.5 1 1.5 2 2.5 3 3.5 4−2
0
2
4
6
8x 10
−4
Time [s]
erro
r in
out
put φ
[rad
]
(c) MRAC with reference P21
0 0.5 1 1.5 2 2.5 3 3.5 40
1
2
3
4
5
6x 10
−3
Time [s]
x [m
]
MRAC with reference model P22
0 0.5 1 1.5 2 2.5 3 3.5 4−3
−2.5
−2
−1.5
−1
−0.5
0x 10
−5
Time [s]
erro
r in
out
put x
[m]
(d) MRAC with reference P22
Figure 4.21:
Implemented MRAC (blue) on the four transfer function (green) with
steer–by–wire system parameters increased by 25%

Chapter 5
Conclusion
This Diploma investigated methods for ensuring the road feel with a force feedback
controller. The constructed model of the steer–by–wire system based on ARMAX
identification method. To ensure the road feel the properties of a conventional
steering system was copied by the controller. The structure of this controller is the
main concept of this thesis.
The first step in design procedure was implemented with a concept of [3]. This
method established the equality of positions and forces on linear systems. The
performance of this equality is reduced by the parameter uncertainties, thus a two–
degree–of–freedom controller — that proved to be robust in other applications —
performed on the system.
The controller was implemented in model reference control architecture, that
proposed the road feel equivalence. In order to improve the performance, the con-
troller parameters were tuned adaptively (Model Reference Adaptive Controller —
MRAC). This provides a good stability for uncertainties, and has the ability to
copy the attributes of a conventional steering system. A further task is to fit this
controller to the steer–by–wire system, but we expect a good stability and model
following from this control strategy.
There are several other questions that should be solved in the future. The
implementation of these controllers into a car might require a better identification
with targeted measurements. In fact the controllers based on the two–degree–of–
freedom controller need a load estimator, to be planned for real application.
We offered three controller on steer–by–wire system. All of them are able to copy
the properties of a conventional steering system. Their effectiveness depends on the
information we know about the steering system, and on the system’s uncertainties.
50

Chapter 6
Appendix
6.1 Notations of variables and parameters
Notation Description Unit
Θ Equivalent inertia reduced on steering wheel subsystem kg · m2
ϕ Angle of steering wheel rad
Th Driver torque Nm
τacth Torque of the steering wheel actuator Nm
Tv Torque of viscous friction on steering wheel subsystem Nm
Tc Torque of Coulomb–friction on steering wheel subsystem Nm
Tb Torque of spring on steering wheel subsystem Nm
M Equivalent mass on road wheel subsystem kg
x Position of the rack m
Fr Rack force N
FactRckForce of the road wheel actuator N
Fv Force of viscous friction on road wheel subsystem N
Fc Force of Coulomb–friction on road wheel subsystem N
Fb Force of spring on road wheel subsystem N
is Transmission of ball–screw drive m/rad
Table 6.1: Notations I.
A

CHAPTER 6. APPENDIX B
Notation Description Unit
ΘRck Equivalent inertia reduced on road wheel subsystem kg · m2
ϕRck Angle of road wheel actuator rad
ThRckRack torque Nm
τRck Torque of the road wheel actuator Nm
TvRck Torque of viscous friction on road wheel subsystem Nm
TcRck Torque of Coulomb–friction on road wheel subsystem Nm
TbRck Torque of spring on road wheel subsystem Nm
KStw Viscous friction coefficient on steering wheel subsystem N · s/rad
KcStw Coulomb–friction coefficient on steering wheel subsystem Nm
BStw Spring coefficient on steering wheel subsystem Nm
KRck Viscous friction coefficient on road wheel (round) N · s/rad
KcRck Coulomb–friction coefficient on road wheel (round) Nm
BRck Spring coefficient on road wheel (round) Nm
KxRck Viscous friction coefficient on road wheel (direct) N · s/m
KxcRck Coulomb–friction coefficient on road wheel (direct) N
BxRck Spring coefficient on road wheel (direct) N
TInStw Equivalent torque of external forces on steering wheel Nm
TInRck Equivalent torque of external forces on road wheel Nm
iP Transmission constant between rack and steering column m/rad
ϕPS Steering wheel angle on the power system rad
xrPS Position of the rack on the power system m
Table 6.2: Notations II.

Bibliography
[1] Lantos, Bela Iranyıtasi rendszerek elmelete es tervezese I.
Akademiai Kiado, Budapest (2001)
[2] Lantos, Bela Iranyıtasi rendszerek elmelete es tervezese II.
Akademiai Kiado, Budapest (2003)
[3] Dirk Odenthal, Tilman Bunte, Heinz-Dieter Heitzer, Christoph
Eicker How to make Steer-by-Wire feel like steering
15th Triennial World Congress, Barcelona, Spain (2002)
[4] MATLAB Reference Manual The MathWorks, Inc., (2001)
[5] Ljung, Lennart System Identification — Theory for the User, Second Edition
1999 by Prentice Hall PTR
[6] Ljung, Lennart System Identification Toolbox — For Use with MATLAB
1997 by The MathWorks, Inc.
C
Recommended