Social Characteristics for
Mineral County, Nevada
FS-21-67 Buddy Borden, Community Development Extension Specialist Lucas Thomas, Publications Writer
Joseph Lednicky, Economist II Staci Emm, Mineral County Extension Educator
Sources: U.S. Census Bureau, American Community
Survey; Nevada Report Card
EDUCATIONAL ATTAINMENT
2010 - Population 25 and Over: 3,793
Level of Education
% of Population
No High School
Diploma
13.7%
High School
Diploma
47.8%
Some College
23.7%
Associate Degree
6.6%
Bachelor’s Degree
6.5%
Graduate or Professional
Degree
1.7%
2017 - Population 25 and Over: 3,290
Level of Education
% of Population
No High School
Diploma
13.7%
High School
Diploma
34.3%
Some College
27.7%
Associate Degree
9.9%
Bachelor’s Degree
9.2%
Graduate or Professional
Degree
4.8%
Veteran Educational Attainment: Between 2010 and 2017, there has been an increase in Mineral County
veteran Bachelor’s degree holders, in spite of the decrease in veteran population within the county.
Highest Education Received
Professional Degree
+182.4%
High School
-28.2%
Bachelor’s Degree
+41.5%POVERTY
Mineral County % of Population Below Poverty Level Year
Percentage
2013
20.5%
2014
20.4%
2015
20.2%
2016
21.2%
2017
20.3%
Population in poverty decreased overall.
The Census Bureau uses a set of monetary income thresholds that vary by family size and composition
to determine who is in poverty. If the total income for a family or unrelated individual falls below the
relevant poverty threshold, then the members of the household are considered to be in poverty.
A full baseline data report, an economic impact report and additional infographics are available for this county. Full reports and infographics will be available for each county in Nevada. For more information, email us at [email protected], or call Buddy Borden at 702-257-5505 or Joe Lednicky at 702-948-5971. The Mineral County Extension office is administered by Staci Emm, Extension Educator, who can be reached
at 775-945-3444. Visit us online at https://extension.unr.edu/neap.
Copyright © 2021, University of Nevada, Reno Extension
Census Bureau Definition of
Poverty:
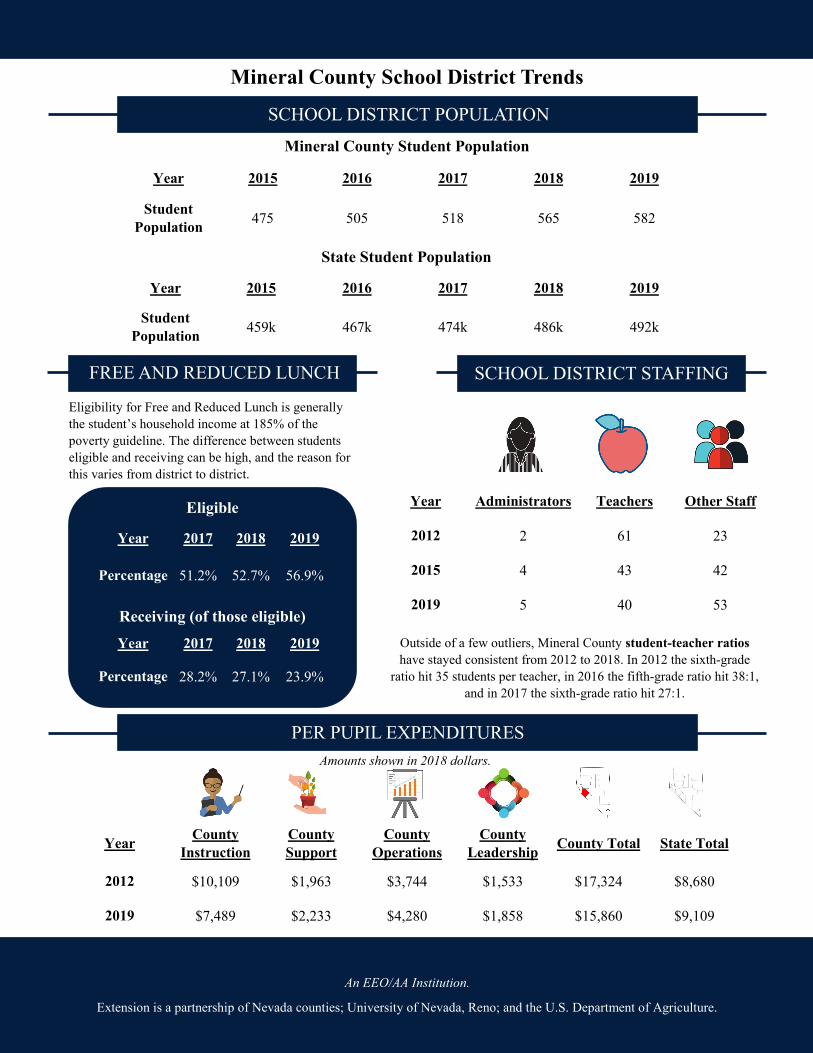
Mineral County School District Trends
SCHOOL DISTRICT POPULATION
Mineral County Student Population
Year
Student Population
2015
475
2016
505
2017
518
2018
565
2019
582
State Student Population
Year
Student Population
2015
459k
2016
467k
2017
474k
2018
486k
2019
492k
FREE AND REDUCED LUNCH
Eligibility for Free and Reduced Lunch is generally the student’s household income at 185% of the poverty guideline. The difference between students eligible and receiving can be high, and the reason for this varies from district to district.
Eligible
Year
Percentage
2017
51.2%
2018
52.7%
2019
56.9%
Receiving (of those eligible)
Year
Percentage
2017
28.2%
2018
27.1%
2019
23.9%
SCHOOL DISTRICT STAFFING
Year Administrators Teachers Other Staff
2012 2 61 23
2015 4 43 42
2019 5 40 53
Outside of a few outliers, Mineral County student-teacher ratios have stayed consistent from 2012 to 2018. In 2012 the sixth-grade
ratio hit 35 students per teacher, in 2016 the fifth-grade ratio hit 38:1, and in 2017 the sixth-grade ratio hit 27:1.
PER PUPIL EXPENDITURES Amounts shown in 2018 dollars.
Year
2012
2019
County Instruction
$10,109
$7,489
County Support
$1,963
$2,233
County Operations
$3,744
$4,280
County Leadership
$1,533
$1,858
County Total
$17,324
$15,860
State Total
$8,680
$9,109
An EEO/AA Institution.
Extension is a partnership of Nevada counties; University of Nevada, Reno; and the U.S. Department of Agriculture.
Recommended