Merian Site TourMarch 2, 2017

Newmont Mining Corporation I Merian Site Tour I Slide 2March 2, 2017
Welcome and introductions
Name Position Program
Tom Palmer EVP and Chief Operating Officer Introduction
Adriaan Van Kersen Managing Director, Merian Project Merian Project Delivery
Tony Esplin General Manager, Merian Complex Merian Overview
Albert Ramdin Senior Director, External Relations Sustainability & External Relations
Trent Tempel Senior Vice President, South America
David Portugal Regional CFO, South America
Krishna Singh Engineering Superintendent Mine Tour
Kirk Schmidt Exploration Manager Mine Tour – Exploration
Tom Ohrling Processing Manager Process Tour

Newmont Mining Corporation I Merian Site Tour I Slide 3March 2, 2017
Cautionary statement
Cautionary statement regarding forward looking statements:This presentation contains “forward-looking statements” within the meaning of Section 27A of the Securities Act of 1933, as amended, andSection 21E of the Securities Exchange Act of 1934, as amended, and are intended to be covered by the safe harbor provided for undersuch sections. Such forward-looking statements may include, without limitation: (i) estimates of future production and production profiles;(ii) estimates of future costs applicable to sales and All-in sustaining costs; (iii) estimates of future capital expenditures; (iv) estimates offuture full potential improvements, including reduced costs, increased efficiency and other optimizations and improvements; (v)expectations regarding future exploration, expansion, mine development, timing of phases and mine life; (vi) future grade, mill andprocessing estimates and expectations; and (vii) expectations regarding future returns, value creation, financial performance and otheroutlook or guidance. Estimates or expectations of future events or results are based upon certain assumptions, which may prove to beincorrect. Such assumptions, include, but are not limited to: (i) there being no significant change to current geotechnical, metallurgical,hydrological and other physical conditions; (ii) permitting, development, operations and expansion of the Company’s operations andprojects being consistent with current expectations and mine plans, including without limitation receipt of export approvals; (iii) politicaldevelopments being consistent with its current expectations; (iv) certain price assumptions for gold, copper and oil; (v) prices for keysupplies being approximately consistent with current levels; (vi) the accuracy of our current models and study work; (vii) exchange ratesbeing approximately consistent with current levels, and (viii) other assumptions. Where the Company expresses an expectation or belief asto future events or results, such expectation or belief is expressed in good faith and believed to have a reasonable basis. However, suchstatements are subject to risks, uncertainties and other factors, which could cause actual results to differ materially from future resultsexpressed, projected or implied by the “forward-looking statements”. Such risks include, but are not limited to, gold and other metals pricevolatility, currency fluctuations, increased production costs and variances in ore grade or recovery rates from those assumed in miningplans, political and operational risks, community relations, conflict resolution and outcome of projects or oppositions and governmentalregulation and judicial outcomes. For a more detailed discussion of such risks and other factors, see the Company’s 2016 Annual Reporton Form 10-K, filed on or about February 21, 2017, with the Securities and Exchange Commission (the “SEC”), as well as the Company’sother SEC filings. The Company does not undertake any obligation to release publicly revisions to any “forward-looking statement,”including, without limitation, outlook, to reflect events or circumstances after the date of this presentation, or to reflect the occurrence ofunanticipated events, except as may be required under applicable securities laws. Investors should not assume that any lack of update to apreviously issued “forward-looking statement” constitutes a reaffirmation of that statement. Continued reliance on “forward-lookingstatements” is at investors' own risk.

Newmont Mining Corporation I Merian Site Tour I Slide 4March 2, 2017
Safety share
As our guest, we ask that you please
Stay alert and aware of your surroundings – remain with Newmont personnel at all times
Stay hydrated
Protect against bug bites – cover exposed skin by wearing long-sleeved shirts and long pants
Eat and drink safely
Keep away from animals
Stay alert to changing weather conditions

Newmont Mining Corporation I Merian Site Tour I Slide 5March 2, 2017
Merian delivers strategy to create long-term value
Improve the underlying business
Industry leader in safety and sustainability performance
Continued cost improvements – AISC1 of $650 – 750/oz
Steady gold production – Attributable production of 300 – 375Koz/year
Strengthen the portfolio
Establishing foothold in prospective new district – Guiana Shield
Added 600Koz of Reserves2 – by the drill bit
Advancing studies on brownfield opportunities – at Sabajo
Create value for
shareholders
Project delivered safely, on schedule and $150M below budget
Robust margins – 2017E3 outlook is 350 – 390Koz @ $560 – 610 AISC/oz
Generating solid returns for investors – IRR of >25%(1) (2) (3) See endnote on slide 13. (2) Reserves (proven and probable) of 450Koz attributable to Newmont AISC/oz and Koz/year represent first 5-year averages
Newmont Mining Corporation I Merian Site Tour I Slide 6March 2, 2017
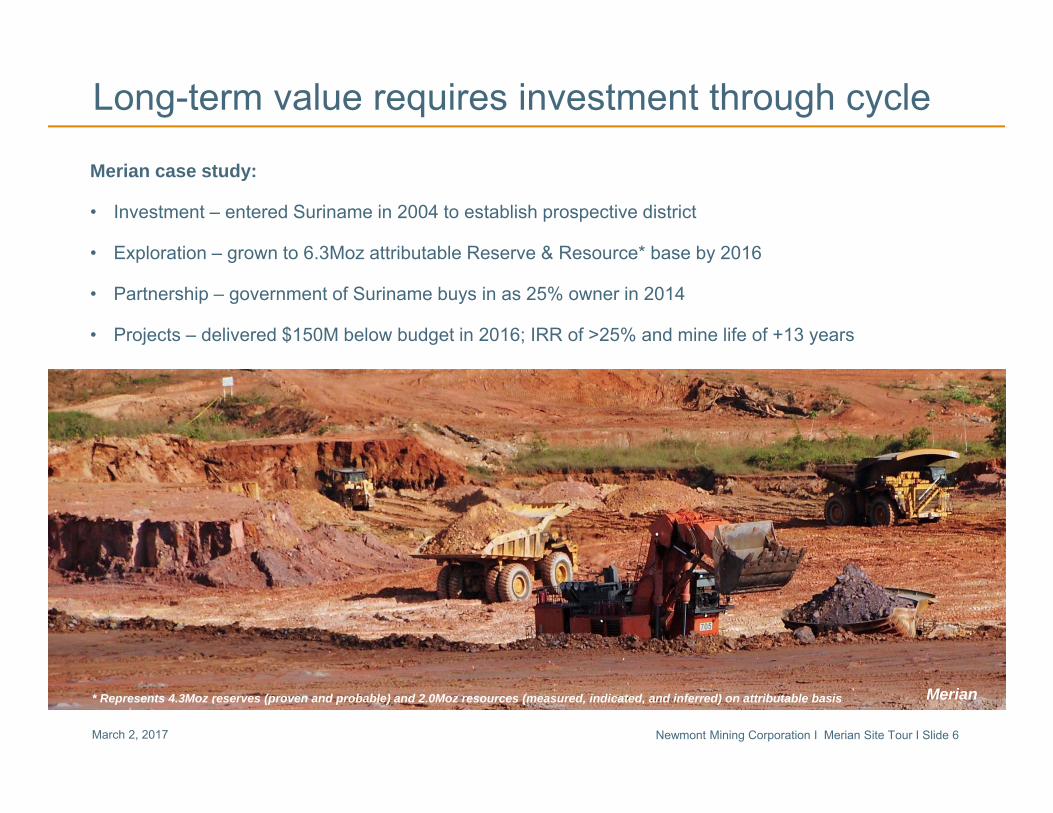
Long-term value requires investment through cycle
Merian case study:
• Investment – entered Suriname in 2004 to establish prospective district
• Exploration – grown to 6.3Moz attributable Reserve & Resource* base by 2016
• Partnership – government of Suriname buys in as 25% owner in 2014
• Projects – delivered $150M below budget in 2016; IRR of >25% and mine life of +13 years
Merian* Represents 4.3Moz reserves (proven and probable) and 2.0Moz resources (measured, indicated, and inferred) on attributable basis
Newmont Mining Corporation I Merian Site Tour I Slide 7March 2, 2017
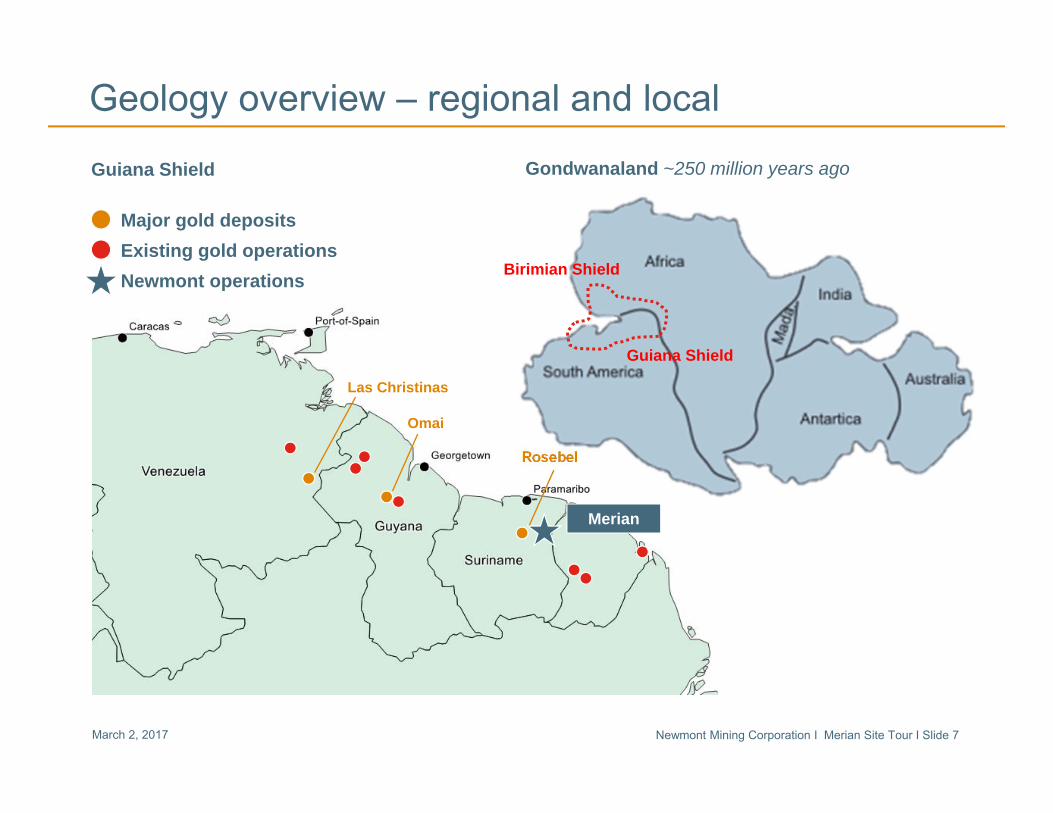
Geology overview – regional and local
Las Christinas
Omai
Rosebel
Merian
Guiana Shield Gondwanaland ~250 million years ago
Major gold depositsExisting gold operationsNewmont operations Birimian Shield
Guiana Shield

Newmont Mining Corporation I Merian Site Tour I Slide 8March 2, 2017
Creating a culture of zero harm
• Eight reportable injuries in 2016, none serious; one reportable injury for 2017 YTD
• Strong focus on Fatality Risk Management
• Safety Leadership training and coaching commencing in 2017
• Comprehensive incident and near miss reporting
• Cyanide and chemical awareness training for all employees with plant access; ICMC Certification
TRIFR 2016 Target 0.40
2016 Actual 0.33
Zero harm ~2,400,000 hours
Visible felt leadership
Safety focused interactions with employees in the field
0.33
0.000.100.200.300.400.500.600.700.80
Jan-16
Feb-16
Mar-16
Apr-16
May-16
Jun-16
Jul-16
Aug-16
Sep-16
Oct-16
Nov-16
Dec-16
Merian Total Recordable Injury Frequency Rate (TRIFR)
Newmont Mining Corporation I Merian Site Tour I Slide 9March 2, 2017
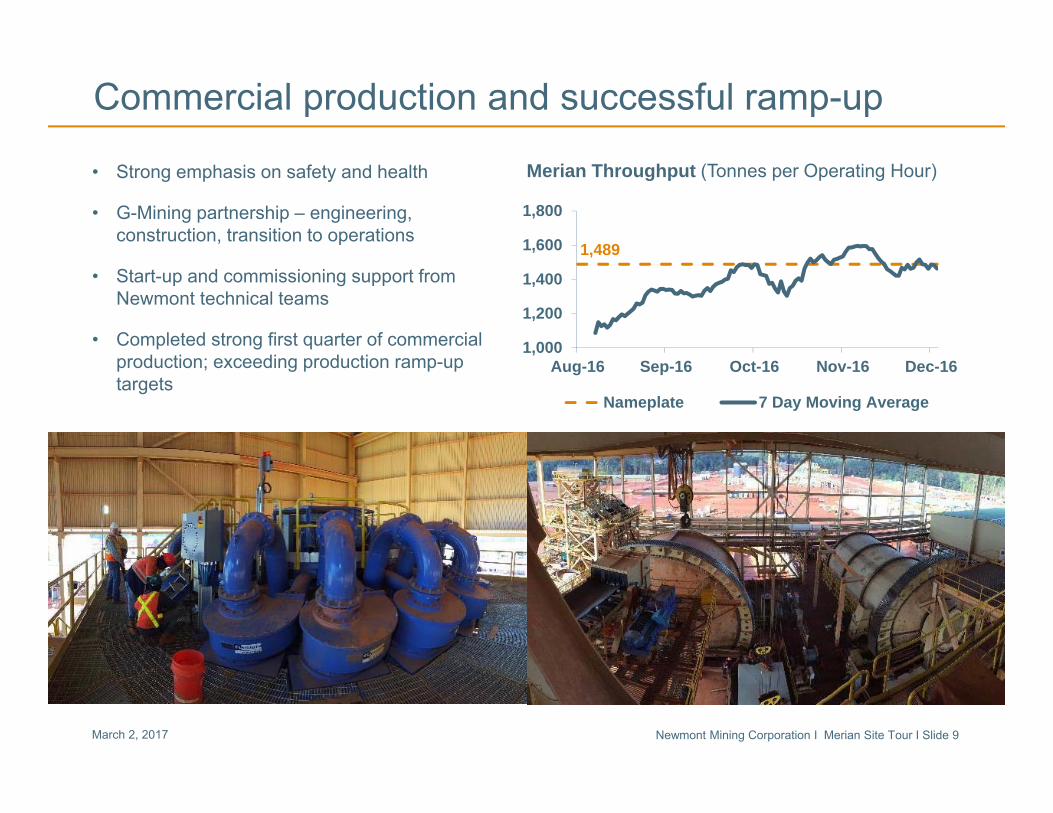
Commercial production and successful ramp-up
• Strong emphasis on safety and health
• G-Mining partnership – engineering, construction, transition to operations
• Start-up and commissioning support from Newmont technical teams
• Completed strong first quarter of commercial production; exceeding production ramp-up targets
1,489
1,000
1,200
1,400
1,600
1,800
Aug-16 Sep-16 Oct-16 Nov-16 Dec-16
Nameplate 7 Day Moving Average
Merian Throughput (Tonnes per Operating Hour)
Newmont Mining Corporation I Merian Site Tour I Slide 10March 2, 2017
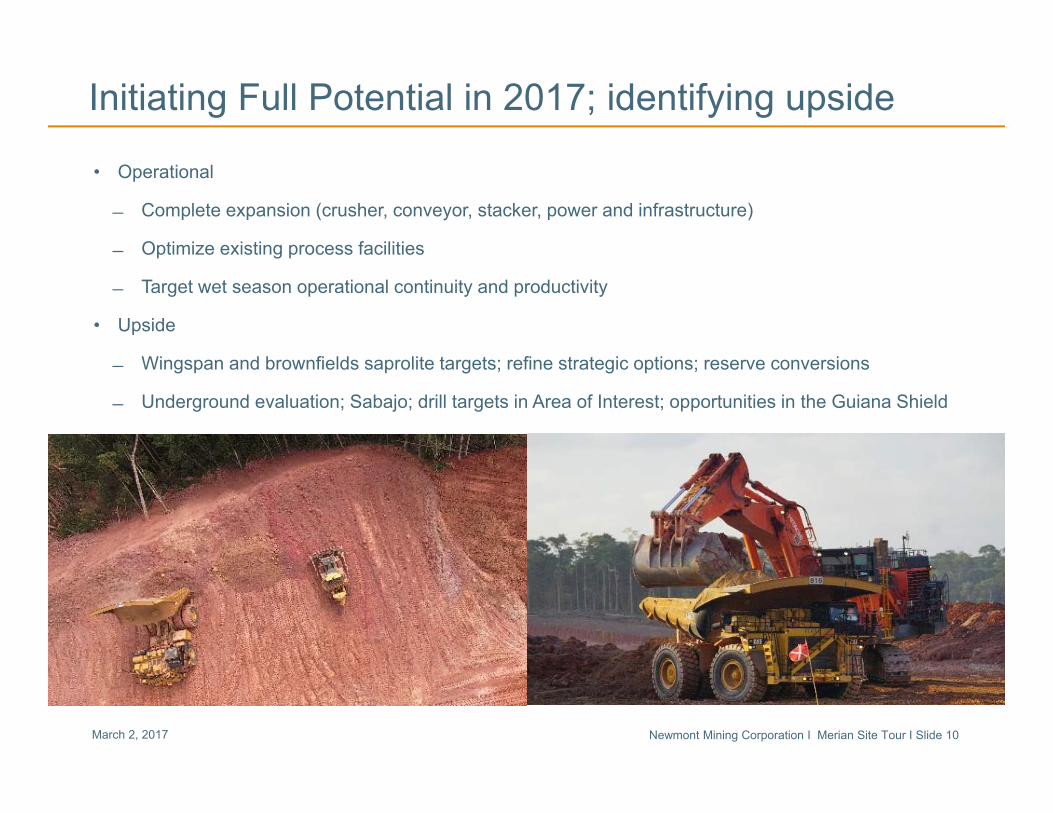
Initiating Full Potential in 2017; identifying upside
• Operational
Complete expansion (crusher, conveyor, stacker, power and infrastructure)
Optimize existing process facilities
Target wet season operational continuity and productivity
• Upside
Wingspan and brownfields saprolite targets; refine strategic options; reserve conversions
Underground evaluation; Sabajo; drill targets in Area of Interest; opportunities in the Guiana Shield
Newmont Mining Corporation I Merian Site Tour I Slide 11March 2, 2017
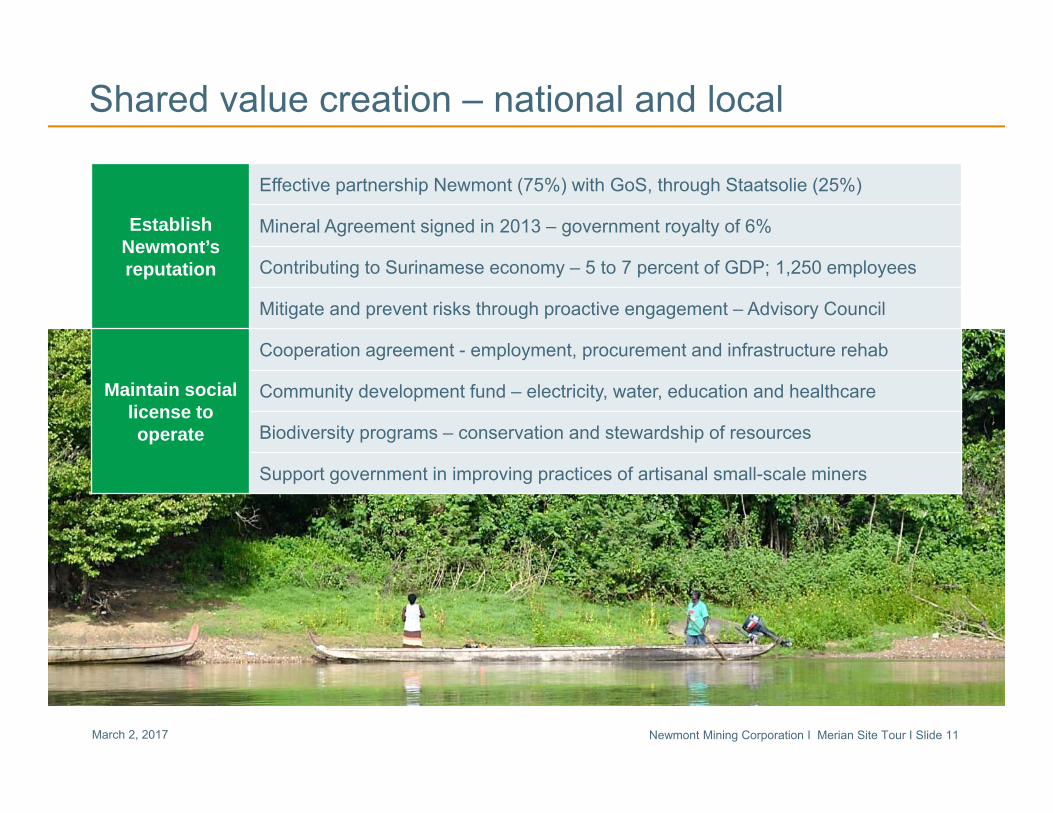
Shared value creation – national and local
Establish Newmont’s reputation
Effective partnership Newmont (75%) with GoS, through Staatsolie (25%)
Mineral Agreement signed in 2013 – government royalty of 6%
Contributing to Surinamese economy – 5 to 7 percent of GDP; 1,250 employees
Mitigate and prevent risks through proactive engagement – Advisory Council
Maintain sociallicense to operate
Cooperation agreement - employment, procurement and infrastructure rehab
Community development fund – electricity, water, education and healthcare
Biodiversity programs – conservation and stewardship of resources
Support government in improving practices of artisanal small-scale miners

Newmont Mining Corporation I Merian Site Tour I Slide 12March 2, 2017
Questions?
Ore stockpiles at Merian

Newmont Mining Corporation I Merian Site Tour I Slide 13March 2, 2017
EndnotesInvestors are encouraged to read the information contained in this presentation in conjunction with the following notes, the Cautionary Statement on slide 3 and the factors described under the “Risk Factors” section of the Company’s Form 10-K, filed with the SEC on February 21, 2017 and disclosure in the Company’s other recent SEC filings.
1. All-in sustaining cost is a non-GAAP metric. All-in sustaining cost (“AISC”) as used in the Company’s Outlook is a non-GAAP metric defined as the sum of cost applicable to sales (including all direct and indirect costs related to current gold production incurred to execute on the current mine plan), remediation costs (including operating accretion and amortization of asset retirement costs), G&A, exploration expense, advanced projects and R&D, treatment and refining costs, other expense, net of one-time adjustments and sustaining capital. A reconciliation has not been provided in reliance on Item 10(e)(1)(i)(B) of Regulation S-K because such reconciliation is not available without unreasonable efforts. For a reconciliation of the Company’s historical AISC or 2017 Consolidated Gold AISC Outlook, see page 22 of Newmont’s earnings release for the fourth quarter and full year 2016 available on the Company’s website www.newmont.com in the newsroom section.
2. U.S. investors are reminded that reserves were prepared in compliance with Industry Guide 7 published by the SEC. Whereas, the termresource, measured resource, indicated resources and inferred resources are not SEC recognized terms, Newmont has determined that such resources would be substantively the same as those prepared using the Guidelines established by the Society of Mining, Metallurgy and Exploration and defined as Mineral Resource. Estimates of resources are subject to further exploration and development, are subject to additional risks, and no assurance can be given that they will eventually convert to future reserves. Inferred resources, in particular, have a great amount of uncertainty as to their existence and their economic and legal feasibility. Investors are cautioned not to assume that any part or all of the inferred resource exists, or is economically or legally mineable. Inventory and upside potential have a greater amount of uncertainty. Investors are cautioned that drill results illustrated in certain graphics in this presentation are not necessarily indicative of future results or future production. Even if significant mineralization is discovered and converted to reserves, during the time necessary to ultimately move such mineralization to production the economic and legal feasibility of production may change. As such, investors are cautioned against relying upon those estimates. For more information regarding the Company’s reserves, see the Company’s Annual Report filed with the SEC on February 21, 2017 for the Proven and Probable reserve tables prepared in compliance with the SEC’s Industry Guide 7, which is available at www.sec.gov or on the Company’s website. Investors are further reminded that the reserve and resource estimates used in this presentation are estimates as of December 31, 2016.
3. Outlook projections used in this presentation are considered forward-looking statements and represent management’s good faith estimates or expectations of future production results as of February 21, 2017. Outlook is based upon certain assumptions, including, but not limited to, metal prices, oil prices, certain exchange rates and other assumptions. For example, 2017 Outlook assumes $1,200/oz Au, $2.25/lb Cu, $0.75 USD/AUD exchange rate and $55/barrel WTI; AISC and CAS estimates do not include inflation, for the remainder of the year. Assumptions used for purposes of Outlook may prove to be incorrect and actual results may differ materially from those anticipated. Consequently, Outlook cannot be guaranteed. See cautionary statement on slide 3.
Tour participants are reminded that the cautionary note on slide 3 and the endnotes listed above on this slide should also be considered in connection with the poster board presentation at the tour stops, which follows.
Story board – Mining

Newmont Mining Corporation I Merian Site Tour I Slide 15March 2, 2017
Mine physicals and fleet
25 CAT 785D Haul Trucks Key Mining Information
Pit production ~50Mt per year
Mine life 13+ years
LOM Grade Average 1.2 g/t*
LOM Strip Ratio 3.1
2 primary pits Merian 2, Maraba
6 Hitachi EX3600 Shovels
4 Atlas DML DTH Drills
4-5 CAT 16M Graders
6-7 CAT D10T Tractors
18-20 Ancillary Equipment* Includes reserves (proven & probable) and resources (measured & indicated)

Newmont Mining Corporation I Merian Site Tour I Slide 16March 2, 2017
Maraba
Merian 2
Kupari
MarabaSouth
Merian mine - pit designs
• Merian 2, Phase 1 pit mostly saprolite• Final pit depth ~260m• Dual ramp reduces risk; shortens waste haul• Resource conversion on east wall• Material types
‒ Waste = <0.4 g/t‒ Low grade = 0.4 – 0.7g/t‒ High grade = >0.7 g/t
• Merian 2: bench height 5m / ~55°face angle• Maraba: bench height 10m
Merian 2
Maraba
Kupari / Maraba South
- 10,000 20,000 30,000 40,000 50,000 60,000
2016 2017 2018 2019 2020 2021 2022 2023 2024 2025 2026 2027 2028 2029
Merian Tonnes Mined by Pit (Kt)

Story board – Exploration
Newmont Mining Corporation I Merian Site Tour I Slide 18March 2, 2017
Merian Project Reserve & Resource Growth Profile
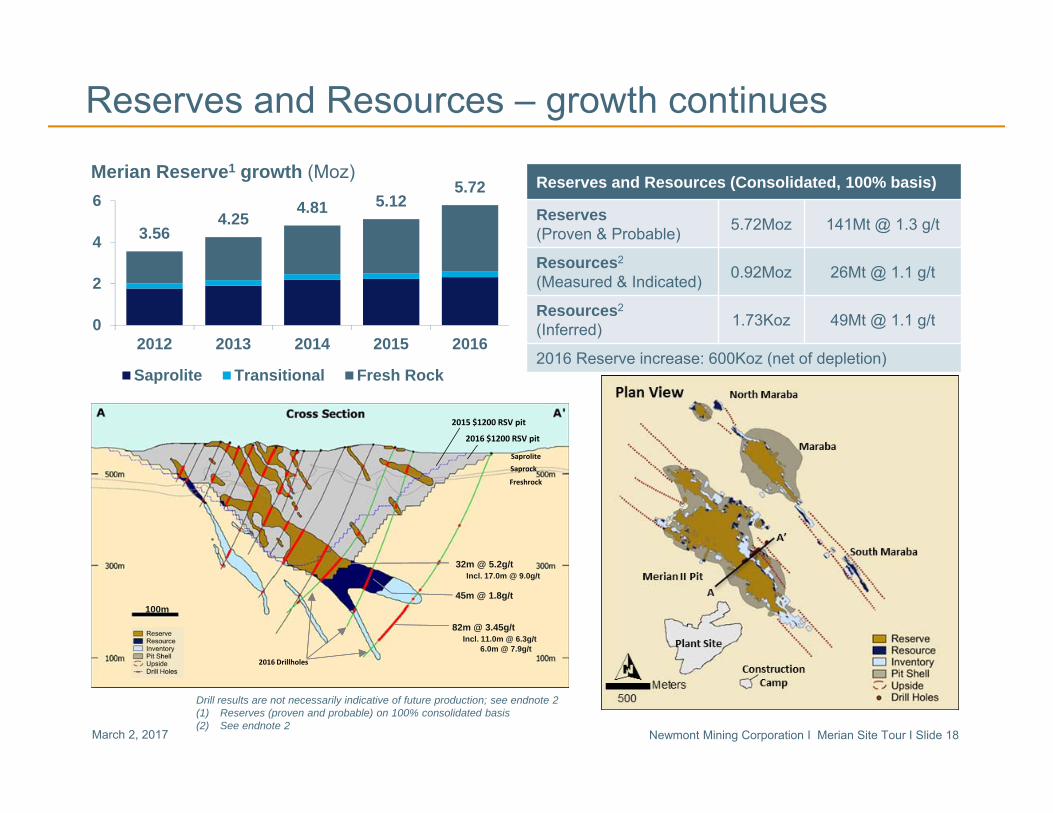
Reserves and Resources (Consolidated, 100% basis)
Reserves (Proven & Probable) 5.72Moz 141Mt @ 1.3 g/t
Resources2
(Measured & Indicated) 0.92Moz 26Mt @ 1.1 g/t
Resources2
(Inferred) 1.73Koz 49Mt @ 1.1 g/t
2016 Reserve increase: 600Koz (net of depletion)
32m @ 5.2g/tIncl. 17.0m @ 9.0g/t
45m @ 1.8g/t
82m @ 3.45g/tIncl. 11.0m @ 6.3g/t
6.0m @ 7.9g/t
100m
SaproliteSaprock
Freshrock
2015 $1200 RSV pit
2016 $1200 RSV pit
2016 Drillholes
Reserves and Resources – growth continues
3.564.25
4.81 5.125.72
0
2
4
6
2012 2013 2014 2015 2016
Saprolite Transitional Fresh Rock
Merian Reserve1 growth (Moz)
Drill results are not necessarily indicative of future production; see endnote 2(1) Reserves (proven and probable) on 100% consolidated basis (2) See endnote 2

Newmont Mining Corporation I Merian Site Tour I Slide 19March 2, 2017
Merian district exploration – focus and highlights
• Extend saprolite mining beyond 2022
• Extend Merian mine life beyond 2030
• Advance Sabajo Project
• Continued exploration of prospective “greenstone” belts

Story board - Processing

Newmont Mining Corporation I Merian Site Tour I Slide 21March 2, 2017
Merian Process Plant
Newmont Mining Corporation I Merian Site Tour I Slide 22March 2, 2017
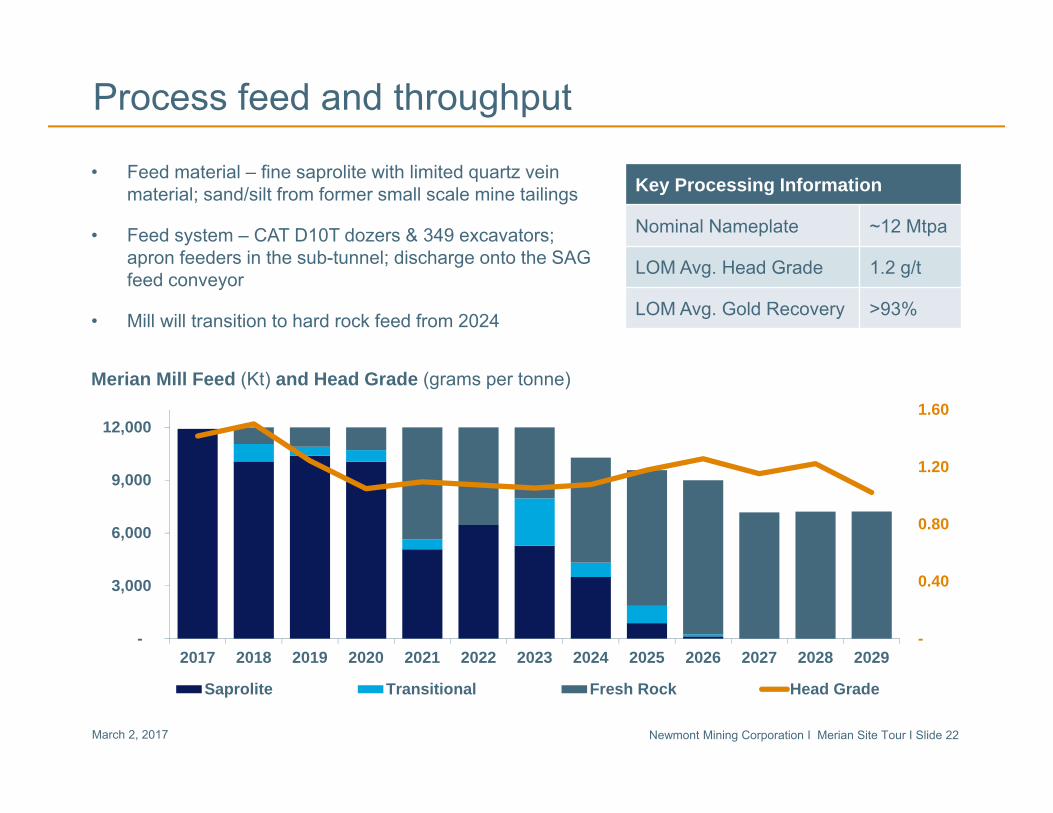
Process feed and throughput
Key Processing Information
Nominal Nameplate ~12 Mtpa
LOM Avg. Head Grade 1.2 g/t
LOM Avg. Gold Recovery >93%
• Feed material – fine saprolite with limited quartz vein material; sand/silt from former small scale mine tailings
• Feed system – CAT D10T dozers & 349 excavators; apron feeders in the sub-tunnel; discharge onto the SAG feed conveyor
• Mill will transition to hard rock feed from 2024
-
0.40
0.80
1.20
1.60
-
3,000
6,000
9,000
12,000
2017 2018 2019 2020 2021 2022 2023 2024 2025 2026 2027 2028 2029
Saprolite Transitional Fresh Rock Head Grade
Merian Mill Feed (Kt) and Head Grade (grams per tonne)
Newmont Mining Corporation I Merian Site Tour I Slide 23March 2, 2017
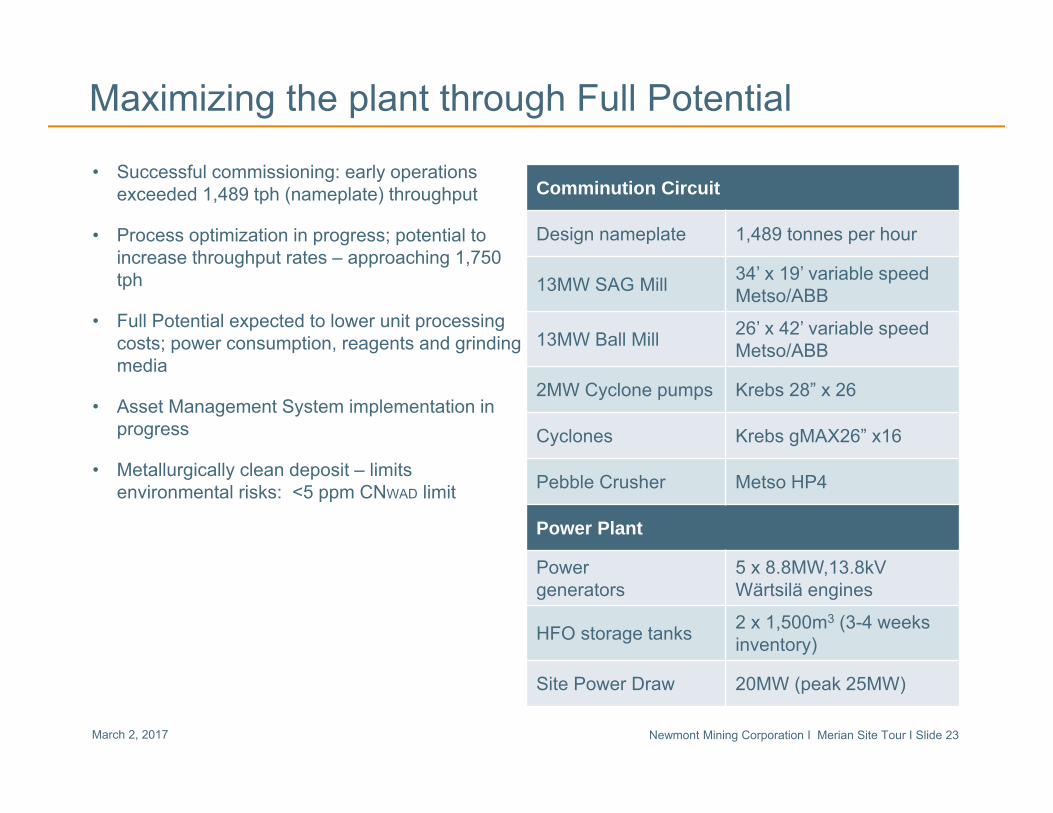
Maximizing the plant through Full Potential
• Successful commissioning: early operations exceeded 1,489 tph (nameplate) throughput
• Process optimization in progress; potential to increase throughput rates – approaching 1,750 tph
• Full Potential expected to lower unit processing costs; power consumption, reagents and grinding media
• Asset Management System implementation in progress
• Metallurgically clean deposit – limits environmental risks: <5 ppm CNWAD limit
Comminution Circuit
Design nameplate 1,489 tonnes per hour
13MW SAG Mill 34’ x 19’ variable speed Metso/ABB
13MW Ball Mill 26’ x 42’ variable speed Metso/ABB
2MW Cyclone pumps Krebs 28” x 26
Cyclones Krebs gMAX26” x16
Pebble Crusher Metso HP4
Power Plant
Powergenerators
5 x 8.8MW,13.8kVWärtsilä engines
HFO storage tanks 2 x 1,500m3 (3-4 weeks inventory)
Site Power Draw 20MW (peak 25MW)
Recommended