Mechanism of transformation in Mycobacteria using a novel shockwave
assisted technique driven by in-situ generated oxyhydrogen
Akshay Datey1,2,3,#, Janardhanraj Subburaj1,#, Jagadeesh Gopalan1,3* and
Dipshikha Chakravortty2,3*,
1Department of Aerospace Engineering, Indian Institute of Science, Bangalore,
India.
2Department of Microbiology and Cell Biology, Indian Institute of Science,
Bangalore, India.
3Centre for Biosystems Science and Engineering, Indian Institute of Science,
Bangalore, India.
SUPPLEMENTARY FIGURES & INFORMATION
Figure-S1. Working principle of the oxyhydrogen detonation-driven miniature shock
tube.
(a)
(a) A pictorial representation of the different stages of working of an oxyhydrogen
combustion driven shock tube. (b) The typical pressure signal of a shock wave generated as
measured by a pressure sensor located at the end of the driven section. The shaded region
represents the impulse generated by the shock wave.
Figure-S2: Effect of steady time and amplitude of the shock wave on the pressure
experienced by the bacterial strain (Escherichia coli) in the cavity.
(a) (b)
(c)
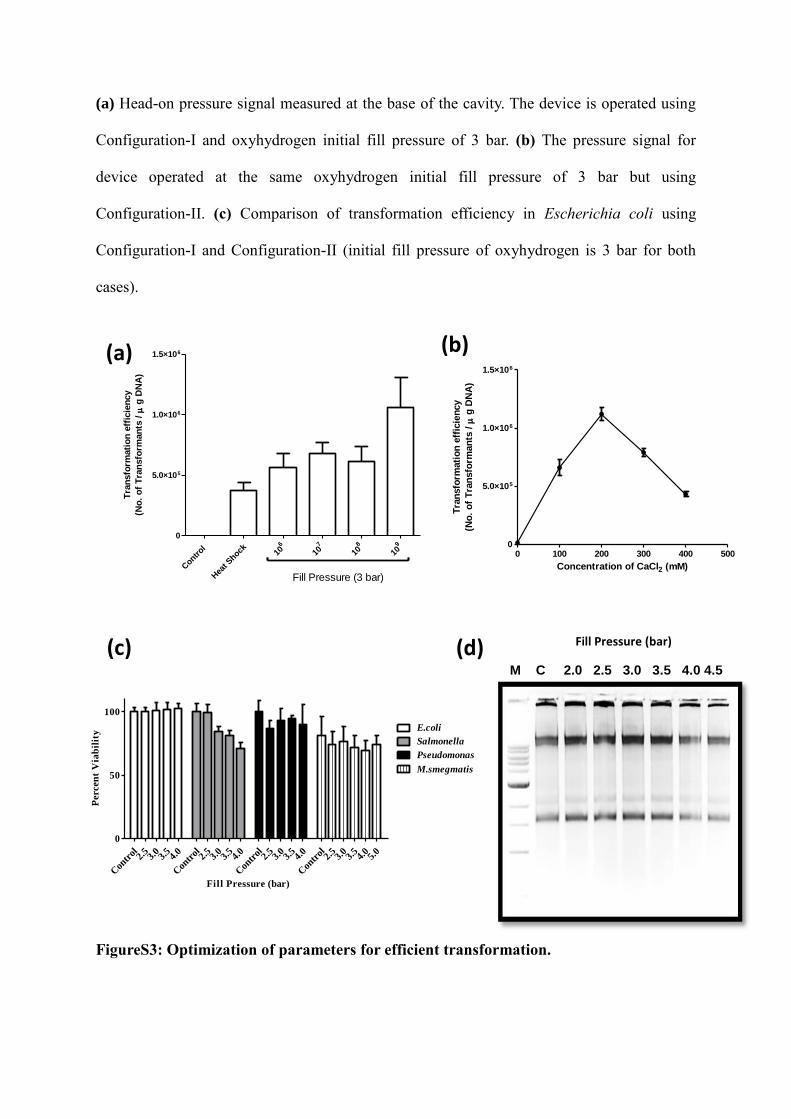
(a) Head-on pressure signal measured at the base of the cavity. The device is operated using
Configuration-I and oxyhydrogen initial fill pressure of 3 bar. (b) The pressure signal for
device operated at the same oxyhydrogen initial fill pressure of 3 bar but using
Configuration-II. (c) Comparison of transformation efficiency in Escherichia coli using
Configuration-I and Configuration-II (initial fill pressure of oxyhydrogen is 3 bar for both
cases).
FigureS3: Optimization of parameters for efficient transformation.
0 100 200 300 400 5000
5.0×10⁵
1.0×10⁶
1.5×10⁶
Concentration of CaCl2 (mM)
Tra
nsfo
rmati
on
eff
icie
ncy
(No
. o
f T
ran
sfo
rman
ts /
g D
NA
)
Contr
ol
Hea
t Shock
6
107
108
109
10
0
5.0×10⁵
1.0×10⁶
1.5×10⁶
Fill Pressure (3 bar)
Tra
nsfo
rmati
on
eff
icie
ncy
(No
. o
f T
ran
sfo
rman
ts /
g D
NA
)
(a) (b)
M C 2.0 2.5 3.0 3.5 4.0 4.5
Fill Pressure (bar) (d)
Con
trol 2.
53.
03.
54.
0
Con
trol 2.
53.
03.
54.
0
Con
trol 2.
53.
03.
54.
0
Con
trol 2.
53.
03.
54.
05.
0
0
50
100
E.coli
Salmonella
Pseudomonas
M.smegmatis
Fill Pressure (bar)
Percen
t V
iab
ilit
y
(c)
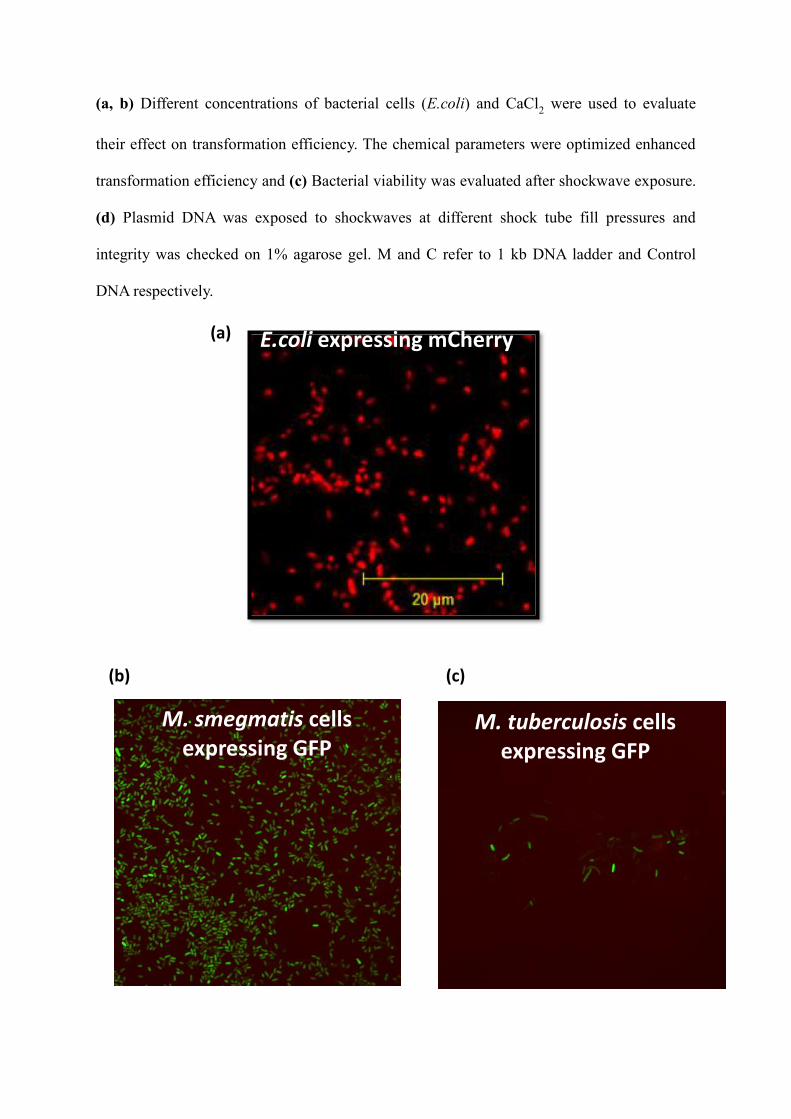
(a, b) Different concentrations of bacterial cells (E.coli) and CaCl2 were used to evaluate
their effect on transformation efficiency. The chemical parameters were optimized enhanced
transformation efficiency and (c) Bacterial viability was evaluated after shockwave exposure.
(d) Plasmid DNA was exposed to shockwaves at different shock tube fill pressures and
integrity was checked on 1% agarose gel. M and C refer to 1 kb DNA ladder and Control
DNA respectively.
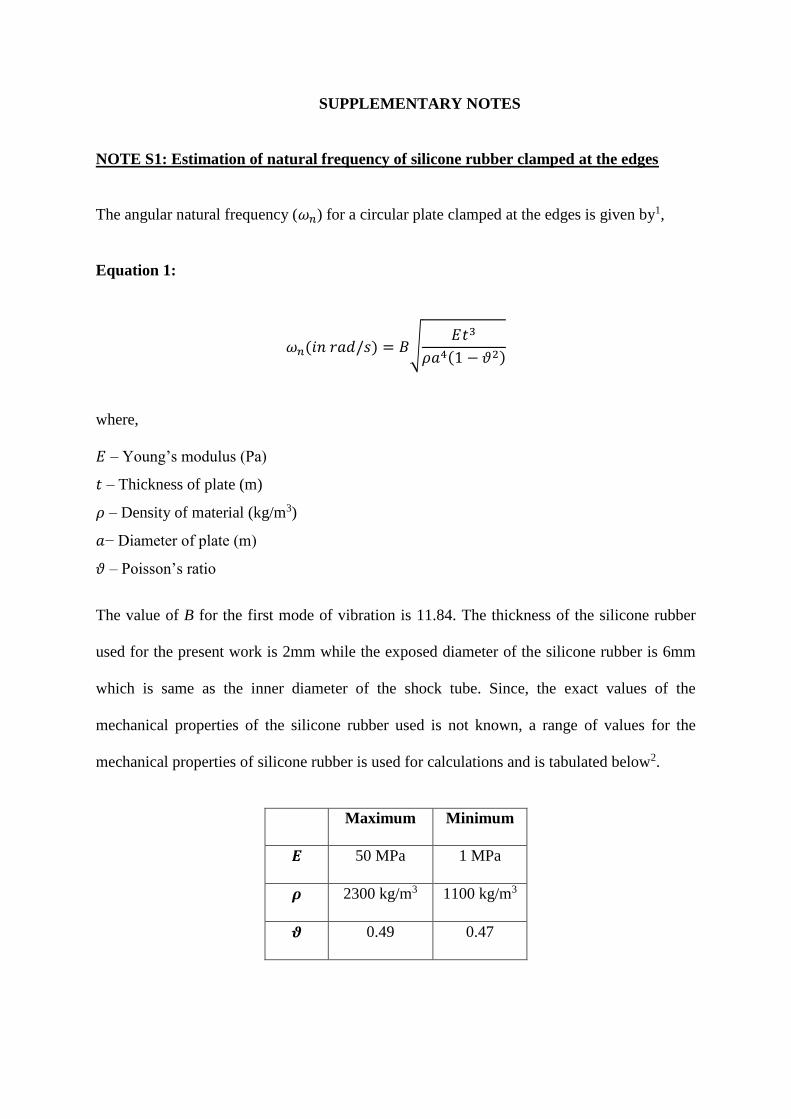
E.coli expressing mCherry
M. tuberculosis cells expressing GFP
(a)
(b) (c)
M. tuberculosis cells expressing GFP
M. smegmatis cells expressing GFP

Figure S4: Confirmation of bacterial transformation using fluorescence microscopy.
(a, b, c) E.coli, M. smegmatis and M.tuberculosis expressing the marker protein namely
mCherry and GFP respectively confirming the transformation.
Figure S5
(a)
(b)
(c)
Figure S5: Modelling the topological changes during shockwave mediated
transformation.

(a) Model of the bacterial cell wall at rest (t=0), (b) Topography of the bacterial cell wall after
shock loading and (c) Bacterial cell wall after shockwave exposure.
Shock tube parameters Shock wave parameters
Configuration Fill pressure
(bar)
Peak
pressure
(bar)
Pulse duration
(µs)
Impulse
(Pa. s)
I 3.0 183 31.9 214.6
II 3.0 89 48.6 122.1
Supplementary Table-I: Calculated values of shock wave parameters for the pressure
signals shown in Supplementary Figure S2a and S2b.
Supplementary Video 1: Schlieren video of the blast evolution from the open end of the
device when operated using configuration-I. The initial oxyhydrogen fill pressure is 3 bars.
Supplementary Video 2: Schlieren video of the blast evolution from the open end of the
device when operated using configuration-II. The initial oxyhydrogen fill pressure is 3 bars.
SUPPLEMENTARY NOTES
NOTE S1: Estimation of natural frequency of silicone rubber clamped at the edges
The angular natural frequency (𝜔𝑛) for a circular plate clamped at the edges is given by1,
Equation 1:
𝜔𝑛(𝑖𝑛 𝑟𝑎𝑑/𝑠) = 𝐵√𝐸𝑡3
𝜌𝑎4(1 − 𝜗2)
where,
𝐸 – Young’s modulus (Pa)
𝑡 – Thickness of plate (m)
𝜌 – Density of material (kg/m3)
𝑎− Diameter of plate (m)
𝜗 – Poisson’s ratio
The value of B for the first mode of vibration is 11.84. The thickness of the silicone rubber
used for the present work is 2mm while the exposed diameter of the silicone rubber is 6mm
which is same as the inner diameter of the shock tube. Since, the exact values of the
mechanical properties of the silicone rubber used is not known, a range of values for the
mechanical properties of silicone rubber is used for calculations and is tabulated below2.
Maximum Minimum
𝑬 50 MPa 1 MPa
𝝆 2300 kg/m3 1100 kg/m3
𝝑 0.49 0.47

For Maximum case,
𝜔𝑛 = 𝐵√𝐸𝑡3
𝜌𝑎4(1 − 𝜗2)= 11.84 × √
50 × 106 × (0.002)3
2300 × (0.006)4 × (1 − 0.492)= 4975 𝑟𝑎𝑑/𝑠
For Minimum case,
𝜔𝑛 = 𝐵√𝐸𝑡3
𝜌𝑎4(1 − 𝜗2)= 11.84 × √
1 × 106 × (0.002)3
1100 × (0.006)4 × (1 − 0.472)= 1005 𝑟𝑎𝑑/𝑠
Substituting the corresponding values in equation 1, the value of ‘𝜔𝑛’ for the maximum and
minimum values of mechanical properties is found to be 4975 rad/s and 1005 rad/s
respectively. The natural frequency (𝑓 =𝜔𝑛
2𝜋⁄ ) corresponding to these values are 791 Hz
and 160 Hz respectively. Therefore, the time period (𝑡 = 1𝑓⁄ ) corresponding to the natural
frequency is 1263 µs and 6250 µs respectively.
References:
1 Harris CM, Piersol AG. Harris' shock and vibration handbook. Sixth Edition. New York:
McGraw-Hill; (2010).
2 http://www.azom.com/properties.aspx?ArticleID=920
NOTE S2: Estimation of time taken by stress waves to travel along liquid column
The speed of sound in a medium is given by,
Equation 2
𝑐 = √𝐾
𝜌
Where,
𝐾 – Bulk modulus of the medium
𝜌 – Density of the medium (considered close to density of water)
Hence, the speed of sound in water is approximately 1500 m/s. Therefore, time taken by
acoustic wave to travel in a liquid column of height 5mm is 3.33µs.
NOTE S3: Transient Structural Analysis of Bacterial Cell Subjected to Shock Loading
The bacterial cell has been modelled as a hollow cylinder with radius, wall thickness and
length being 0.5 μm, 100 nm and 2 μm, respectively. In order to simulate the pores present in
the bacterial wall, a uniform distribution of holes having 10 nm as radius is modelled.
However, the hemispherical caps of the bacterial cell are not modelled. The bacterial cell
model is assigned with experimentally measured material properties which are measured
prior to shock exposure. The properties being: Mass of 1 picogram, volume of 0.6 μm3 and
Elastic Modulus of 160 MPa. A Poisson ratio of 0.49 is used1. The geometric model is
meshed using higher order 3D 20 noded solid elements having translational and rotational
degrees of freedom (dof). The mesh density is increased in the vicinity of the pores to
accurately capture the deformation behavior. The flat faces of the cylindrical geometry are
assumed to be fixed in all dof. The loading to the geometry involves applying transient
pressure load generated from experimental shock loading data, normal to the external
cylindrical surface of the meshed model. Internal pressure of 1 bar is applied radially outward
to the inner cylindrical surface to simulate the bacterial fluid turgor pressure. With the total
analysis time being 300 μs, time steps as low as 1 μs is used to solve the transient problem.
An iterative solver using Newmark time integration method is utilized for solving the
following basic equation of motion,
[𝑀]{�̈�} + [𝐶]{�̇�} + [𝐾]{𝑥} = [{𝐹(𝑡)}]
Where, [M] = mass matrix, [C] = damping matrix, [K] = stiffness matrix, {x} = nodal
displacement vector ( · and ·· represents first and second derivative i.e. velocity and
acceleration, respectively) and {F(t)} = load vector.
The solved model is post processed to primarily obtain the total deflection of model as well
as directional deflection of the pores in order to assess the shock induced elongation of the
bacterial cell and pore in the cell wall.
Reference
1 L.Zhao, D.Schaefer, H.Xu, S. J. Modi, W. R. LaCourse, M. R. Marten*, Elastic Properties of
the Cell Wall of Aspergillus nidulans Studied with Atomic Force Microscopy, Biotechnol. Prog.
2005, 21, 292-299.
Recommended