© 2006 Carnegie Mellon University5/17/2010
Measurement
That
Works –
Really!
J. Wessel
SSTC May 2010

2
Jim Wessel
SSTC 2010
© 2007 Carnegie Mellon University
5/17/2010
ASSIP* Measurement Based Acquisition Improvement Initiative
Finding: Acquisition programs incur cost & schedule trouble at some point, at times the status goes from „Green‟ to „Red‟ in months.
• Sub-optimal outcomes associated with ‘ineffective measurement use‟
• Investment in measurement diminished or under utilized
Action: Conduct Measurement Based Acquisition Improvement Workshops
• Leverage acquisition management best practices and lessons learned, coupled with SEI measurement body of knowledge.
Outcomes: Greater insights into program and product state.
Phase I - Recommend initial measures & implementation frameworkPhase II - Measure Planning & Education delivered; technical
assistance provided; progress tracked to goals.
* Army Strategic Software Improvement Program

3
Jim Wessel
SSTC 2010
© 2007 Carnegie Mellon University
5/17/2010
Army Customers
A list of ASSIP Measurement Assessment customers Include:
• PEO AMMO, PdM MRM
• PEO AVN, 3 APMs: ATNAVICS, MOTS & TAIS
• PEO GCS, PM HBCT
• PEO GCS PM STRYKER
• PEO STRI, PdM OneSAF
• PEO CS & CSS, PM JLTV
• PEO C3T, PD CNI (formerly NetOps)
A SEI technical note has been published (best practices & lessons learned).
http://www.sei.cmu.edu/publications/documents/09.reports/09tn008.html
Two months after a Workshop: an Implementation of recommendations comment-
“the Architecture and Integration contractor and has led to some improvements in our current metrics collection process and data”

4
Jim Wessel
SSTC 2010
© 2007 Carnegie Mellon University
5/17/2010
Army Acquisition Challenges, And Measurement Based Mitigation
A Life Cycle Perspective…
- Examples, Risk, Instantiation
A System of Systems Perspective…
- Software Performance Example
An Overview of Methods…

5
Jim Wessel
SSTC 2010
© 2007 Carnegie Mellon University
5/17/2010
Contract Development
Challenge: Provide a clear articulation
of measurement expectations
• Contractors need Acquisition Leadership guidance
(e.g., Secure Coding)
• Positions Contractors & Acquisition Mgmt
• Articulate the entire measurement process;
Collection, analysis and reporting (periodicity & format)
• Articulate access to data (e.g., IPT members)
• Specify Completeness, Accuracy, Timeliness (QA)
Recommendation:
Start at the RFP Project Phase, review for updates subsequent phases-
Avoid being cornered
from the get go
Incorporating Software Requirements into the System RFP:
http://www.sei.cmu.edu/library/abstracts/reports/09sr008.cfm, Charlene Gross

6
Jim Wessel
SSTC 2010
© 2007 Carnegie Mellon University
5/17/2010
Requirements Management: Samples
Challenge: “What‟s the Work, How did we Spend, How did we Decide?”
Measurement: Baseline work by Source & Type, better able to manage evolution
e.g., New, Fix, External change, Taskers, Re-Work
• Review the alignment of processes to current requirements state
Challenge: Requirements change during projects e.g., new customer work
Measurement: Develop an estimate of change based on history.
• Monitor and record requirements or specifications and all changes.
• Estimate how much change can be tolerated-
Cost/schedule a major concern if new requirements come at a late stage
(may need to normalize input queue/schedule)

7
Jim Wessel
SSTC 2010
© 2007 Carnegie Mellon University
5/17/2010
Requirements Management 2 : Representation
Total Program Dollars Allocated Cost by Product
A B C D E F G H I J
Program Level Or Product Level
Shows allocation of resources to new features, interoperability, and fixes.
Potential Action: reduce fix costs to add resources to new development
Graphical Summary of metrics provides a visible goal.
Actio
na
ble
Inte
llige
nce

8
Jim Wessel
SSTC 2010
© 2007 Carnegie Mellon University
5/17/2010
Technology Insertion
Challenge: New technology demands arrive from
many Internal and external sources
(e.g., GFE/COTs)
Recommend:
• Implement metrics to gauge robustness of technology insertion process.
• Measure „ripple effect‟ potential to understand full impacts (e.g., CM, Test,.. )
Measurement Method:
• Measure use of open/commercial interface standards
• Determine own & stakeholder past technology insertion performance
(what happened to everyone the last time..)
• Determine currency of current, planned skills matrix
Note: TRLs target the readiness of the technology itself –
not the readiness of the vendor (which affects all their processes).

9
Jim Wessel
SSTC 2010
© 2007 Carnegie Mellon University
5/17/2010
Software Development
Challenge: How do I assess Software Development Progress?
Sample measures include:
Component Size -
• Team vs. component size ratio
Development Team performance-
• Team development synchronized, regular integration?
Software Coupling-
• High coupling? Components with highest coupling are also least reliable
Complexity-• Components w/ top 10% complexity value contain the least reliable code
Traceability Matrix-• Map SW Components to desired capabilities (gaps decrease over time)

10
Jim Wessel
SSTC 2010
© 2007 Carnegie Mellon University
5/17/2010
Test Defect Classification
Challenge: How can I use defects collected?
(contractor has a form of defect data residing in a database).
Action: Classify Defects, determine trends and action response.
• Measure Defect rate, origin & found phase (e.g., code)
• Initiate Causal analysis
(categorize!)
• Trend analysis
Use/Benefit:
• Continual quality improvement
• Schedule and cost improvement (catch bugs early, focused QA)
• Reduce re-work, Useful for Reliability Estimation
O peration and
M aintenance
15%
Changes after
com m issioning
20%
Requirem ent
specification
44%
Design and
im plem entation
15%
Installation and
Com m issioning
6%

11
Jim Wessel
SSTC 2010
© 2007 Carnegie Mellon University
5/17/2010
Quality Assurance (QA)
Challenge: Do activity ‘checkmarks’ make the grade?
Few PMOs have QA activity internally or require QA results from suppliers.
• Provide evidence that Supplier & PMO following their defined processes.
• Provide a (needed) holistic perspective on a program.
Recommendation: evaluates the following (measures):
• Defined process for desired data collection
• Adherence to process practice
• Quality of process (how well is it working)
• Measurement data quality (e.g., source: raw or derived)
• Risks discovered (associate risk to findings, mitigation status)

12
Jim Wessel
SSTC 2010
© 2007 Carnegie Mellon University
5/17/2010
Measurement Infrastructure
Challenge: PMOs cant afford to fully fund measurement
Measurement is not free. Infrastructure needed to support data collection and generate regular analysis/reports for distribution.
PMOs resources are limited, programs have significant priorities to balance, battle
rhythm is fast sometimes leaving measurement behind.
• Most PMOs have little experience implementing measurement, hence the
work of measurement falls by default into the hands of the contractor.
Action: Request Assistance-
• Data Repositories
• Training, PMOs can group measurement skill updates
• Assist resourcing for SEC support
(local experts can be utilized more effectively and efficiently)

13
Jim Wessel
SSTC 2010
© 2007 Carnegie Mellon University
5/17/2010
Risk Management
Challenge: Are Risks Monitored, Are key SW risks escaping?
• Risks proposed by an engineer may be seen as “engineering problems”
• Mitigation not considered early, program is unprepared later on.
• Risks are not prioritized at the right level for action.
• If mitigation is too costly for the team, the risk should
be escalated.
• Monitor potential risks to retirement.
• Risk profile should decline as more is learned about the
project and the product.
• Monitor Program Risk Drivers

14
Jim Wessel
SSTC 2010
© 2007 Carnegie Mellon University
5/17/2010
Risk : Categories Of Mission Risk Drivers
Environment
Objectives Resilience Execution Result
Preparation
Drivers can provide leading indications of success or failure
(may regularly report at reviews).
Audrey Dorofee: http://www.sei.cmu.edu/library/abstracts/reports/09tr007.cfm
e.g.,
Innovation
Speed
Agility
Actio
na
ble
Inte
llige
nce
15
Jim Wessel
SSTC 2010
© 2007 Carnegie Mellon University
5/17/2010
Risk : Categories Of Mission Risk Drivers 2
Objectives
1. Program Objectives
Preparation
2. Plan
3. Process
Execution
4. Task Execution
5. Coordination
6. External Interfaces
7. Information Management
8. Technology
9. Facilities and Equipment
Environment
10. Organizational Conditions
11. Compliance
Resilience
12. Event Management
Result
13. Deployment meets readiness criteria
14. Installed components are known (CM)
15. Product configuration is adapted to unit
16. Network has sufficient capacity
17. System is satisfactorily supported in field
18. Certification and accreditation
Example

16
Jim Wessel
SSTC 2010
© 2007 Carnegie Mellon University
5/17/2010
Organizational SW Staff Integration
Recommendations: Monitor Integration of SW Staff/Data in PMO
• Invite SW Leads to report key SW Metrics at regular PM meetings,
relate to key PMO tracking areas e.g., SW Team Performance
Program Office Functions
Planning
Decisions
Change Request
Evaluate Performance
Evaluate Product
Select Vendor
Risk
Action
Incentive Payments
Change Orders
Award Fee
Establish Contract
Team Performance
Estimate Effort
Estimate Duration
Estimate Progress
Allocate Resources
Schedule
Create EVMS
Mitigate Risk
ControlOversight
Communications
Funding vs Need
Track to Schedule
Progress to Plan
Spend to Plan
Risk
SW Team
Performance Measures
Progress
Effort
Milestones
Size Completed
Quality
Requirements Coverage
Plans
Resources Available
Milestones
Size
Quality
Requirements
Associated to overall (SE) Goals
SW Data Utilized
(Core Metric Consideration)

17
Jim Wessel
SSTC 2010
© 2007 Carnegie Mellon University
5/17/2010
Army Acquisition Challenges, And Proposed Mitigation
A System of Systems Perspective…

18
Jim Wessel
SSTC 2010
© 2007 Carnegie Mellon University
5/17/2010
A Driving Acquisition Management Challenge:
“Will Software under development [e.g., algorithms] enable
planned capabilities in a full-up E2E operational environment.”
A SOA based SoS case example…

19
Jim Wessel
SSTC 2010
© 2007 Carnegie Mellon University
5/17/2010
A Software Performance Measurement Perspective
Challenge: “If I wait until formal test events (e.g., LUT), its late to make too many adjustments”
Paper / Static Unit E2E M&S with E2E Test FieldAnalysis Level Tests operational code Range Use Data
on H/W Experiment
~ Notional Roadmap ~
For each ‘milestone’, track deliverables to activities at varied levels:
• Artifacts e.g., Software resource usage / system
• Need “good enough” criteria to move to next phase
Milestones
today

20
Jim Wessel
SSTC 2010
© 2007 Carnegie Mellon University
5/17/2010
Managing SWP Progress 1
Track Metric Maturity
Hardware
Soft
ware
Three Axis per test event:
1.Software:
Mod=Modeled
Sim=Simulated
Proto=Prototype
EB=Early Build
LB=Later Build
Mat=Mature
2.Hardware:
Sim=Simulated
EP=Early Prototype
LP=Late Prototype
IP=Initial Production
FP=Full Production
3.Scale:
SB/MB=Single Blade/Multiple Blades
PU/MPU=Processing Unit/Multiple PUs
SS=Single System
LS=Limited Multiple System
PS=Partial Scale
FS=Full Scale
A
Uneven progress will be visible

21
Jim Wessel
SSTC 2010
© 2007 Carnegie Mellon University
5/17/2010
Managing SWP Progress 2
Discrete Event View
Will SW enable each operational task, as
needed, for the duration of the task.
• At Thread / Step level, determine feasibility
Enterprise (SoS) View
Will SW enable concurrent operational
demands across the SoS?
• For all processes, determine feasibility
Two Complimentary Performance Views
– CPU & RAM Utilization
– Process LAN connectivity
– Process Client Calls (as applicable)
– Process Prioritization
– Process MiddleWare Calls
– Software Threads
– Process Count / System Threads
– Blade to Blade Calls
– Platform LAN utilization
– Client calls over WAN
– CPU traffic to Drives
Representative Metrics:

22
Jim Wessel
SSTC 2010
© 2007 Carnegie Mellon University
5/17/2010
Managing SWP Progress 3
Establish a SWP IPT: This is not a one person job
within large SoS environments (too complex).
Potential goals:
• Align/ratify SWP planning to strategic goals
• Improve (common) understanding and use of SWP measures
• Instantiate an infrastructure to accommodate SWP plan tasks
• e.g., Resources, effective/efficient data collection, analysis,
presentation processes/workflows

23
Jim Wessel
SSTC 2010
© 2007 Carnegie Mellon University
5/17/2010
SWP IPT Best Practice 1
Metric Title Why? How?
Need
Type
High Level
Type
Error Logging and
statistics
Which combinations of services and clients+
Apps under which conditions cause issues at
the system and application level. SYSLOG,
SNMP, OS Capture
Instrumentation of
code w/process to
service to above
metrics + log
parser+ statistical
analysis Efficiency Engineering
I/O bus access
count
Used to derive proxy and other efficiencies.
Can software (per application/client/proxy)
consolidate requests to the drives, can it
minimize access to off-blade devices. Can
requestors minimize requests to a service on
a blade?
Repeated capture
from OS Efficiency Engineering
Instances/Client/situ
ationInstances/Servi
ce/situation. Check for Process Clean up, Avoid hung
processes, Minimize Instances
Process-Message
snapshots and parseEfficiency Engineering
Common SWP Metric Matrix: Implementation Tool for Activity Leads
– Help ensure consistent implementation/use across SoS

24
Jim Wessel
SSTC 2010
© 2007 Carnegie Mellon University
5/17/2010
SWP IPT Best Practice 2
Capture End-To-End Performance
• Mapping helps to ensure adequate, trace-able, End-to-End
Performance.
• Capability (Mission) to SoS (e.g., Services), through System (e.g.,
Use Cases) and eventually Component (Threads) level traceability
Tie to Goals (for example)-
1. Throughput (how much),
2. Latency (how fast), and
3. Computer resources (using what resources)
Utilize existing resources and test assets

25
Jim Wessel
SSTC 2010
© 2007 Carnegie Mellon University
5/17/2010
Method Overview –Implementing Program Measures
Method (Option I):
• Develop basic measures associated to:
— Predictability, Scope and Change, Product Quality, Product Assurance
and Process Effectiveness
— obtain alignment with specific and unique project goals.
• Analyze contractor practice for suitability and application.
— (Optional) negotiate for additional data.
• Transform contractor data into indicators for program use.
• Identify required internal data.
• Implement required internal process for data collection and reporting.
5/17/2010

26
Jim Wessel
SSTC 2010
© 2007 Carnegie Mellon University
5/17/2010
Developing Leading Indicators
Specific, risk-based, time-dependent measures
Method (Option II)
• Introduction describes the basic measures associated to:
— Predictability, Scope and Change, Product Quality, Product Assurance
and Process Effectiveness
• Restate specific and unique project goals with measures.
• Identify project specific risk-drivers (broader than risks).
• Use prepared table to link risk-driver to project-activity.
• Use prepared table to link goal-to-activity-to-indicator.
• Implement data collection and reporting.
5/17/2010
Sam
e a
s p
rio
rD
iffe
ren
t

27
Jim Wessel
SSTC 2010
© 2007 Carnegie Mellon University
5/17/2010
Specialized Measurement Techniques
Review basis of estimate
Analyzing Technical Progress (converging or not)
• Method for conducting a technical review (e.g. PDR) and providing a valuable report.
• Improved effectiveness by analyzing available process information.
Technology Readiness Level (TRL) and Technology Adoption
• Supplementing TRLs with technology adoption and technology
manufacturing readiness assessment.
5/17/2010

28
Jim Wessel
SSTC 2010
© 2007 Carnegie Mellon University
5/17/2010
The Technical Progress Indicator
Test
View
• Green - indicate
expected values
• Black - indicate the
measured values
Interpretation -
High Level Design is
not complete, shows
where resources are
required before
proceeding to
Detailed Design work
Design
Reference
Case
View
Logical View
Development
View
Physical
View
“Radar” Chart : Design Milestone Review (example)
(Function Progress)
(how SW lives on hardware) (SW development progress)

29
Jim Wessel
SSTC 2010
© 2007 Carnegie Mellon University
5/17/2010
Summary
The targeted application of a few measures can provide significant
„actionable intelligence‟ to program managers to illuminate issues and aid
the decision making process toward remediation.
• Must be aligned to the program‟s business needs
• Relating measures to program risk a powerful communications tool
The complexity inherent in large, SoS acquisitions can overcome a
program‟s ability to understand software performance progress. Planning
for software performance measurement management early in the program
lifecycle can aid managers in delivering software that provides intended
capabilities, within end-to-end user environments.

30
Jim Wessel
SSTC 2010
© 2007 Carnegie Mellon University
5/17/2010
Acronym Slide
AMMO - PEO AMMO Ammunition
ASSIP - Army Strategic Software Improvement Program
AVN - PEO Aviation
C3T - PEO Command Control Communications Tactical
CM - Configuration Management
COTS - Common Off The Shelf
CPU - Central Processing Unit
CS&CSS - PEO Combat Support and Combat Service Support
DoD - U.S. Department of Defense
E2E - End-to-End
EIS - PEO Enterprise Information Systems
GAO - U.S. General Accounting Office
GCS - PEO Ground Combat Systems
GFE - Government Furnished Equipment
H/W - Hardware
IEW&S - PEO Intelligence Electronic Warfare and Sensors
IPT - Integrated Product Team
31
Jim Wessel
SSTC 2010
© 2007 Carnegie Mellon University
5/17/2010
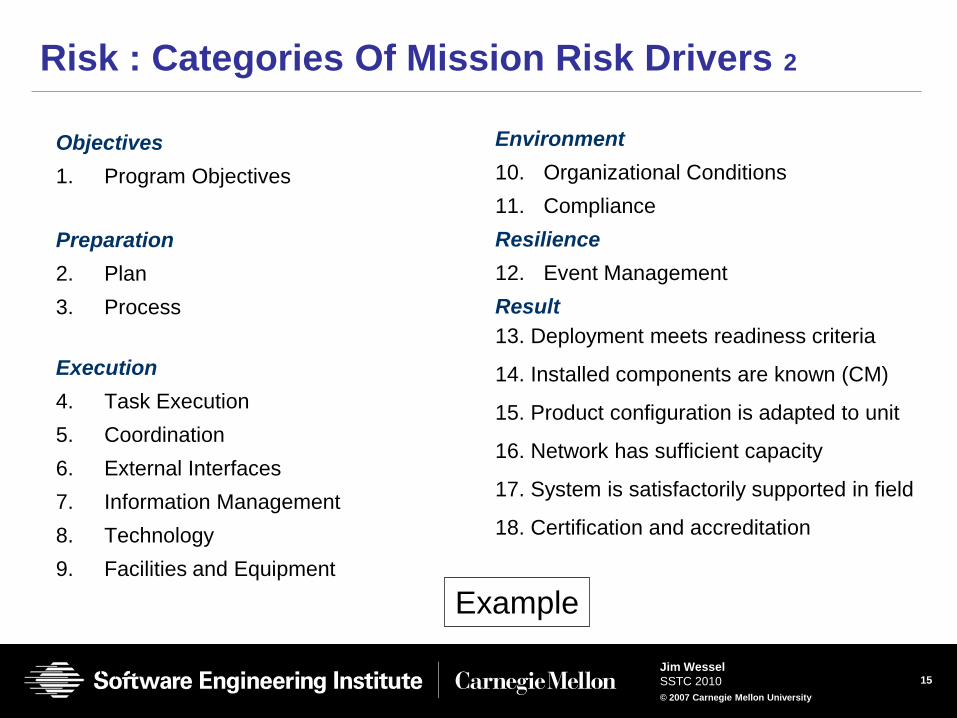
Acronym Slide 2
LAN - Local Area Network
LUT - Limited User Test
M&S - Modeling and Simulation
PEO - Program Executive Officer
PM - Army Program Managers
PMO - Program Management Office
QA - Quality Assurance
RAM - Random Access Memory
RFP - Request For Proposal
SE - Systems Engineering
SEC - US. Army Software Engineering Center
SoS - System of Systems
STRI - PEO Simulation, Training and Instrumentation
SW - Software
SWP - Software Performance
TRL - Technical Readiness Level
WAN - Wide Area Network

32
Jim Wessel
SSTC 2010
© 2007 Carnegie Mellon University
5/17/2010
Backup

33
Jim Wessel
SSTC 2010
© 2007 Carnegie Mellon University
5/17/2010
Core
measureDefinition
Schedule Measures either task duration or task start and task
completion. It is essential that everyone involved agrees on
the definitions and how the tasks and events are measured.
Effort Measures time spent by assigned resources. By monitoring
effort it is possible to observe overburdened resources as
well as understanding program costs.
Size Size may represent either the size of the deliverable or the
size of the inputs. LOC, the typical software measure of
size, is a deliverable measure. Many use Equivalent Lines
of Source Code (ESLOC), a mechanism for normalizing
code size across different teams and different technologies.
Defects Defects as reported by inspections, tests and other quality
assurance activities provide a great deal of information
about program product and process risk.
Requirements Counts of requirements provide information about the rate
of change of the product and the customer environment.
Sample Software Core Measures
These core measures contribute
to project reporting, the analysis
of team performance, and change
management.
For Program Office Functions,
The data used to construct
indicators are mostly the core
measures.

34
Jim Wessel
SSTC 2010
© 2007 Carnegie Mellon University
5/17/2010
Contact Information
Presenter / Point of Contact
Jim Wessel
Acquisition Support Program
Telephone: +1 908-418-0323
Email: [email protected]
U.S. mail:
Software Engineering Institute
Customer Relations
4500 Fifth Avenue
Pittsburgh, PA 15213-2612
USA
World Wide Web:
www.sei.cmu.edu
www.sei.cmu.edu/contact.html
Customer Relations
Email: [email protected]
Telephone: +1 412-268-5800
SEI Phone: +1 412-268-5800
SEI Fax: +1 412-268-6257

35
Jim Wessel
SSTC 2010
© 2007 Carnegie Mellon University
5/17/2010
NO WARRANTY
THIS CARNEGIE MELLON UNIVERSITY AND SOFTWARE ENGINEERING INSTITUTE MATERIAL
IS FURNISHED ON AN “AS-IS" BASIS. CARNEGIE MELLON UNIVERSITY MAKES NO
WARRANTIES OF ANY KIND, EITHER EXPRESSED OR IMPLIED, AS TO ANY MATTER
INCLUDING, BUT NOT LIMITED TO, WARRANTY OF FITNESS FOR PURPOSE OR
MERCHANTABILITY, EXCLUSIVITY, OR RESULTS OBTAINED FROM USE OF THE MATERIAL.
CARNEGIE MELLON UNIVERSITY DOES NOT MAKE ANY WARRANTY OF ANY KIND WITH
RESPECT TO FREEDOM FROM PATENT, TRADEMARK, OR COPYRIGHT INFRINGEMENT.
Use of any trademarks in this presentation is not intended in any way to infringe on the rights of the
trademark holder.
This Presentation may be reproduced in its entirety, without modification, and freely distributed in
written or electronic form without requesting formal permission. Permission is required for any other
use. Requests for permission should be directed to the Software Engineering Institute at
This work was created in the performance of Federal Government Contract Number FA8721-05-C-0003
with Carnegie Mellon University for the operation of the Software Engineering Institute, a federally
funded research and development center. The Government of the United States has a royalty-free
government-purpose license to use, duplicate, or disclose the work, in whole or in part and in any
manner, and to have or permit others to do so, for government purposes pursuant to the copyright
license under the clause at 252.227-7013.
Recommended