Measurement of New Attributes for Chile’s Admissions System to Higher Education
María Verónica Santelices
Juan José Ugarte
Paulina Flotts
Darinka Radovic
Patrick Kyllonen
April 2011
Research Report ETS RR–11-18
Measurement of New Attributes for Chile’s Admissions System to Higher Education
María Verónica Santelices1
Pontificia Universidad Católica de Chile, Santiago
Juan José Ugarte2
Ministry of Education of Chile, Santiago
Paulina Flotts3
Pontificia Universidad Católica de Chile, Santiago
Darinka Radovic4
Pontificia Universidad Católica de Chile, Santiago
Patrick Kyllonen5
ETS, Princeton, New Jersey
April 2011

Technical Review Editor: John Sabatini
Technical Reviewers: Brent Bridgeman and Don Powers
Copyright © 2011 by Educational Testing Service. All rights reserved.
ETS, the ETS logo, GRADUATE RECORD EXAMINATIONS, GRE, and LISTENING. LEARNING. LEADING. are registered trademarks of
Educational Testing Service (ETS).
SAT is a registered trademark of the College Board.
As part of its nonprofit mission, ETS conducts and disseminates the results of research to advance
quality and equity in education and assessment for the benefit of ETS’s constituents and the field.
To obtain a PDF or a print copy of a report, please visit:
http://www.ets.org/research/contact.html

i
Abstract
This paper presents the development and initial validation of new measures of critical thinking
and noncognitive attributes that were designed to supplement existing standardized tests used in
the admissions system for higher education in Chile. The importance of various facets of this
process, including the establishment of technical rigor and political support of instrument
development, piloting, and implementation is also emphasized because the results from this pilot
study could affect the admissions process for some of the most prestigious and competitive
universities in the country. The new instruments were pilot tested on a group of high school
seniors (n = 1,568) and first-year college students (n = 1,443) during 2008. The sample included
students from 20 secondary schools and 4 universities. Initial results were promising and showed
that the measures were effectively assessing attributes not currently considered in the Chilean
higher education admissions process. In addition, performance on the new instruments was found
to be less correlated with students’ sociodemographic characteristics than were measures
currently used for undergraduate admissions.
Key words: undergraduate admissions, admissions to higher education, measurement of
noncognitive attributes, standardized measures, high-stakes testing, test validity, test reliability
ii
Table of Contents
Page
Background ..................................................................................................................................... 1
A Review of New Predictors in Higher Education Admissions .............................................. 1
A Brief History of Admissions Testing in Chile ..................................................................... 4
Method ............................................................................................................................................ 5
Instruments and Instrument Development Process .................................................................. 5
Sample ..................................................................................................................................... 9
Scoring Guides and Scoring Process ..................................................................................... 13
Methodology .......................................................................................................................... 14
Results ........................................................................................................................................... 14
Descriptive Statistics for New Predictors .............................................................................. 16
Relationships Among Measures ............................................................................................ 18
Correlation Among New Instruments .................................................................................... 19
Relationship With Current Admissions Indicators ................................................................ 20
Relationship With Social Desirability Scale .......................................................................... 20
Relationship With Teacher Questionnaire ............................................................................. 20
Differences Between Groups ................................................................................................. 22
Discussion ..................................................................................................................................... 24
Conclusions ................................................................................................................................... 26
References ..................................................................................................................................... 28
Notes ............................................................................................................................................. 32
List of Appendices ........................................................................................................................ 35
iii
List of Tables
Page
Table 1. Description of New Constructs and Measures ............................................................... 6
Table 2. Schedule of Data Collection and Scoring Activities ...................................................... 9
Table 3. Demographic Characteristics of College Student Sample by College and Major ....... 11
Table 4. Demographic Characteristics of High School Senior Sample by High School Type .. 12
Table 5. Descriptive Statistics for New Predictors .................................................................... 15
Table 6. Interrater Agreement for New Measures...................................................................... 19
Table 7. Correlations Among New Instrument Scores .............................................................. 20
Table 8. Correlation With Current Admissions Instruments ..................................................... 21
Table 9. Correlations With Teacher Questionnaire .................................................................... 22
Table 10. Score Differences on New Measures by High School Type ........................................ 23
Table 11. Male and Female Score Differences on New Measures .............................................. 24

1
Background
This report documents the results of a multiyear, multi-institution study on the effects of
using new measures to supplement existing measures for college admissions in Chile. The
existing system is based on a standardized academic achievement test along with high school
grades. The new system proposes augmenting these variables with (a) a critical thinking essay,
(b) a personal reflection essay, (c) an extended biodata application form, and (d) Likert-scale
self-ratings measuring proactivity as well as metacognitive and social abilities. The project was
motivated by two factors: the desire to improve the accuracy and fairness of the current
admissions system in Chile, and the availability of findings and lessons learned from several
other studies that have been conducted with related goals and motivations.
A Review of New Predictors in Higher Education Admissions
Numerous colleges and universities in the United States and elsewhere have investigated
complementing traditional academic admissions measures with indicators of personal attributes
relevant to each institution. This investigation is being done in light of institutional missions to
identify ways to increase the predictive validity of the admissions system and to reduce the
effects of the performance differences observed among sociodemographic groups when using
traditional academic criteria (Breland, Maxey, Gernand, Cumming, & Trapani, 2001; Geiser &
Santelices, 2007; Rigol, 2003; Zwick & Grief Greene, 2007). Although this practice has been
common among private institutions for a long time, figures from the Admission Practices Survey
(Breland et al., 2001) suggested that the use of supplementary measures has extended to public
institutions.
The admissions decisions consider different dimensions of the applicant depending on the
institutional mission and philosophy (Perfetto, 1999). For example, some institutions weigh
academic indicators more heavily, while others value more significantly the potential of students
to contribute to the institution. This alignment between institutional mission and admissions
criteria is of fundamental importance (College Board, 2002).
Several major higher education studies have been conducted recently that provide
suggestions for how a new admissions system could be designed. The College Board together
with researchers from Michigan State University have developed instruments that combine
situational judgment and biodata items to assess the constructs implied by the mission statements
of 35 American higher education institutions (Oswald, Schmitt, Kim, Gillespie, & Ramsay,
2
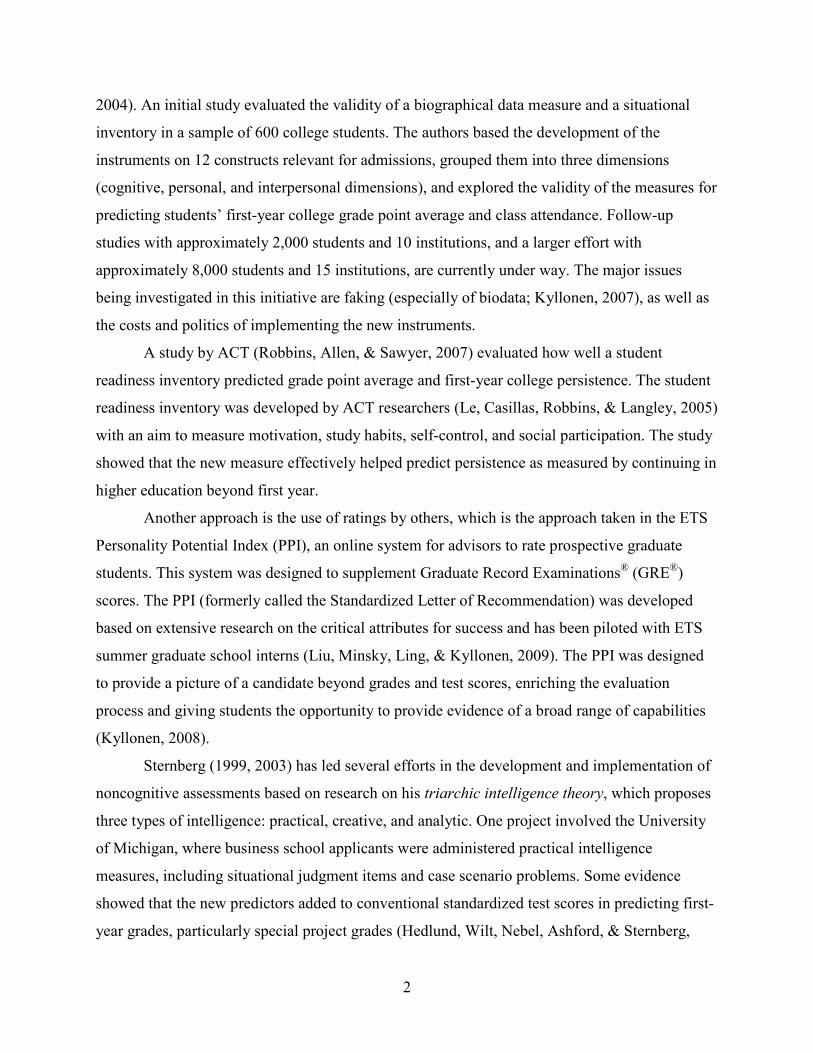
2004). An initial study evaluated the validity of a biographical data measure and a situational
inventory in a sample of 600 college students. The authors based the development of the
instruments on 12 constructs relevant for admissions, grouped them into three dimensions
(cognitive, personal, and interpersonal dimensions), and explored the validity of the measures for
predicting students’ first-year college grade point average and class attendance. Follow-up
studies with approximately 2,000 students and 10 institutions, and a larger effort with
approximately 8,000 students and 15 institutions, are currently under way. The major issues
being investigated in this initiative are faking (especially of biodata; Kyllonen, 2007), as well as
the costs and politics of implementing the new instruments.
A study by ACT (Robbins, Allen, & Sawyer, 2007) evaluated how well a student
readiness inventory predicted grade point average and first-year college persistence. The student
readiness inventory was developed by ACT researchers (Le, Casillas, Robbins, & Langley, 2005)
with an aim to measure motivation, study habits, self-control, and social participation. The study
showed that the new measure effectively helped predict persistence as measured by continuing in
higher education beyond first year.
Another approach is the use of ratings by others, which is the approach taken in the ETS
Personality Potential Index (PPI), an online system for advisors to rate prospective graduate
students. This system was designed to supplement Graduate Record Examinations® (GRE®)
scores. The PPI (formerly called the Standardized Letter of Recommendation) was developed
based on extensive research on the critical attributes for success and has been piloted with ETS
summer graduate school interns (Liu, Minsky, Ling, & Kyllonen, 2009). The PPI was designed
to provide a picture of a candidate beyond grades and test scores, enriching the evaluation
process and giving students the opportunity to provide evidence of a broad range of capabilities
(Kyllonen, 2008).
Sternberg (1999, 2003) has led several efforts in the development and implementation of
noncognitive assessments based on research on his triarchic intelligence theory, which proposes
three types of intelligence: practical, creative, and analytic. One project involved the University
of Michigan, where business school applicants were administered practical intelligence
measures, including situational judgment items and case scenario problems. Some evidence
showed that the new predictors added to conventional standardized test scores in predicting first-
year grades, particularly special project grades (Hedlund, Wilt, Nebel, Ashford, & Sternberg,

3
2006). The Rainbow Project, sponsored by the College Board, was another effort involving
undergraduate admissions at a consortium of several universities (Sternberg and the Rainbow
Project Collaborators, 2006). The noncognitive assessment measures were of three types: (a)
creative—interpreting cartoons, writing essays; (b) analytic—traditional ability measures; and (c)
practical—situational judgment tests. Sternberg’s most recent initiative, the Kaleidoscope Project
(Sternberg, 2009), dealt with undergraduate admissions at Tufts University. The measures
included optional essays, evaluated for creativity (“what if” questions), practicality, and wisdom
skills. In all cases, there has been some evidence that new measures can add to conventional tests
in predicting academic outcomes as well as some evidence for reduced adverse impact against
historically underrepresented applicant groups.
In Europe, a number of noncognitive assessment projects were begun during the last few
years. Several German and Austrian universities are using self-assessments to help students
select majors (Frebort, & Kubinger, 2007; Hornke, 2007; Jonkisz & Moosbrugger, 2007;
Kubinger, Moosbrugger, Frebort, & Jonkisz, 2007; Lengenfelder, Baumann, Nürk, & Allesch,
2007) and thus reduce the dropout rate. The new measures include personality assessment,
interest inventories, and cognitive tests.
The studies mentioned in this section that have explored the validity of new measures in
college settings show that they may contribute to the prediction of academic outcomes such as
grades, persistence, and graduation rates, as well as to the broader definitions of college success
such as leadership and civic participation. An additional finding has been that these new
measures tend to show smaller differences in the performance of students from different
sociodemographic groups (Camara, 2005; Cliffordson & Askling, 2006; Willingham, 1985).
From this review, several conclusions can be drawn. First, a widespread interest exists in
the idea that current college admissions systems, which rely on grades and standardized test
scores, are omitting important information about key student attributes. New measures are likely
to add somewhat to the predictive validity of current admissions measures, and including new
measures is likely to lead to less adverse impact against historically underrepresented student
groups. A number of demonstration projects are now in existence, which offer several lessons
learned. Some of these projects—such as Hedlund et al.’s (2006) business school project, and the
College Board’s college admissions project (Oswald et al., 2004)—have relied on biodata
measures. Others have examined self-assessments. Although self-assessments may be

4
susceptible to validity threats due to coaching and faking, they provide important information
about the relationship between different predictors and outcomes.
A couple of other projects mentioned here are useful to consider even though they may
not be directly relevant to the current project. The European low-stakes self-assessment approach
may be useful to investigate down the road, and ETS’s ratings-by-others system is not currently
practical in Chile due to the requirement for online administration, although it could be in the
future.
A Brief History of Admissions Testing in Chile
In 2009 , Chile had 61 colleges and universities, 25 of which receive direct public funding
(Ministerio de Educacion, 2011). These 25 institutions are organized in a joint committee, which,
among other responsibilities, establishes admissions policy as well as test administration procedures
and calendars. This committee is called Consejo de Rectores de las Universidades Chilenas
(CRUCH). In 1963, the CRUCH institutions agreed on a common admissions system, and since
then, the variables considered have remained unchanged: Admissions to these institutions has been
based exclusively on high school grades and standardized test scores.6
The only significant modification made to the admissions criteria since 1963 has been the
standardized test used. In 2004, the Prueba de Aptitud Académica (Test of Academic Skills), a
general skills examination based on the concept of intelligence as a general ability, was replaced
by an exam that is aligned with the national curriculum content for secondary education. This
latter test is called the Prueba de Selección Universitaria (Test for University Admissions).
The Catholic University of Chile is currently studying the possibility of adding noncognitive
attributes and a critical thinking test to the set of elements considered for admissions to this higher
education institution. Furthermore, it had been the institution’s intent that CRUCH also include these
new instruments part of the centralized undergraduate admissions battery.
The Catholic University is one of the two most selective higher education institutions in
Chile (Brunner & Uribe, 2007, p. 238). It receives about 21,000 applications each year for a
freshman class of approximately 3,500 students.
Early during the study design process, three additional CRUCH institutions (the
University of Concepcion, the University of Santiago, and the University Federico Santa Maria),
decided to participate in the new predictor study. The participation of these institutions and 20
high schools broadened the sample significantly and hence the generalizability of results.
5
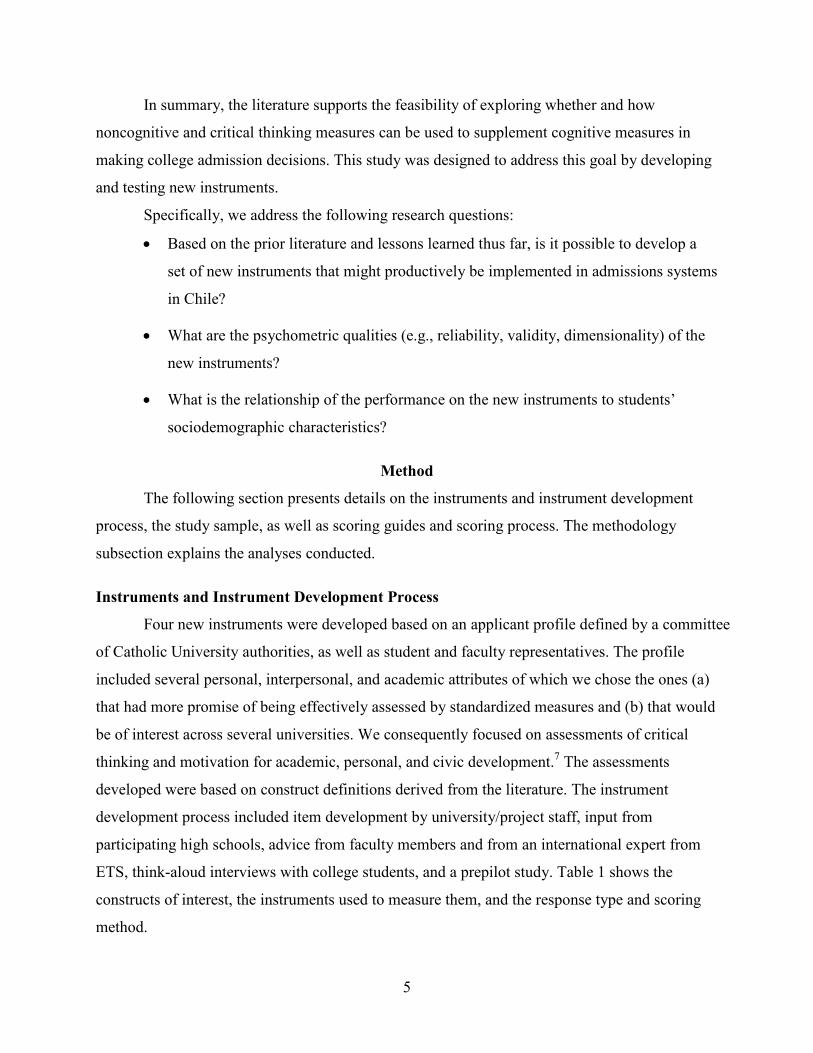
In summary, the literature supports the feasibility of exploring whether and how
noncognitive and critical thinking measures can be used to supplement cognitive measures in
making college admission decisions. This study was designed to address this goal by developing
and testing new instruments.
Specifically, we address the following research questions:
• Based on the prior literature and lessons learned thus far, is it possible to develop a
set of new instruments that might productively be implemented in admissions systems
in Chile?
• What are the psychometric qualities (e.g., reliability, validity, dimensionality) of the
new instruments?
• What is the relationship of the performance on the new instruments to students’
sociodemographic characteristics?
Method
The following section presents details on the instruments and instrument development
process, the study sample, as well as scoring guides and scoring process. The methodology
subsection explains the analyses conducted.
Instruments and Instrument Development Process
Four new instruments were developed based on an applicant profile defined by a committee
of Catholic University authorities, as well as student and faculty representatives. The profile
included several personal, interpersonal, and academic attributes of which we chose the ones (a)
that had more promise of being effectively assessed by standardized measures and (b) that would
be of interest across several universities. We consequently focused on assessments of critical
thinking and motivation for academic, personal, and civic development.7 The assessments
developed were based on construct definitions derived from the literature. The instrument
development process included item development by university/project staff, input from
participating high schools, advice from faculty members and from an international expert from
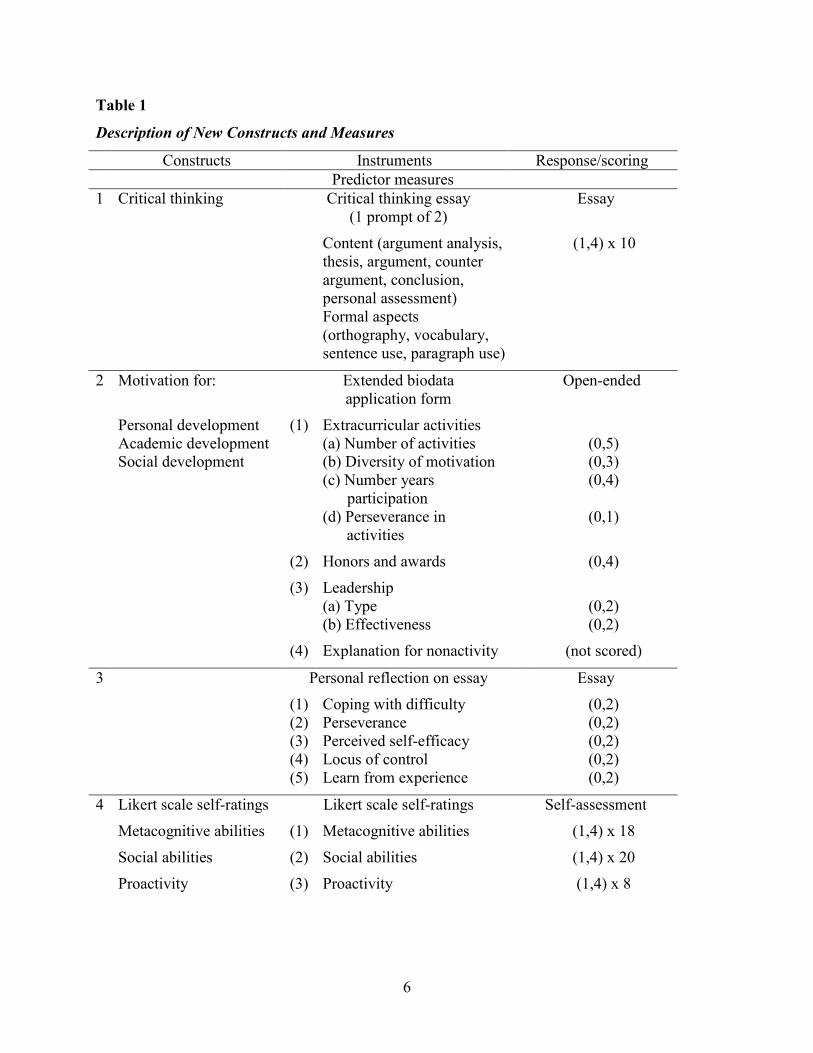
ETS, think-aloud interviews with college students, and a prepilot study. Table 1 shows the
constructs of interest, the instruments used to measure them, and the response type and scoring
method.
6
Table 1
Description of New Constructs and Measures
Constructs Instruments Response/scoring Predictor measures
1 Critical thinking Critical thinking essay (1 prompt of 2)
Essay
Content (argument analysis, thesis, argument, counter argument, conclusion, personal assessment) Formal aspects (orthography, vocabulary, sentence use, paragraph use)
(1,4) x 10
2 Motivation for: Extended biodata application form
Open-ended
Personal development (1) Extracurricular activities Academic development (a) Number of activities (0,5) Social development (b) Diversity of motivation (0,3) (c) Number years
participation (0,4)
(d) Perseverance in activities
(0,1)
(2) Honors and awards (0,4)
(3) Leadership (a) Type (0,2) (b) Effectiveness (0,2)
(4) Explanation for nonactivity (not scored)
3 Personal reflection on essay Essay
(1) Coping with difficulty (0,2) (2) Perseverance (0,2) (3) Perceived self-efficacy (0,2) (4) Locus of control (0,2) (5) Learn from experience (0,2)
4 Likert scale self-ratings Likert scale self-ratings Self-assessment
Metacognitive abilities (1) Metacognitive abilities (1,4) x 18
Social abilities (2) Social abilities (1,4) x 20
Proactivity (3) Proactivity (1,4) x 8
7
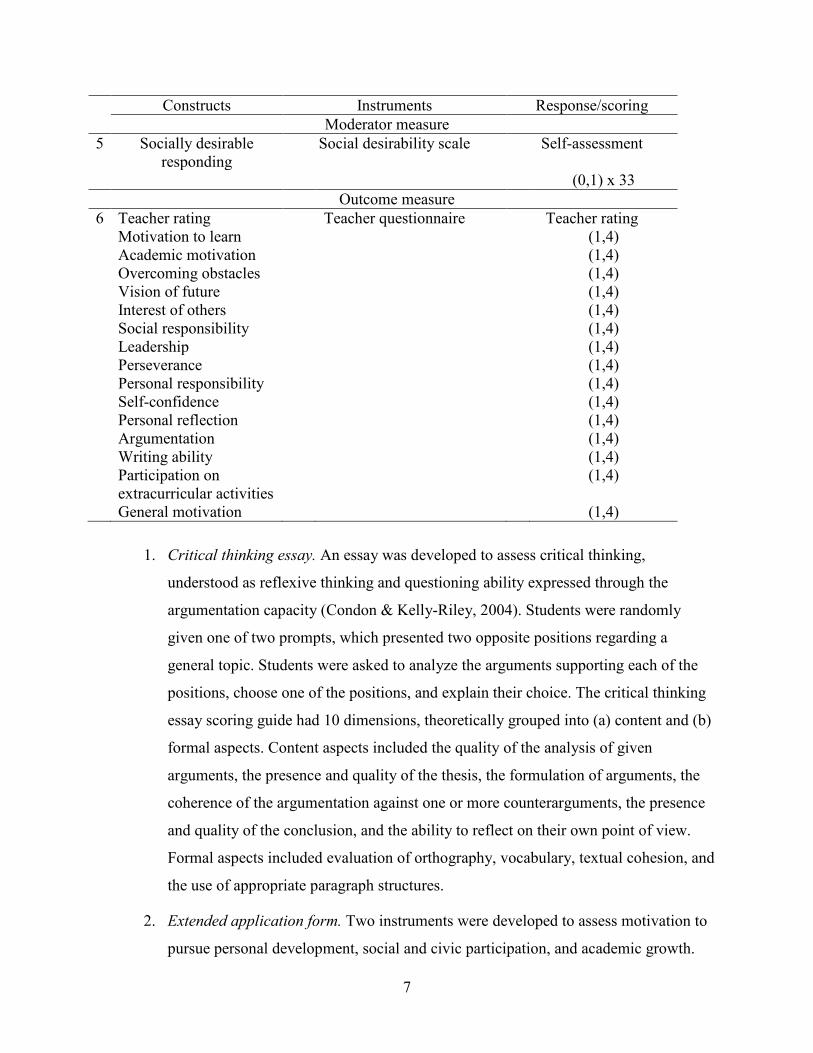
Constructs Instruments Response/scoring Moderator measure
5 Socially desirable responding
Social desirability scale Self-assessment
(0,1) x 33 Outcome measure 6 Teacher rating Teacher questionnaire Teacher rating Motivation to learn (1,4) Academic motivation (1,4) Overcoming obstacles (1,4) Vision of future (1,4) Interest of others (1,4) Social responsibility (1,4) Leadership (1,4) Perseverance (1,4) Personal responsibility (1,4) Self-confidence (1,4) Personal reflection (1,4) Argumentation (1,4) Writing ability (1,4) Participation on
extracurricular activities (1,4)
General motivation (1,4)
1. Critical thinking essay. An essay was developed to assess critical thinking,
understood as reflexive thinking and questioning ability expressed through the
argumentation capacity (Condon & Kelly-Riley, 2004). Students were randomly
given one of two prompts, which presented two opposite positions regarding a
general topic. Students were asked to analyze the arguments supporting each of the
positions, choose one of the positions, and explain their choice. The critical thinking
essay scoring guide had 10 dimensions, theoretically grouped into (a) content and (b)
formal aspects. Content aspects included the quality of the analysis of given
arguments, the presence and quality of the thesis, the formulation of arguments, the
coherence of the argumentation against one or more counterarguments, the presence
and quality of the conclusion, and the ability to reflect on their own point of view.
Formal aspects included evaluation of orthography, vocabulary, textual cohesion, and
the use of appropriate paragraph structures.
2. Extended application form. Two instruments were developed to assess motivation to
pursue personal development, social and civic participation, and academic growth.

8
The first was the extended application form, which focused on the behavioral
manifestation of motivation. Biodata was collected through questions in three
subsections: (a) participation in extracurricular activities, (b) honors and awards, and
(c) leadership. The extended application form also had a final question asking
students to provide an explanation if they had not participated in any activity during
high school. Students could report a maximum of five extracurricular activities, three
awards, and one leadership position. To deter overclaiming, contact information of
people or institutions where these activities had taken place was requested.8
3. Personal reflection essay. The other instrument developed to assess motivation was a
personal reflection essay in which students were asked to describe up to three
activities that represented their interests to explain and exemplify (a) how they face or
cope with difficulty, (b) how much they persevere, (c) their self-efficacy, (d) their
locus of control, and (e) their capacity to learn from experience and project into the
future. For this exercise, formal aspects, such as orthography or vocabulary, were not
evaluated (these aspects were only evaluated for the critical thinking essay).
4. Likert scale self-ratings. Likert scale questionnaires were administered to assess (a)
metacognitive skills, (b) social abilities, and (c) proactivity. These questionnaires
were much easier to administer and score than essays; therefore their performance
was of special interest considering a national undergraduate admission process that
could include up to 150,000 applications.
5. Social desirability scale. A Spanish translation of the Marlowe-Crowne scale was
administered to identify socially desirable responding, a well-known problem in
noncognitive measurement. The scale was administered along with the instruments
described above.
6. Teacher questionnaire. A teacher questionnaire was developed for this study and was
distributed and completed during the two weeks prior to the test application in high
schools. Senior class home teachers were required to rate each of their students on
noncognitive constructs such as motivation to learn, self-efficacy, vision of the future,
leadership, social responsibility, and participation in extracurricular activities, among
others, on four-point Likert scales. The questionnaire also included questions
regarding the length of time the teacher knew the student and the depth of that

9
knowledge. The purpose of this instrument was to serve as an outcome measure that
would enable the validation of the new predictor measures.
Sample
Data collection was conducted during 2008 as a research study; scores were not used for
admissions. The battery of instruments was administered to a sample of approximately 1,400 first-
year college students from a variety of majors at four higher education institutions (all members of
the CRUCH) and approximately 1,600 high school seniors from private, public, and publicly
subsidized high schools. These two groups were included with the aim of obtaining data that was
as representative of a college applicant sample as possible. While the ideal would have been to test
applicants at the same time as they took the standardized admissions test (the Pruebas de Selección
Universitaria [PSU]), students had little incentive to take part in such an exercise, and the ones
who would have taken part would not necessarily have represented the applicant population.
Instead, we decided to assess students in formal educational settings where they would be more
easily found and more likely to consent to participate. High school seniors closely resemble
applicants, especially toward the end of their senior year, and college freshmen are also like
applicants, especially early in their first year of college when they have not yet been affected by
the university experience.9 Based on these considerations, data for the college freshmen sample
were collected between April and July of 200810 and data for the high school senior sample were
collected between September and October 2008 (see Table 2). All participants signed a formal
consent to participate. High school seniors also had signed consent from their legal guardian.
Table 2
Schedule of Data Collection and Scoring Activities
Date Activities March 2008 Beginning of school year April 2008 Data collection begins for college freshman sample June 2008 Catholic University instruments scored July 2008 Data collection ends for college freshman sample September 2008 Data collection begins for high school senior sample October 2008 Data collection ends for high school senior sample Scoring of remaining instruments from university
sample and high school sample December 2008 End of school year

10
The college sample included students from four universities: three nonpublic universities
(the Catholic University [n = 586], the University of Concepcion [n = 283], and University
Federico Santa Maria [n = 176]) and one public university (University of Santiago, n = 398).
While two of these institutions are located in the country’s capital, two of them are outside the
metropolitan area of Santiago but still in densely populated areas. These institutions have a
similar degree of selectivity: They admit between 30% and 34% of valid applicants.11
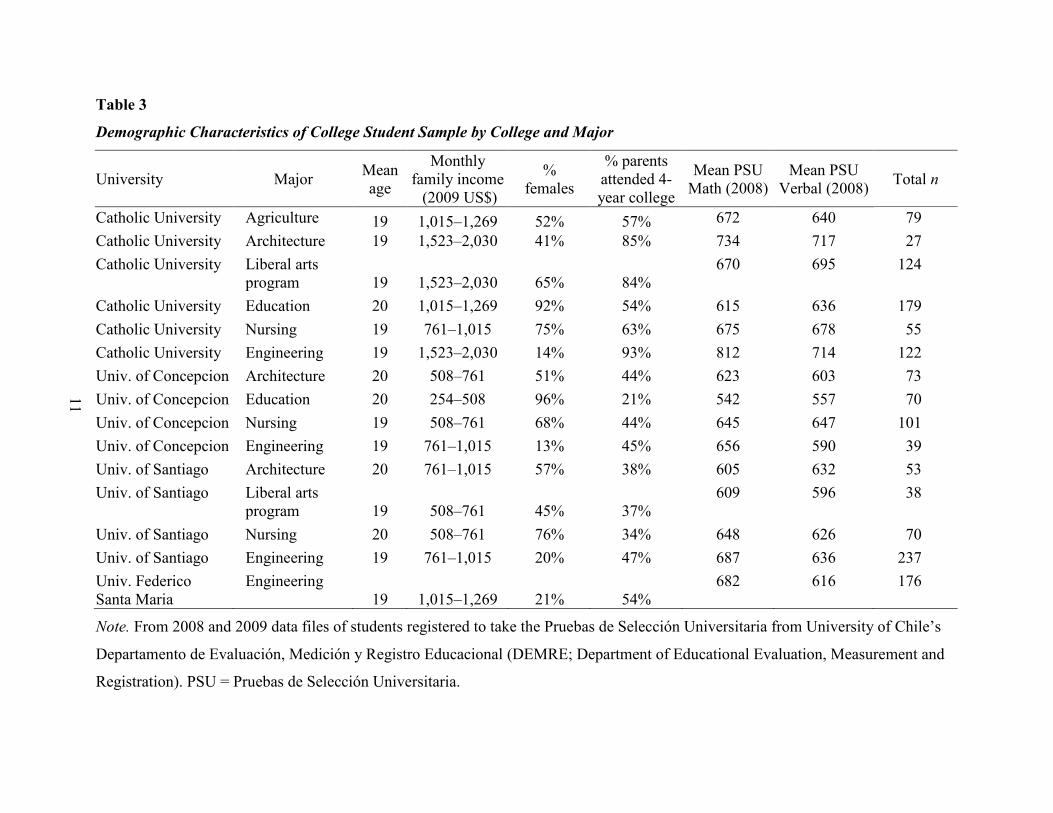
Majors were chosen with the purpose of having adequate representation and variability of
(a) subject matters and disciplines, (b) selectivity, and (c) students’ characteristics such as
gender, academic achievement, and socioeconomic profile. Students included in the sample
varied both in socioeconomic and academic characteristics (see Table 3).
Secondary schools participating in the study represented the three types of high schools
in Chile’s educational system: private, public, and publicly subsidized (see Table 4) and most are
representative of high schools whose graduates have traditionally been wait-listed at the Catholic
University due to their scores being near the cut-off score for the major of their choice.12,13,14 The
inclusion of three additional municipal and two publicly subsidized high schools, of special
interest to some of the universities participating in the study, significantly broadened the
socioeconomic and academic characteristics of the student sample.
Participation in the study was voluntary but encouraged by members of each of the high
schools and universities. To motivate participation, the research team made special presentations
about the study to teachers and students at some of the high schools and universities. In addition,
a food incentive was provided to all college students who completed all the instruments.
Additionally, college and high school students participated in a lottery drawing of 300 MP3
players. Test administrations took place during classtime both in high schools and universities.
The participation rate was approximately 50% of each class and approximately the same in high
schools and universities. The nonparticipation rate reflects a combination of students who chose
not to participate and those who did not attend class that day. All instruments were administered
by trained staff that followed a standardized administration protocol. Test administration took
approximately three hours.
11
Table 3
Demographic Characteristics of College Student Sample by College and Major
University Major Mean age
Monthly family income (2009 US$)
% females
% parents attended 4-year college
Mean PSU Math (2008)
Mean PSU Verbal (2008) Total n
Catholic University Agriculture 19 1,015–1,269 52% 57% 672 640 79 Catholic University Architecture 19 1,523–2,030 41% 85% 734 717 27 Catholic University Liberal arts
program 19 1,523–2,030 65% 84% 670 695 124
Catholic University Education 20 1,015–1,269 92% 54% 615 636 179 Catholic University Nursing 19 761–1,015 75% 63% 675 678 55 Catholic University Engineering 19 1,523–2,030 14% 93% 812 714 122 Univ. of Concepcion Architecture 20 508–761 51% 44% 623 603 73 Univ. of Concepcion Education 20 254–508 96% 21% 542 557 70 Univ. of Concepcion Nursing 19 508–761 68% 44% 645 647 101 Univ. of Concepcion Engineering 19 761–1,015 13% 45% 656 590 39 Univ. of Santiago Architecture 20 761–1,015 57% 38% 605 632 53 Univ. of Santiago Liberal arts
program 19 508–761 45% 37% 609 596 38
Univ. of Santiago Nursing 20 508–761 76% 34% 648 626 70 Univ. of Santiago Engineering 19 761–1,015 20% 47% 687 636 237 Univ. Federico Santa Maria
Engineering 19 1,015–1,269 21% 54%
682 616 176
Note. From 2008 and 2009 data files of students registered to take the Pruebas de Selección Universitaria from University of Chile’s
Departamento de Evaluación, Medición y Registro Educacional (DEMRE; Department of Educational Evaluation, Measurement and
Registration). PSU = Pruebas de Selección Universitaria.

12
Table 4
Demographic Characteristics of High School Senior Sample by High School Type
High school funding source
Mean age
Monthly family income
(2009 US$) % females
% parents attended 4-year college
Mean PSU Math (2009)
Mean PSU Verbal (2009) Total n
Municipal/public 18 812-1,083 48% 27% 610 611 651
Publicly subsidized 18 1,083-1,353 40% 46% 564 561 398
Private 18 2,707-2,977 51% 95% 687 660 491
Penta program 18 541-812 54% 37% 649 641 28
Note: PSU = Pruebas de Selección Universitaria.
13
Only students who graduated from high school in 2002 or later and had started college in
2007 or 2008 were considered in the final college sample. Students in the final sample were on
average 18.5 years old, 52% were male, and all were approximately equally drawn from public
high schools (34%), private high schools (32%), and publicly subsidized high schools (31%).
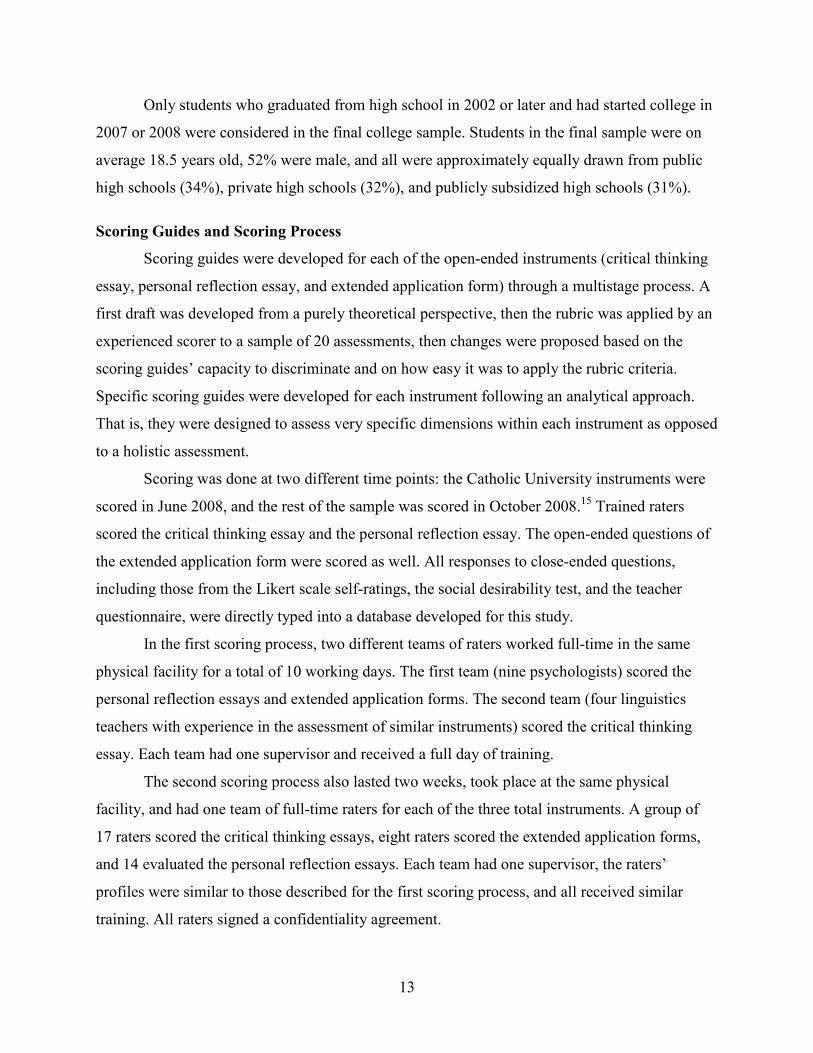
Scoring Guides and Scoring Process
Scoring guides were developed for each of the open-ended instruments (critical thinking
essay, personal reflection essay, and extended application form) through a multistage process. A
first draft was developed from a purely theoretical perspective, then the rubric was applied by an
experienced scorer to a sample of 20 assessments, then changes were proposed based on the
scoring guides’ capacity to discriminate and on how easy it was to apply the rubric criteria.
Specific scoring guides were developed for each instrument following an analytical approach.
That is, they were designed to assess very specific dimensions within each instrument as opposed
to a holistic assessment.
Scoring was done at two different time points: the Catholic University instruments were
scored in June 2008, and the rest of the sample was scored in October 2008.15 Trained raters
scored the critical thinking essay and the personal reflection essay. The open-ended questions of
the extended application form were scored as well. All responses to close-ended questions,
including those from the Likert scale self-ratings, the social desirability test, and the teacher
questionnaire, were directly typed into a database developed for this study.
In the first scoring process, two different teams of raters worked full-time in the same
physical facility for a total of 10 working days. The first team (nine psychologists) scored the
personal reflection essays and extended application forms. The second team (four linguistics
teachers with experience in the assessment of similar instruments) scored the critical thinking
essay. Each team had one supervisor and received a full day of training.
The second scoring process also lasted two weeks, took place at the same physical
facility, and had one team of full-time raters for each of the three total instruments. A group of
17 raters scored the critical thinking essays, eight raters scored the extended application forms,
and 14 evaluated the personal reflection essays. Each team had one supervisor, the raters’
profiles were similar to those described for the first scoring process, and all received similar
training. All raters signed a confidentiality agreement.

14
Inter-rater agreement was tracked through the double scoring of all critical thinking and
personal reflection essays and of 20% of the open-ended questions of the extended application
forms. Item score differences of one point were resolved by taking the mean of the two scores.
Item score differences of more than one point (on the ten 4-point dimensions for the critical
thinking essays, the 3-point scale items for the personal reflection essays, and 3-point scale for
the leadership type and leadership effectiveness items of the extended biodata application form)
were resolved with a third rating by the team supervisor. In those cases, the discrepant scorer(s)
received retraining on the scoring guide.
Methodology
The validity and reliability of the instruments was assessed through internal consistency
indicators, relative difficulty of the items, inter-rater reliability, and factor structure. We
extracted factors based on the scree plots and the number of eigenvalues above one, and then we
implemented oblique rotations. Validity evidence for the new measures was also evaluated by
examining correlations between the new predictor measures and (a) home teacher ratings, (b) the
social desirability scale, (c) students’ high school grades, and (d) standardized test scores. While
we expected that the home teacher ratings would provide evidence of convergent validity for the
new measures (moderate to high correlations), we expected low to moderate relationships
between the new measures and the current admission measures as they aim to assess new and
supplementary constructs. Ideally, no relationship would exist between the social desirability
scale and the new instruments.
The relationship with socioeconomic variables was analyzed by looking at the mean
difference of standardized scores. The expectation was that the standardized score difference in
the new measures would be less than the standardized score difference in current admission
instruments.
Results
This section presents an overview of the results by instrument type and the relationship
between the new instruments and variables of interest (scores on the standardized cognitive test
currently used for admissions, the social desirability test, and the teacher questionnaire). The
disparate impact of the new measures is also analyzed.
15
Table 5
Descriptive Statistics for New Predictors
Variable N Mean SD Minimum Maximum
Critical thinking essaya Argument analysis 2,592 3.1 0.7 1 4 Thesis 2,592 3.4 0.6 1 4 Argument 2,592 3.0 0.6 1 4 Counter argument 2,592 1.7 0.8 1 4 Conclusion 2,592 3.1 0.8 1 4 Personal assessment 2,592 1.4 0.7 1 4 Orthography 2,592 1.7 0.8 1 4 Vocabulary 2,592 1.6 0.6 1 4 Sentence use 2,592 2.9 0.8 1 4 Paragraph use 2,592 2.8 0.7 1 4
Extended biodata application form (EBAF) b Number of extracurricular activities (NEA) 2,960 2.3 1.5 0 5 Diversity of motivation (DIM) 2,960 1.0 0.9 0 3 # years participation (YEA) 2,711 2.2 0.9 0 4 Perseverance between activities (PER) 2,722 0.1 0.3 0 1 Maximum award level (MAL) 1,563 1.6 1.0 1 4 Leadership type (LT) 1,411 0.7 0.7 0 2 Leadership effectiveness (LE) 705 0.9 0.6 0 2
Personal reflection essay b Coping with difficulty 2,132 0.8 0.8 0 2 Perseverance 2,132 0.8 0.7 0 2 Perceived self-efficacy 2,132 0.5 0.6 0 2 Locus control 2,132 0.7 0.8 0 2 Learn from experience 2,132 0.4 0.5 0 2
Likert scale self-ratings c Metacognitive strategies 2,740 52.2 7.9 20 72 Social abilities 2,743 61.9 6.4 38 79 Proactivity 2,735 28.8 2.5 8 32 a Extremely short critical thinking essays were not considered in the analysis. Longer essays were
considered to resemble more closely the motivation and behavior of students in a high stakes test
administration. b Only personal reflection essays in which students provided evidence supporting
their motivation for personal, social, or academic development were considered. c Only
questionnaires that had more than 50% of the questions completed were considered as valid
cases since these cases were considered to resemble more closely the motivation and behavior of
students in a high stakes test administration.

16
Descriptive Statistics for New Predictors
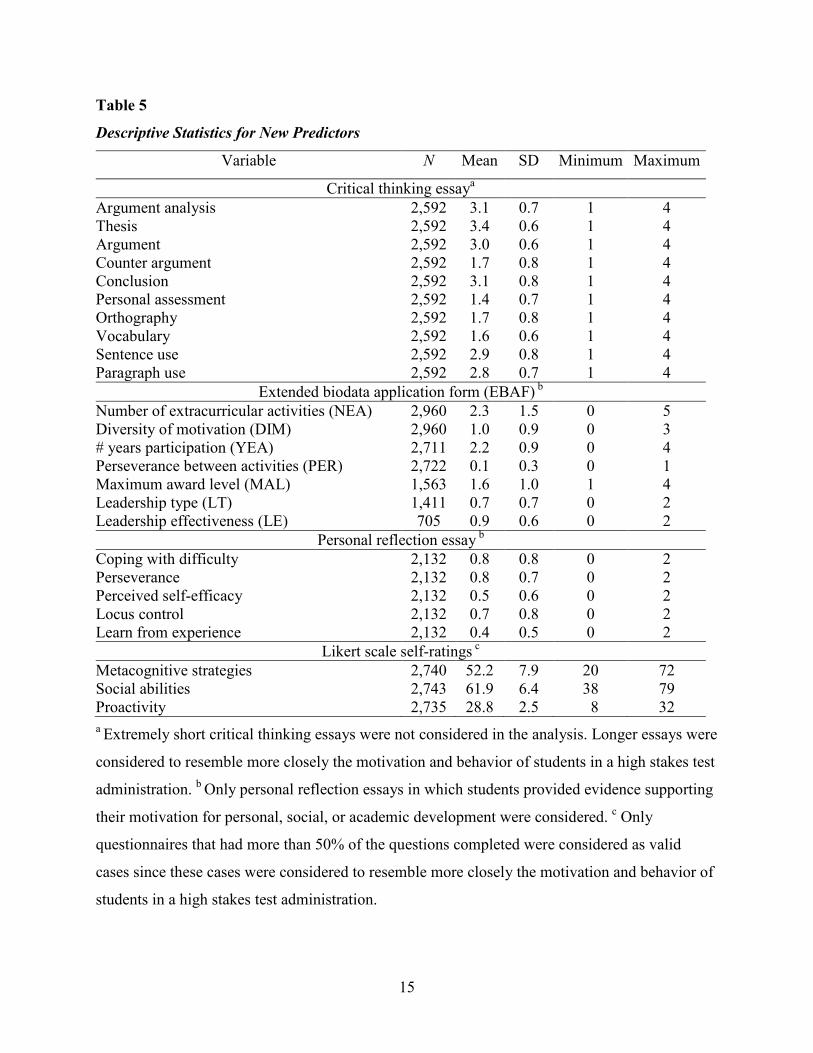
This section presents descriptive statistics for the new predictors (see Table 5).
Critical thinking essay. Students did relatively well in analyzing the quality of the
arguments provided and in presenting their own thesis. They performed less well in assessing
their own point of view and in formal aspects such as vocabulary and orthography. These results
are consistent with those observed in applications of similar tests in Chilean college-age students
(Manzi & Flotts, 2006). A factor analysis of the 10 critical thinking essay scales suggested two
dimensions: one assessing content and the other evaluating formal aspects (see Appendix A for
details). Based on this finding, a composite critical thinking essay score was computed as a
weighted sum of the content scales (70%) and the formal aspect scales (30%).
Extended biodata application form (EBAF). On the extended biodata application form
(EBAF) students reported an average of 2.3 activities but only about 1.4 of these activities were
key activities that motivated them to pursue either personal, academic, or social development.
The final number of extracurricular activities (NEA) score considered only key activities.
Students from private high schools participated in more activities than students from public and
subsidized high schools (mean of 2.6 participation versus 2.0 and 2.1 respectively) and also
reported having, on average, more activities available to them than students from public or
subsidized high schools (mean of 13.2 available activities versus 9.7 and 8.5 respectively). In the
final NEA score we considered the number of key activities of each individual student and in the
case of students attending private and subsidized high schools we multiplied the number of
activities by the ratio of the average number of activities available at municipal high schools and
the average number of activities available at their type of high school. This adjustment to the
number of activities students reported aimed to control for differences in the opportunities
available to them.
Most students reported participating in sports (31%) and academic activities (17%). They
reported doing extracurricular activities because of their motivation to pursue academic
development (22%), personal development (21%), social development (18%), or other types of
motivation (38%).16 Students received points based on the number of different key motivations
reported, or diversity of motivations (DIM). Key motivations were the desire to pursue personal,
academic, and social development. If all activities were driven by one type of motivation (e.g.,
motivation for personal development), they received one point; if they reported two types of
17
motivations (e.g., motivation for personal and academic development), they got two points; and
if they reported three types of motivations (e.g., motivation for personal, academic, and social
development), they received three points.
Students also had to report the number of years they participated in each activity (YEA)
and got an extra point if they persevered in one activity for more than a year or attended short
type of activity more than once (PER).
Only a small proportion of students not reporting participation in extracurricular activities
mentioned context issues (i.e., variables out of their control) as the reason why they could not
take part in activities, and the proportion does not change significantly by high school type (20
out of 100 in public high schools versus 8 out of 54 in private high schools).
Students could report a maximum of three awards, but on average, each student reported
one award. Close to 80% of the awards were academic or sports related, and almost 75% of the
awards were given by high schools, particularly private high schools (42%). Scores were
assigned based on the highest level of award reported (e.g., whether the award was a high
school–level award, a municipal award, a regional award, or a national or international award)
and not based on the number of awards (maximum award level [MAL]). Students who received a
high school-level award received a 1, those who received an interschool award received a 2,
those who received an intermunicipal or regional award received a 3. National and international
awards were less frequent, and both received a 4.
About half of the students taking part in the study reported having had a leadership role
during high school (48.9%). Of those, 42% described activities including the guidance or
monitoring of one or more people, all of them oriented to the same task (the most basic level of
leadership assessed), and 12% described more complex levels of leadership.17 In the leadership
type (LT) score, basic levels of leadership received a 1 and more complex leadership types
received a 2. The effectiveness of the leadership role (LE) was also assessed using a range from
0 to 2 based on the completion of goals reported by the students. The final score of the extended
biodata application form was calculated according to the following formula (see Table 5 for
variable names). A committee of university authorities decided the weights of each item based
on the relative importance of each subdimension.
EBAF = NEA + DIM + 0.75 * YEA + PER + MAL + 1.5 * LT + 0.5 * LE

18
Personal reflection essay. Examinees had difficulties providing evidence supporting
their statements on the personal reflection essay. The performance was better in the items that
appeared first on the instruction page (e.g., perseverance and effort) and poorer on the items that
came last (e.g., learning from experience); one hypothesis that we will investigate in the future is
whether order or content was responsible for this. An exploratory factor analysis suggested a
one-factor solution (see Appendix B). The final score was defined to be a simple average of all
dimensions.
Likert scale self-ratings. Most students performed well in the three Likert scale self-
ratings. The proactivity self-rating showed an especially small standard deviation.
Reliabilities. Internal consistency indices (Cronbach’s alpha, rxx’) were as follows:
critical thinking essay (rxx’ = .57), personal reflection essay (rxx’ = .80), Likert scale self-rating of
metacognitive abilities (rxx’ = .83), social abilities (rxx’ = .76), and proactivity (rxx’ = .66).
Table 6 shows the interrater agreement for the final instrument score by type of
instrument and wave of data collection. Recall that several dimensions were established for each
instrument. Each dimension was rated separately. So, for example, for the critical thinking essay,
raters rated 10 dimensions, for the EBAF, two dimensions, and for the personal reflection essay,
five dimensions. The weighted average of the four ratings is what made up the final critical
thinking essay score from that rater. Therefore, raters could differ from each other in the final
score by fractional value of up to 3 points in the critical thinking essay, 2 points in the average
score of leadership type and leadership effectiveness, and 2 points in the personal reflection
essay. It can be observed that more than 85% of the instruments double scored received total
scores with a difference of 0.5 or less. The only exception was the second scoring process of the
personal reflection essay, which was slightly lower.
Relationships Among Measures
This section presents the relationship of the pilot instruments with themselves and with
other variables of interest, namely the instruments currently used for admissions (PSU tests and
high school grades), a social desirability scale, and the teacher questionnaire.

19
Table 6
Interrater Agreement for New Measures
Wave of data collection Instrument Score
range
N double-scored
Difference of 0.5 points
or less in instrument final score
Difference of 1 points or less in
instrument final score
First Critical thinking essay (1, 4) 383 98% 100% (Catholic University)
Extended biodata application form (leadership type and effectiveness)
(0, 2) 116 98% 100%
Personal reflection essay (0, 2) 516 86% 99% Second Critical thinking essay (1, 4) 2,306 88% 99% (other high schools and colleges)
Extended biodata application form (leadership type and effectiveness)
(0, 2) 489 96% 99%
Personal reflection essay (0, 2) 2,424 77% 98%
Note. All critical thinking essays and personal reflections essays were double scored; the
discrepancies in N between the critical thinking and personal reflection essays were due to
missing cases in one or the other. Only 20% of the extended biodata application form was double
scored by design. See the text for an explanation on how rater differences can be less than one.
Correlation Among New Instruments
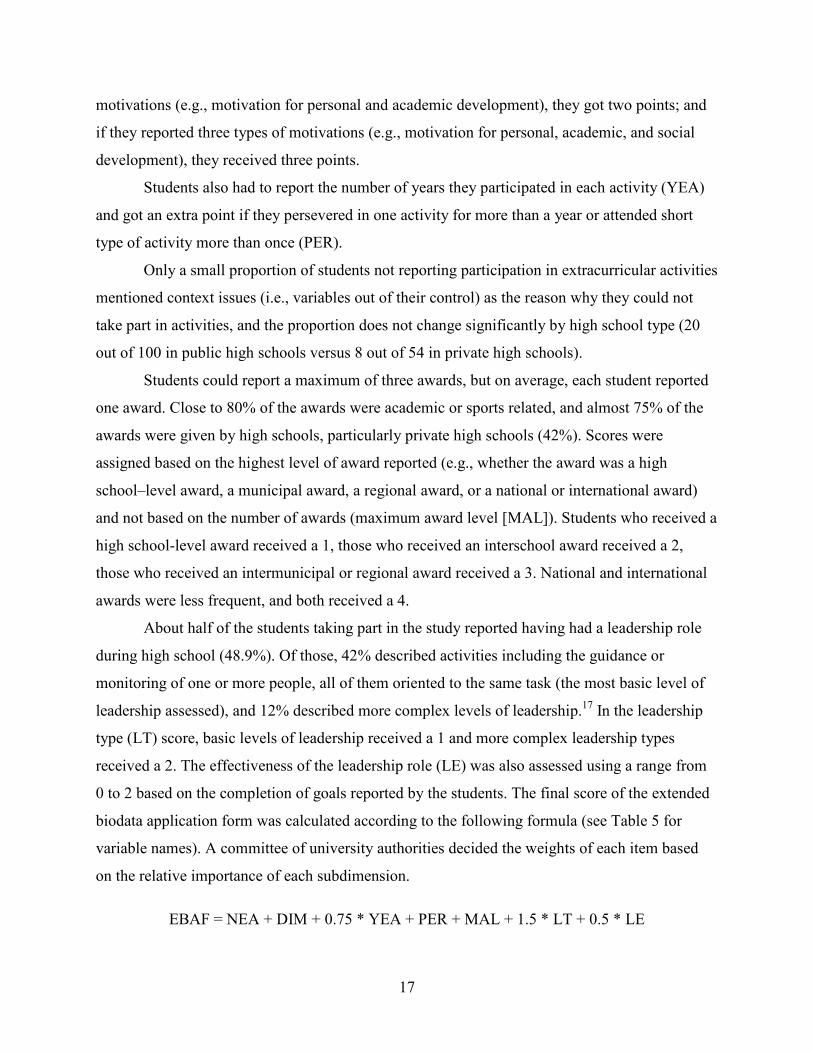
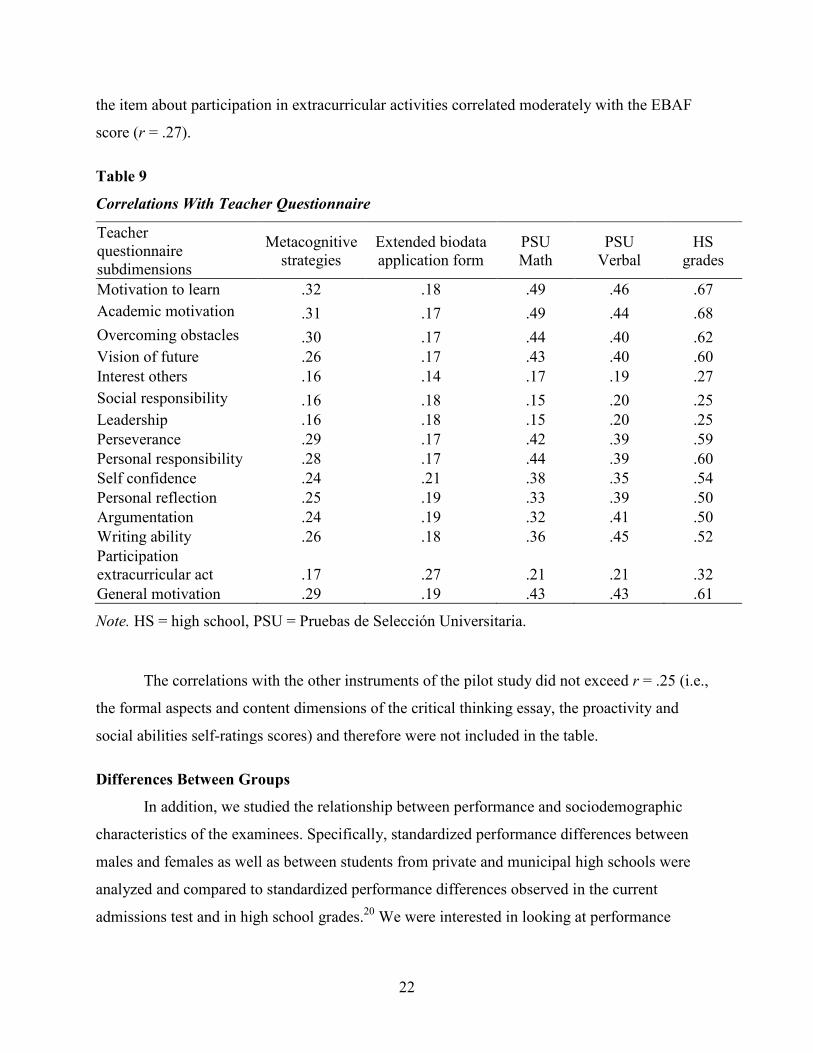
Table 7 shows low correlations among the critical thinking essay dimensions, the
personal reflection essay, and the extended biodata application form, which we interpret as
supporting the idea that the battery measured different attributes. The largest correlation is r =
.17 between the personal reflection essay and the content subsection of the critical thinking
essay. Except for that one example, and although they are statistically significant, most other
correlations do not exceed r = .10.
Larger correlations are observed among the scores in the Likert scale self-ratings, and
these persist after controlling for the score in the social desirability questionnaire.18 The
intercorrelations between the social abilities, proactivity, and metacognitive strategies self-
ratings range from r = .36 to r = .42. These results indicate some shared relationships among the
three Likert scale self-ratings.19
20
Table 7
Correlations Among New Instrument Scores
Instrument
Critical thinking content (CTC)
Critical thinking formal aspects (CTFA)
Extended biodata
application form
(EBAF)
Personal reflection
essay (PRE)
Metacognitive strategies
(MS)
Social abilities
(SA)
Proactivity (P)
CTC 1.00 CTFA .21 1.00 EBAF .10 .05 1.00 PRE .17 .05 .08 1.00 MS .12 .10 .16 .12 1.00 SA .02 .00 .16 .07 .42 1.00 P .05 .04 .11 .09 .36 .36 1.00
Relationship With Current Admissions Indicators
As Table 8 shows, the correlation between the new instruments and the current
admissions indicators is low, although most are statistically significant. The current math
standardized test correlates weakly with the dimensions of critical thinking, as do high school
grades. High school grades also correlate weakly with the score on the metacognitive strategies
self-rating. Somewhat stronger correlations are observed between the new instruments and the
verbal standardized test, especially with the two subdimensions of the critical thinking essay and
the EBAF but these correlations are still small in magnitude.
Relationship With Social Desirability Scale
The social desirability score is considered a measure of the degree to which the validity
of an instrument is threatened by socially desirable responding. As Table 8 shows, there are
moderate and statistically significant correlations between social desirability scores and the
social abilities, metacognitive abilities, and proactivity self-rating scores. The correlations of the
social desirability scale with the remaining instruments included in the study are below 0.10 and
most of them are nonsignificant at the 1% confidence level.
Relationship With Teacher Questionnaire
The average by-class correlation (Fisher’s z) was computed to analyze the relationship
between teachers’ ratings and students’ scores in the four types of instruments included in the
study, as well as among teachers’ ratings and standardized test scores and high school grades.

21
Table 8
Correlation With Current Admissions Instruments
Instruments PSU Matha PSU Verbala HS gradesa Social desirability scaleb
Critical thinking content .21 .28 .21 .01 Critical thinking formal aspects .21 .28 .22 .00 Extended biodata application form .16 .20 .18 .06 Personal reflection essay .08 .12 .03 .05 Social abilities self-rating -.05 .00 .00 .39 Metacognitive strategies self-rating .09 .17 .26 .33 Proactivity self-rating .00 .05 .08 .25
Note. HS = high school, PSU = Pruebas de Selección Universitaria. aN = 1,969 (for Personal Reflection), 2721 (for Application Form), and 2451 – 2480 (for the
others). b N = 2,005 (for Personal Reflection) and N = 2705 – 2733 (for the other measures).
Teachers who reported knowing students for less than six months or “very little” were excluded
from the analysis.
Overall, teachers assessed all their students very positively (less than 10% of students
were assessed as being “below the average” in each item), and therefore their scores
discriminated little among students. Results showed that the teachers’ ratings related closely to
students’ high school grades and standardized test scores, which is to be expected of senior class
home teachers who have limited interactions with students and know mostly about their
academic performance. In terms of the new instruments, correlations close to or above 0.3 were
observed between a teacher’s rating and students’ scores on the metacognitive strategies self-
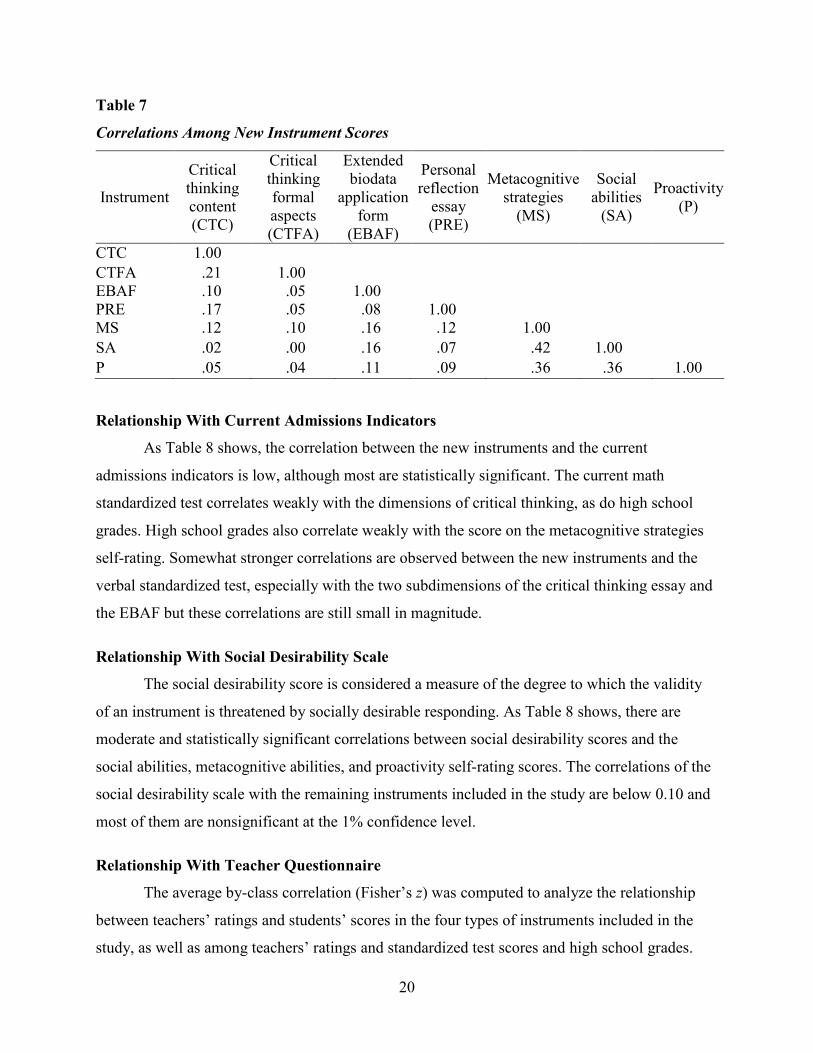
ratings and on the extended biodata application form (see Table 9).
The teacher questionnaire showed two factors (see Appendix E). The first one, which we
called “academic” because of its higher correlation with standardized scores and high school
grades, included the following items: motivation to learn, academic motivation, overcoming
obstacles, vision of future, perseverance, personal responsibility, self confidence, personal
reflection, argumentation, and writing ability. The second factor was named “social interest and
motivation” and included the following items from the teacher questionnaire: interest in others,
social responsibility, leadership, and participation in extracurricular activities. While the
academic factor exhibited correlations of around r = .30 with the metacognitive strategies score,
22
the item about participation in extracurricular activities correlated moderately with the EBAF
score (r = .27).
Table 9
Correlations With Teacher Questionnaire
Teacher questionnaire subdimensions
Metacognitive strategies
Extended biodata application form
PSU Math
PSU Verbal
HS grades
Motivation to learn .32 .18 .49 .46 .67 Academic motivation .31 .17 .49 .44 .68 Overcoming obstacles .30 .17 .44 .40 .62 Vision of future .26 .17 .43 .40 .60 Interest others .16 .14 .17 .19 .27 Social responsibility .16 .18 .15 .20 .25 Leadership .16 .18 .15 .20 .25 Perseverance .29 .17 .42 .39 .59 Personal responsibility .28 .17 .44 .39 .60 Self confidence .24 .21 .38 .35 .54 Personal reflection .25 .19 .33 .39 .50 Argumentation .24 .19 .32 .41 .50 Writing ability .26 .18 .36 .45 .52 Participation extracurricular act .17 .27 .21 .21 .32 General motivation .29 .19 .43 .43 .61
Note. HS = high school, PSU = Pruebas de Selección Universitaria.
The correlations with the other instruments of the pilot study did not exceed r = .25 (i.e.,
the formal aspects and content dimensions of the critical thinking essay, the proactivity and
social abilities self-ratings scores) and therefore were not included in the table.
Differences Between Groups
In addition, we studied the relationship between performance and sociodemographic
characteristics of the examinees. Specifically, standardized performance differences between
males and females as well as between students from private and municipal high schools were
analyzed and compared to standardized performance differences observed in the current
admissions test and in high school grades.20 We were interested in looking at performance

23
differences between students from different high school types as a way to examine differences
between students from different socioeconomic groups.
Table 10 shows that the students from private high schools performed better than students
from municipal high schools in both subdimensions of the critical thinking test (especially in the
content subdimension) as well as in the EBAF. In both cases, however, differences are between
30% and 50% of the differences observed in the current cognitive tests and high school grades.
The difference in the formal aspects subdimension of the critical thinking test is not statistically
significant. It is interesting to note that the difference in favor of students from municipal high
schools, both in the personal reflection essay and in the metacognitive strategies self-rating
scores, is statistically significant.
Table 11 shows that all instruments piloted in this study favored women over men, with
the largest and statistically significant differences observed in the Likert scale self-ratings.
Women outperformed men in the social abilities and metacognitive strategies self-ratings by
between 26% to 41% of a standard deviation.
Table 10
Score Differences on New Measures by High School Type
Variable N private
N municipal
Mean private
Mean municipal
Mean difference (private-
municipal)
t value
Critical thinking content 799 909 .20 -.06 .26 5.35* Critical thinking formal aspects 799 909 .09 .07 .02 .51 Application form 957 1,016 .15 -.18 .33 7.78* Personal reflection 694 710 -.04 .19 -.23 -4.17* Metacognitive strategies 830 971 -.09 .07 -.16 -3.45* Social abilities 830 972 .00 .02 -.02 -.39 Proactivity 829 969 -.06 -.02 -.05 -.94 PSU Math 955 987 .56 -.25 .82 20.10 PSU Verbal 955 988 .43 -.16 .59 13.86 HS grades 955 987 .28 -.30 .57 13.52
Note. PSU = Pruebas de Selección Universitaria.
*p < .01.

24
Table 11
Male and Female Score Differences on New Measures
Variable N males
N females
Mean males
Mean female
Mean difference
(male-female) t value
Critical thinking content 1,315 1,241 -.02 .02 -.05 -1.19 Critical thinking formal aspects 1,315 1,241 -.02 .02 -.03 -0.86 Application form 1,542 1,418 -.03 .03 -.05 -1.44 Personal reflection 1,000 1,097 -.04 .04 -.08 -1.78 Metacognitive strategies 1,418 1,286 -.19 .21 -.41 -10.85* Proactivity 1,416 1,283 -.07 .07 -.14 -3.63* Social abilities 1,421 1,286 -.13 .14 -.26 -6.93* PSU Math 1,491 1,371 .20 -.21 .41 11.32* PSU Verbal 1,491 1,372 .07 -.07 .14 3.71* HS grades 1,490 1,371 -.08 .08 -.16 -4.32*
Note. PSU = Pruebas de Selección Universitaria.
*p < .01.
Discussion
The purpose of this study was to evaluate the potential usefulness of a set of new
measures for use in helping the admissions decision process. Based on prior research, along with
meetings involving stakeholders from Chilean universities, attention was focused on a set of new
constructs, such as critical thinking, motivation, metacognition, social abilities, and others. Also,
a set of instruments designed to measure these new constructs was developed and administered
to students from four major Chilean universities and several high schools, representing a broad
range of academic and sociodemographic backgrounds. The validity of the new measures was
examined by correlating them with the traditional admissions measures (PSU standardized test
scores and grades), with a social desirability scale, and with teacher ratings along 10 scales,
including motivation to learn, overcoming obstacles, and perseverance.
The results suggest that the four types of instruments piloted in the study—the critical
thinking essay; the EBAF; the personal reflection essay; and the social ability, metacognition,
and the proactivity self-ratings—are measuring different constructs and that these constructs are
different from the ones measured by the admissions instruments currently in place. There is some
moderate relationship among the three standardized questionnaires, which does not seem to be
related to social desirability or to the fact that they are all in a multiple-choice format.

25
Results also suggest a moderate relationship among the verbal standardized test and the
critical thinking essay, the personal reflection essay, and the extended biodata application form.
Because two of these new instruments are essays and the other one includes open-ended
questions, this result is not surprising. Verbal ability, reading, and writing are important skills
that will correlate with most self-assessments. In this case, the correlation is only moderate and
the inclusion of this new instrument is further justified because the current Verbal admissions
test is a multiple-choice test with no constructed responses (Sincoff & Sternberg, 1987). There
may also be a moderate incremental prediction of college grades associated to the critical
thinking essay as found by Mattern, Kobrin, Patterson, Shaw, and Camara (2009) when
investigating the validity of the SAT® writing section.
The assessment of high school seniors’ home teachers was not expected to be a perfect
outcome measure, but instead it was designed to serve as a preliminary proxy to better measures
that could be obtained in a longitudinal study (e.g., attrition from college, college grades). The
fact that there is a moderate correlation between the teachers’ assessment of participation in
extracurricular activities and the students’ scores on the EBAF provides support to the validity of
the new predictor measures. Furthermore, the correlations observed are in line with the results
reported by Oswald et al. (2004) between peer ratings and biodata measures.
Among the new instruments, the critical thinking test and the EBAF showed the largest
performance differences between low and high socioeconomic status (SES) students; these
differences however are between one third and one half of the differences observed in the
current admissions instruments. The personal reflection essay, on the other hand, showed the
most positive results in terms of favoring students with low socioeconomic status. Although we
see these as positive results, it is important to remember that participation in the study had no
consequences on students. Once stakes are associated to the new tests, it is likely that
preparation will increase and differences between sociodemographic groups will grow. Results
from experiences in other countries (Cliffordson & Askling, 2006; Kyllonen, 2005; Oswald et
al., 2004), however, suggested that the performance differences between groups on
noncognitive instruments, such as the personal reflection essay and the EBAF, will not be as
large as differences observed in cognitive assessments such as the ones used for admissions
today in Chile.
26
Most instruments showed reliability coefficients at acceptable levels. The critical
thinking essay was the most important exception, showing the lowest Cronbach Alpha
(rxx’ = .57). Reliability results did not improve when they were calculated separately for the two
dimensions (rxx’ = .58 for content; rxx’ = .51 for the formal aspect). We hypothesize that the
limited number of items per section of the critical thinking essay (six in content and four in
formal aspects) may have reduced the reliability. The reduced number of tasks sampled (i.e., one
essay) is also a candidate source of low reliability (Breeland, Bridgeman, & Fowles, 1999).
All instruments and scoring guides will be reviewed based on the results from the 2009
data collection. The low performance of students in the personal reflection essay suggests that
the language and order in which instructions were provided for this instrument should be closely
reviewed. In addition, the relatively lower agreement rate observed among scorers for this
instrument indicates that raters need clearer scoring guidelines, more precise instructions, or
tighter supervision. The interrater agreement observed in the other two scored instruments (the
critical thinking essay and EBAF) is similar to that found in other studies (Blattner, 2002).
Conclusions
This paper describes the development and validation process of new instruments to
measure attributes that could complement the standardized cognitive test currently used to make
undergraduate admissions decisions in Chile. Specifically, results from this research could affect
the decision-making process at four universities, which are now considering the potential use of
these instruments.
These self-assessments, biographical data measure, and essays were developed with the
goal of measuring motivation to pursue personal, civic and academic development, and critical
thinking. These attributes were deemed relevant by a panel of university authorities, faculty,
and student representatives who met during 2007 and prioritized the characteristics of interest
in an applicant.
Preliminary results from the first year of study are promising. The newly developed
instruments measured attributes that complement the indicators currently used for undergraduate
admissions. Reliability estimates, both internal consistency and interrater agreement, varied
depending on the instrument but, overall, were acceptable. Factor analyses confirmed the
theoretical structure of the critical thinking essay and the personal reflection essay. In addition,
27
the new instruments showed significantly less adverse impact against females and students from
low socioeconomic backgrounds than the instrument used in the current admissions system.
It is not clear how generalizable these results are considering that no consequences were
associated with student results based on the instruments. Once stakes are associated, some of
these instruments will be susceptible to coaching and faking. As a way to deter students from
faking, a random verification process should be considered for the information provided in the
EBAF. There could be sanctions (e.g., admissions cancellation) for admitted students who are
not able to demonstrate participation in a claimed activity or to provide evidence they received
an award listed. The effects of coaching on the scores of the critical thinking essay and personal
reflection essay would have to be carefully monitored. There may be, however, some educational
benefits associated with test preparation if it does translate into better writing abilities of students
applying to college (Schmidt, Walker, & Camara, 2007).
The results presented in this paper will be complemented with information regarding the
capacity of the new instruments to predict academic and nonacademic success. These data are
being collected through a telephone survey and will be completed with administrative records
including students’ grades and persistence in college. In addition, information about students’
motivations, self-efficacy, perseverance, and leadership skills, among others, was obtained from
a third-party through another phone survey for the college student sample. This information will
be used to triangulate students’ self-reports in the same way the teacher questionnaire was used
in the high school sample.
We expect that the development of these new instruments, and their future use in
admissions, will neutralize some of the known advantages given by traditional academic
indicators to students coming from higher socioeconomic backgrounds (see, for example,
Sackett, Schmitt, Ellingson, & Kabin, 2001). In addition, it will send a clear signal to high
schools regarding the attributes that they should help develop, thereby expanding the high school
senior year curriculum that currently focuses on the preparation for the standardized admissions
test. The development of the instruments described in this paper provides the opportunity to
consider the multiple dimensions of student attributes that are relevant for achieving collegiate
and professional success. The results presented here should also inform similar efforts taking
place in other parts of the world.

28
References
Baird, L. (1979). Development of an inventory of documented accomplishments for graduate
admissions (GRE Board Report No. GREB-77-3R). Princeton, NJ: ETS.
Blattner, N. H. (2002). Developing a performance-based assessment of students’ critical thinking
skills. Assessing Writing, 8, 47–64.
Breland, H., Bridgeman, B., & Fowles, M. (1999). Writing assessment in admission to higher
education: Review and framework (College Board Research Report No. 99-3). New York,
NY: College Board.
Breland, H., Maxey, J., Gernand, R., Cumming, T., & Trapani, C. (2001). Trends in college
admission 2000: A report of a national survey of undergraduate admissions policies,
practices, and procedures. Retrieved from http://www.semworks.net/about-
us/resources/docs/trends_in_college_admission.pdf
Brunner, J. J., & Uribe, D. (2007). Mercados universitarios: Los nuevos escenarios de la
educación superior. Informe (Final Proyecto Fondecyt No. 1050138). [University markets:
The new reality of higher education (Final Report of Project #1050138)]. Santiago, Chile:
Universidad Diego Portales.
Camara, W. J. (2005). Broadening criteria of college success and the impact of cognitive
predictors. In W. J. Camara & E. W. Kimmel (Eds.), Choosing students: Higher education
admissions tools for the 21st century. Mahwah, NJ: Lawrence Erlbaum Associates.
Cliffordson, C., & Askling, B. (2006). Different grounds for admission: Its effects on recruitment
and achievement in medical education. Scandinavian Journal of Educational Research, 50,
45–62.
College Board. (2002). Best practices in admissions decisions. A report on the third College Board
conference on admission models. New York, NY: Author.
Condon, W., & Kelly-Riley, D. (2004). Assessing and teaching what we value: The relationship
between college-level writing and critical thinking abilities. Assessing Writing, 9, 56–75.
Frebort, M., Kubinger, K. (2007, May). The Viennese self-assessment for measuring psychology
study’s aptitude requirements – Computerized experiment-based behavior assessments. In
H. Moosbrugger & E. Jonkisz (Symposium organizers), Assessing predictors of academic
achievement. Symposium conducted at the ninth European conference on psychological
assessment (European Association of Psychological Assessment), Thessaloniki, Greece.

29
Geiser, S., & Santelices, M. V. (2007). Validity of high-school grades in predicting student success
beyond the freshman year: High-school record vs. standardized tests as indicators of four-
year college outcomes (CSHE Research and Occasional Paper Series: CSHE.6.07).
Berkeley, CA: Center for Studies in Higher Education.
Harris, D. J., Colton, D. A., Gao, X., & Crouse, J. D. (2007, March). Technical characteristics of
the ACT writing test. Paper presented at the annual meeting of the National Council of
Measurement in Education, Chicago, IL.Hedlund, J., Wilt, J. M., Nebel, K., Ashford, S. E.,
& Sternberg, R. J. (2006). Assessing practical intelligence in business school admissions: A
supplement to the Graduate Management Admissions Test. Learning and Individual
Differences, 16, 101–127.
Hornke, L. F. (2007). Self-assessment as a means to inform graduates about their individual
strengths and orientations. In H. Moosbrugger & E. Jonkisz (Symposium organizers),
Assessing predictors of academic achievement. Symposium conducted at the ninth
European conference on psychological assessment (European Association of Psychological
Assessment), Thessaloniki, Greece.
Jonkisz, E., & Moosbrugger, H. (2007). Self- assessment as an integral part of student selection
process. In H. Moosbrugger & E. Jonkisz (Symposium organizers), Assessing predictors of
academic achievement. Symposium conducted at the ninth European conference on
psychological assessment (European Association of Psychological Assessment),
Thessaloniki, Greece.
Kubinger, K., Moosbrugger, H., Frebort, M., Jonkisz, E. (2007). Psychological reasons for using
self-assessment at limited university admissions. In H. Moosbrugger & E. Jonkisz
(Symposium organizers), Assessing predictors of academic achievement. Symposium
conducted at the Ninth European Conference on Psychological Assessment (European
Association of Psychological Assessment), Thessaloniki, Greece.
Kyllonen, P.C. (2005). The case for noncognitive assessments (R&D Connections No. 4).
Princeton, NJ: ETS.
Kyllonen, P. C. (2007, April). The faking problem in noncognitive assessment. Paper presented at
the American Psychological Association Annual Convention, San Francisco, CA.
Kyllonen, P. C. (2008). The research behind the ETS Personal Potential Index. Retrieved from the
ETS website: http://www.ets.org/Media/Products/PPI/10411_PPI_bkgrd_report_RD4.pdf

30
Kyllonen, P. C., Lipnevich, A. A., Burrus, J., & Roberts, R. D. (2009). Personality, motivation,
and college readiness: A prospectus for assessment and development. Manuscript in
preparation.
Kyllonen, P. C., Walters, A. M., & Kaufman, J. C. (2005). Noncognitive constructs and their
assessment in graduate education. Educational Assessment, 10, 153–184.
Le, H., Casillas, A., Robbins, S. B., & Langley, R. (2005). Motivational and skills, social, and
self-management predictors of college outcomes: Constructing the student readiness
inventory. Educational and Psychological Measurement, 65, 482–508.
Lengenfelder, P., Baumann, U., Nürk, H.-C., & Allesch, C. (2007). The Salzburg approach of
student selection for psychology – First results of predictive validity. In H. Moosbrugger
& E. Jonkisz (Symposium organizers), Assessing predictors of academic achievement.
Symposium conducted at the Ninth European Conference on Psychological Assessment
(European Association of Psychological Assessment), Thessaloniki, Greece.
Liu, L., Minsky, J., Ling, G., & Kyllonen, P. (2009). Using the standardized letter of
recommendation in admissions: Results from a multidimensional Rasch Model.
Educational and Psychological Measurement, 69, 475–492.
Manzi, J., & Flotts, P. (2006). Examen de comunicación escrita. Informe general de resultados
[Writing ability test. Report of general results]. Santiago, Chile: Centro de Medicion UC
[Measurement Center Catholic University].
Mattern, K., Kobrin, J., Patterson, B., Shaw, E., & Camara, W. (2009). Validity is in the eye of
the beholder. Conveying SAT research findings to the general public. In R. Lissitz (Ed.),
The concept of validity. Revisions, new directions & applications. Washington, DC:
Information Age Publishing.
Ministerio de Educacion [Ministry of Education]. (2011). Data file retrieved from
http://ded.mineduc.cl/DedPublico/anuarios_estadisticos
Oswald, F. L., Schmitt, N., Kim, B. H., Gillespie, M. A., & Ramsay, L. J. (2004). Developing a
biodata measure and situational judgment inventory as predictors of college student
performance. Journal of Applied Psychology, 89, 187–207.
Perfetto, G. (1999). Toward taxonomy of the admissions decision-making process: A public
document based on the first and second College Board conferences on Admissions Models.
New York, NY: College Board.
31
Pontificia Universidad Catolica de Chile. (2010). Comparative study of Potificia Universidad
Catolica de Chile and other CRUCH institutions. Unpublished manuscript.
Rigol, G. W. (2003). Admissions-making model. How US institutions of higher education select
undergraduate students. New York, NY: College Board.
Robbins, S. B., Allen, J., & Sawyer, R. (2007, April). Do psychosocial factors have a role in
promoting college success? Paper presented at the annual conference of the National Council
on Measurement in Education, Chicago, IL.
Sackett, P. R., Schmitt, N., Ellingson, J. E., & Kabin, M. B. (2001). High-stakes testing in
employment, credentialing, and higher education: Prospects in a post-affirmative-action
world. American Psychologist, 56, 302–318.
Schmidt, A. E., Walker, M., & Camara, W. (2007, March). Technical characteristics of the writing
section of the SAT Reasoning Test. Paper presented at the annual conference of the National
Council on Measurement in Education, Chicago, IL.
Sincoff, J. B., & Sternberg, R. J. (1987). Two faces of verbal ability. Intelligence, 11, 263–405.
Shultz, M. M., & Zedeck, S. (2008). Identification, development, and validation of predictors for
successful lawyering. Retrieved from the University of California website:
http://www.law.berkeley.edu/files/LSACREPORTfinal-12.pdf
Sternberg, R. J. (1999). A triarchic approach to the understanding and assessment of intelligence in
multicultural populations. Journal of School Psychology, 37(2), 145–159.
Sternberg, R. J. (2003). Our research program validating the triarchic theory of successful
intelligence: Reply to Gotfredson. Intelligence, 31, 399–413.
Sternberg, R. J. (2009). Intelligence, creativity, and wisdom: Assessments of abilities for the 21st
century. Retrieved from
http://www.wfu.edu/provost/rethinkingadmissions/docs/presenters/sternberg.pdf
Sternberg, R. J., & the Rainbow Project Collaborators. (2006). The Rainbow Project: Enhancing the
SAT through assessments of analytical, practical, and creative skills. Intelligence, 34(4),
321–350.
Willingham, W.W. (1985). Success in college. The role of personal qualities and academic ability.
New York, NY: College Board.
Zwick, R., & Grief Greene, J. (2007). New perspectives on the correlation of SAT scores, high
school grades and socioeconomic factors. Journal of Educational Measurement, 44, 23–45.
32
Notes 1 Corresponding author ([email protected]) and principal investigator. We would like to thank
Patricia Thibaut, Paula Lacerna, and Angelica Bosch for their research assistance.
2 Chief Officer of the Higher Education Division, Ministry of Education of Chile, former Vice
President for Academic Affairs, Pontificia Universidad Católica de Chile.
3 Research and Development Manager at the Pontificia Universidad Católica de Chile
Measurement Center (MIDE UC).
4 Former Project Coordinator at the Pontificia Universidad Católica de Chile Measurement
Center (MIDE UC).
5 Director of ETS Center for New Constructs.
6 The test development and administration are centralized and national processes are delegated
by CRUCH to the University of Chile, one of the member universities.
7 The applicant profile included the following characteristics: (a) persistence/overcoming
challenges/resilience, (b) personal development/reflexivity of students, (c) tolerance, (d)
creativity, (e) motivation, (f) solidarity, (g) knowledgeable of area of interest, and (h) match
to institution’s mission.
8 A random verification process was conducted as part of this research, and it is also considered
an integral part of the operational implementation of these measures. The implementation of
the “warning method” has been successful in earlier research experiences such as a
documented accomplishments scale (Kyllonen, Walters, & Kaufman, 2005).
9 It is important to keep in mind that the academic year in Chile starts in March and ends in
December.
10 The original plan was to collect college information in April and May of 2008, but school and
university protests taking place at the national level because of legal and financial issues made
that impossible.
11 In 2010, Catholic University accepted 34% of valid applicants; University of Concepcion,
33%; University Federico Santa Maria, 38%; and University of Santiago, 28% (Pontificia
Universidad Católica de Chile, 2010).

33
12 In addition, students from the Catholic University PENTA program and from three
underperforming municipal schools, with which the University of Santiago works closely,
were invited to participate. The PENTA program is designed to support the teaching and
learning of especially talented students from deprived backgrounds during secondary school.
It is similar to an academic outreach program.
13 Although the Chilean Ministry of Education sets the pedagogical guidelines and defines and
provides the resources for the country’s schools, the municipality authorities manage public
schools locally. Private stakeholders (either individuals or private institutions) manage both
private subsidized and private nonsubsidized schools. In 2009, there were approximately
12,100 schools operating in the system, 48% of which were municipal schools, 46% private
subsidized schools, and 6% private nonsubsidized schools (Ministerio de Educacion, 2011).
Approximately 42% of the school-age students attend municipal schools, 50% attend private-
subsidized schools, and only 7% attend private schools. Students from a lower socioeconomic
background attend public schools, while children from better-off families attend private
schools (Ministerio de Educacion, 2011).
14 This selection was made based on the analyses of three years of data (2004–2007) and
considering a distance of 10 and 20 positions both above and below the cut-off score. PSU
Math and Verbal scores range from 200 to 850. A total of 243,575 students took the PSU
Verbal test in 2009. A total of 242,438 students took the PSU Math test in 2009. For each test,
the mean score is scaled to be 500 points and the standard deviation is 110 points.
15 Originally we had planned to score the entire college sample in June and the entire high school
student sample in October. However, only Catholic University students had been tested by the
time of the first scoring time point.
16 Thirty-one percent of these students reported doing activities “to have fun.”
17 These more complex levels of leadership include coordinating people working on different
tasks, decision making responsibilities, the supervision and assessment of others’ work,
and/or representing the opinions or interests of a group.
18 The partial correlations controlling for social desirability scores are shown in Appendix C.

34
19 We explored the hypothesis that this redundancy could be due to the fact that the three
instruments were in multiple-choice format, but we did not find supporting evidence (see
Appendix D).
20 These analyses were also conducted standardizing the performance of students in each sample
separately (college sample and high school sample) and the results were similar.

35
List of Appendices
Page
A. Factor Analysis of Critical Thinking Essay ................................................................. 36
B. Factor Analysis of the Personal Reflection Instrument................................................ 38
C. Pearson Partial Correlation Coefficients Among Standardized Questionnaires
Controlling for Social Desirability ............................................................................... 40
D. Factor Analysis of All Likert Scale Self-Ratings’ Items Combined ............................ 41
E. Factor Analysis of Teacher Survey .............................................................................. 43
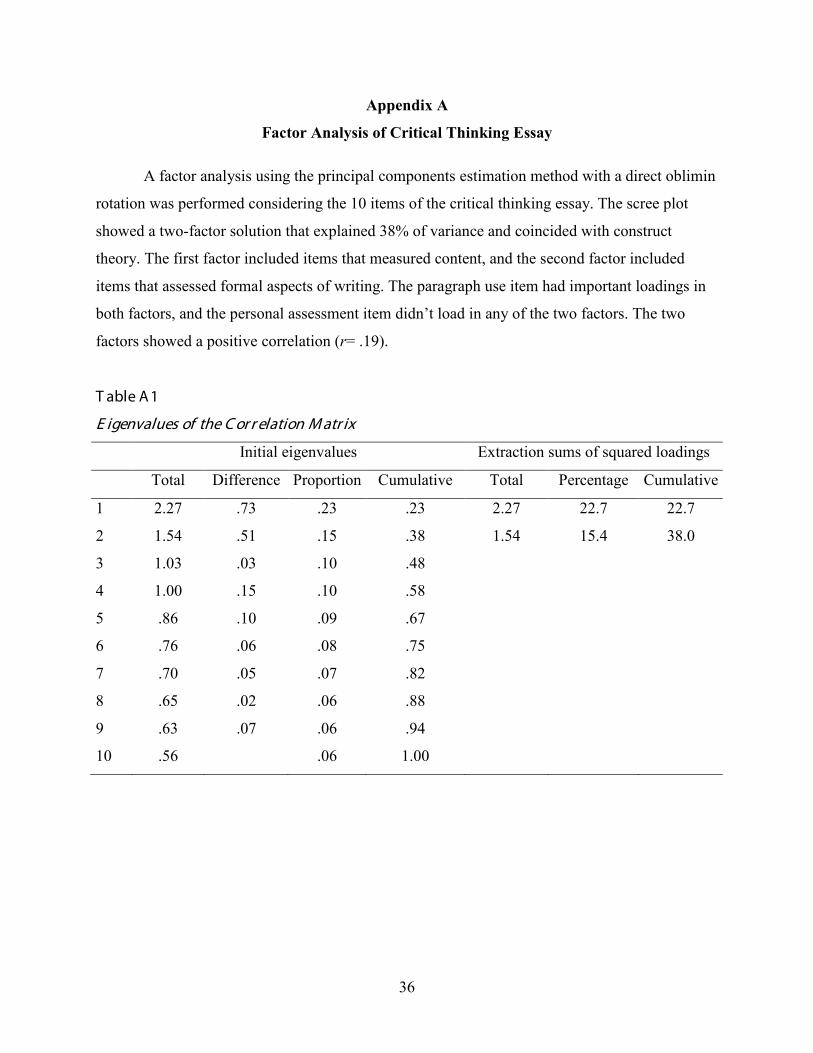
36
Appendix A
Factor Analysis of Critical Thinking Essay
A factor analysis using the principal components estimation method with a direct oblimin
rotation was performed considering the 10 items of the critical thinking essay. The scree plot
showed a two-factor solution that explained 38% of variance and coincided with construct
theory. The first factor included items that measured content, and the second factor included
items that assessed formal aspects of writing. The paragraph use item had important loadings in
both factors, and the personal assessment item didn’t load in any of the two factors. The two
factors showed a positive correlation (r= .19).
T able A 1
E igenvalues of the C or r elation M atr ix
Initial eigenvalues Extraction sums of squared loadings
Total Difference Proportion Cumulative Total Percentage Cumulative
1 2.27 .73 .23 .23 2.27 22.7 22.7
2 1.54 .51 .15 .38 1.54 15.4 38.0
3 1.03 .03 .10 .48
4 1.00 .15 .10 .58
5 .86 .10 .09 .67
6 .76 .06 .08 .75
7 .70 .05 .07 .82
8 .65 .02 .06 .88
9 .63 .07 .06 .94
10 .56 .06 1.00
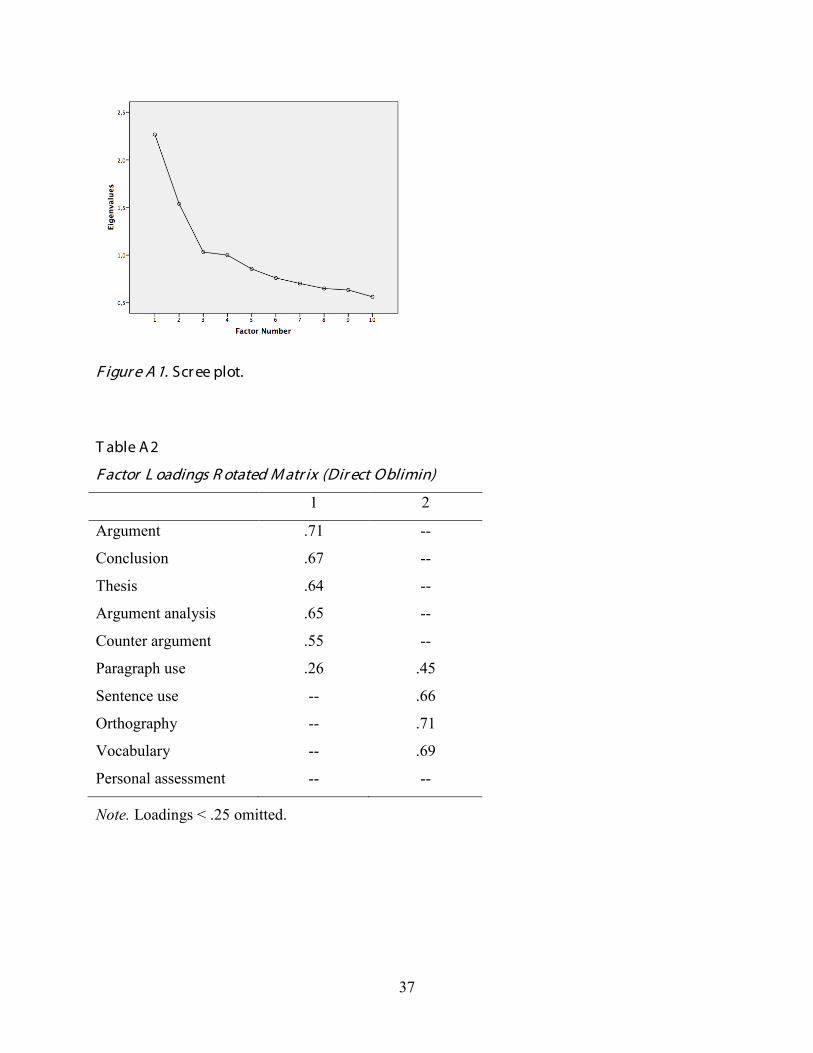
37
F igur e A 1. Scr ee plot.
T able A 2
F actor L oadings R otated M atr ix (Dir ect Oblimin)
1 2
Argument .71 --
Conclusion .67 --
Thesis .64 --
Argument analysis .65 --
Counter argument .55 --
Paragraph use .26 .45
Sentence use -- .66
Orthography -- .71
Vocabulary -- .69
Personal assessment -- --
Note. Loadings < .25 omitted.

38
Appendix B
Factor Analysis of the Personal Reflection Instrument
A factor analysis using the principal components estimation method with a direct oblimin
rotation was performed considering the five items of the personal reflection essay. The solution
showed a one-factor solution (eigenvalues greater than one and scree plot). This one factor
explained 55% of the variance, and all the items showed factor loadings greater than 0.30. A
parallel analysis (95% confidence interval based on 200 replications) also supported the one-
factor solution.
T able B 1
E igenvalues of the C or r elation M atr ix
Initial eigenvalues Extraction sums of squared loadings
Total Difference Proportion Cumulative Total Percentage Cumulative
1 2.77 1.97 .55 .55 2.77 55.3 55.3
2 .80 .18 .16 .71
3 .62 .12 .12 .84
4 .50 .18 .09 .94
5 .32 .06 1.00

39
Figure B1. Scree plot.
T able B 2
F actor L oadings C omponent M atr ix
1
Meaning of difficulty .83
Perseverance .84
Self-efficacy .54
Locus of control .78
Experience .70
Note. Only personal reflection essays
in which students provided evidence
supporting their motivation for
personal, social, or academic
development were considered.

40
Appendix C
Pearson Partial Correlation Coefficients Among
Standardized Questionnaires Controlling for Social Desirability
Social abilities Metacognitive strategies Proactivity
Social abilities 1.00
Metacognitive strategies 0.34 1.00
Proactivity 0.30 0.30 1.00
Note. N = 2,696. Prob > |r| under H0: Partial rho = 0.
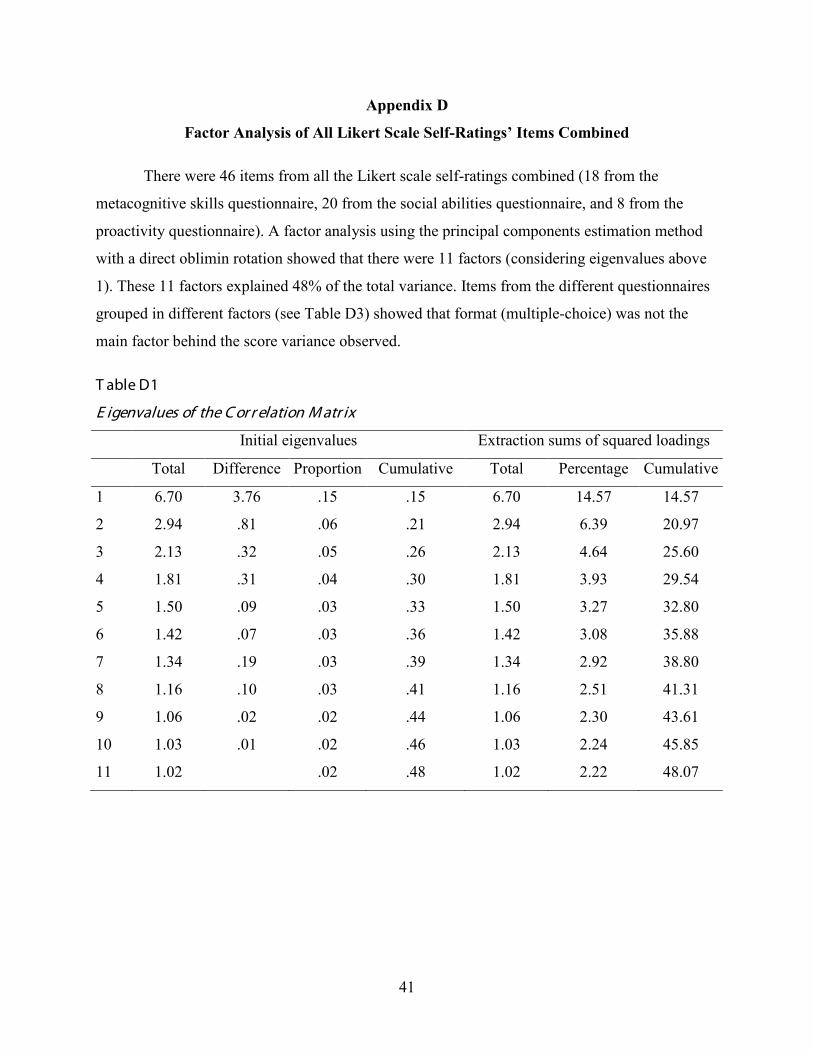
41
Appendix D
Factor Analysis of All Likert Scale Self-Ratings’ Items Combined
There were 46 items from all the Likert scale self-ratings combined (18 from the
metacognitive skills questionnaire, 20 from the social abilities questionnaire, and 8 from the
proactivity questionnaire). A factor analysis using the principal components estimation method
with a direct oblimin rotation showed that there were 11 factors (considering eigenvalues above
1). These 11 factors explained 48% of the total variance. Items from the different questionnaires
grouped in different factors (see Table D3) showed that format (multiple-choice) was not the
main factor behind the score variance observed.
T able D1
E igenvalues of the C or r elation M atr ix
Initial eigenvalues Extraction sums of squared loadings
Total Difference Proportion Cumulative Total Percentage Cumulative
1 6.70 3.76 .15 .15 6.70 14.57 14.57
2 2.94 .81 .06 .21 2.94 6.39 20.97
3 2.13 .32 .05 .26 2.13 4.64 25.60
4 1.81 .31 .04 .30 1.81 3.93 29.54
5 1.50 .09 .03 .33 1.50 3.27 32.80
6 1.42 .07 .03 .36 1.42 3.08 35.88
7 1.34 .19 .03 .39 1.34 2.92 38.80
8 1.16 .10 .03 .41 1.16 2.51 41.31
9 1.06 .02 .02 .44 1.06 2.30 43.61
10 1.03 .01 .02 .46 1.03 2.24 45.85
11 1.02 .02 .48 1.02 2.22 48.07
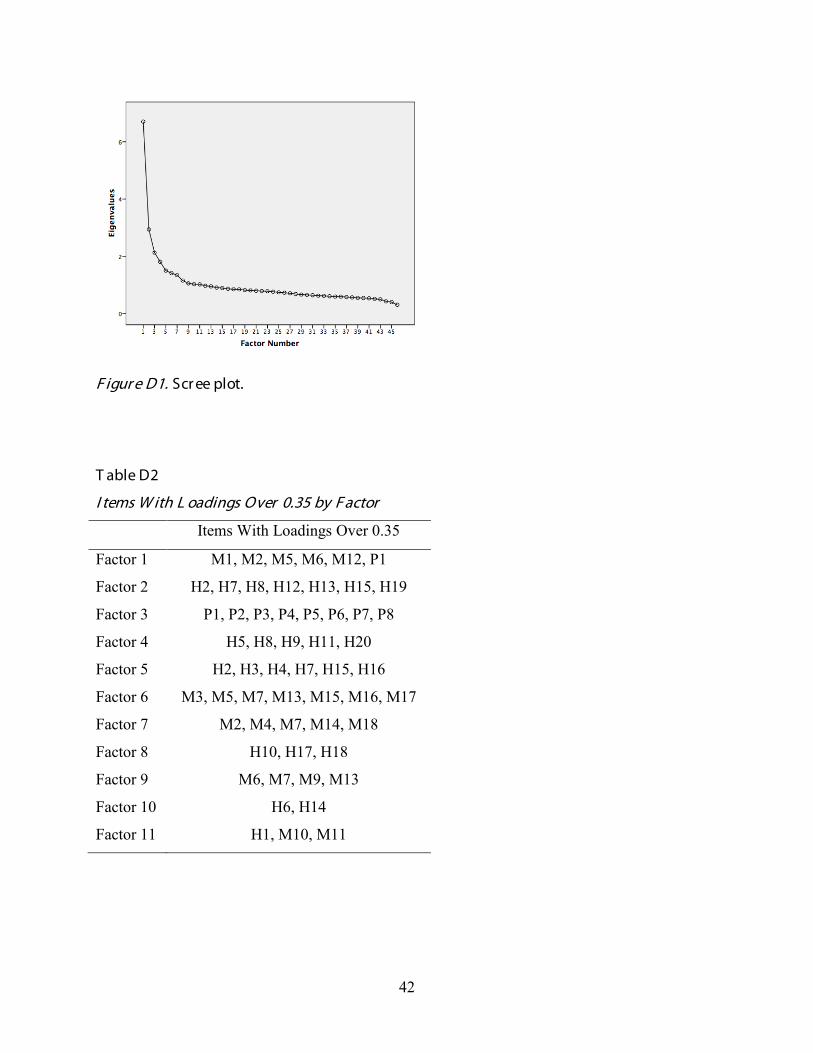
42
F igur e D1. Scr ee plot.
T able D2
I tems W ith L oadings Over 0.35 by F actor
Items With Loadings Over 0.35
Factor 1 M1, M2, M5, M6, M12, P1
Factor 2 H2, H7, H8, H12, H13, H15, H19
Factor 3 P1, P2, P3, P4, P5, P6, P7, P8
Factor 4 H5, H8, H9, H11, H20
Factor 5 H2, H3, H4, H7, H15, H16
Factor 6 M3, M5, M7, M13, M15, M16, M17
Factor 7 M2, M4, M7, M14, M18
Factor 8 H10, H17, H18
Factor 9 M6, M7, M9, M13
Factor 10 H6, H14
Factor 11 H1, M10, M11

43
Appendix E
Factor Analysis of Teacher Survey
Teacher surveys came from 82 classes in 21 high schools for a total of 1,517 students
(97% of high school sample). The information for 42 students was excluded because teachers did
not know their students well enough (less than one semester or “very little”). The final sample
had 1,475 cases and scores concentrated in the “average” and “above average” categories for
most items (close to 75% of the cases).
The factor analysis, using principal component analysis and direct oblimin rotation
method, was conducted considering the 14 items of the teacher survey. It showed a two-factor
solution (based on eigenvalues above one and on the scree plot) that explained 76% of the
overall variance. The first factor included items that measured “academic interest/performance”;
the second factor, “social interest and motivation.” The personal reflection and argumentation
items had important loadings in both factors. The two factors showed a high and positive
correlation between them (0.62).
T able E 1
E igenvalues of the C or r elation M atr ix
Initial eigenvalues Extraction sums of squared loadings Total Difference Proportion Cumulative Total Percentage Cumulative 1 9.18 7.69 0.66 0.66 9.18 65.6 65.6 2 1.49 0.84 0.11 0.76 1.49 10.7 76.3 3 0.65 0.08 0.05 0.81 4 0.57 0.18 0.04 0.85 5 0.39 0.07 0.03 0.88 6 0.32 0.06 0.02 0.90 7 0.26 0.02 0.02 0.92 8 0.25 0.01 0.02 0.94 9 0.24 0.04 0.02 0.95 10 0.19 0.02 0.01 0.97 11 0.18 0.03 0.01 0.98 12 0.14 0.02 0.01 0.99 13 0.12 0.12 0.01 1.00 14 0.00 0.00 1.00

44
F igur e E 1. Scr ee plot.
T able E 2
F actor L oadings R otated M atr ix (Dir ect Oblimin)
1 2
Motivation learn .89 --
Academic motivation .90 --
Overcoming obstacles .90 --
Vision of future .87 --
Interest others -- .88
Social responsibility -- .97
Leadership -- .97
Perseverance .88 --
Personal responsibility .89 --
Self-confidence .83 --
Personal reflection .82 .64
Argumentation .80 .61
Writing ability .80 --
Participation extracurricular act -- .64
Note. Loadings < .60 omitted.
Recommended