Measurement of Evapotranspiration in Phreatophyte Areas, Smith Creek Valley and Carson Desert, West-Central Nevada, 1983
By R.L. CARMAN
A product of the Regional Aquifer-System Analysis of the Great Basin Nevada, Utah, and adjacent States
U.S. GEOLOGICAL SURVEY WATER-RESOURCES INVESTIGATIONS REPORT 89-4118
U.S. DEPARTMENT OF THE INTERIOR BRUCE BABBITT, Secretary
U.S. GEOLOGICAL SURVEY Robert M. Hirsch, Acting Director
Any use of trade, product, or firm namesin this publication is for descriptive purposes onlyand does not imply endorsement by the U.S. Government
UNITED STATES GOVERNMENT PRINTING OFFICE: 1993
For additional information write to:
District ChiefU.S. Geological Survey333 West Nye Lane, Room 203Carson City, NV 89706-0866
Copies of this report can be purchased from:
U.S. Geological SurveyEarth Science Information CenterOpen-File Reports SectionBox 25286, MS 517Denver Federal CenterDenver, CO 80225-0046

CONTENTS
Abstract 1 Introduction 1
Background 1Purpose and scope 1Acknowledgments 2
Description of study sites 2 Evapotranspiration 2
Energy-transport mechanisms 3Methods of measurement 4Instrumentation 5Equations for calculating evapotranspiration 7
Data summary 9Correlations 12Transfer value 18
Summary and conclusions 18 References cited 18
FIGURES
1. Map showing location of study sites 32. Graph showing monthly average precipitation and temperature for Smith Creek
Valley and Soda Lake, 1983 43. Sketch of processes involved in transport of heat and vapor into atmosphere 54. Photograph showing instrumentation for eddy-correlation method 65. Photograph showing instrumentation for Bowen ratio method 76. Photograph showing instrumentation for Penman method 8
7-14. Graphs showing:7. Heat flux determined by eddy-correlation method at Smith Creek Valley and
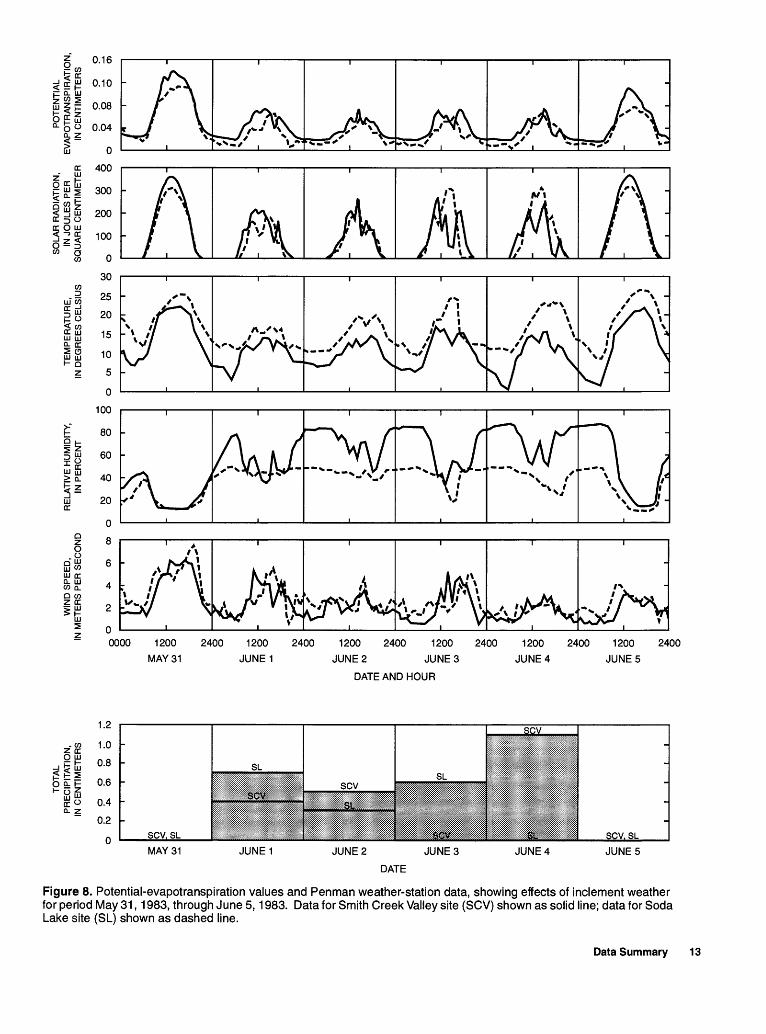
Soda Lake sites 128. Potential-evapotranspiration values and Penman weather-station data showing
effects of inclement weather at Smith Creek Valley and Soda Lake sites, May 31 through June 5, 1983 13
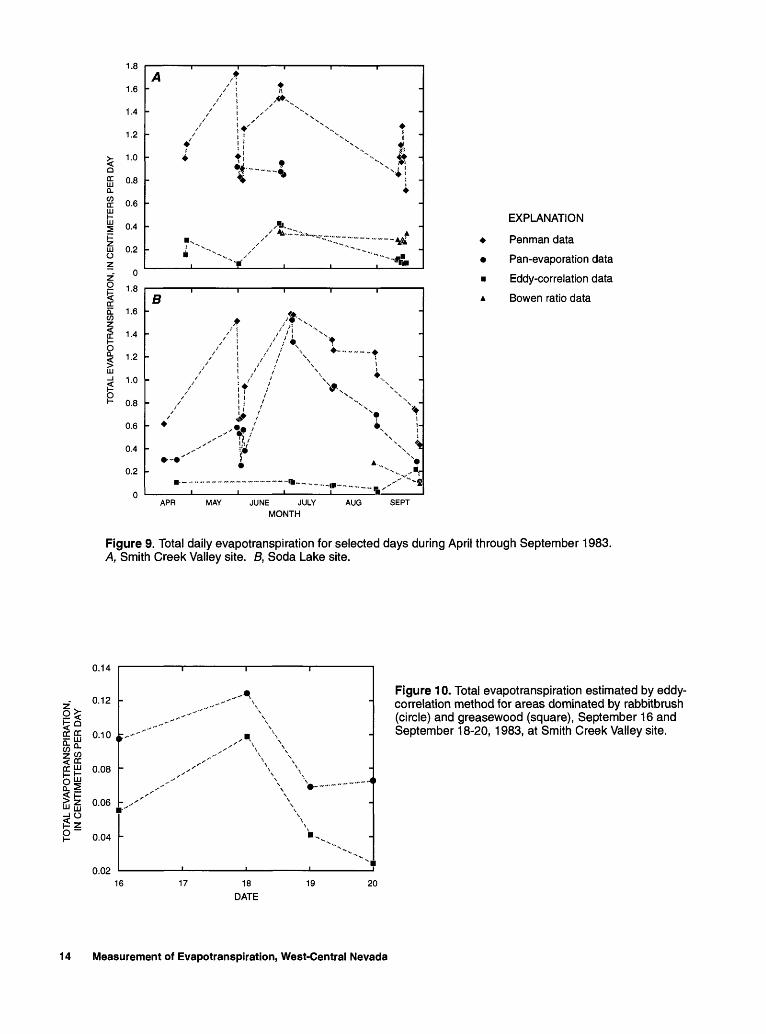
9. Total daily evapotranspiration at Smith Creek Valley and Soda Lake sites, April through September 1983 14
10. Total evapotranspiration estimated by eddy-correlation method for areas dominated by rabbitbrush and greasewood at Smith Creek Valley site, September 16-20, 1983 14
11. Evapotranspiration values derived from measured and residual latent-heat fluxes at Smith Creek Valley and Soda Lake sites, April through September 1983 15
12. Measured and residual latent-heat flux values at Smith Creek Valley site, September 18, 1983 16
13. Relation between potential evapotranspiration and solar radiation at Smith Creek Valley site 16
14. Relation between actual and potential evapotranspiration at Smith Creek Valley and Soda Lake sites, April through September 1983 17
TABLES
1. Evapotranspiration determined by different methods for selected days during 1983 in Smith Creek Valley and vicinity 10
2. Evapotranspiration determined by different methods for selected days during 1983 near Soda Lake 11
3. Total evapotranspiration for 1983 derived from measured and residual values of latent-heat flux 15
Contents III

CONVERSION FACTORS AND VERTICAL DATUM
Multiply By To obtain
Energy and power
joule per gram (J/g)
joule per gram per degree Celsius (J/g/°C )
megajoule per square meter (MJ/m2)watt per square meter (W/m2)
0.4299
0.2390
88.080.3172
British thermal unit per pound
British thermal unit per pound perdegree Fahrenheit
British thermal unit per square footBritish thermal unit per square foot
per hour
Mass
cubic meter per gram (m3/g)
cubic meter squared per gram squared (m6/g2)
gram per square centimeter per second (g/cm2/s)gram per square meter per second (g/m2/s)
gram per cubic meter (g/m3)
gram per cubic meter per kelvin (g/m3/K)
16,020
256,600,000
0.014220.0002048
0.00006243
0.00006243
cubic foot per pound
cubic foot squared per pound squared
pound per square inch per secondpound per square foot per second
pound per cubic foot
pound per cubic foot per kelvin
Length
centimeter (cm)
meter (m)
kilometer (km)
0.39373.281
0.6214
inch
foot
mile
Velocity or rate
millimeter per second (mm/s)
meter per second (m/s)meter per second per count (m/s/ct)
centimeter per day (cm/d)
second per meter (s/m)
centimeter per year (cm/yr)meter per year (m/yr)
kilometer per hour (km/hr)
0.003281
2.2373.281
0.3937
0.3048
0.39373.281
0.6214
foot per second
mile per hourfoot per second per count
inch per day
second per feetinch per year
foot per year
mile per hour
Temperature
For temperature, degrees Celsius (°C ) may be converted to degrees Fahrenheit (°F) by using the formula °F = [1.8(°C )]+32. Kelvins (K) may be converted to degrees Fahrenheit (°F) by using the formula °F = [1.8(K)]-459.67.
Sea Level: In this report, "sea level" refers to the National Geodetic Vertical Datum of 1929 (NGVD of 1929, formerly called Sea Level Datum of 1929), which is derived from a general adjustment of the first-order leveling networks of the United States and Canada.
IV Conversion Factors and Vertical Datum

SYMBOLS AND UNITS
Symbol
a A b
'D U V
dEGhHk
5 t T
P PdPv
Pva
Pvs
a
Definition
Calibration constant for Lyman alpha hygrometer. Altitude above sea level.Calibration constant for Lyman alpha hygrometer. Calibration constant for fine-wire thermocouple. Specific heat of air.Covariance of vapor density and vertical wind velocity as measured
by data logger.Calibration constant for sonic anemometer.Covariance of voltages from sonic anemometer and fine-wire
thermocouple, as recorded by data logger.Zero-plane displacement.Water-vapor-flux density.Soil-heat flux.Average crop height.Sensible-heat flux.Von Karman's constant.Net long-wave radiation.Heat-transfer resistance.Vapor-transfer resistance.Downward long-wave radiation.Upward long-wave radiation.Net solar radiation.Global short-wave radiation.Slope of saturation vapor-density curve.Temperature.Absolute temperature.Air temperature.Average wind velocity.Heat- and vapor-roughness parameter.Momentum-roughness parameter.Instrument height above land surface.Surface albedo.Bowen ratio.Thermodynamic psychrometric constant.Apparent psychrometric constant.Clear-sky emissivity.Surface emissivity.Latent heat of vaporization.Latent-heat flux.Air density.Density of dry air.Vapor density.Ambient vapor density.Saturated vapor density.Stefan-Boltzmann constant.
Unit
m3/g
mm6/g2
counts
m/s/count counts
mg/m2/sW/m2
mW/m2
W/m2
s/ms/mW/m2W/m2W/m2
MJ/m2g/m3/°C°C
KKm/smmm
g/m3/°C g/m3/°C
J/g W/m2g/m3 g/m3 g/m3 g/m3 g/m3
Symbols and Units V

Measurement of Evapotranspiration in Phreatophyte Areas, Smith Creek Valley and Carson Desert, West-Central Nevada, 1983By R.L CARMAN
Abstract
Evaporation from bare soils and evapotranspiration from phreatophyte areas are major sources of natural ground- water loss in the Great Basin region of Nevada, Utah, and adjacent States. Many methods have been developed to try to quantify the amount of water used by phreatophytes and lost from bare soils. This study evaluated three of these methods for determining evapotranspiration under natural conditions and provides quantitative estimates of evapo transpiration. The methods used were (1) the eddy-correla tion method, based on aerodynamics and turbulent transport;(2) the Bowen ratio method, based on an energy budget; and(3) the Penman method, based on aerodynamics and energy budgets. The eddy-correlation and Bowen ratio methods measure actual evapotranspiration under natural conditions, whereas the Penman method measures potential evapo transpiration. The two sites chosen for study were in Smith Creek Valley near Austin, Nev., and north of Soda Lake in the Carson Desert near Fallon, Nev.
Phreatophytes at the Smith Creek Valley site consist mainly of rabbitbrush. Actual evapotranspiration for 1983 at this site, estimated using the eddy-correlation method, was about 0.32 meter per year, whereas potential evapotranspira tion, estimated by the Penman method, was about 2.0 meters per year. Phreatophytes at the Soda Lake site consist pre dominantly of greasewood. Actual evapotranspiration at this site for 1983, estimated by the eddy-correlation method, was 0.18 meter per year, whereas potential evapotranspiration, estimated by the Penman method, was 1.78 meters per year.
The high correlation of evapotranspiration with solar radi ation may make it possible to estimate evapotranspiration in similar areas where solar or net-radiation data are available.
The methods and instrumentation systems used are accurate, relatively simple, and mobile, and they are effective in measuring evapotranspiration under natural conditions.
INTRODUCTION
Background
This evapotranspiration study is one of several stud ies that support the Regional Aquifer-Systems Analysis (RASA) program of the Great Basin region of Nevada, Utah, and adjacent States. These RASA studies are being con ducted by the U.S. Geological Survey as part of a series of aquifer-system studies throughout the United States.
Ground water is a major source of water in the Great Basin. Therefore, determining the amount of water that becomes available through recharge and the amount that is lost through evapotranspiration (ET) is important for devel oping and administering ground-water resources in the Great Basin. The lack of quantitative field measurements of ET was recognized during the planning phase of the Great Basin RASA.
Phreatophytes are common plants in the lowlands of the Great Basin; these plants have the ability to tap ground water directly for their supply of water. In the Great Basin, ground water is lost primarily through transpiration by phreato phytes and evaporation from bare soils. Early estimates of ET were based on water-budget methods, empirical tech niques, and meteorological techniques (Penman, 1948; Robinson, 1970; Hanson and Dawdy, 1976; Pennington, 1980). Technical advancements have facilitated such theo retical approaches for estimating ET as mass-transfer and energy-balance methods.
Purpose and Scope
The purpose of this study was to evaluate selected methods for estimating ET from areas of phreatophytes
Introduction 1

under natural conditions. Recently developed instrumenta tion was incorporated in the application and refinement of an eddy-correlation procedure to improve estimates of ET under natural conditions. This report presents these ET esti mates and describes the methods used to obtain them. Results were analyzed to determine whether correlations exist between ET and physical or meteorological elements and to evaluate the possible transfer value of the results to similar sites.
Fieldwork began in April 1982 and continued through July 1984. Intensive field data collection began when the phreatophytes emerged from dormancy in the spring and ended when they returned to the dormant state in the fall. The fieldwork consisted of periodic water-level measure ments in wells, continuous collection of meteorological data, periodic collection of heat-flux and temperature data, and some soil sampling. The 1982 field season was spent debugging the instrumentation and developing techniques. However, a large amount of data resulted from this study. Data collected during the 1983 season are the most accurate and complete and therefore are the only data discussed in this report.
Acknowledgments
E.P. Weeks and D.I. Stannard of the U.S. Geological Survey and Harold Weaver of Washington State University (Pullman) provided technical assistance.
DESCRIPTION OF STUDY SITES
Two sites in northern Nevada (fig. 1) were selected for study. The first site is north of Soda Lake in the Carson Desert and is approximately 14 km northwest of Fallen, Nev. The second site is in Smith Creek Valley and is approxi mately 40 km southwest of Austin, Nev. These sites were chosen primarily because they were considered to be repre sentative of many phreatophyte areas in the northern Great Basin.
The Soda Lake site is in a desert region. The altitude of the site is approximately 1,220 m above sea level. Precipita tion ranges from 15 to 20 cm/yr and occurs principally as rainfall but includes some snow in the winter; total precipi tation at this site during 1983 was 19.8 cm. Temperatures range from -5 to +30°C during the year; large daily temper ature fluctuations are typical of northern Nevada. Total monthly precipitation and average monthly temperatures for 1983 are shown in figure 2.
Vegetation at the Soda Lake site consists mainly of greasewood (Sarcobatus vermiculatus), which covers approximately 5 percent of the area and has an average height of 1 m. Predominant plant species also include shad- scale (Atriplex confertifolia), bunchgrass, sagebrush (Arte- misia tridentata), and saltcedar (Tamarix gallicd). Approx imately 82 percent of the area is bare soil. Depth to the water
table is 7.5 to 9.0 m. The soil is generally fine- to medium- grained sand with some silt and clayey silt at depth. Areas of salt encrustation around ponded water near the Soda Lake site and stands of highly salt-tolerant saltcedar indicate high soil salinity. Greasewood is a moderately salt-tolerant shrub.
No surface-water runoff occurs at the Soda Lake site. Soil-moisture samples and water-level measurements taken near the site indicate that ground water is recharged locally by seepage from ponds and small lakes and by periods of intense rainfall (F.H. Olmsted, U.S. Geological Survey, oral cornmun., 1983).
The Smith Creek Valley site is in a semiarid basin- playa environment. The altitude of the site is about 1,844 m. Precipitation, which occurs principally as snow and as sum mer thundershowers, ranges from 20 to 30 cm/yr at this site; during 1983, precipitation was 29.5 cm. Temperatures range from -11 to 29°C. Total monthly precipitation and average monthly temperature data for 1983 are shown in figure 2.
Vegetation consists mainly of rabbitbrush (Chrys- othamnus sp.), which covers about 25 percent of the area and has an average height of 0.9 m. Great Basin wildrye (Elymus cinereus) is the other predominant species. Depth to the water table is 3 to 4.5 m. Approximately 64 percent of the area is bare soil. The soil is dense, hard silty clay. Plant succession in Smith Creek Valley, typical of desert playas, is from bare playa to saltgrass (Distichlis stricta), to rabbit- brush, to rabbitbrush/greasewood or just greasewood and, finally, where the water table tends to be deeper than 4 m, to sagebrush.
Surface-water runoff from surrounding mountains that reaches the playa evaporates or, during wet years, is a source of local ground-water recharge. Most ground water is recharged in the mountains, surrounding foothills, and allu vial fans.
A second study site near the main Smith Creek Valley site described above consists mostly of greasewood and little or no rabbitbrush. This site was chosen to obtain some addi tional (although sporadic) data to analyze the effect that different vegetation has on evapotranspiration.
EVAPOTRANSPIRATION
Evapotranspiration (ET), in general, is the combination of water consumptively used by plants through transpiration and water evaporated from bare soils. ET is generally referred to in terms of actual ET and potential ET, each of which can be further subdivided into total ET and net ET. Actual ET is the amount of water actually lost through ET under given conditions. Potential ET is the amount of water that could be lost through the process of ET if water avail ability is not a limiting factor. Total ET is the total amount of water used in the process of ET, regardless of the water's origin. Net ET is a component of total ET and, for the purposes of this study, can be defined as that part of total ET
2 Measurement of Evapotranspiration, West-Central Nevada

119°15' 119°00' 45' 40°00'30' 15' 118°00' 45' 30' 15' 117°00'
45'
30'
15'
39°00'
10 20 MILES
10 20 30 KILOMETERS
AREA OF MAP
Figure 1. Location of study sites.
derived from ground water. Net ET can be determined by subtracting precipitation and change in soil-moisture storage from total ET.
Net ET can be extremely difficult to determine, espe cially in recharge areas where precipitation percolates to the ground-water reservoir. To simplify matters, and because the main focus of this study was to evaluate the method ology, all values of ET are considered total ET and do not differentiate among soil moisture, precipitation, and ground water as sources of water for ET.
Energy-Transport Mechanisms
Eddy motion, or swirling of the air, is caused by mechanical and thermal, or convective, turbulence (fig. 3).
EXPLANATION
Phreatophytes
Playa
Basin boundary
Study site
Fallen Experiment Station
Central Nevada Field Laboratory
Mechanical turbulence is produced as wind moves over a surface and creates a drag. Thermal turbulence is produced as air is heated at the surface and is transported upward (Campbell, 1977, p. 33). Eddies are the transport mecha nisms for heat, mass, and vapor to the atmosphere. The capacity of these eddies to transport heat or mass is directly related to the size of the vertical fluctuations (Campbell, 1977, p. 37). The farther from a surface, the larger the eddies become, and the larger the eddies, the more efficient the transport of heat and mass. Turbulent transport increases as wind speed, surface roughness, and surface heating increase.
The major source of energy for many of the processes in nature is net radiation. Photosynthesis and transpiration are closely tied to radiant energy (Campbell, 1977, p. 127). Where water availability is not a limiting factor, most of the
Evapotranspiration

JAN FEB MAR APR MAY JUNE JULY AUG SEPT OCT NOV
MONTH
DEC
Figure 2. Climatological data for 1983 from Central Nevada Field Laboratory near Smith Creek Valley site (circles) and Fallen Experiment Station near Soda Lake site (crosses) (National Oceanic and Atmospheric Administration, 1983). No June data for Smith Creek Valley. A, Total monthly pre cipitation. B, Monthly mean air temperature.
energy supplied by net radiation is used for ET. Where water availability is a limiting factor, the residual radiant energy heats the soil and air (Hanks and Ashcroft, 1980, p. 101).
Methods of Measurement
The eddy-correlation, Bowen ratio, and Penman methods were used to evaluate ET at the two study sites. These methods are based on meteorologic measurements. The versatility and mobility of the instrumentation make these methods more desirable than previous methods that were based on the hydrologic cycle. Hanks and Ashcroft (1980) divided methods for determining ET into four major groups: aerodynamic methods, energy-budget methods, combined aerodynamic and energy-budget methods, and empirical methods.
The eddy-correlation method is an aerodynamic method and is based on turbulent-transport equations and measurement of atmospheric fluxes, or eddies. This method
allows for estimation of evapotranspiration under natural conditions by using rapid-response instrumentation. Fast- response high-frequency sensors measure vertical-wind, air- temperature, and vapor-density fluxes. Van Hylckama (1980, p. 13) stated that the eddy-correlation method is the only method that has the advantage of being "independent of the characteristics of the surfaces over which the measure ments are made."
Two major energy fluxes can be determined with the eddy-correlation method: latent-heat flux, a function of vertical wind and vapor, and sensible-heat flux, a function of vertical wind and temperature. Latent-heat flux is the amount of energy required to convert water from a liquid to a vapor phase. Sensible-heat flux is the amount of energy that heats the air. A specific amount of latent energy can be associated with a specific mass of water; therefore, water- vapor flux can be considered in terms of an equivalent amount of latent energy (Fritschen and Gay, 1979, p. 17). Vapor-flux density is determined from measurements of vapor density and vertical-wind velocity, then converted to an energy flux by multiplying by the latent heat of vaporiza tion.
Sensible-heat flux is directly related to convective turbulence. When sensible-heat flux is positive (surface heating the air), the atmosphere is unstable and turbulence increases. When sensible-heat flux is negative (air warmer than surface), the atmosphere is stable and turbulence is suppressed by thermal stratification (Campbell, 1977, p. 41).
Other fluxes measured in conjunction with the eddy- correlation method are soil-heat flux and net radiation. Soil- heat flux is the rate of heat transfer to the soil, or change in heat storage in the soil. Net radiation is the amount of incoming short- and long-wave radiation minus the outgoing short- and long-wave radiation. These additional values, combined with the sensible- and latent-heat fluxes measured by the eddy-correlation method, allow evaluation of the energy-balance, or energy-budget, equation.
An energy-budget equation may be expressed as "the heat input minus the heat loss equals the heat storage" (Campbell, 1977, p. 78). Evaluation of the energy budget provides a measure of the accuracy of the eddy-correlation method. The energy-budget equation as applied to this studyis
"kE + H = R-G. (1)
The difference between the two sides of this equation, the energy-budget closure, indicates how efficient the system is in measuring latent- and sensible-heat fluxes. A nonzero energy-budget closure can be the result of instru ment design problems, deterioration of the Lyman alpha hygrometer tubes, poor positioning of the instruments, or advection. The source of the discrepancy is difficult to deter mine.
Measurement of Evapotranspiration, West-Central Nevada

A Outgoing long-wave radiation
I
t tTranspiration
Figure 3. Processes involved in transport of heat and vapor into atmosphere.
The Bowen ratio method has been used extensively to estimate ET, and an attempt was made to use it in this study concurrently with the eddy-correlation method in order to compare results obtained from the two methods. The Bowen ratio method is based on the energy budget and is dependent on measurements of temperature and humidity gradients. The Bowen ratio, HIE, is the ratio of energy involved in the sensible heating of air to that involved in evaporating water (Schwerdtfeger, 1976, p. 54). The Bowen ratio method measures ET accurately when water availability is not a limiting factor so that sensible-heat flux and the Bowen ratio are small. When it is a limiting factor, the Bowen ratio and sensible-heat flux are large compared to latent-heat flux and introduce uncertainties into the calculated values of latent- heat flux (Hanks and Ashcroft, 1980, p. 108).
The Penman method is a combination of aerodynamic and energy-budget methods and incorporates principles of both into the calculation of potential ET (Wilson and Rouse, 1971). The Penman method quantifies ET in terms of envi ronmental parameters and diffusion resistances (Campbell, 1977, p. 120) and can be applied using data from most stand ard weather stations.
Instrumentation
Although the eddy-correlation method for determining actual ET had existed for some time, its implementation was not feasible on a routine basis because of the lack of high- frequency instrumentation to obtain necessary data. For accurate results, data must be collected about 10 times per
second; this rate meant that the instrumentation had to have a fast response time. Another major problem was the large amount of data that had to be recorded, assimilated, and processed. Microprocessor-controlled data loggers enable high-frequency collection and recording of data.
Estimating ET by the eddy-correlation method requires measurement of vertical wind velocity, air temperature, vapor density, net radiation, and soil-heat flux. Instrumenta tion used to acquire these measurements is shown in figure 4.
The sonic anemometer, used to measure vertical wind velocity, has an accuracy of ±5 mm/s over a range of ±2.5 m/s. The anemometer consists of two vertical acoustical transducers. A sonic signal is alternated between the trans ducers, and velocity is determined by the phase shift of the signal caused by the wind. Connected to the sonic anemom eter is a fine-wire (0.001-cm) chromel-constantan thermo couple, which measures air-temperature fluxes. Both the sonic anemometer and fine-wire thermocouple transmit analog signals to a digital data logger.
A Lyman alpha hygrometer, consisting of a source tube and a detector tube (fig. 4), was used to measure fluctuations in vapor density. The source tube emits Lyman alpha radia tion, which is intercepted by the detector tube, a nitric oxide ionization chamber. The radiation creates a current in the chamber that increases with the strength of radiation received. The strength of the current varies inversely with the vapor content of the air between the two tubes because Lyman alpha radiation has a high absorption coefficient for water vapor and is attenuated by moist air.
Evapotranspiration
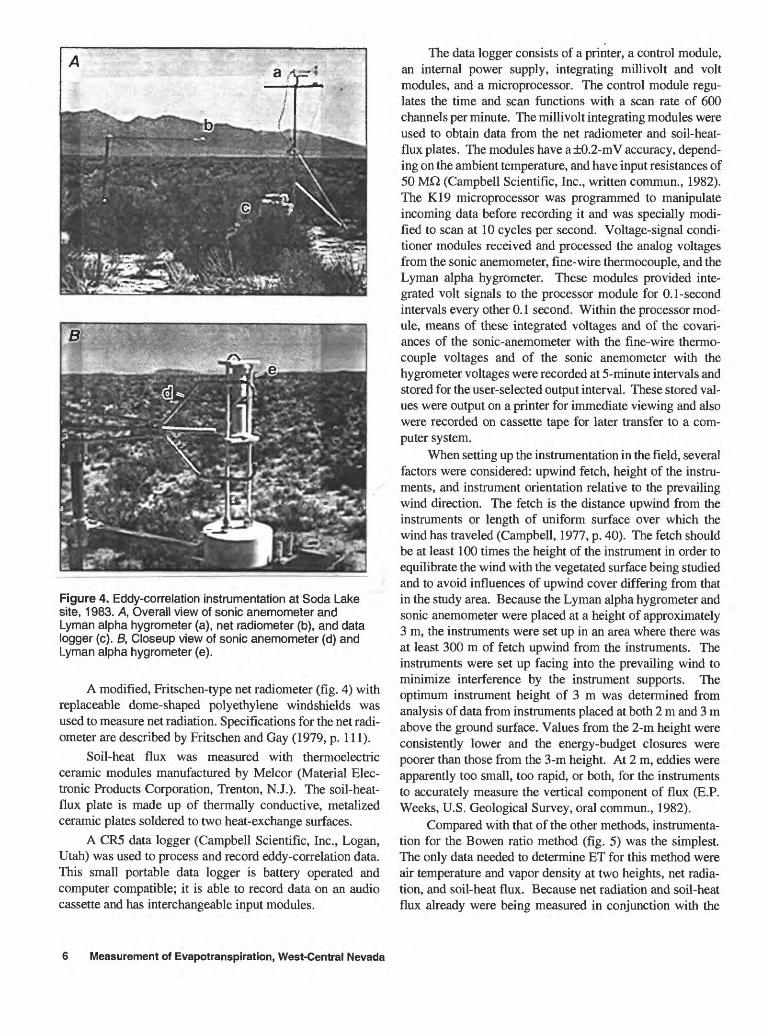
Figure 4. Eddy-correlation instrumentation at Soda Lake site, 1983. A, Overall view of sonic anemometer and Lyman alpha hygrometer (a), net radiometer (b), and data logger (c). B, Closeup view of sonic anemometer (d) and Lyman alpha hygrometer (e).
A modified, Fritschen-type net radiometer (fig. 4) with replaceable dome-shaped polyethylene windshields was used to measure net radiation. Specifications for the net radi ometer are described by Fritschen and Gay (1979, p. 111).
Soil-heat flux was measured with thermoelectric ceramic modules manufactured by Melcor (Material Elec tronic Products Corporation, Trenton, N.J.). The soil-heat- flux plate is made up of thermally conductive, metalized ceramic plates soldered to two heat-exchange surfaces.
A CR5 data logger (Campbell Scientific, Inc., Logan, Utah) was used to process and record eddy-correlation data. This small portable data logger is battery operated and computer compatible; it is able to record data on an audio cassette and has interchangeable input modules.
The data logger consists of a printer, a control module, an internal power supply, integrating millivolt and volt modules, and a microprocessor. The control module regu lates the time and scan functions with a scan rate of 600 channels per minute. The millivolt integrating modules were used to obtain data from the net radiometer and soil-heat- flux plates. The modules have a ±0.2-mV accuracy, depend ing on the ambient temperature, and have input resistances of 50 MQ. (Campbell Scientific, Inc., written commun., 1982). The K19 microprocessor was programmed to manipulate incoming data before recording it and was specially modi fied to scan at 10 cycles per second. Voltage-signal condi tioner modules received and processed the analog voltages from the sonic anemometer, fine-wire thermocouple, and the Lyman alpha hygrometer. These modules provided inte grated volt signals to the processor module for 0.1 -second intervals every other 0.1 second. Within the processor mod ule, means of these integrated voltages and of the covari- ances of the sonic-anemometer with the fine-wire thermo couple voltages and of the sonic anemometer with the hygrometer voltages were recorded at 5-minute intervals and stored for the user-selected output interval. These stored val ues were output on a printer for immediate viewing and also were recorded on cassette tape for later transfer to a com puter system.
When setting up the instrumentation in the field, several factors were considered: upwind fetch, height of the instru ments, and instrument orientation relative to the prevailing wind direction. The fetch is the distance upwind from the instruments or length of uniform surface over which the wind has traveled (Campbell, 1977, p. 40). The fetch should be at least 100 times the height of the instrument in order to equilibrate the wind with the vegetated surface being studied and to avoid influences of upwind cover differing from that in the study area. Because the Lyman alpha hygrometer and sonic anemometer were placed at a height of approximately 3 m, the instruments were set up in an area where there was at least 300 m of fetch upwind from the instruments. The instruments were set up facing into the prevailing wind to minimize interference by the instrument supports. The optimum instrument height of 3 m was determined from analysis of data from instruments placed at both 2 m and 3 m above the ground surface. Values from the 2-m height were consistently lower and the energy-budget closures were poorer than those from the 3-m height. At 2 m, eddies were apparently too small, too rapid, or both, for the instruments to accurately measure the vertical component of flux (E.P. Weeks, U.S. Geological Survey, oral commun., 1982).
Compared with that of the other methods, instrumenta tion for the Bowen ratio method (fig. 5) was the simplest. The only data needed to determine ET for this method were air temperature and vapor density at two heights, net radia tion, and soil-heat flux. Because net radiation and soil-heat flux already were being measured in conjunction with the
Measurement of Evapotranspiration, West-Central Nevada

Figure 5. Bowen ratio instrumentation. Sonic anemometer and Lyman alpha hygrom eter (a) and wet-bulb/dry-bulb psychrometer (b), Soda Lake site, 1983.
eddy-correlation system, only measurements of air tempera ture and vapor density were needed.
Small ventilated thermistor psychrometers were used to measure air temperature and vapor pressure (fig. 5). The psychrometers were used in conjunction with a CR21 data logger (discussed at the end of this section), which provides excitation and linearization of the readings. To obtain temperature and vapor-density profiles, one psychrometer was placed at the top of the vegetation canopy and the other was placed 1 m higher. Because the psychrometers were ventilated rather than aspirated, some errors may have been introduced during times of little or no wind. Systematic errors due to differences in calibration between the two psychrometers could have been eliminated by constructing a system whereby they could be interchanged periodically.
The parameters needed to determine ET by the Penman method are wind speed, relative humidity or vapor density, soil-heat flux, net radiation or solar radiation, and air temper ature. Instrumentation for a typical Penman weather station is shown in figure 6.
A Met-One wind-speed sensor (a three-cup anemom eter with a magnetic reed-switch assembly) was used to measure wind velocity. The frequency of contact closures is proportional to wind velocity. The sensor is accurate to within ±1.5 percent or ±0.11 rn/s, has a range of 0 to 50 rn/s, and has a distance constant of less than 4.6 m. It delivers a pulsed output and can be used in conjunction with both digital and analog systems.
The relative-humidity sensor contains a Phys-Chem- ical Research Model PCRC-11 relative-humidity probe
(±l-percent deviation), which is a sulfonated-polystyrene plate with a Fenwal thermistor attached to measure air temperature. The relative-humidity sensor is linear to within ±3 percent when relative humidity is 10 to 97 percent (Campbell Scientific, Inc., written commun., 1983).
Soil-heat flux was determined with soil-heat-flux plates as described previously for the eddy-correlation method. Solar radiation was measured using a silicon pyranometer, which consists of a silicon photodiode sensor, which measures global radiation. Sensor output is in u,V/W/m2. Calibration factors were provided by the supplier or were obtained by calibrating against an Eppley precision pyra nometer. The uncertainty of the calibration is ±5 percent.
A battery-operated micrologger (a programmable CR21 data logger) processed and recorded data from the Penman instrumentation. Data from the micrologger can be recorded to cassette tape or printer tape. The micrologger contains a microcomputer and has nine input channels seven analog and two pulse-counting. The micrologger scans inputs every 10 or 60 seconds, depending on the model. Amplifier accuracy is ±0.2 percent in the tempera ture range 0 to 40°C. Resolution is ±5 U,V in the millivolt range and ±1 mV in the volt range.
Equations for Calculating Evapotranspiration
Latent-heat flux is computed from the CR5 output by the following equation (Campbell Scientific, Inc., written commun., 1982):
Evapotranspiration
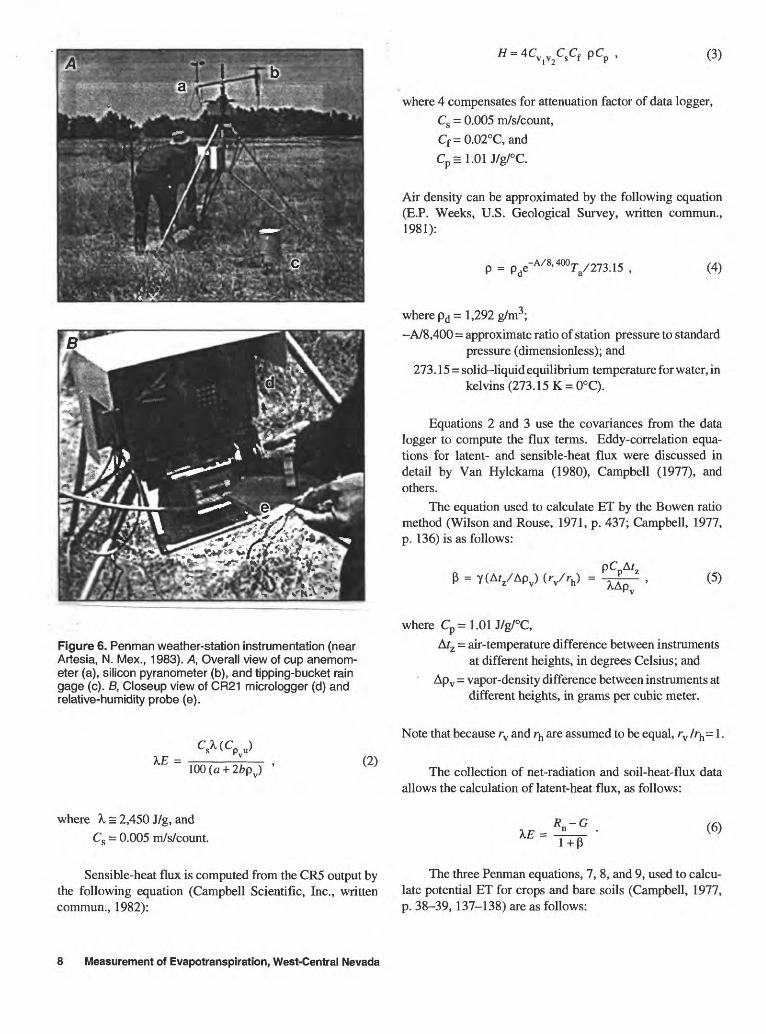
Figure 6. Penman weather-station instrumentation (near Artesia, N. Mex., 1983). A, Overall view of cup anemom eter (a), silicon pyranometer (b), and tipping-bucket rain gage (c). 6, Closeup view of CR21 micrologger (d) and relative-humidity probe (e).
(2)
where A, = 2,450 J/g, and Cs = 0.005 m/s/count.
Sensible-heat flux is computed from the CR5 output by the following equation (Campbell Scientific, Inc., written commun., 1982):
(3)
where 4 compensates for attenuation factor of data logger, Cs = 0.005 m/s/count, Cf =0.02°C,and Cp=1.01 J/g/°C.
Air density can be approximated by the following equation (E.P. Weeks, U.S. Geological Survey, written commun., 1981):
**. **.P = Pne A/ O.
/T' /O*7O 1 C7V273.15 , (4)
where pd = 1,292 g/m3 ;-A/8,400 = approximate ratio of station pressure to standard
pressure (dimensionless); and 273.15 = solid-liquid equilibrium temperature for water, in
kelvins(273.15K = 0°C).
Equations 2 and 3 use the covariances from the data logger to compute the flux terms. Eddy-correlation equa tions for latent- and sensible-heat flux were discussed in detail by Van Hylckama (1980), Campbell (1977), and others.
The equation used to calculate ET by the Bowen ratio method (Wilson and Rouse, 1971, p. 437; Campbell, 1977, p. 136) is as follows:
= Y(A//Apv) (rv/rh ) = (5)
where Cp = 1.01 J/g/°C,Atz = air-temperature difference between instruments
at different heights, in degrees Celsius; and ' Apv = vapor-density difference between instruments at
different heights, in grams per cubic meter.
Note that because rv and rh are assumed to be equal, rv /rh = 1.
The collection of net-radiation and soil-heat-flux data allows the calculation of latent-heat flux, as follows:
(6)1+P
The three Penman equations, 7, 8, and 9, used to calcu late potential ET for crops and bare soils (Campbell, 1977, p. 38-39, 137-138) are as follows:
8 Measurement of Evapotranspiration, West-Central Nevada

S(Rn -G)pCp (Pv -Pv>
v S a
Y = Yr/rh ,
(7)
(8)
and
(9)
where 6? =0.64Am, zh = 0.26/z, zm = 0.13/z, and
A: = 0.4 (dimensionless).
The equation used to convert solar radiation to net radi ation (modified from Brutsaert, 1982, eq. 6.2, p. 131) is as follows:
where ocs = 0.25 to 0.28 (dimensionless), and es = 0.97 (dimensionless).
The net long-wave radiation (Ln) also can be calculated by the following equation (Campbell, 1977, p. 139):
(ID
where ea = 0.72 + 0.0057 (dimensionless) (Campbell, 1977,p. 58),
es = 0.97 (dimensionless), and
DATA SUMMARY
The eddy-correlation instrumentation measures flux values (for determining sensible- and latent-heat flux) as well as other components of the energy budget. These values were integrated and recorded every 30 minutes. Total ET and ET rates were calculated from the latent-heat-flux values. The data for each day were compiled to determine daily total and average values. The average of the daily totals was determined and multiplied by 180 (the approxi mate number of days for the active growing season) to esti mate annual ET. Although the 30-minute values illustrate
fluctuations of the various components, daily values, partic ularly for soil-heat flux, integrated over a 24-hour period are more reliable because of problems and uncertainties associ ated with the system.
The Bowen ratio method provides only total daily values for ET determined by integrating data collected at 30- minute intervals over a period of 24 hours. The average of the daily totals was determined and multiplied by 180 to esti mate total annual ET.
The Penman method provides estimates of potential ET and associated meteorological parameters from data inte grated over a period of 60 minutes. These values were manipulated in the same way as the eddy-correlation data to provide values of daily total and average potential ET and an average of the daily totals for estimating annual potential ET.
Intermittent daily data obtained by the eddy-correlation method are available for both study sites beginning with the onset of new growth (April 1983) until dormancy began (in October). A limited amount of Bowen ratio data are avail able for the Smith Creek Valley site for the period June to September. As a result of mechanical and technical prob lems, mainly caused by strong, gusty winds and blowing sand, only 2 days of Bowen ratio data are available for the Soda Lake site. Essentially continuous meteorological data were obtained from the Penman weather stations for the period January to December 1983.
ET data determined by the three methods at each study site are shown in tables 1 and 2. Pan-evaporation data collected from the Fallen Experiment Station and the Central Nevada Field Laboratory in Reese River Valley (near Smith Creek Valley) are included for comparison with the Penman data. Pan-evaporation data from the station in the Reese River Valley were unavailable for most days.
Typical hourly fluctuations in sensible- and latent-heat fluxes, soil-heat flux, and net radiation determined by the eddy-correlation method are shown in figure 7. During daylight hours, particularly midday, sensible-heat flux exceeded latent-heat flux because the limited ability of the plant to transpire water created an excess of available energy. If water availability had not been a limiting factor, much of the radiant energy would have been used in evapo ration and transpiration. The energy-budget closure for each day is also shown in figure 7. The closure deficit is greatest for the Soda Lake site.
The period May 31 to June 5 was a time of heavy precipitation. As a result, the Penman data curves reflect a dramatic decrease in potential ET. Unfortunately, the instru mentation for the eddy-correlation method has a tendency to short-circuit when exposed to heavy moisture, so, except for June 1 at the Smith Creek Valley site, no data for actual ET are available for this period.
Data Summary
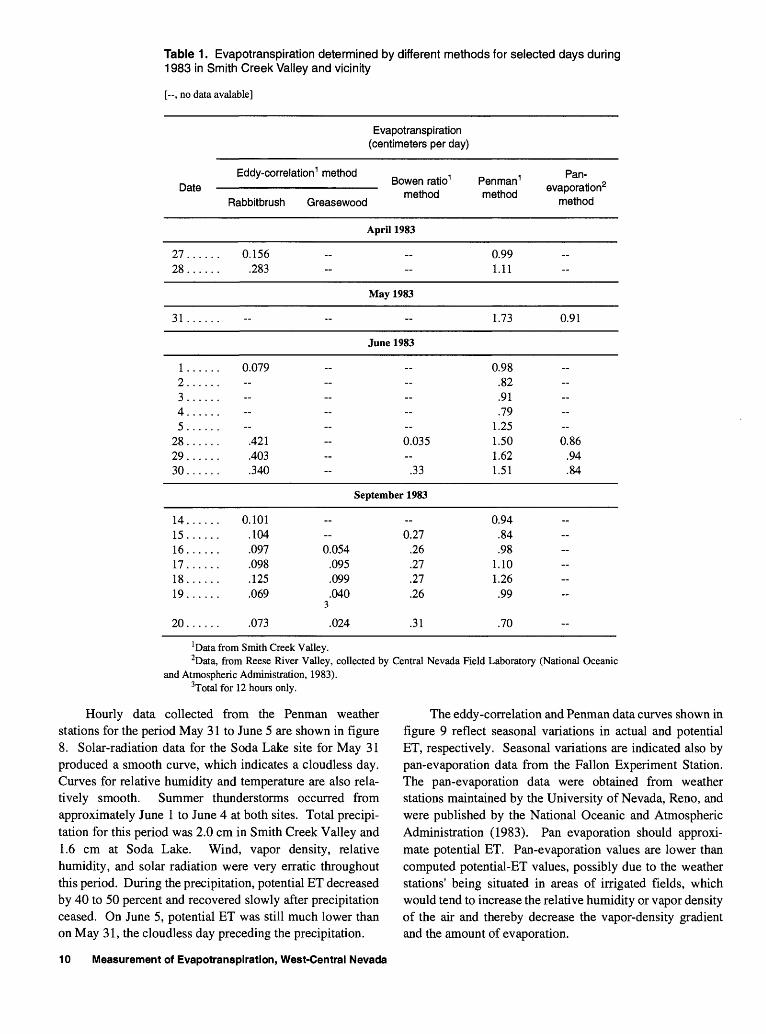
Table 1 . Evapotranspiration determined by different methods for selected days during 1983 in Smith Creek Valley and vicinity
[ , no data avalable]
Evapotranspiration (centimeters per day)
DateEddy-correlation 1 method
Rabbitbrush Greasewood
Bowen ratio1 method
Penman 1
method
April 1983
2728
0.156.283
0.991.11
May 1983
31 1.73
Pan- evaporation2
method
0.91
1.....2.....3.....4.....5.....
28 . . . . .29 . . . . .30 . . . . .
14.....15.....16.....17.....18.....19.....
20 . . . . .
0.079
.421
.403
.340
0.101.104.097.098.125.069
.073
June 1983
0.035
.33
September 1983
0.270.054 .26
.095 .27
.099 .27
.040 .263
.024 .31
0.98.82.91.79
1.251.501.621.51
0.94.84.98
1.101.26.99
.70
0.86.94.84
*Data from Smith Creek Valley.2Data, from Reese River Valley, collected by Central Nevada Field Laboratory (National Oceanic
and Atmospheric Administration, 1983). 3Total for 12 hours only.
Hourly data collected from the Penman weather stations for the period May 31 to June 5 are shown in figure 8. Solar-radiation data for the Soda Lake site for May 31 produced a smooth curve, which indicates a cloudless day. Curves for relative humidity and temperature are also rela tively smooth. Summer thunderstorms occurred from approximately June 1 to June 4 at both sites. Total precipi tation for this period was 2.0 cm in Smith Creek Valley and 1.6 cm at Soda Lake. Wind, vapor density, relative humidity, and solar radiation were very erratic throughout this period. During the precipitation, potential ET decreased by 40 to 50 percent and recovered slowly after precipitation ceased. On June 5, potential ET was still much lower than on May 31, the cloudless day preceding the precipitation.
The eddy-correlation and Penman data curves shown in figure 9 reflect seasonal variations in actual and potential ET, respectively. Seasonal variations are indicated also by pan-evaporation data from the Fallon Experiment Station. The pan-evaporation data were obtained from weather stations maintained by the University of Nevada, Reno, and were published by the National Oceanic and Atmospheric Administration (1983). Pan evaporation should approxi mate potential ET. Pan-evaporation values are lower than computed potential-ET values, possibly due to the weather stations' being situated in areas of irrigated fields, which would tend to increase the relative humidity or vapor density of the air and thereby decrease the vapor-density gradient and the amount of evaporation.
10 Measurement of Evapotranspiration, West-Central Nevada
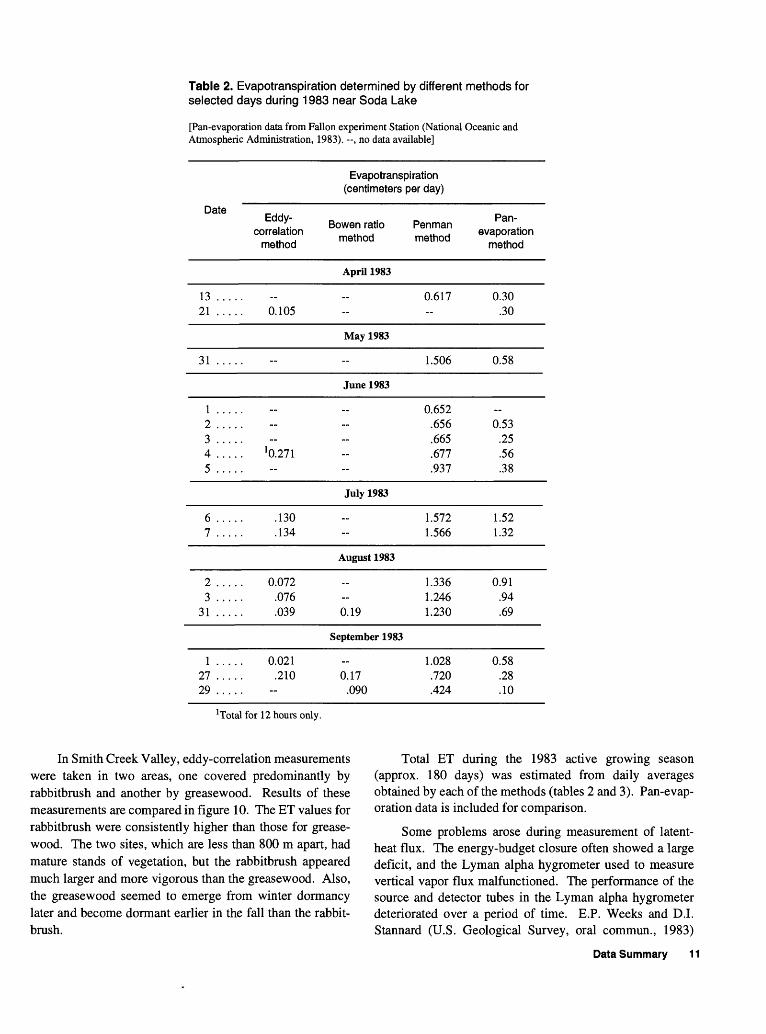
Table 2. Evapotranspiration determined by different methods for selected days during 1983 near Soda Lake
[Pan-evaporation data from Fallen experiment Station (National Oceanic and Atmospheric Administration, 1983). --, no data available]
Evapotranspiration (centimeters per day)
Date Eddy- correlation
method
Bowen ratio method
Penman method
Pan- evaporation
method
April 1983
1321 0.105
0.617 0.30 .30
May 1983
31 1.506 0.58
1 ....2 ....3 ....4 ....5 ....
6 ....7 ....
2 ....3 ....
31 ....
1 . .. .21 ....19 ....
J 0.271
.130
.134
0.072.076.039
0.021.210
June 1983
0.652.656.665.677.937
July 1983
1.5721.566
August 1983
1.3361.246
0.19 1.230
September 1983
1.0280.17 .720
.090 .424
0.53.25.56.38
1.521.32
0.91.94.69
0.58.28.10
1 Total for 12 hours only.
In Smith Creek Valley, eddy-correlation measurements were taken in two areas, one covered predominantly by rabbitbrush and another by greasewood. Results of these measurements are compared in figure 10. The ET values for rabbitbrush were consistently higher than those for grease- wood. The two sites, which are less than 800 m apart, had mature stands of vegetation, but the rabbitbrush appeared much larger and more vigorous than the greasewood. Also, the greasewood seemed to emerge from winter dormancy later and become dormant earlier in the fall than the rabbit- brush.
Total ET during the 1983 active growing season (approx. 180 days) was estimated from daily averages obtained by each of the methods (tables 2 and 3). Pan-evap oration data is included for comparison.
Some problems arose during measurement of latent- heat flux. The energy-budget closure often showed a large deficit, and the Lyman alpha hygrometer used to measure vertical vapor flux malfunctioned. The performance of the source and detector tubes in the Lyman alpha hygrometer deteriorated over a period of time. E.P. Weeks and D.I. Stannard (U.S. Geological Survey, oral commun., 1983)
Data Summary 11

600
500
u 400
< 300
O£ 200LUa.co 100
I o
B
-100
-200
EBC
0000 0300 0600 0900 1200 1500 1800 2100 2400
HOUR
600
500
400
300
200
100
0
-100
0
-100
-200EBC
0000 0300 0600 0900 1200 1500 1800 2100 2400
HOUR
Figure 7. Heat flux determined by eddy-correlation method. A, Smith Creek Valley site, September 18, 1983 (total ET= 0.12 cm). B, Soda Lake site, July 7,1983 (total ET= 0.13 cm). EBC, energy-budget closure; G, soil-heat flux; H, sensible- heat flux; Rn , net radiation; XE, latent-heat flux.
suggested using a residual, or calculated, latent-heat flux along with or instead of a measured latent-heat flux. E.P. Weeks (written commun., 1985) also suggested that the measured and residual latent-heat-flux values represent the lower and upper boundaries, respectively, that bracket the actual latent-heat-flux values. Sensible-heat flux, soil-heat- flux, and net-radiation values, derived from field measure ments, are used in the energy-budget equation (eq. 1) to determine latent-heat flux as a residual. This method does
not allow determination of the energy-budget closure but does provide an alternative to using the Lyman alpha hygrometer to determine latent-heat flux.
ET values derived from measured and residual values of latent-heat flux are shown in figures 11 and 12 and in table 3. Average measured ET (-0.18 cm/d or 0.66 m/yr) corre lates well with average residual ET (-0.23 cm/d or 0.84 m/yr) for the Smith Creek Valley site, whereas the correla tion for the Soda Lake site is low. ET values measured at the Soda Lake site during 1983 averaged 0.10 cm/d or 0.37 m/yr. The residual-ET values for the Soda Lake site for 1983 aver aged about 0.16 cm/d or 0.58 m/yr.
An example of measured and residual latent-heat flux on an hourly basis for the Smith Creek Valley site is shown in figure 12. The area between the two curves shows the range of actual ET values.
Correlations
Of the values measured by both the Penman and eddy- correlation methods, the best correlations were between ET and solar radiation and between ET and net radiation as was found in many previous studies. Jensen and Haise (1963) suggested using the ratio of ET to solar radiation or ET to net radiation as a basis for predicting ET. This ratio would represent the combined effects of reflectance, net thermal radiation, sensible-heat flux, soil-heat flux, and other minor components. Also, it may be possible to esti mate ET for periods of time when no data were collected by using a ratio of actual to potential ET. Campbell (1977, p. 141) indicated that this was not a feasible method for esti mating ET: "ET is not functionally related to potential ET" because, when water availability is a limiting factor, the rate of water loss is controlled by the soil-plant system rather than by atmospheric factors. However, if the phreatophytes derive their water directly from ground-water storage, then atmospheric factors would continue to control water loss.
Regression analysis showed that the correlation coeffi cients for ET and solar radiation were 0.8 or higher; most of the coefficients were 0.9 or higher. Results typical of regres sion analyses for data collected at both sites are plotted in figure 13. The data used for the example analysis are from the Penman weather station at the Smith Creek Valley site; similar results were obtained by using data from the Penman weather station at Soda Lake. Analyses of the eddy-correla tion data (latent-heat flux and net radiation) from both sites also yielded similar results. The r 2 values (fig. 13), called coefficients of determination, indicate the proportion of the total variation of one variable that can be attributed to the relation with another variable (Freund, 1973, p. 421). The square root of the coefficient of determination is the correla tion coefficient (r) and is a "measure of the strength of the linear relationship between two variables" (Freund, 1973, p. 422). When r = 0, no linear relation exists; when r = ±l,a
12 Measurement of Evapotranspiration, West-Central Nevada
D
0> CO i o>
V>
U.
<DCD
' g.
co
TO
TA
LP
RE
CIP
ITA
TIO
N,
IN C
EN
TIM
ET
ER
SW
IND
SP
EE
D,
IN M
ET
ER
S P
ER
SE
CO
ND
RE
LAT
IVE
HU
MID
ITY
, IN
PE
RC
EN
TT
EM
PE
RA
TU
RE
, IN
DE
GR
EE
S C
ELS
IUS
SO
LAR
RA
DIA
TIO
N,
PO
TE
NT
IAL
IN J
OU
LES
PE
R
EV
AP
OT
RA
NS
PIR
AT
ION
,S
QU
AR
E C
EN
TIM
ET
ER
IN
CE
NT
IME
TE
RS
o -
~'
0.5
2.
0)
^ ^
CO
O
0)
!! !.
r
"^
i'||
P1?
CD c
"CO
(D
CO C
O 0)
S^ "
D-K
(D
O 3 il O
£D
o 5
CD
(D
*" T <<a
02.
0)
«f I
S.-Q
- o
§ -
O (Q
^
(D3
^
50)
(D
CO
OCO
CO
2.0
o!
I!?
31
0)
-«
APR
>-QDC UJQ.CO DCUJ
In^UJozz"o
DCQ.CO
DC
1UJ_l
gp
I.O
1.6
1.4
1.2
1.0
0.8
0.6
0.4
0.2
0
1 0.0
1.6
1.4
1.2
1.0
0.8
0.6
0.4
0.2
r\
A ' V
I/' ;' -^ / f s '" .
/ '' NX
S SN- */ T ---v < -
^/ v -J
i N x ^i* f! X ^ -
^---_, _ NS.II^ * j -
+.
^ i.ff Ai-~.~'iTl^._ A
?--v / '* *--,. ^*, ^^-/ , . "r--*
B/A
* ' v s
/'' y/l ^^
//\ V- t / / / \ 1
/' ' / v . Lt' +? 1 \» '^
/ 1 *N ^N
/ ! / "'"s - ^ s
/' i / %X N_ V' ^!r / ; i
" * '* / *N I"
f f"f vj ' s \ :
,'""' Li»
* "-^ A
i i i * ~"-"ii'MAY JUNE JULY
MONTHAUG SEPT
EXPLANATION
Penman data
Pan-evaporation data
Eddy-correlation data
A Bowen ratio data
Figure 9. Total daily evapotranspi ration for selected days during April through September 1983. A, Smith Creek Valley site. B, Soda Lake site.
0.14
0.12
H£ g 0.10
jr [i! 0.08
mg °-06 i O
^ 2H 0.04
0.0216 17 18
DATE
19 20
Figure 10. Total evapotranspiration estimated by eddy- correlation method for areas dominated by rabbitbrush (circle) and greasewood (square), September 16 and September 18-20, 1983, at Smith Creek Valley site.
14 Measurement of Evapotranspiration, West-Central Nevada

Table 3. Total evapotranspiration for 1983 derived from measured and residual values of latent-heat flux
[Values in meters per year]
Eddy- Site correlation
method
Measured evapotranspiration 1
Ps.n~ Bowen ratio Penman
method method evaP on method
Calculated 2 residual
evapotranspiration
Smith Creek Valley (rabbitbrush area).
Soda Lake.
0.32
.18
0.52
.27
2.00
1.78
1.60
1.11
0.41
.28
1 Annual values estimated by multiplying mean of full-day values (tables 1 and 2) by 180 days.2 Residual latent-heat flux divided by latent heat of vaporization.
0.5
0.4
SDC£ 0-3
CODC LJJ
(D
LJJ O
0.2
0.1
DC
& °< 0.3DC
5CL
§m 0.2
0.1
APR MAY JUNE JULY AUG SEPT
MONTH
Figure 11. Evapotranspiration values derived from measured latent-heat flux (squares) and from calculated residual latent-heat flux (circles) for selected days during April through September 1983. A, Smith Creek Valley site. B, Soda Lake site.
Data Summary 15

_l<Q COLJJcrQiQ LJJ
LL LJJI
DLJJK§LUyj
^£
zuu
150
100
50
i i i
Residual XE ^
r\ '/^\ _ ^^ s*-<- j \
k_ ..
N
1
^""\
v-^^ A^^-^
1 '
-
_\ . _ v /N
X^ >- * ^'v*.£ \^ ^ f Measured XE \ ^ ^v_;
UJ2
<|l
>
2
o
en
^r^- i i i
0000 0300 0600 0900 1200
1
1500
\^ \^«NX^
i i1800 2100 2400
HOUR
Figure 12. Measured (hourly) and residual latent-heat fluxCreek Valley site.
z"ob<ccQ_COZ
£§^LU
z"ofeeCC
CC
oIccLUQ_COCC LU
1H
LU
Z
CC
oCCLUCL
CL CO CO CCz -
11>
LU
II I
II I
Z
\j. if.
0.10
0.08
0.06
0.04
0.02
0
0.14
0.12
0.10
0.08
0.06
0.04
0.02
0
A
-
-
-
n
RT0
INJ
C
40
OULE
O O
0
-
-o
o
-> r*=0.94 -J 5=0.010
i i i i i I
z"o*CC Q_CO
|o
LU
80 120 160 200 240 280 320
SOLAR RADIATION,ES PER SQUARE CENTIMETER PER HOUR
CC
oQ-
LLJQ_ COCC LLJ
iPm
z
(XE) for September 18, 1983, at Smith
0.14
0.12
0.10
0.08
0.06
0.04 ti
B
,
A0.02 f
0 I '
0 40
A A -
A
A
A
-
_
r 2 =0.92 -
5=0.012
80 120 160 200 240 280 32
SOLAR RADIATION,IN JOULES PER SQUARE CENTIMETER PER HOUR
C_
_
"
-
_
;;10
C
40
A A -
A 0
O0
A
-
O.
o
^ r 2 =0.82 5=0.018
z"ob <ccCL COzCCCL
LU
80 120 160 200 240 280 320
CC
oICC LUCLCOCCLU
ii i
1LLJ
z
1.8
1.6
1.4
1.2
1.0
0.8
0.6
D
~
-
i
-i
2,000 2,200
IN JOULE
'
I |
-
i
B r 2 =0.745=0.18
i i i i
2,400 2,600 2,800 3,000 3,2
SOLAR RADIATION,3 PER SQUARE CENTIMETER PER DAY
SOLAR RADIATION, IN JOULES PER SQUARE CENTIMETER PER HOUR
Figure 13. Relation between potential evapotranspiration and solar radiation at Smith Creek Valley site, r2 , coefficient of determination; s, standard deviation. A through C, Hourly data, September 18,1983 (open circles: midnight-to-noon data; filled triangles: noon-to-midnight). D, Mean daily data for April through September 1983 (see table 1).
16 Measurement of Evapotranspiration, West-Central Nevada

perfect linear relation exists. Further statistical analysis with t distributions shows that the correlation coefficients are highly significant and indicate a strong cause-and-effect relation. Standard deviations (s) determined by the least- squares method are shown in figure 13.
The relation between hourly ET and solar radiation for a selected day at the Smith Creek Valley site is shown in figures 13A through 13C. (These data are also plotted against time in figure 7). In all three graphs, the high value of r indicates a strong correlation between hourly ET and solar radiation. Daily ET and daily solar radiation are plotted
in figure 13D; the data are for selected days at the Smith Creek Valley site (table 1). Although the points are scat tered, the r value indicates a good correlation between ET and solar radiation.
The relation between actual and potential ET at both sites is shown in figure 14A. Statistical analysis of the data indicates a strong correlation between actual and potential ET. The coefficients of correlation between daily total values of actual ET and potential ET were 0.86 and 0.93 for the Smith Creek Valley and Soda Lake sites, respectively (fig. 145).
0.30
O zHO
E < 0.25 Q. LL.co 51 z co < ztoe 0.20
cc
0.15
0.10
Oo 0.05
O
o
00
APR MAY JUNE JULY
MONTH
AUG SEPT
z"
p <<QFT* CL ii)CO Q.
rAPOTRAN IMETERS
_l HI< 0^ z
8
u.q-o
0.40
0.35
0.30
0.25
0.20
0.15
0.10
0.05
0
i i i i iB o
- 0 -
0
0
-
0
0o o o +
o 8 o + ++
1 1 + 1 1 1
EXPLANATION
o Smith Creek Valley site
+ Soda Lake site
0.6 0.8 1.0 1.2 1.4 1.6 POTENTIAL EVAPOTRANSPIRATION,
IN CENTIMETERS PER DAY
1.8
Figure 14. Relation between actual and potential evapotranspiration at Smith Creek Valley and Soda Lake sites for selected days, April through September 1983. A, Ratio of actual evapotranspiration to potential evapotran spiration. B, Actual evapotranspiration plotted against potential evapotranspiration.
Data Summary 17

The correlation between measured soil-heat flux and potential ET (as determined by the Penman method) was poor; correlation coefficients were 0.2 or lower for the Smith Creek Valley site. This problem was remedied by using an estimated soil-heat flux obtained by multiplying the net radi ation by a factor of 0.1 to 0.2, depending on the amount of bare soil present (Campbell, 1977, p. 137). The poor corre lation could have been the result of sand and soil blowing over the heat-flux plate and changing the depth at which measurements were being taken. Maintaining the desired depth was a constant problem at the Soda Lake site.
Transfer Value
Many factors have to be considered in evaluating the transfer value of the data derived by the methods described in this report, particularly the eddy-correlation method. An area's physical characteristics (such as depth to ground water, soil type, and salinity) and physiological character istics (such as species, species density, cover density, plant size, and plant maturity) must be taken into account. Also, wide variation in precipitation from one part of the Great Basin to another contributes to variations in ET. In general, the transferability of the ET values to areas of similar vege tation, climate, and water depths should be good, although this has not been proven. More field-data collection is needed to further analyze possible transfer value.
SUMMARY AND CONCLUSIONS
The eddy-correlation and Penman methods are efficient methods for determining actual and potential evapotran spiration under natural conditions. The Bowen ratio method, which has had more widespread application, is useful for comparison with the eddy-correlation method.
Actual ET at the Smith Creek Valley and Soda Lake sites, estimated by the eddy-correlation method, was 32 and 18 cm/yr, respectively. Precipitation at the two sites during 1983, an unusually wet year, was approximately 30 and 20 cm, respectively. Had precipitation been average or below, ET probably would have exceeded precipitation or would have exceeded it by a greater margin. These values indicate that most, if not all, the precipitation is lost through ET at these sites, emphasizing the importance of ET in the water budget and the need to establish reliable means of deter mining ET rates.
High correlations of ET with solar radiation could make it possible to extrapolate ET data to similar areas where solar- or net-radiation data are collected.
The accuracy of the techniques and the simplicity and mobility of the instrumentation systems provide versatility not previously available and can provide valuable data in areas where ground water is a significant resource.
REFERENCES CITED
Brutsaert, W.H., 1982, Evaporation into the atmosphere: Boston, D. Reidel, 299 p.
Campbell, G.S., 1977, An introduction to environmental biophys ics: New York, Springer-Verlag, 159 p.
Freund, I.E., 1973, Modern elementary statistics: New Jersey, Prentice-Hall, 532 p.
Fritschen, L.J., and Gay, L.W., 1979, Environmental instrumenta tion: New York, Springer-Verlag, 216 p.
Hanks, R.J., and Ashcroft, G.L., 1980, Applied soil physics Soil- water and temperature applications: New York, Springer- Verlag, 159 p.
Hanson, R.L., and Dawdy, D.R., 1976, Accuracy of evapo transpiration rates determined by the water-budget method, Gila River flood plain, southeastern Arizona: U.S. Geological Survey Professional Paper 655-L, 40 p.
Jensen, M.E., and Haise, H.R., 1963, Estimating evapotranspiration from solar radiation: American Society of Civil Engineer ing, Journal of the Irrigation and Drainage Division, v. 89, p. 15-41.
National Oceanic and Atmospheric Administration, 1983, Climato- logical data, Nevada: U.S. Department of Commerce, v. 98, nos. 1-12, 253 p.
Penman, H.L., 1948, Natural evaporation from open water, bare soil, and grass: Proceedings of the Royal Society of London, v. 193, p. 120-145.
Pennington, R.W., 1980, Evaluation of empirical methods for estimating crop water consumptive use for selected sites in Nevada: Nevada Division of Water Planning Report 3, 206 p.
Robinson, T.W., 1970, Evapotranspiration by woody phreato- phytes in the Humboldt River Valley near Winnemucca, Nevada: U.S. Geological Survey Professional Paper 491-D, 12 p.
Schwerdtfeger, Peter, 1976, Physical principles of micrometeor- ological measurements, v. 6 of Developments in Atmospheric Science: New York, Elsevier, 113 p.
Van Hylckama, T.E.A., 1980, Weather and evapotranspiration studies in a saltcedar thicket, Arizona: U.S. Geological Sur vey Professional Paper 491-F, 53 p.
Wilson, R.G., and Rouse, W.R., 1971, Moisture and temperature equilibrium evapotranspiration model: Journal of Applied Meteorology, v. 11, p. 436-442.
18 Measurement of Evapotranspiration, West-Central Nevada
Recommended