
New York State Thruway Authority
New York State Canal Corporation
Monthly Financial Report
May 2014
TABLE OF CONTENTS
PAGE
STATEMENT OF REVENUES, EXPENSES AND CHANGES IN NET ASSETS 1
STATEMENT OF NET POSITION 5
STATEMENT OF CASH FLOWS 7
FUNDS AVAILABLE FOR TRANSFER 9
COMPARATIVE SUMMARY STATEMENT OF DEPARTMENT OPERATING EXPENSES AND BUDGET 11
REVENUES, OPERATING EXPENSES AND BUDGET COMPARISON STATEMENT CANAL CORPORATION & CANAL DEVELOPMENT FUND 12
CAPITAL PROGRAM SUMMARY 13
NEW NY BRIDGE PROJECT 14
GROSS SALES OF RESTAURANTS 15
GALLONS OF MOTOR FUEL DELIVERED TO GAS STATIONS 16
DEBT SERVICE 17
NOTES TO FINANCIAL REPORT 18
June 25, 2014
MONTH
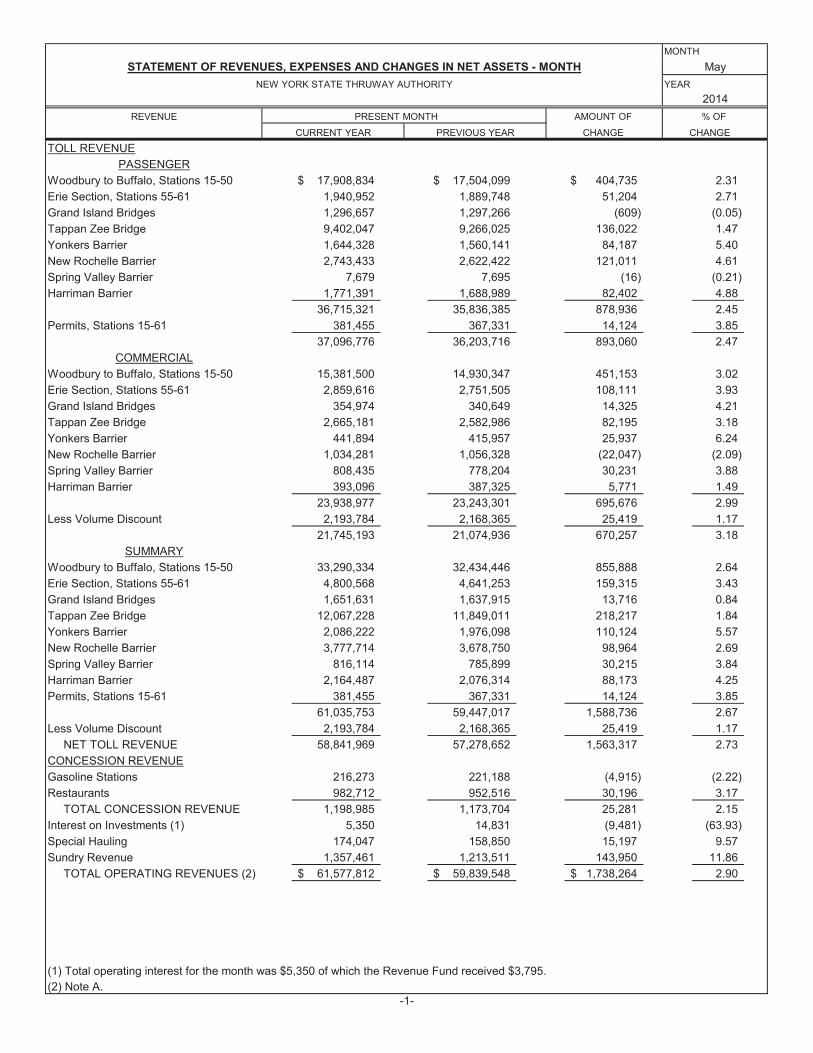
STATEMENT OF REVENUES, EXPENSES AND CHANGES IN NET ASSETS - MONTH May
NEW YORK STATE THRUWAY AUTHORITY YEAR
2014
REVENUE PRESENT MONTH AMOUNT OF % OF
CURRENT YEAR PREVIOUS YEAR CHANGE CHANGE
TOLL REVENUE
PASSENGER
Woodbury to Buffalo, Stations 15-50 17,908,834$ 17,504,099$ 404,735$ 2.31
Erie Section, Stations 55-61 1,940,952 1,889,748 51,204 2.71
Grand Island Bridges 1,296,657 1,297,266 (609) (0.05)
Tappan Zee Bridge 9,402,047 9,266,025 136,022 1.47
Yonkers Barrier 1,644,328 1,560,141 84,187 5.40
New Rochelle Barrier 2,743,433 2,622,422 121,011 4.61
Spring Valley Barrier 7,679 7,695 (16) (0.21)
Harriman Barrier 1,771,391 1,688,989 82,402 4.88
36,715,321 35,836,385 878,936 2.45
Permits, Stations 15-61 381,455 367,331 14,124 3.85
37,096,776 36,203,716 893,060 2.47
COMMERCIAL
Woodbury to Buffalo, Stations 15-50 15,381,500 14,930,347 451,153 3.02
Erie Section, Stations 55-61 2,859,616 2,751,505 108,111 3.93
Grand Island Bridges 354,974 340,649 14,325 4.21
Tappan Zee Bridge 2,665,181 2,582,986 82,195 3.18
Yonkers Barrier 441,894 415,957 25,937 6.24
New Rochelle Barrier 1,034,281 1,056,328 (22,047) (2.09)
Spring Valley Barrier 808,435 778,204 30,231 3.88
Harriman Barrier 393,096 387,325 5,771 1.49
23,938,977 23,243,301 695,676 2.99
Less Volume Discount 2,193,784 2,168,365 25,419 1.17
21,745,193 21,074,936 670,257 3.18
SUMMARY
Woodbury to Buffalo, Stations 15-50 33,290,334 32,434,446 855,888 2.64
Erie Section, Stations 55-61 4,800,568 4,641,253 159,315 3.43
Grand Island Bridges 1,651,631 1,637,915 13,716 0.84
Tappan Zee Bridge 12,067,228 11,849,011 218,217 1.84
Yonkers Barrier 2,086,222 1,976,098 110,124 5.57
New Rochelle Barrier 3,777,714 3,678,750 98,964 2.69
Spring Valley Barrier 816,114 785,899 30,215 3.84
Harriman Barrier 2,164,487 2,076,314 88,173 4.25
Permits, Stations 15-61 381,455 367,331 14,124 3.85
61,035,753 59,447,017 1,588,736 2.67
Less Volume Discount 2,193,784 2,168,365 25,419 1.17
NET TOLL REVENUE 58,841,969 57,278,652 1,563,317 2.73
CONCESSION REVENUE
Gasoline Stations 216,273 221,188 (4,915) (2.22)
Restaurants 982,712 952,516 30,196 3.17
TOTAL CONCESSION REVENUE 1,198,985 1,173,704 25,281 2.15
Interest on Investments (1) 5,350 14,831 (9,481) (63.93)
Special Hauling 174,047 158,850 15,197 9.57
Sundry Revenue 1,357,461 1,213,511 143,950 11.86
TOTAL OPERATING REVENUES (2) 61,577,812$ 59,839,548$ 1,738,264$ 2.90
(1) Total operating interest for the month was $5,350 of which the Revenue Fund received $3,795.
(2) Note A.-1-
MONTH
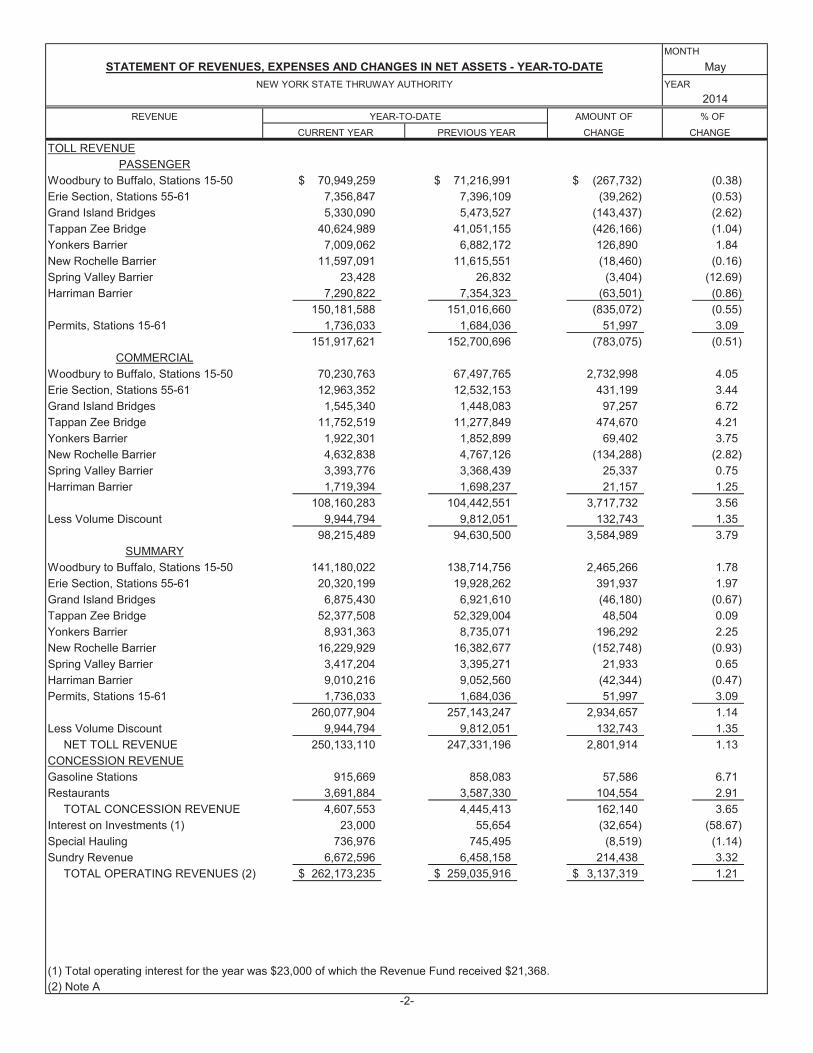
STATEMENT OF REVENUES, EXPENSES AND CHANGES IN NET ASSETS - YEAR-TO-DATE May
NEW YORK STATE THRUWAY AUTHORITY YEAR
2014
REVENUE YEAR-TO-DATE AMOUNT OF % OF
CURRENT YEAR PREVIOUS YEAR CHANGE CHANGE
TOLL REVENUE
PASSENGER
Woodbury to Buffalo, Stations 15-50 70,949,259$ 71,216,991$ (267,732)$ (0.38)
Erie Section, Stations 55-61 7,356,847 7,396,109 (39,262) (0.53)
Grand Island Bridges 5,330,090 5,473,527 (143,437) (2.62)
Tappan Zee Bridge 40,624,989 41,051,155 (426,166) (1.04)
Yonkers Barrier 7,009,062 6,882,172 126,890 1.84
New Rochelle Barrier 11,597,091 11,615,551 (18,460) (0.16)
Spring Valley Barrier 23,428 26,832 (3,404) (12.69)
Harriman Barrier 7,290,822 7,354,323 (63,501) (0.86)
150,181,588 151,016,660 (835,072) (0.55)
Permits, Stations 15-61 1,736,033 1,684,036 51,997 3.09
151,917,621 152,700,696 (783,075) (0.51)
COMMERCIAL
Woodbury to Buffalo, Stations 15-50 70,230,763 67,497,765 2,732,998 4.05
Erie Section, Stations 55-61 12,963,352 12,532,153 431,199 3.44
Grand Island Bridges 1,545,340 1,448,083 97,257 6.72
Tappan Zee Bridge 11,752,519 11,277,849 474,670 4.21
Yonkers Barrier 1,922,301 1,852,899 69,402 3.75
New Rochelle Barrier 4,632,838 4,767,126 (134,288) (2.82)
Spring Valley Barrier 3,393,776 3,368,439 25,337 0.75
Harriman Barrier 1,719,394 1,698,237 21,157 1.25
108,160,283 104,442,551 3,717,732 3.56
Less Volume Discount 9,944,794 9,812,051 132,743 1.35
98,215,489 94,630,500 3,584,989 3.79
SUMMARY
Woodbury to Buffalo, Stations 15-50 141,180,022 138,714,756 2,465,266 1.78
Erie Section, Stations 55-61 20,320,199 19,928,262 391,937 1.97
Grand Island Bridges 6,875,430 6,921,610 (46,180) (0.67)
Tappan Zee Bridge 52,377,508 52,329,004 48,504 0.09
Yonkers Barrier 8,931,363 8,735,071 196,292 2.25
New Rochelle Barrier 16,229,929 16,382,677 (152,748) (0.93)
Spring Valley Barrier 3,417,204 3,395,271 21,933 0.65
Harriman Barrier 9,010,216 9,052,560 (42,344) (0.47)
Permits, Stations 15-61 1,736,033 1,684,036 51,997 3.09
260,077,904 257,143,247 2,934,657 1.14
Less Volume Discount 9,944,794 9,812,051 132,743 1.35
NET TOLL REVENUE 250,133,110 247,331,196 2,801,914 1.13
CONCESSION REVENUE
Gasoline Stations 915,669 858,083 57,586 6.71
Restaurants 3,691,884 3,587,330 104,554 2.91
TOTAL CONCESSION REVENUE 4,607,553 4,445,413 162,140 3.65
Interest on Investments (1) 23,000 55,654 (32,654) (58.67)
Special Hauling 736,976 745,495 (8,519) (1.14)
Sundry Revenue 6,672,596 6,458,158 214,438 3.32
TOTAL OPERATING REVENUES (2) 262,173,235$ 259,035,916$ 3,137,319$ 1.21
(1) Total operating interest for the year was $23,000 of which the Revenue Fund received $21,368.
(2) Note A-2-

Total Operating Revenues 61,577,812$ 59,839,548$ 1,738,264$ 2.90
Thruway Operating Expenses
Administrative and General 1,696,192 1,150,350 545,842 47.45
Engineering Services 739,968 558,720 181,248 32.44
Maintenance Engineering
Thruway Maintenance 6,435,770 5,008,401 1,427,369 28.50
Equipment Maintenance 2,617,736 2,524,864 92,872 3.68
Finance and Accounts 647,631 668,318 (20,687) (3.10)
Operations
Traffic and Services 569,127 818,573 (249,446) (30.47)
Toll Collection 2,984,737 3,045,602 (60,865) (2.00)
General Charges Undistributed 10,055,751 7,723,623 2,332,128 30.19
Total Thruway Operating Expenses 25,746,912 21,498,451 4,248,461 19.76
OAP Operating Expenses
Canal Corporation 5,421,993 5,461,937 (39,944) (0.73)
Total OAP Operating Expenses 5,421,993 5,461,937 (39,944) (0.73)
Operating Income before
Depreciation 30,408,907 32,879,160 (2,470,253) (7.51)
Thruway Depreciation 28,355,403 25,439,673 2,915,730 11.46
Canal Depreciation 756,774 703,301 53,473 7.60
Operating Gain (Loss) 1,296,730 6,736,186 (5,439,456) (80.75)
Non-Operating Revenue (Expenses)
Federal aid and other reimbursements - 35,012 (35,012) (100.00)
Interest on Investments (1) 57,542 89,113 (31,571) (35.43)
Interest & Fee Expenses (13,682,092) (12,164,294) (1,517,798) 12.48
Debt Issuance Costs - - - -
Miscellaneous - 509 (509) (100.00)
Net Non-Operating Revenue (Expenses) (13,624,550) (12,039,660) (1,584,890) 13.16
Expenses and Transfers (12,327,820) (5,303,474) (7,024,346) 132.45
Capital Contributions - 109,921 (109,921) (100.00)
Change in Net Assets (12,327,820) (5,193,553) (7,134,267) 137.37
Total Net Assets, Beginning Balance 1,455,851,887 1,611,712,643 (155,860,756) (9.67)
Total Net Assets, Ending Balance 1,443,524,067$ 1,606,519,090$ (162,995,023)$ (10.15)
(1) Total non-operating interest on investments for the month was $57,542 of which the Revenue Fund received $10,151.
% OF
2014
YEAR
May
-3-
NEW YORK STATE THRUWAY AUTHORITY
STATEMENT OF REVENUES, EXPENSES AND CHANGES IN NET ASSETS - MONTH
EXPENSES
PRESENT MONTH AMOUNT OF
CHANGE
Gain (Loss) before other Revenue,
MONTH
CURRENT YEAR PREVIOUS YEAR CHANGE
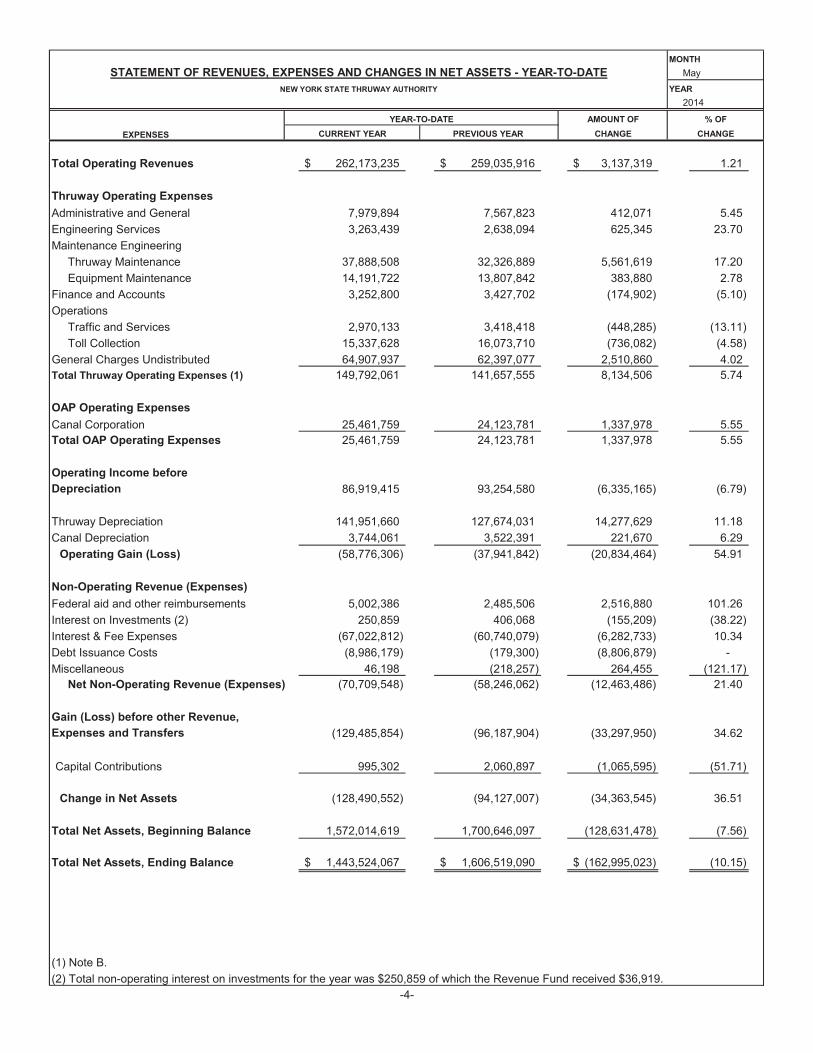
Total Operating Revenues 262,173,235$ 259,035,916$ 3,137,319$ 1.21
Thruway Operating Expenses
Administrative and General 7,979,894 7,567,823 412,071 5.45
Engineering Services 3,263,439 2,638,094 625,345 23.70
Maintenance Engineering
Thruway Maintenance 37,888,508 32,326,889 5,561,619 17.20
Equipment Maintenance 14,191,722 13,807,842 383,880 2.78
Finance and Accounts 3,252,800 3,427,702 (174,902) (5.10)
Operations
Traffic and Services 2,970,133 3,418,418 (448,285) (13.11)
Toll Collection 15,337,628 16,073,710 (736,082) (4.58)
General Charges Undistributed 64,907,937 62,397,077 2,510,860 4.02
Total Thruway Operating Expenses (1) 149,792,061 141,657,555 8,134,506 5.74
OAP Operating Expenses
Canal Corporation 25,461,759 24,123,781 1,337,978 5.55
Total OAP Operating Expenses 25,461,759 24,123,781 1,337,978 5.55
Operating Income before
Depreciation 86,919,415 93,254,580 (6,335,165) (6.79)
Thruway Depreciation 141,951,660 127,674,031 14,277,629 11.18
Canal Depreciation 3,744,061 3,522,391 221,670 6.29
Operating Gain (Loss) (58,776,306) (37,941,842) (20,834,464) 54.91
Non-Operating Revenue (Expenses)
Federal aid and other reimbursements 5,002,386 2,485,506 2,516,880 101.26
Interest on Investments (2) 250,859 406,068 (155,209) (38.22)
Interest & Fee Expenses (67,022,812) (60,740,079) (6,282,733) 10.34
Debt Issuance Costs (8,986,179) (179,300) (8,806,879) -
Miscellaneous 46,198 (218,257) 264,455 (121.17)
Net Non-Operating Revenue (Expenses) (70,709,548) (58,246,062) (12,463,486) 21.40
Expenses and Transfers (129,485,854) (96,187,904) (33,297,950) 34.62
Capital Contributions 995,302 2,060,897 (1,065,595) (51.71)
Change in Net Assets (128,490,552) (94,127,007) (34,363,545) 36.51
Total Net Assets, Beginning Balance 1,572,014,619 1,700,646,097 (128,631,478) (7.56)
Total Net Assets, Ending Balance 1,443,524,067$ 1,606,519,090$ (162,995,023)$ (10.15)
(1) Note B.
(2) Total non-operating interest on investments for the year was $250,859 of which the Revenue Fund received $36,919.
YEAR
MONTH
EXPENSES
STATEMENT OF REVENUES, EXPENSES AND CHANGES IN NET ASSETS - YEAR-TO-DATE
NEW YORK STATE THRUWAY AUTHORITY
-4-
CHANGE
YEAR-TO-DATE AMOUNT OF
CHANGE
% OF
Gain (Loss) before other Revenue,
May
2014
CURRENT YEAR PREVIOUS YEAR

AS OF
STATEMENT OF NET POSITION May 31
NEW YORK STATE THRUWAY AUTHORITY YEAR
2014
REVENUE FUND OPERATING
FUND
OAP OPERATING
FUNDS
DEBT SERVICE FUNDS
ASSETS
Current Assets:
Cash & cash equivalents 83,662,425$ 15,029,616$ 17,903,976$ 42,494,210$Investments 30,125,829 24,820,392 - 242,522,923Interest receivable on investments 73,307 - - 270,003Accounts receivable, net 27,656,733 20,496,344 4,805,883 -Due from other funds - 41,979,588 - -Material and other inventory - 15,612,696 - -Prepaid insurance and expenses - 1,558,547 9,911 730,826
Total current assets 141,518,294 119,497,183 22,719,770 286,017,962
Capital Assets:Land & land improvements - - - -Construction in progress - - - -Thruway system - - - -Canal system - - - -Equipment - - - -Less: accumulated depreciation - - - -
Net capital assets - - - -Total Assets 141,518,294 119,497,183 22,719,770 286,017,962
DEFERRED OUTFLOWS
Loss on bond refundings - - - -Total Deferred Outflows - - - -
LIABILITIESCurrent Liabilities:
Accounts payable and accrued expenses 69,220,833 24,310,814 2,109,495 -Accrued wages and benefits - 10,037,599 1,723,568 -Due to other funds 7,272,492 - 5,889,584 -Unearned revenue 61,673,784 - - -Accrued interest payable - - - 67,411,283
Current amount due on bonds, notes and
loans - - - - Total Current Liabilities 138,167,109 34,348,413 9,722,647 67,411,283
Long-Term Liabilities:Accounts payable and accrued expenses - 308,449,237 66,917,650 -General revenue bonds, net of unamortized premiums - - - -General revenue JIO, net of unamortized premiums (1) - - - -Loans payable - - - -
Total Long-Term Liabilities - 308,449,237 66,917,650 -Total Liabilities 138,167,109 342,797,650 76,640,297 67,411,283
NET POSITIONNet investment in capital assets - - - -Restricted for debt service - - - 218,606,679Restricted for capital - - - -Unrestricted 3,351,185 (223,300,467) (53,920,527) -
Total Net Position 3,351,185$ (223,300,467)$ (53,920,527)$ 218,606,679$
(1) JIO - Junior Indebtedness Obligation. -5-
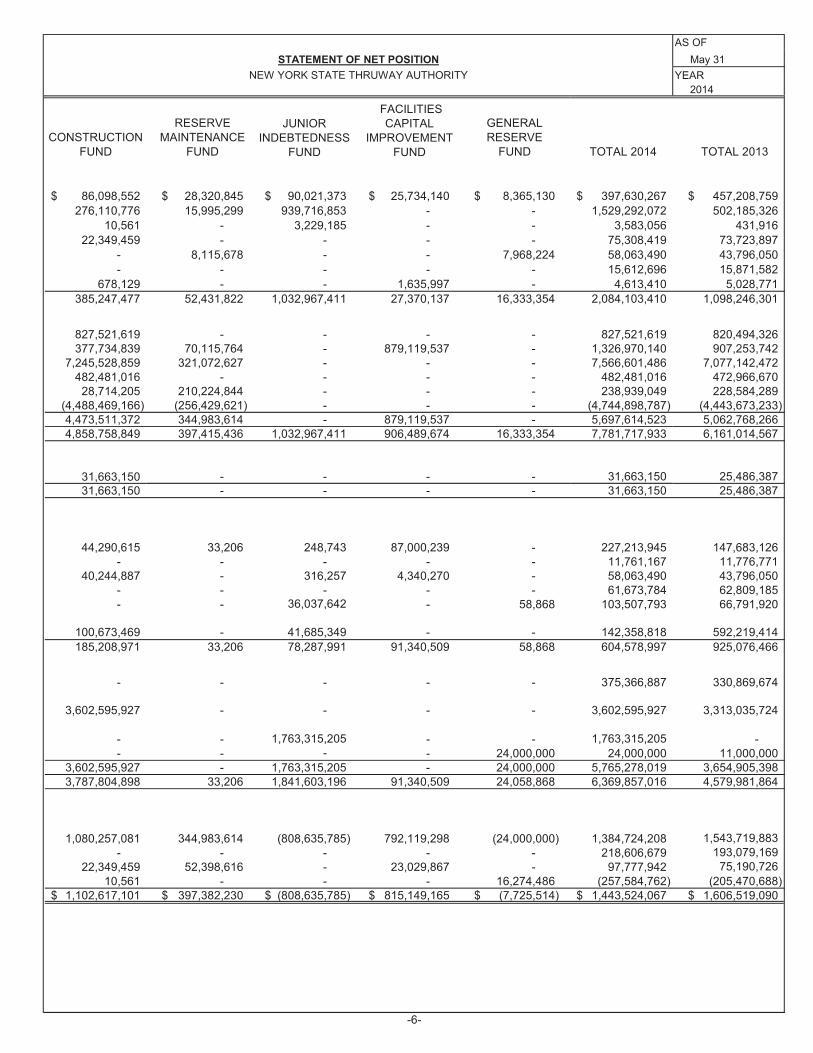
AS OF
May 31
YEAR
2014
CONSTRUCTION FUND
RESERVEMAINTENANCE
FUND
GENERAL RESERVE
FUND TOTAL 2014 TOTAL 2013
86,098,552$ 28,320,845$ 90,021,373$ 25,734,140$ 8,365,130$ 397,630,267$ 457,208,759$
276,110,776 15,995,299 939,716,853 - - 1,529,292,072 502,185,326
10,561 - 3,229,185 - - 3,583,056 431,916
22,349,459 - - - - 75,308,419 73,723,897
- 8,115,678 - - 7,968,224 58,063,490 43,796,050
- - - - - 15,612,696 15,871,582
678,129 - - 1,635,997 - 4,613,410 5,028,771
385,247,477 52,431,822 1,032,967,411 27,370,137 16,333,354 2,084,103,410 1,098,246,301
827,521,619 - - - - 827,521,619 820,494,326377,734,839 70,115,764 - 879,119,537 - 1,326,970,140 907,253,742
7,245,528,859 321,072,627 - - - 7,566,601,486 7,077,142,472482,481,016 - - - - 482,481,016 472,966,670
28,714,205 210,224,844 - - - 238,939,049 228,584,289(4,488,469,166) (256,429,621) - - - (4,744,898,787) (4,443,673,233)4,473,511,372 344,983,614 - 879,119,537 - 5,697,614,523 5,062,768,2664,858,758,849 397,415,436 1,032,967,411 906,489,674 16,333,354 7,781,717,933 6,161,014,567
31,663,150 - - - - 31,663,150 25,486,38731,663,150 - - - - 31,663,150 25,486,387
44,290,615 33,206 248,743 87,000,239 - 227,213,945 147,683,126- - - - - 11,761,167 11,776,771
40,244,887 - 316,257 4,340,270 - 58,063,490 43,796,050- - - - - 61,673,784 62,809,185- - 36,037,642 - 58,868 103,507,793 66,791,920
100,673,469 - 41,685,349 - - 142,358,818 592,219,414
185,208,971 33,206 78,287,991 91,340,509 58,868 604,578,997 925,076,466
- - - - - 375,366,887 330,869,674
3,602,595,927 - - - - 3,602,595,927 3,313,035,724
- - 1,763,315,205 - - 1,763,315,205 -- - - - 24,000,000 24,000,000 11,000,000
3,602,595,927 - 1,763,315,205 - 24,000,000 5,765,278,019 3,654,905,3983,787,804,898 33,206 1,841,603,196 91,340,509 24,058,868 6,369,857,016 4,579,981,864
1,080,257,081 344,983,614 (808,635,785) 792,119,298 (24,000,000) 1,384,724,208 1,543,719,883
- - - - - 218,606,679 193,079,169
22,349,459 52,398,616 - 23,029,867 - 97,777,942 75,190,726
10,561 - - - 16,274,486 (257,584,762) (205,470,688)1,102,617,101$ 397,382,230$ (808,635,785)$ 815,149,165$ (7,725,514)$ 1,443,524,067$ 1,606,519,090$
STATEMENT OF NET POSITION
NEW YORK STATE THRUWAY AUTHORITY
JUNIOR INDEBTEDNESS
FUND
FACILITIES CAPITAL
IMPROVEMENT FUND
-6-
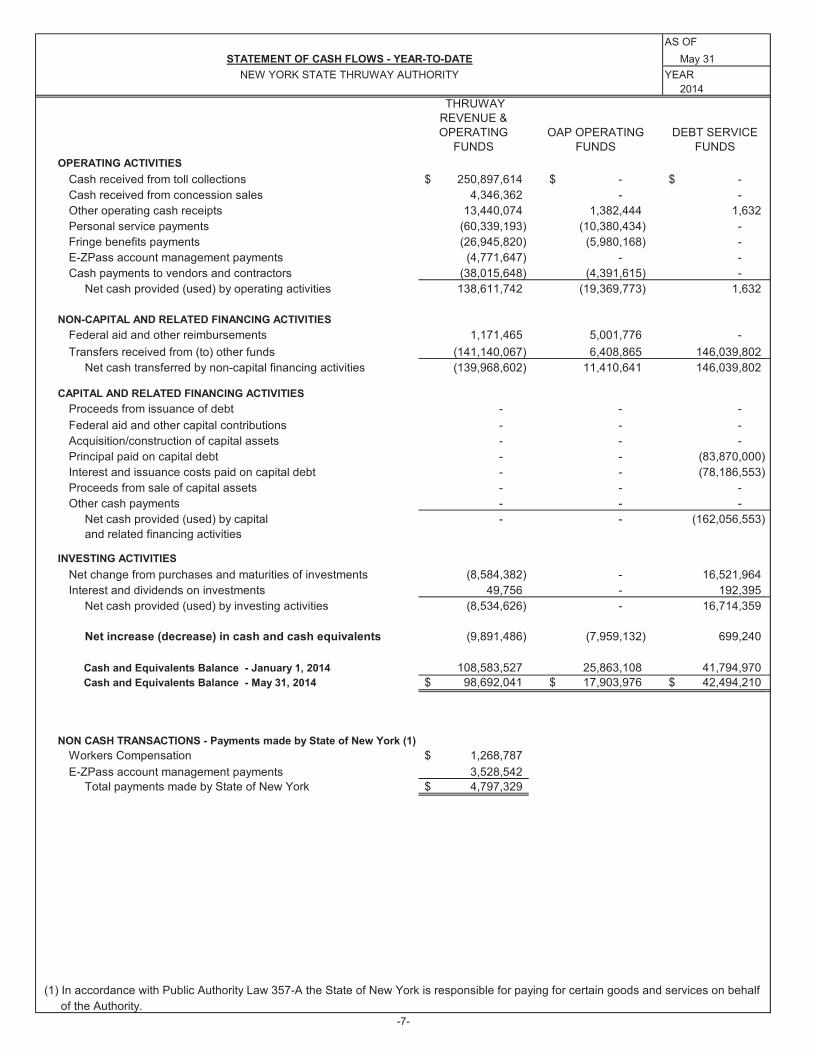
AS OF
STATEMENT OF CASH FLOWS - YEAR-TO-DATE May 31
NEW YORK STATE THRUWAY AUTHORITY YEAR
2014
THRUWAY REVENUE & OPERATING
FUNDS OAP OPERATING
FUNDSDEBT SERVICE
FUNDS
OPERATING ACTIVITIES
Cash received from toll collections 250,897,614$ -$ -$
Cash received from concession sales 4,346,362 - -
Other operating cash receipts 13,440,074 1,382,444 1,632
Personal service payments (60,339,193) (10,380,434) -
Fringe benefits payments (26,945,820) (5,980,168) -
E-ZPass account management payments (4,771,647) - -
Cash payments to vendors and contractors (38,015,648) (4,391,615) -
Net cash provided (used) by operating activities 138,611,742 (19,369,773) 1,632
NON-CAPITAL AND RELATED FINANCING ACTIVITIES
Federal aid and other reimbursements 1,171,465 5,001,776 -
Transfers received from (to) other funds (141,140,067) 6,408,865 146,039,802
Net cash transferred by non-capital financing activities (139,968,602) 11,410,641 146,039,802
CAPITAL AND RELATED FINANCING ACTIVITIES
Proceeds from issuance of debt - - -
Federal aid and other capital contributions - - -
Acquisition/construction of capital assets - - -
Principal paid on capital debt - - (83,870,000)
Interest and issuance costs paid on capital debt - - (78,186,553)
Proceeds from sale of capital assets - - -
Other cash payments - - -
Net cash provided (used) by capital - - (162,056,553)
and related financing activities
INVESTING ACTIVITIES
Net change from purchases and maturities of investments (8,584,382) - 16,521,964
Interest and dividends on investments 49,756 - 192,395
Net cash provided (used) by investing activities (8,534,626) - 16,714,359
Net increase (decrease) in cash and cash equivalents (9,891,486) (7,959,132) 699,240
Cash and Equivalents Balance - January 1, 2014 108,583,527 25,863,108 41,794,970
Cash and Equivalents Balance - May 31, 2014 98,692,041$ 17,903,976$ 42,494,210$
Workers Compensation 1,268,787$
E-ZPass account management payments 3,528,542
Total payments made by State of New York 4,797,329$
(1) In accordance with Public Authority Law 357-A the State of New York is responsible for paying for certain goods and services on behalf
of the Authority.
-7-
NON CASH TRANSACTIONS - Payments made by State of New York (1)

AS OF
May 31
YEAR
2014
RESERVEMAINTENANCE
FUND
FACILITIES CAPITAL
IMPROVEMENT FUND
GENERAL RESERVE
FUND TOTAL 2014 TOTAL 2013
-$ -$ -$ -$ -$ 250,897,614$ 258,708,382$
- - - - - 4,346,362 4,263,646
7,924 - 4,950 - - 14,837,024 7,163,853
- - - - - (70,719,627) (72,411,205)
- - - - - (32,925,988) (33,038,481)
- - - - - (4,771,647) (4,886,422)
- - - - - (42,407,263) (31,844,219)
7,924 - 4,950 - - 119,256,475 127,955,554
- - - - - 6,173,241 9,387,954
7,293,039 1,264,205 (178,886,765) 180,608,870 (21,587,949) - -
7,293,039 1,264,205 (178,886,765) 180,608,870 (21,587,949) 6,173,241 9,387,954
732,409,174 - - - 13,000,000 745,409,174 503,930,000
5,288,272 22,910 - - - 5,311,182 9,124,701
(50,671,560) (22,453,681) - (180,684,887) - (253,810,128) (242,782,081)
(350,349,321) - - - - (434,219,321) (61,795,000)
(8,889,892) - (311,371) (24,226) (160,540) (87,572,582) (78,449,201)
- 14,000 - - - 14,000 166,669
- - - - - - -
327,786,673 (22,416,771) (311,371) (180,709,113) 12,839,460 (24,867,675) 130,195,088
(275,999,422) (15,995,299) 56,987,498 - - (227,069,641) (211,405,681)
38,345 - 102,761 - - 383,257 624,973
(275,961,077) (15,995,299) 57,090,259 - - (226,686,384) (210,780,708)
59,126,559 (37,147,865) (122,102,927) (100,243) (8,748,489) (126,124,343) 56,757,888
26,971,993 65,468,710 212,124,300 25,834,383 17,113,619 523,754,610 400,450,871
86,098,552$ 28,320,845$ 90,021,373$ 25,734,140$ 8,365,130$ 397,630,267$ 457,208,759$
Reconciliation of operating income (loss) to net cash
provided (used) by operating activities:
Operating income (loss) (58,776,306)$ (37,941,842)$
Depreciation expense 145,695,721 131,196,422
Elimination of interest earnings on Debt Proceeds 29,128 30,482
Receivables 2,090,485 (3,764,345)
Inventories (860) 334,288
Prepaid insurances & expenses 8,248,474 7,505,015
Accounts and other payables 21,350,862 19,723,315
Accrued wages and benefits 3,941,814 7,187,173
Unearned income (3,322,843) 3,685,046
Net cash provided by operating activities 119,256,475$ 127,955,554$
-8-
STATEMENT OF CASH FLOWS - YEAR-TO-DATE
NEW YORK STATE THRUWAY AUTHORITY
CONSTRUCTION FUND
JUNIOR INDEBTEDNESS
FUND

TOLL REVENUE, CONCESSION REVENUE
AND OTHER REVENUES 61,586,408$ 59,889,218$
Adjustment to Cash Basis (184,861) (206,709)
Retained for Debt Service Requirement - -
Revenue Retained from 2012 - -
Revenue Retained from 2013 - -
NET REMAINING CASH REVENUE 61,401,547 59,682,509
Less: Transfer to Thruway Operating Fund (1) 22,451,916 17,885,400
Transfer to Public Liability Claims Reserve - -
Transfer to Environmental Remediation Reserve - -
Retained for 2013 Operating Reserve - -
Retained for 2014 Operating Reserve - -
Retained for Debt Service Requirement - -
Debt Service Requirement for
General Revenue Bonds 21,113,684 19,979,523
NET CASH REVENUES AVAILABLE
FOR TRANSFER TO OTHER FUNDS 17,835,947$ 21,817,586$
TRANSFERS:
Reserve Maintenance Fund 9,000,000 11,000,000
Other Authority Projects-
Operating Fund 3,000,000 6,000,000
Facilities Capital Improvement Fund - -
General Reserve Fund 5,835,947 4,817,586
NET CASH REVENUES REMAINING
AFTER TRANSFERS TO OTHER FUNDS -$ -$
(1) Excludes Claims and Indemnity expense $0, which is funded via transfers to the Public Liability Claims Reserve,
Environmental Remediation expense of $15,079, which is funded via transfers to the Environmental Remediation Reserve
and Unfunded Retiree Health Insurance expense of $3,279,917. See Note C for additional information regarding Unfunded
Retiree Health Insurance.
MONTH
FUNDS AVAILABLE FOR TRANSFER - MONTH May
NEW YORK STATE THRUWAY AUTHORITY YEAR
2014
-9-
PRESENT MONTH
CURRENT YEAR PREVIOUS YEAR

TOLL REVENUE, CONCESSION REVENUE
AND OTHER REVENUES 262,208,522$ 259,270,729$
Adjustment to Cash Basis 297,992 (86,632)
Retained for Debt Service Requirement - -
Revenue Retained from 2012 - 14,321,118
Revenue Retained from 2013 3,593,230 -
NET REMAINING CASH REVENUE 266,099,744 273,505,215
Less: Transfer to Thruway Operating Fund (1) 133,455,782 123,560,403
Transfer to Public Liability Claims Reserve - -
Transfer to Environmental Remediation Reserve - -
Retained for 2013 Operating Reserve - -
Retained for 2014 Operating Reserve - -
Retained for Debt Service Requirement - -
Debt Service Requirement for
General Revenue Bonds 105,822,370 99,959,291
NET CASH REVENUES AVAILABLE
FOR TRANSFER TO OTHER FUNDS 26,821,592$ 49,985,521$
TRANSFERS:
Reserve Maintenance Fund 7,900,586 25,000,000
Other Authority Projects-
Operating Fund 8,720,004 16,638,270
Facilities Capital Improvement Fund - 1,529,665
General Reserve Fund 10,201,002 6,817,586
NET CASH REVENUES REMAINING
AFTER TRANSFERS TO OTHER FUNDS -$ -$
(1) Excludes Claims and Indemnity expense of ($200,704), which is funded via transfers to the Public Liability Claims Reserve,
Environmental Remediation expense of $137,402, which is funded via transfers to the Environmental Remediation Reserve
and Unfunded Retiree Health Insurance expense of $16,399,581. See Note C for additional information regarding Unfunded
Retiree Health Insurance.
MONTH
FUNDS AVAILABLE FOR TRANSFER - YEAR-TO-DATE May
NEW YORK STATE THRUWAY AUTHORITY YEAR
2014
PREVIOUS YEAR
-10-
YEAR-TO-DATE
CURRENT YEAR
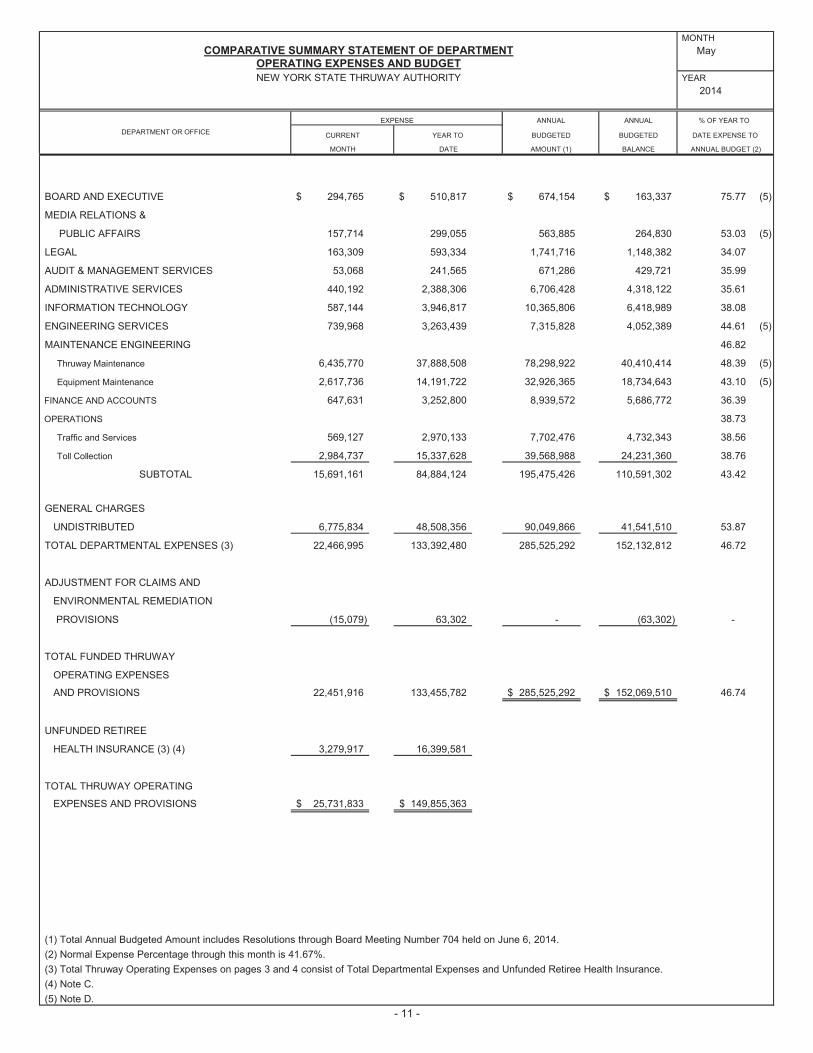
BOARD AND EXECUTIVE 294,765$ 510,817$ 674,154$ 163,337$ 75.77 (5)
MEDIA RELATIONS &
PUBLIC AFFAIRS 157,714 299,055 563,885 264,830 53.03 (5)
LEGAL 163,309 593,334 1,741,716 1,148,382 34.07
AUDIT & MANAGEMENT SERVICES 53,068 241,565 671,286 429,721 35.99
ADMINISTRATIVE SERVICES 440,192 2,388,306 6,706,428 4,318,122 35.61
INFORMATION TECHNOLOGY 587,144 3,946,817 10,365,806 6,418,989 38.08
ENGINEERING SERVICES 739,968 3,263,439 7,315,828 4,052,389 44.61 (5)
MAINTENANCE ENGINEERING 46.82
Thruway Maintenance 6,435,770 37,888,508 78,298,922 40,410,414 48.39 (5)
Equipment Maintenance 2,617,736 14,191,722 32,926,365 18,734,643 43.10 (5)
FINANCE AND ACCOUNTS 647,631 3,252,800 8,939,572 5,686,772 36.39
OPERATIONS 38.73
Traffic and Services 569,127 2,970,133 7,702,476 4,732,343 38.56
Toll Collection 2,984,737 15,337,628 39,568,988 24,231,360 38.76
SUBTOTAL 15,691,161 84,884,124 195,475,426 110,591,302 43.42
GENERAL CHARGES
UNDISTRIBUTED 6,775,834 48,508,356 90,049,866 41,541,510 53.87
TOTAL DEPARTMENTAL EXPENSES (3) 22,466,995 133,392,480 285,525,292 152,132,812 46.72
ADJUSTMENT FOR CLAIMS AND
ENVIRONMENTAL REMEDIATION
PROVISIONS (15,079) 63,302 - (63,302) -
TOTAL FUNDED THRUWAY
OPERATING EXPENSES
AND PROVISIONS 22,451,916 133,455,782 285,525,292$ 152,069,510$ 46.74
UNFUNDED RETIREE
HEALTH INSURANCE (3) (4) 3,279,917 16,399,581
TOTAL THRUWAY OPERATING
EXPENSES AND PROVISIONS 25,731,833$ 149,855,363$
(1) Total Annual Budgeted Amount includes Resolutions through Board Meeting Number 704 held on June 6, 2014.
(2) Normal Expense Percentage through this month is 41.67%.
(3) Total Thruway Operating Expenses on pages 3 and 4 consist of Total Departmental Expenses and Unfunded Retiree Health Insurance.
(4) Note C.
(5) Note D.
MONTH DATE AMOUNT (1) BALANCE ANNUAL BUDGET (2)
BUDGETED
- 11 -
2014
% OF YEAR TO
DATE EXPENSE TO DEPARTMENT OR OFFICE
EXPENSE ANNUAL ANNUAL
CURRENT YEAR TO BUDGETED
MONTH
COMPARATIVE SUMMARY STATEMENT OF DEPARTMENT May
OPERATING EXPENSES AND BUDGET
NEW YORK STATE THRUWAY AUTHORITY YEAR
MONTH
May
YEAR
2014
Annual
Budgeted
Amount
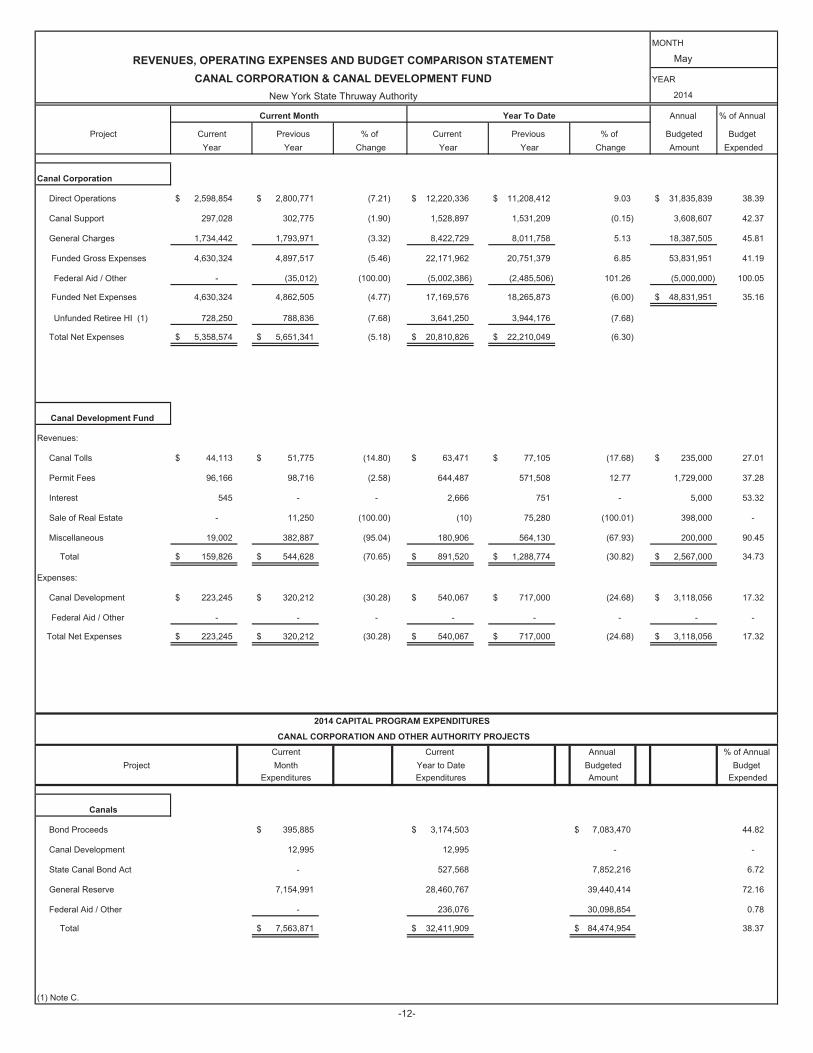
Direct Operations 2,598,854$ 2,800,771$ (7.21) 12,220,336$ 11,208,412$ 9.03 31,835,839$ 38.39
Canal Support 297,028 302,775 (1.90) 1,528,897 1,531,209 (0.15) 3,608,607 42.37
General Charges 1,734,442 1,793,971 (3.32) 8,422,729 8,011,758 5.13 18,387,505 45.81
Funded Gross Expenses 4,630,324 4,897,517 (5.46) 22,171,962 20,751,379 6.85 53,831,951 41.19
Federal Aid / Other - (35,012) (100.00) (5,002,386) (2,485,506) 101.26 (5,000,000) 100.05
Funded Net Expenses 4,630,324 4,862,505 (4.77) 17,169,576 18,265,873 (6.00) 48,831,951$ 35.16
728,250 788,836 (7.68) 3,641,250 3,944,176 (7.68)
Total Net Expenses 5,358,574$ 5,651,341$ (5.18) 20,810,826$ 22,210,049$ (6.30)
Revenues:
Canal Tolls 44,113$ 51,775$ (14.80) 63,471$ 77,105$ (17.68) 235,000$ 27.01
Permit Fees 96,166 98,716 (2.58) 644,487 571,508 12.77 1,729,000 37.28
Interest 545 - - 2,666 751 - 5,000 53.32
Sale of Real Estate - 11,250 (100.00) (10) 75,280 (100.01) 398,000 -
Miscellaneous 19,002 382,887 (95.04) 180,906 564,130 (67.93) 200,000 90.45
Total 159,826$ 544,628$ (70.65) 891,520$ 1,288,774$ (30.82) 2,567,000$ 34.73
Expenses:
Canal Development 223,245$ 320,212$ (30.28) 540,067$ 717,000$ (24.68) 3,118,056$ 17.32
Federal Aid / Other - - - - - - - -
Total Net Expenses 223,245$ 320,212$ (30.28) 540,067$ 717,000$ (24.68) 3,118,056$ 17.32
Annual
Budgeted
Amount
Bond Proceeds 395,885$ 3,174,503$ 7,083,470$ 44.82
12,995 12,995 - -
- 527,568 7,852,216 6.72
General Reserve 7,154,991 28,460,767 39,440,414 72.16
Federal Aid / Other - 236,076 30,098,854 0.78
Total 7,563,871$ 32,411,909$ 84,474,954$ 38.37
(1) Note C.
Budget
REVENUES, OPERATING EXPENSES AND BUDGET COMPARISON STATEMENT
CANAL CORPORATION & CANAL DEVELOPMENT FUND
New York State Thruway Authority
Current Month
Change Year
% of Annual
Project Current Previous % of Current Previous % of
Year To Date
Unfunded Retiree HI (1)
Canal Development Fund
2014 CAPITAL PROGRAM EXPENDITURES
CANAL CORPORATION AND OTHER AUTHORITY PROJECTS
Year Change Expended
Canal Corporation
Year Year
Current Current % of Annual
Project Month Year to Date Budget
Canal Development
State Canal Bond Act
-12-
Expenditures Expenditures Expended
Canals

MONTH
May
YEAR
2014
Equipment and
Facilities
Highway/Bridge
Rehabilitation
Canal Capital and
Other Authority
Projects (2)
New NY Bridge
Project (3)
Thruway Capital
and Canal
Emergency
Summary
Totals
Beginning Balances 17,052,693$ 48,416,017$ 17,113,619$ 1,236,730,126$ 26,971,993$ 1,346,284,448$
Receipts
Provisions (5) 8,736,123$ (835,537)$ 10,201,002$ -$ N/A 18,101,588$
Net Proceeds from Bond Issuance - - N/A - 350,000,000 350,000,000
Loan Proceeds and Payments - - 13,000,000 - - 13,000,000
Auction Proceeds 14,000 N/A N/A N/A N/A 14,000
Interest Earnings N/A N/A N/A 1,170,789 168,183 1,338,972
Federal Aid / Canal Dev Fund / Other 22,909 - 776,639 - 208,749 1,008,297
Total 8,773,032$ (835,537)$ 23,977,641$ 1,170,789$ 350,376,932$ 383,462,857$
Expenditures
January 744,193$ 11,804,323$ 5,369,504$ 46,209,152$ (6,638,773)$ 57,488,399$
February 2,458,329 31,152 2,934,313 38,247,000 3,600,032 47,270,826
March 2,941,482 28,431 7,417,554 33,646,604 4,791,964 48,826,035
April 1,628,515 94,932 6,348,049 29,391,250 5,545,292 43,008,038
May 2,273,219 278,354 7,167,986 33,342,696 6,030,776 49,093,031
June
July
August
September
October
November
December
Subtotal 10,045,738$ 12,237,192$ 29,237,406$ 180,836,702$ 13,329,291$ 245,686,329$
Interest Expense N/A N/A 140,204 15,935,828 N/A 16,076,032
Total 10,045,738$ 12,237,192$ 29,377,610$ 196,772,530$ 13,329,291$ 261,762,361$
Adjustments to Cash Basis
(6,636,379)$ -$ (3,328,185)$ 1,722,105$ 1,892,953$ (6,349,506)$
(170,752) - (20,335) 12,621,876 (3,703,259) 8,727,530
Total (6,807,131)$ -$ (3,348,520)$ 14,343,981$ (1,810,306)$ 2,378,024$
Ending Balances 8,972,856$ 35,343,288$ 8,365,130$ 1,055,472,366$ 362,209,328$ 1,470,362,968$
Budgeted
Provisions 52,712,237$ -$ 29,965,768$ 10,000,000$ N/A 92,678,005$
Expenditures 58,312,237$ 5,000,000$ 77,391,484$ 1,126,096,041$ 249,338,990$ 1,516,138,752$
(1) The Junior Indebtedness Fund (JIF) was established to account for proceeds from the issuance of Junior Indebtedness Obligations (JIO).
(2) Includes Canal Capital and Other Authority Projects expenditures, as detailed on page 12.
(3) New NY Bridge Project detailed on page 14.
(4) Includes $316.5 million that will be used to fund interest payments on the General Revenue Junior Indebtedness Obligation, Series 2013A.
(5) See Page 10.
-13-
CAPITAL PROGRAM SUMMARYNew York State Thruway Authority
Funded From Reserve Maintenance FundGeneral Reserve
Fund
Facilities Capital
Improvement &
JIF Funds (1)
Construction
Fund
(4)
Transfers to and from other funds
Change in Receivables and Payables
(4)
MONTH
May
YEAR
2014
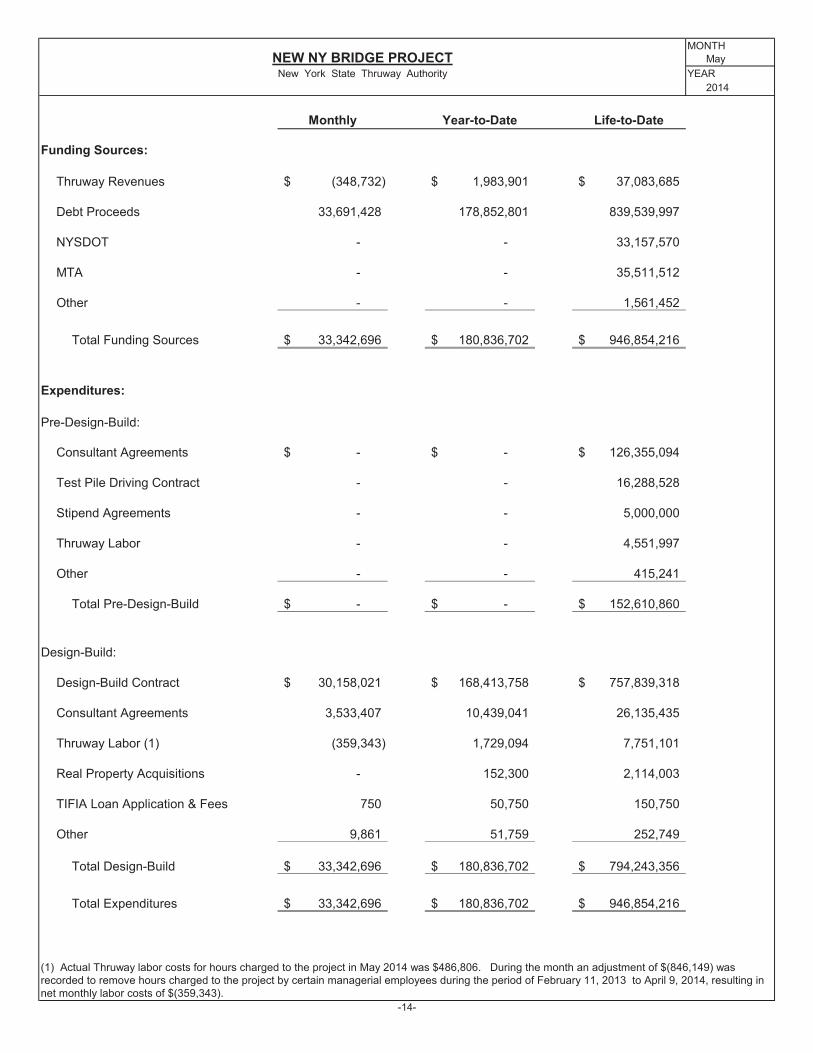
Monthly Year-to-Date Life-to-Date
Funding Sources:
Thruway Revenues (348,732)$ 1,983,901$ 37,083,685$
Debt Proceeds 33,691,428 178,852,801 839,539,997
NYSDOT - - 33,157,570
MTA - - 35,511,512
Other - - 1,561,452
Total Funding Sources 33,342,696$ 180,836,702$ 946,854,216$
Expenditures:
Pre-Design-Build:
Consultant Agreements -$ -$ 126,355,094$
Test Pile Driving Contract - - 16,288,528
Stipend Agreements - - 5,000,000
Thruway Labor - - 4,551,997
Other - - 415,241
Total Pre-Design-Build -$ -$ 152,610,860$
Design-Build:
Design-Build Contract 30,158,021$ 168,413,758$ 757,839,318$
Consultant Agreements 3,533,407 10,439,041 26,135,435
Thruway Labor (1) (359,343) 1,729,094 7,751,101
Real Property Acquisitions - 152,300 2,114,003
TIFIA Loan Application & Fees 750 50,750 150,750
Other 9,861 51,759 252,749
Total Design-Build 33,342,696$ 180,836,702$ 794,243,356$
Total Expenditures 33,342,696$ 180,836,702$ 946,854,216$
NEW NY BRIDGE PROJECTNew York State Thruway Authority
-14-
(1) Actual Thruway labor costs for hours charged to the project in May 2014 was $486,806. During the month an adjustment of $(846,149) was recorded to remove hours charged to the project by certain managerial employees during the period of February 11, 2013 to April 9, 2014, resulting in net monthly labor costs of $(359,343).
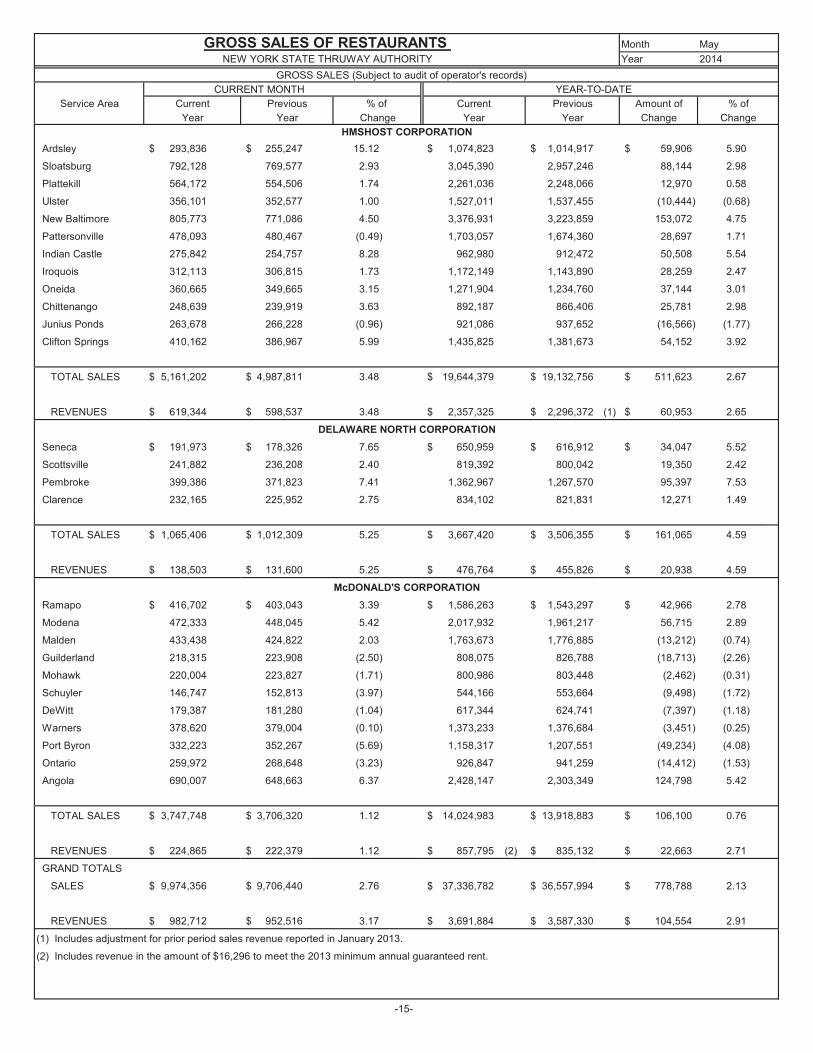
GROSS SALES OF RESTAURANTS Month May
NEW YORK STATE THRUWAY AUTHORITY Year 2014
GROSS SALES (Subject to audit of operator's records)
CURRENT MONTH YEAR-TO-DATE
Service Area Current Previous % of Current Previous Amount of % of
Year Year Change Year Year Change Change
Ardsley 293,836$ 255,247$ 15.12 1,074,823$ 1,014,917$ 59,906$ 5.90
Sloatsburg 792,128 769,577 2.93 3,045,390 2,957,246 88,144 2.98
Plattekill 564,172 554,506 1.74 2,261,036 2,248,066 12,970 0.58
Ulster 356,101 352,577 1.00 1,527,011 1,537,455 (10,444) (0.68)
New Baltimore 805,773 771,086 4.50 3,376,931 3,223,859 153,072 4.75
Pattersonville 478,093 480,467 (0.49) 1,703,057 1,674,360 28,697 1.71
Indian Castle 275,842 254,757 8.28 962,980 912,472 50,508 5.54
Iroquois 312,113 306,815 1.73 1,172,149 1,143,890 28,259 2.47
Oneida 360,665 349,665 3.15 1,271,904 1,234,760 37,144 3.01
Chittenango 248,639 239,919 3.63 892,187 866,406 25,781 2.98
Junius Ponds 263,678 266,228 (0.96) 921,086 937,652 (16,566) (1.77)
Clifton Springs 410,162 386,967 5.99 1,435,825 1,381,673 54,152 3.92
TOTAL SALES 5,161,202$ 4,987,811$ 3.48 19,644,379$ 19,132,756$ 511,623$ 2.67
REVENUES 619,344$ 598,537$ 3.48 2,357,325$ 2,296,372$ (1) 60,953$ 2.65
Seneca 191,973$ 178,326$ 7.65 650,959$ 616,912$ 34,047$ 5.52
Scottsville 241,882 236,208 2.40 819,392 800,042 19,350 2.42
Pembroke 399,386 371,823 7.41 1,362,967 1,267,570 95,397 7.53
Clarence 232,165 225,952 2.75 834,102 821,831 12,271 1.49
TOTAL SALES 1,065,406$ 1,012,309$ 5.25 3,667,420$ 3,506,355$ 161,065$ 4.59
REVENUES 138,503$ 131,600$ 5.25 476,764$ 455,826$ 20,938$ 4.59
Ramapo 416,702$ 403,043$ 3.39 1,586,263$ 1,543,297$ 42,966$ 2.78
Modena 472,333 448,045 5.42 2,017,932 1,961,217 56,715 2.89
Malden 433,438 424,822 2.03 1,763,673 1,776,885 (13,212) (0.74)
Guilderland 218,315 223,908 (2.50) 808,075 826,788 (18,713) (2.26)
Mohawk 220,004 223,827 (1.71) 800,986 803,448 (2,462) (0.31)
Schuyler 146,747 152,813 (3.97) 544,166 553,664 (9,498) (1.72)
DeWitt 179,387 181,280 (1.04) 617,344 624,741 (7,397) (1.18)
Warners 378,620 379,004 (0.10) 1,373,233 1,376,684 (3,451) (0.25)
Port Byron 332,223 352,267 (5.69) 1,158,317 1,207,551 (49,234) (4.08)
Ontario 259,972 268,648 (3.23) 926,847 941,259 (14,412) (1.53)
Angola 690,007 648,663 6.37 2,428,147 2,303,349 124,798 5.42
TOTAL SALES 3,747,748$ 3,706,320$ 1.12 14,024,983$ 13,918,883$ 106,100$ 0.76
REVENUES 224,865$ 222,379$ 1.12 857,795$ (2) 835,132$ 22,663$ 2.71
GRAND TOTALS
SALES 9,974,356$ 9,706,440$ 2.76 37,336,782$ 36,557,994$ 778,788$ 2.13
REVENUES 982,712$ 952,516$ 3.17 3,691,884$ 3,587,330$ 104,554$ 2.91
(1) Includes adjustment for prior period sales revenue reported in January 2013.
(2) Includes revenue in the amount of $16,296 to meet the 2013 minimum annual guaranteed rent.
-15-
HMSHOST CORPORATION
McDONALD'S CORPORATION
DELAWARE NORTH CORPORATION
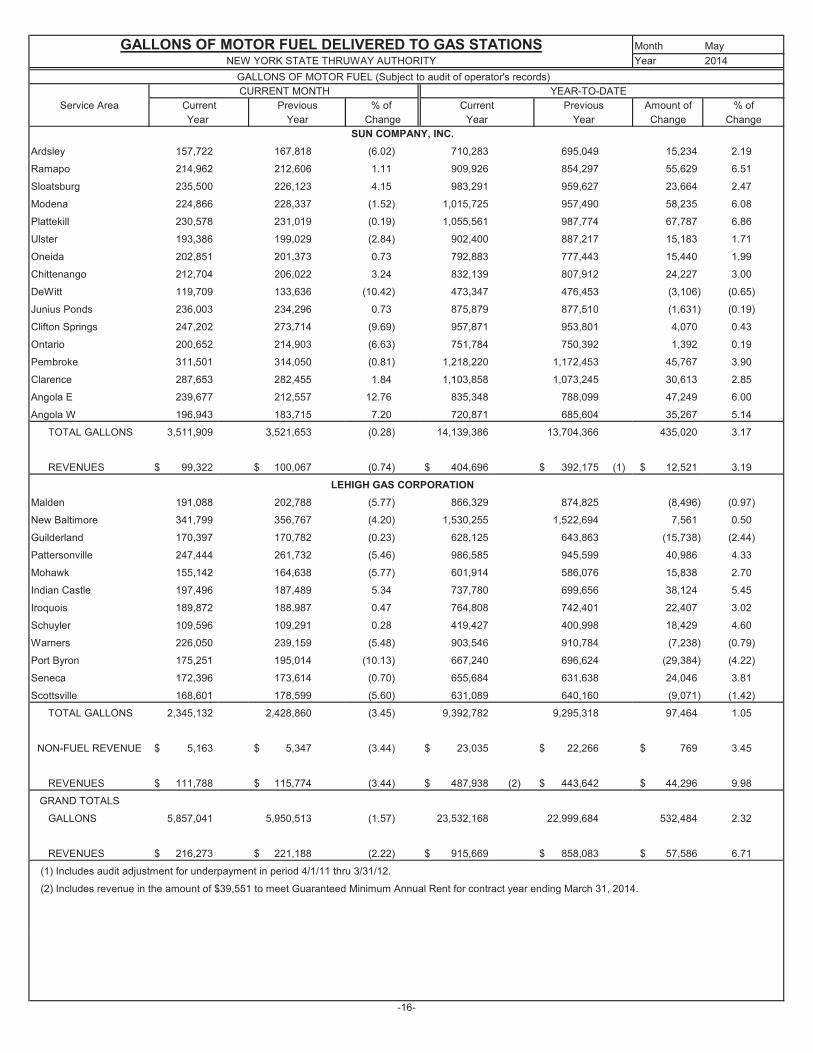
GALLONS OF MOTOR FUEL DELIVERED TO GAS STATIONS Month May
NEW YORK STATE THRUWAY AUTHORITY Year 2014
GALLONS OF MOTOR FUEL (Subject to audit of operator's records)
CURRENT MONTH YEAR-TO-DATE
Service Area Current Previous % of Current Previous Amount of
Year Year Change Year Year Change
Ardsley 157,722 167,818 (6.02) 710,283 695,049 15,234 2.19
Ramapo 214,962 212,606 1.11 909,926 854,297 55,629 6.51
Sloatsburg 235,500 226,123 4.15 983,291 959,627 23,664 2.47
Modena 224,866 228,337 (1.52) 1,015,725 957,490 58,235 6.08
Plattekill 230,578 231,019 (0.19) 1,055,561 987,774 67,787 6.86
Ulster 193,386 199,029 (2.84) 902,400 887,217 15,183 1.71
Oneida 202,851 201,373 0.73 792,883 777,443 15,440 1.99
Chittenango 212,704 206,022 3.24 832,139 807,912 24,227 3.00
DeWitt 119,709 133,636 (10.42) 473,347 476,453 (3,106) (0.65)
Junius Ponds 236,003 234,296 0.73 875,879 877,510 (1,631) (0.19)
Clifton Springs 247,202 273,714 (9.69) 957,871 953,801 4,070 0.43
Ontario 200,652 214,903 (6.63) 751,784 750,392 1,392 0.19
Pembroke 311,501 314,050 (0.81) 1,218,220 1,172,453 45,767 3.90
Clarence 287,653 282,455 1.84 1,103,858 1,073,245 30,613 2.85
Angola E 239,677 212,557 12.76 835,348 788,099 47,249 6.00
Angola W 196,943 183,715 7.20 720,871 685,604 35,267 5.14
TOTAL GALLONS 3,511,909 3,521,653 (0.28) 14,139,386 13,704,366 435,020 3.17
REVENUES 99,322$ 100,067$ (0.74) 404,696$ 392,175$ (1) 12,521$ 3.19
Malden 191,088 202,788 (5.77) 866,329 874,825 (8,496) (0.97)
New Baltimore 341,799 356,767 (4.20) 1,530,255 1,522,694 7,561 0.50
Guilderland 170,397 170,782 (0.23) 628,125 643,863 (15,738) (2.44)
Pattersonville 247,444 261,732 (5.46) 986,585 945,599 40,986 4.33
Mohawk 155,142 164,638 (5.77) 601,914 586,076 15,838 2.70
Indian Castle 197,496 187,489 5.34 737,780 699,656 38,124 5.45
Iroquois 189,872 188,987 0.47 764,808 742,401 22,407 3.02
Schuyler 109,596 109,291 0.28 419,427 400,998 18,429 4.60
Warners 226,050 239,159 (5.48) 903,546 910,784 (7,238) (0.79)
Port Byron 175,251 195,014 (10.13) 667,240 696,624 (29,384) (4.22)
Seneca 172,396 173,614 (0.70) 655,684 631,638 24,046 3.81
Scottsville 168,601 178,599 (5.60) 631,089 640,160 (9,071) (1.42)
TOTAL GALLONS 2,345,132 2,428,860 (3.45) 9,392,782 9,295,318 97,464 1.05
5,163$ 5,347$ (3.44) 23,035$ 22,266$ 769$ 3.45
REVENUES 111,788$ 115,774$ (3.44) 487,938$ (2) 443,642$ 44,296$ 9.98
GRAND TOTALS
GALLONS 5,857,041 5,950,513 (1.57) 23,532,168 22,999,684 532,484 2.32
REVENUES 216,273$ 221,188$ (2.22) 915,669$ 858,083$ 57,586$ 6.71
(1) Includes audit adjustment for underpayment in period 4/1/11 thru 3/31/12.
(2) Includes revenue in the amount of $39,551 to meet Guaranteed Minimum Annual Rent for contract year ending March 31, 2014.
-16-
% of
Change
SUN COMPANY, INC.
LEHIGH GAS CORPORATION
NON-FUEL REVENUE
AS OF
May 31
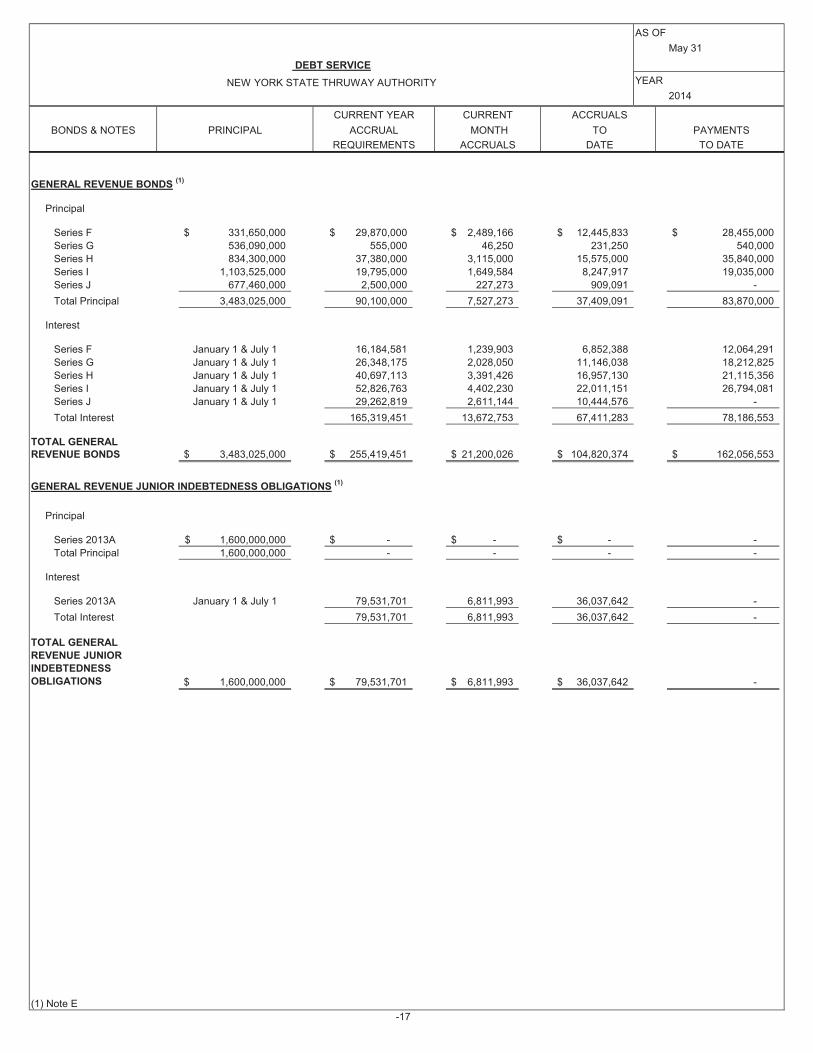
DEBT SERVICE
NEW YORK STATE THRUWAY AUTHORITY YEAR
2014
BONDS & NOTES
GENERAL REVENUE BONDS(1)
Principal
Series F 331,650,000$ 29,870,000$ 2,489,166$ 12,445,833$ 28,455,000$
Series G 536,090,000 555,000 46,250 231,250 540,000
Series H 834,300,000 37,380,000 3,115,000 15,575,000 35,840,000
Series I 1,103,525,000 19,795,000 1,649,584 8,247,917 19,035,000
Series J 677,460,000 2,500,000 227,273 909,091 -
Total Principal 3,483,025,000 90,100,000 7,527,273 37,409,091 83,870,000
Interest
Series F 16,184,581 1,239,903 6,852,388 12,064,291
Series G 26,348,175 2,028,050 11,146,038 18,212,825
Series H 40,697,113 3,391,426 16,957,130 21,115,356
Series I 52,826,763 4,402,230 22,011,151 26,794,081
Series J 29,262,819 2,611,144 10,444,576 -
Total Interest 165,319,451 13,672,753 67,411,283 78,186,553
TOTAL GENERALREVENUE BONDS 3,483,025,000$ 255,419,451$ 21,200,026$ 104,820,374$ 162,056,553$
GENERAL REVENUE JUNIOR INDEBTEDNESS OBLIGATIONS(1)
Principal
Series 2013A 1,600,000,000$ -$ -$ -$ -
Total Principal 1,600,000,000 - - - -
Interest
Series 2013A 79,531,701 6,811,993 36,037,642 -
Total Interest 79,531,701 6,811,993 36,037,642 -
TOTAL GENERAL
REVENUE JUNIOR
INDEBTEDNESS
OBLIGATIONS 1,600,000,000$ 79,531,701$ 6,811,993$ 36,037,642$ -
(1) Note E
-17
January 1 & July 1
January 1 & July 1
January 1 & July 1
January 1 & July 1
January 1 & July 1
PAYMENTS
REQUIREMENTS ACCRUALS DATE TO DATE
January 1 & July 1
CURRENT YEAR CURRENT ACCRUALS
PRINCIPAL ACCRUAL MONTH TO

MONTH
YEAR
NOTE A -
Toll revenues for the month increased $1,563,317 or 2.73%.
For May 2014, interest earnings on investments of 90 days or less totaled $5,350 and are reflected as
operating revenue. Interest earnings on investments with a maturity of more than 90 days totaled $57,542
and are reflected as non-operating revenue on pages 3 and 4. Total interest earnings for the month are
$62,892, a decrease of $41,052 compared to May 2013. Year-to-date interest earnings are $273,859 or
$187,863 less than 2013.
NOTE B -
timing of FEMA reimbursements, bridge & highway operating contract payments, higher pension, worker's
compensation and E-ZPass account management costs along with a decrease in personal service allocations
due to an accounting change related to the allocation of executive staff to the NNYB project. These were
partially offset by lower personal service and health insurance costs.
YTD 2014 YTD 2013 CHANGE
Pensions 13,170,413$ 12,770,997$ 399,416$
Social Security 4,888,414 5,052,250 (163,836)
Compensation Insurance 1,943,713 1,060,832 882,881
Unemployment Insurance 208,335 154,165 54,170
22,457,323 23,027,315 (569,992)
Health Insurance Unfunded 16,399,581 18,044,173 (1,644,592)
Survivor's Benefits 75,000 45,000 30,000
Benefits Allocated to Other Funds (4,576,354) (5,710,155) 1,133,801
Insurance Premiums 1,422,818 1,451,868 (29,050)
Insurance Claims (200,704) 43,032 (243,736)
242,920 250,205 (7,285)
8,638,521 6,105,193 2,533,328
42,748 147,845 (105,097)
80,939 105,802 (24,863)
Remediation Expense Not Cap - (793) 793
Studies 13,944 (154,722) 168,666
Other 100,326 4,070 96,256 64,907,937$ 62,397,077$ 2,510,860$
NOTE C -
-18-
Environmental Expense
RETIREE HEALTH INSURANCE (pages 9, 10, 11 & 12):
Government Accounting Standards Board Statement 45 (GASB 45) established accounting and reporting
standards for "other post-employment benefits" offered by state and local governments. Other post-
employment benefits (OPEB) are employee benefits other than pensions that are received after employment
ends. OPEB benefits provided by the Authority consist of medical benefits and prescription drug benefits.
Professional Services
Total revenues for the month are $61,577,812, an increase of $1,738,264 or 2.90% compared to May 2013.
TOTAL DEPARTMENTAL OPERATING EXPENSES (page 4) :
For the year, Departmental Operating Expenses are $149,792,061, an increase of $8,134,506 or 5.74%
compared with May 2013.
The increase is primarily due to increased snow and ice control costs associated with winter storm events,
A comparison of General Charges Undistributed for the year is as follows:
Health Insurance &
Employee Benefits Funded
Reimbursement to Civil Service
E-ZPass Account Management
TOTAL REVENUES (pages 1 & 2):
NOTES TO FINANCIAL REPORT May
NEW YORK STATE THRUWAY AUTHORITY
2014

MONTH
YEAR
NOTE C -
contributions.
Thruway Canal
Authority Corporation
27,187,496$ 5,546,250$ 32,733,746$
10,787,915 1,905,000 12,692,915
16,399,581$ 3,641,250$ 20,040,831$
NOTE D - DEPARTMENTAL OPERATING EXPENSES AND BUDGET (page 11) :
The following Departmental Operating Expenses exceeded the normal year-to-date expenditure
percentage of 41.67%:
Board & Executive
The overrun of 34.10% is due to reversing the allocation of Board & Executive staff to the NNYB project
for 2013 and 2014.
Media Relations & Public Affairs
The overrun of 11.36% is due to reversing the allocation of Media Relations staff to the NNYB project
for 2013 and 2014.
Engineering Services
The overrun of 2.94% is due to lower than budgeted personal service allocations.
The overrun of 6.72% is due to increased snow and ice control costs as a result of multiple winter storm
events.
Equipment Maintenance
The overrun of 1.43% is due to increased fuel usage as a result of multiple winter storm events.
To comply with GASB 45, our financial statements reflect as a monthly expense, a proportionate amount of
NOTES TO FINANCIAL REPORT May
NEW YORK STATE THRUWAY AUTHORITY
2014
RETIREE HEALTH INSURANCE (pages 9, 10, 11 & 12): (continued)
Unfunded Retiree Health Insurance
the annual required contribution (ARC) for OPEB. The ARC is an actuarial calculated amount the Authority
would need to contribute annually in order to fully fund OPEB liabilities over a period of 30 years. The ARC
recognizes that OPEB benefits are earned and are financial obligations accrued during an employee's entire
period of service. Although GASB refers to this expense as an annual required contribution we are not
required to fund this amount.
We are required to fund payments to the New York State Health Insurance Program (NYSHIP) to provide
health insurance coverage, in the current year, for our current retirees. These actual contributions are
referred to as the "pay-as-you-go" amount. Below is a comparison of our 2014 ARC and pay-as-you-go
Total
Annual Required Contribution (ARC)
Actual Contribution (pay-as-you-go)
-19-
The Authority has elected to fund only the pay-as-you-go contribution to NYSHIP. As a result, unfunded
expenses for 2014 year to date are $20,040,831.
Thruway Maintenance
MONTH
YEAR
NOTE E - DEBT ISSUANCES (page 17):
Series 2013A Junior Indebtedness Obligations through December 31, 2017, and iv) pay costs of issuance. The
Transportation Infrastructure Finance and Innovation Act (TIFIA). The proceeds of the TIFIA loan are expected
to be disbursed in a single draw in March, 2019 and are expected to be used to pay the Series 2013A Junior
Indebtedness Obligations at maturity.
On February 6, 2014, the Authority issued General Revenue Bonds, Series J which generated proceeds of
$732.4 million. These proceeds will be used to i) fund a portion of the cost of the Authority's Multi-Year
Capital Program, ii) provide funds to refund a portion of the Authority's General Revenue Bonds, Series F
and Series G, iii) provide for a required deposit to the Senior Debt Service Reserve Fund, and iv) pay costs
of issuance. These bonds mature in various amounts through January 1, 2044.
Series 2013A to i) fund a portion of the cost of the New NY Bridge Project, ii) provide funds to pay the principal
NOTES TO FINANCIAL REPORT May
NEW YORK STATE THRUWAY AUTHORITY
2014
On December 18, 2013, the Authority issued $1.6 billion of General Revenue Junior Indebtedness Obligations,
and interest on the General Revenue Bond Anticipation Notes, Series 2013B, iii) pay capitalized interest on the
Series 2013A Junior Indebtedness Obligations will mature on May 1, 2019. In addition, on December 19, 2013,
the Authority entered into a loan agreement with the United States Department of Transportation under the
-20-
Recommended


