Swings for Dreams: Public Perceptions of the Nonprofit Sector and
Effects on Donating Behavior
Kelsey L. Fisher
San Jose State University
A Thesis Quality Research Project Submitted in Partial Fulfillment of the Requirements for the
Masters of Public Administration.

1
Introduction
Among the many challenges the nonprofit sector faces, the effort to maintain a good
reputation has proven to be one of the most difficult struggles to date (Schloderer, Sarstedt, &
Ringle, 2014). Today, the nonprofit sector is not only concerned with how to raise funds and
deliver services, but it is also confronted with how to address a wave of public doubt and
criticism related to charitable corruption. Much of this condemnation stems from “widely
publicized scandals over the past several years” which “have led to diminished public confidence
in nonprofit organizations” (Mead, 2008, p. 883). The exposure of corruption in high profile
national charities like the Red Cross and the United Way has resulted in mistrust of the nonprofit
sector as a whole (Wallace, 2006). While many researchers have explored how public confidence
in the sector has evolved as a result of these well-known nonprofit controversies, questions
persist as to how negative perceptions of the sector influence donating patterns. More
specifically, how do concerns related to nonprofit management, trustworthiness, and donation
impact affect an individual’s historical and planned donating behavior?
The preservation of trust between the nonprofit sector and its current or prospective
supporters is critical to the survival of charitable organizations. In fact, Burt (2014, p. 1) suggests
that a “donor’s trust in a charity is arguably a key factor in determining their support for a
charity. Trust allows people to engage in acts with a feeling that another person or organization
will not take advantage of those acts. Trust is based on expectations that what is expected of
another will actually occur.” Today, the lack of public trust in the nonprofit sector is a serious
problem for all stakeholders involved. The belief that nonprofit professionals exploit their power
and misuse funds has a damaging effect to the sector as a whole, and to the individuals who
depend on charitable organizations to survive (Mead, 2008). It is troubling that the nonprofit

2
sector, which emerged to benefit the greater good, is now perceived by much of society as
dishonest and self-serving. Furthermore, it is even more worrisome that nonprofit organizations
are not particularly concerned about rebuilding confidence in the sector (Rosenman, 2013).
At a time when the competition for funding amongst nonprofits is increasingly more
competitive, charitable organizations should direct more of their efforts to restoring the public’s
belief in their abilities to efficiently manage and honestly allocate donated funds to the growing
number of people that depend on nonprofit services. Consideration of public perception is
especially important seeing as charitable organizations are primarily dependent on outside
funding to maintain operations and to deliver human services. Of the $335.17 billion given to
nonprofit organizations in 2013, “the largest source of charitable giving came from individuals at
$241.32 billion, or 72% of total giving” (National Philanthropic Trust, 2014). The fact that
individuals contribute the most financial capital to the nonprofit sector reinforces the importance
of their attitudes toward charities, and how these views may impact the sector as a whole. More
importantly, Rosenman (2014, p. 2) raises the question that “if Americans begin to see public
agencies as corrupt, how can we expect people to support them?”
While many nonprofit organizations have placed the public perception issue on the
backburner, most likely as a result of a lack of manpower and financial resources, a charity
called Swings for Dreams made this problem a priority because the survival of the organization
depended on it. Swings for Dreams was founded in November of 2013 by Nicholas Tuttle and
Michael Aguas, with a mission to "design, fund, and build environmentally friendly and
culturally sensitive outdoor play spaces for children living in underserved and developing
regions of the world" (Swings for Dreams, 2014). During their first year of operation, they set a
fundraising goal of $30,000 to be used to build a playground for a primary school in Nieu-
3
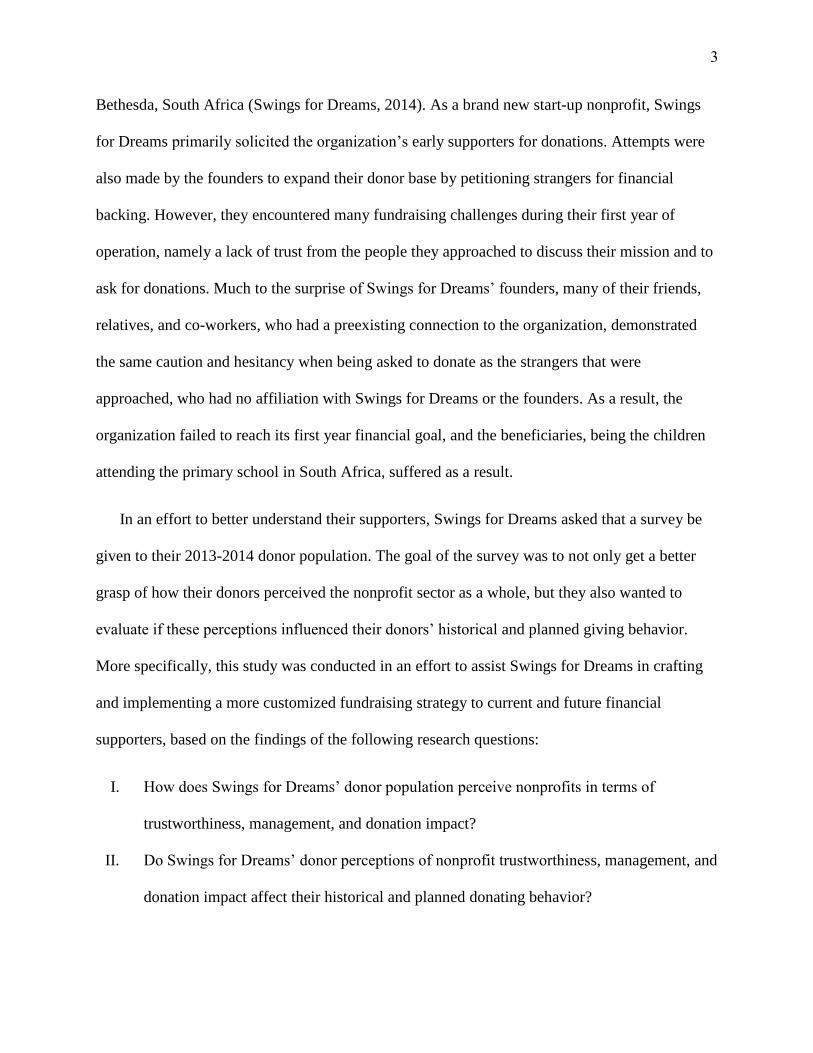
Bethesda, South Africa (Swings for Dreams, 2014). As a brand new start-up nonprofit, Swings
for Dreams primarily solicited the organization’s early supporters for donations. Attempts were
also made by the founders to expand their donor base by petitioning strangers for financial
backing. However, they encountered many fundraising challenges during their first year of
operation, namely a lack of trust from the people they approached to discuss their mission and to
ask for donations. Much to the surprise of Swings for Dreams’ founders, many of their friends,
relatives, and co-workers, who had a preexisting connection to the organization, demonstrated
the same caution and hesitancy when being asked to donate as the strangers that were
approached, who had no affiliation with Swings for Dreams or the founders. As a result, the
organization failed to reach its first year financial goal, and the beneficiaries, being the children
attending the primary school in South Africa, suffered as a result.
In an effort to better understand their supporters, Swings for Dreams asked that a survey be
given to their 2013-2014 donor population. The goal of the survey was to not only get a better
grasp of how their donors perceived the nonprofit sector as a whole, but they also wanted to
evaluate if these perceptions influenced their donors’ historical and planned giving behavior.
More specifically, this study was conducted in an effort to assist Swings for Dreams in crafting
and implementing a more customized fundraising strategy to current and future financial
supporters, based on the findings of the following research questions:
I. How does Swings for Dreams’ donor population perceive nonprofits in terms of
trustworthiness, management, and donation impact?
II. Do Swings for Dreams’ donor perceptions of nonprofit trustworthiness, management, and
donation impact affect their historical and planned donating behavior?

4
The founders at Swings for Dreams expressed the belief that their donors had an overall negative
view of the nonprofit sector, and that this view negatively impacted their donating history and
their desire to donate to charitable organizations in the future. The organization’s staff also
believed that the negative perceptions about the nonprofit sector as a whole contributed to the
apprehension demonstrated by prospective donors when approached to support Swings for
Dreams.
Before delving into these research questions, it is important to understand what a
nonprofit is, what the research says regarding donor values, and how and why public perception
of the nonprofit sector has evolved over the past few decades.
Literature Review
It is difficult to narrowly define the American nonprofit sector as the 1.6 million
organizations that comprise it differ significantly in their mission, size, and structure (Vogelsang
et al., 2015). This sector is also commonly referred to as the "third sector" - "with government
and its agencies of public administration being the first, and the world of business or commerce
being the second" (Anheier, 2014, p. 4). It is broadly defined as the over 25 different categories
of "private, voluntary, nonprofit organizations, and associations" (Anheier, 2014, p. 4) that the
United States Internal Revenue Service (IRS) identifies as eligible to receive federal income tax
exemption (Internal Revenue Service, 2014). While the nonprofit sector includes a variety of
different organizational categories, the most widespread is the 501(c)(3) charitable organization
(Bryce, 2012). 501(c)(3) organizations are distinctive from other types of tax-exempt nonprofits,
as they must serve a charitable purpose, and should be "organized and operated to benefit some
greater good" (Blanchard, 2014, p. 278), as opposed to the sole benefit of their members
(Independent Sector, 2014). The Independent Sector, a nonpartisan leadership association of
5
nonprofits, highlights that 501(c)(3) nonprofits must also be committed to serving “one or more
of the following purposes specified by the IRS: charitable, religious, educational, scientific,
literary, testing for public safety, fostering national or international amateur sports competition,
or the prevention of cruelty to children or animals” (2014).
Third sector organizations typically emerge to fill a gap neglected by the corporate or
government sectors (Rose, 2014). This gap is usually the delivery of a particular public good or
service, but nonprofits may also act “as partners in the process of governance” (Simon, Yak, &
Ott, 2013, p. 355). While the mission of a charity may vary significantly, a common denominator
is the fact that charitable organizations most commonly cater to underserved communities
residing in the United States or abroad (Vogelsang et al., 2015). Within the United States, there
is a growing number of individuals dependent on charitable nonprofits. The Nonprofit Finance
Fund explores this trend in their annual survey which revealed that of the 5,000 nonprofit
respondents, "80% reported an increase in demand for services," which happens to be the
survey's "6th straight year of increased demand" (Nonprofit Finance Fund, 2014). In addition,
"56% were unable to meet demand in 2013—the highest reported in the survey’s history"
(Nonprofit Finance Fund, 2014). The rise in demand for services comes not only as a result of
the increase in the number of people dependent on nonprofits, but also as a consequence of a
struggling middle class that “has shrunk in size, and fallen backward in income and wealth”
(Pew Research Center, 2012).
Those living in poverty are no longer the only beneficiaries of nonprofit services. Due to
financial difficulties, many in the middle class are now resorting to nonprofit assistance as they
cannot afford basic services and often do not qualify for government assistance (Feeding
America, 2014). “Though not officially poor, these families experience limited economic

6
security; one major setback could thrust them into economic chaos” (Kearney, Harris, Jacome, &
Parker, 2013, P.1). A nationally representative survey conducted by the Pew Research Center
(2012) also reveals that “85% of self-described middle-class adults say it is more difficult now
than it was a decade ago for middle-class people to maintain their standard of living.” One
example of this is the fact that nonprofit food banks nationwide have witnessed an increase in
what they refer to as “first-timers,” which are typically middle class people who are experiencing
financial turmoil due to unexpected job loss (Feeding America, 2014). Having trouble making
ends meet, these individuals turn to food banks to put food on the table. In a New York Times
article, Bosman (2009) described this phenomenon:
Food pantries, once a crutch for the most needy, have responded to the recession by
opening their doors to what one pantry organizer described as ‘the next layer of people,’ a
rapidly expanding group of child-care workers, nurse’s aides, real estate agents and
secretaries who are facing a financial crises for the first time.
In addition to the growing number of Americans served by the charitable sector, the
United States has also experienced a rapid boost in the number of nonprofits that are operating
(Harrison & Thornton, 2014). Remarkably, "the growth rate of the nonprofit sector has surpassed
the rate of both the business and government sectors" (Blackwood, Pettijohn & Roeger, 2012, p.
16). While their continued growth is exciting, their inability to meet demand is troubling and
contributes to the failure of many nonprofit organizations in the nation. The Nonprofit Finance
Fund (2014) reports that most nonprofit organizations expect a persistent rise in the demand for
their services and many foresee that the demand will be unmet. While nonprofit strategists
agonize about how to accommodate the growing demand for services, charitable professionals
7
are also facing the added pressure of intensifying competition in the sector (Barman, 2002;
Ashley & Faulk, 2010; Prufer, 2011).
Growth in the number and size of operating nonprofit organizations has caused an
increase in competition for financial resources (Yurenka, 2007). Because nonprofits rely on
donations to maintain operations and the delivery of services, charities must compete with their
peers for financial support - an already difficult resource to secure (Bray, 2013). Similar to the
many options consumers have in the for-profit world, donors and philanthropists “have abundant
choices when considering charitable donations” (Hsu, Liang, & Tien, 2005, p. 190). This leads
“funders to focus more intently on identifying the most successful organizations in which to
invest scarce resources” (Vaughan, 2010, p. 486). Often, individual donors provide 75 percent or
more of the nonprofit sector’s financial capital (Bray, 2013). As a result, nonprofits must
strengthen their ability to attract individual donors, as well as doing a better job of cultivating the
attributes and values prospective donors look for when making the strategic decision to donate.
Modern day donors are not only interested in supporting a cause with a mission that
aligns with their interests; they are also interested in “efficiency, results, and reporting” (Bray,
2013, p. 77). Social science researchers suggest that donors are motivated to give to
organizations that demonstrate efficient management practices, honest fund allocation,
performance and impact measurement, and transparent reporting mechanisms (Bray, 2013;
Vaughn, 2010; Szper & Prakash, 2010). In addition, donors pay especially close attention to an
organization’s costs of fundraising and administration when deciding which organizations to
donate to (Bray, 2013). Szper and Prakash (2010) stress that this is an obvious concern as donors
make donations “with the expectation that nonprofits will deploy funds to pursue their mandates”
(p. 116), not to fund staff salaries, overhead, or fundraising expenses. One example of a costly

8
and misleading fundraising practice which has faced criticism is the employment of paid
telemarketing firms on behalf of nonprofits. Disapproval of this strategy stems from its cost-
ineffectiveness and the fact that most nonprofits who choose to use this service end up receiving
only a small fraction of what is donated, as the majority of the money is used to pay the salaries
of the solicitors (Keating, Parsons, & Roberts, 2003). For instance, reports were published about
deceptive charitable telemarketing practices used by a firm called InfoCision, which claim the
company keeps roughly 80% or more of the money raised on behalf of some 30 nonprofits
(Nash, 2012). Popular news sources like Bloomberg Business, the Huffington Post, and the
Today Show exposed a number of instances in which InfoCision offered less than half of the
money raised to the organization it was hired by (Evans, 2012; Kavoussi, 2012; Nash; 2012).
Bray (2013) argues that no more than 50 percent of a nonprofit’s funds be used for
administrative costs. He also makes the case that “no more than 35% of total funds raised be
churned back into fundraising – and that 65% of a nonprofit’s budget be spent on program
activities” (Bray, 2013, p. 78). While there is agreement that charities should not devote an
excessive amount of donated funds to administrative costs, “the practice of using administrative
cost ratios to guide funding decisions is a highly contested topic in the nonprofit sector” (Ashley
& Van Slyke, 2012, p. S47). Ashley and Van Slyke (2012) expand on this disputed topic in their
research noting that (pp. S47):
Promoters, on the one hand, see it [administrative cost ratios] as a useful comparative
performance measure to help donors avoid scams and meet their motivation to direct as
much of their contribution to programs as possible. Opponents on the other hand, charge
that the practice promotes a starvation cycle and that the ratios are irrelevant to mission
performance on program effectiveness.

9
In addition to exploring the value of using administrative cost ratios as a performance measure,
Ashely and Van Slyke (2012) also question whether donors actually use these measures in their
decisions whether or not to support a particular organization. Either way, all nonprofits will
have administrative costs associated with operations, fundraising, and employment. The key is to
not abuse donated funds, and to maintain transparency with donors.
Organizational transparency as it relates to financial reporting and the measurement of
nonprofit impact has become increasingly important in recent years. It may seem perplexing that
this is an issue seeing as American nonprofits are required to report fund use to the IRS each year
through the submission of a Form 990, which details annual revenue sources and how they were
spent (IRS, 2015). But, while this information is technically available to the public, “nonprofit
donors face difficulties in accessing and interpreting information about how nonprofits are
deploying resources” (Szper & Prakash, 2010, p. 115). What donors are really looking for is a
clear and easy-to-digest report which shows how much money was donated during a particular
year, exactly where that money was spent, and evidence that their contributions made a real
impact (Ottenhoff & Ulrich, 2012). Providing detailed, accessible, and easy-to-understand
financial information to current and prospective supporters is crucial. To address this need, the
BBB Wise Giving Alliance (2015) advocates for the creation and distribution of annual reports
as an effective way to improve organizational transparency, to keep funders updated, and to
assess impact. However, the production and distribution of annual reports has a financial cost
that must also be considered.
The prioritization of nonprofits based on these organizational characteristics is a
relatively recent transition from the former practice of simply donating to an organization due to
a personal connection or belief in the mission. Americans used to blindly donate to charities as

10
they were regarded with esteem and appreciation for serving some of the nation’s most
vulnerable citizens. “Recently, however, the public has begun to perceive nonprofit organizations
as being ineptly or corruptly managed” (Mead, 2008, p. 883). This shift stems from a few widely
publicized scandals which involved the mishandling of donated funds by some well-known and
well-respected American nonprofits (Bray, 2013). Two of the biggest scandals involved the
misuse of funds by the United Way and the Red Cross (Bray, 2013: Wallace, 2006; Rosenman,
2014). The legacy of these controversies are still alive and well in the minds of donors, and has
contributed to the added scrutiny put on today’s nonprofits.
When describing how these major scandals affected the nonprofit sector as a whole, Light
(2006) stated: “It was as if the sector was made of Velcro – virtually every scandal stuck to the
charitable sector and converted what had been benign, soft opinion into increasingly negative,
hard attitudes about basic accountability.” A study conducted on public attitudes toward the
nonprofit sector also found that “perceptions of two big charities – the American Red Cross and
United Way – strongly influence how Americans feel about charities overall” (Wallace, 2006, p.
3). These two unfortunate instances will be discussed in more detail below to truly assess the
damage that these once esteemed nonprofits caused to themselves and the sector as a whole.
The United Way is a charitable organization with a mission to “improve lives by
mobilizing the caring power of communities around the world to advance the common good”
(United Way, 2015). More specifically, the United Way works to improve lives through the
advancement of health, education, and financial stability (United Way, 2015). But, in 1992, an
investigation was conducted of the United Way - “one of the nation’s most respected charities”
at the time (Shapiro, 2011). What was revealed during the investigation was shocking and
“prompted public outcry” (Montague, 2013, p. 222). The mismanagement of the United Way by

11
the organization’s President, William Aramony, had been littered with fraudulent spending,
falsified tax returns, inflated administrative salaries, lavish perks and expenditures, and
inappropriate behavior toward his underage mistress and female employees (Wilhelm &
Williams, 2002).
During his 22 years as president and CEO of United Way, Aramony stole roughly “$1.2
million of the charity's money to benefit himself and his friends” (CharityWatch, 2014). He also
awarded himself a whopping $463,000 annual salary, which was extravagant even when
compared to corporate executive standards (Montague, 2013). Following the exposure of
Aramony’s disgraceful conduct, he resigned and was “sentenced to seven years in a federal
penitentiary” (Shapiro, 2011). This incident also provoked a subsequent congressional
examination of the practices of nonprofits and an investigation as to whether the IRS was
capable of monitoring the financial practices of the growing sector (Montague, 2013). While
some justice was served as a result of the United Way investigation, the incident wounded the
reputation of the nonprofit sector, and weakened public confidence in charitable organizations,
nonprofit executives, and the overall impact of donations. “CharityWatch president, Daniel
Borochoff, remarked in USA Today in 1995 as to how the scandal influenced public perception
of charities, saying, ‘It created a climate where donors are more questioning. They want to know
more about how an organization is governed and the ethics of its leaders’” (CharityWatch, 2014).
The results of the United Way controversy is evidence that the nonprofit sector as a whole is not
immune to the criticism that arises as a result of the misconduct and negligence of just one
nonprofit.
The Red Cross scandal is another example of a high-profile organization which misused
funds and contributed to a decline of public trust in the sector. While the Red Cross’ mission
12
includes military family support, health and safety training, and blood collection, the
organization is best known for its disaster relief efforts (Red Cross, 2015). However, the
publicity surrounding these efforts has not been entirely positive over the years. In fact, the Red
Cross “has endured several large-scale scandals and potential disasters for its reputation”
(Fussell-Sisco, Collins, & Zoch, 2010, p. 23) including: blood shortages, safety issues related to
the handling of donated blood, a 1998 embezzlement scandal involving an Executive Director of
a New Jersey chapter, the organization’s response to Hurricane Katrina, and the Red Cross’
infamous misallocation of funds after 9/11 (Chase, 2012; Attkisson, 2002; Carson, 2002).
Seeing as this research is more focused on public trust as it relates to transparency and the
misappropriation of funds, the Red Cross’ response to 9/11 warrants a closer look.
Following the September 11th terrorist attacks, the Red Cross urged Americans to donate
money to support the victims of the attack, their families, and recovery. Remarkably, $550
million was raised, but questions soon arose regarding how the funds were used (Foundation
Center, 2002). “The treatment of the Red Cross quickly deteriorated when on October 29, 2001,
the Red Cross acknowledged that a portion of the Liberty Fund, the special fund established after
September 11, had been set aside for a strategic blood reserve, a nationwide community outreach
program, and the building of relief infrastructure” (Foundation Center, 2002, p. 32). This
decision to syphon funds back into the organization, as opposed to the 9/11 relief efforts, “was
contrary to what many September 11 donors claimed they had desired” (Foundation Center,
2002, p. 32), and caused public outrage and raised serious concerns about nonprofit
transparency, the appropriate use of funds, and donations used for administrative costs. The
American people were completely appalled by the 9/11 Red Cross controversy, so much so that

13
one survey reported that more Americans were engrossed in this scandal than the widely
publicized Enron bankruptcy (Mead, 2008).
While Dr. Bernadine Healy, the active President of the Red Cross at the time, was
eventually forced to resign following a publicized Congressional hearing, the repercussions of
this scandal continue to threaten the credibility of the nonprofit sector. Fussell-Sisco, Collins,
and Zoch (2010) noted that: “This scandal has had far-reaching effects. The organization itself
was not the only one to suffer public condemnation.” As a direct result of the 9/11 controversy,
there was a “significant drop in contributors’ confidence in charities” (Wallace, 2006, p. 3),
especially regarding nonprofit management, performance, effectiveness, and use of donated
funds. This drop in confidence is also evident in surveys conducted before and after the incident
which reported that public confidence had plummeted from 90 percent prior to the terrorist
attacks to 60 percent in 2002 ( Light, 2006; Mead, 2008).
The United Way and Red Cross scandals serve as good examples of what can go
drastically wrong when corrupt nonprofit executives come into power. These examples also
reinforce why modern day donors may perceive nonprofits as untrustworthy and why they may
be hesitant to make donations. Rosenman (2013) warns that public confidence in the nonprofit
sector has not recovered since the record low in 2002. A 2008 survey conducted by the
Brookings Institute reinforces Rosenman’s assessment that the public is still weary of the
nonprofit sector. As described by Rhode and Packel (2009), the survey revealed that:
About one third of Americans reported having ‘not too much’ or no confidence in
charitable organizations, and 70 percent felt that charitable organizations waste ‘a great
deal’ or a ‘fair amount’ of money. Only 10 percent thought charitable organizations did a
‘very good job’ spending money wisely; only 17 percent thought that charities did a ‘very
14
good job’ of being fair in decisions; and only one quarter thought charities did a ‘very
good job’ of helping people.
In addition to the upsetting findings revealed by the Brookings Institute, a more recent study
discovered that “those who had ‘a great deal’ of faith in charities dropped about 20 percent and
those who had ‘hardly any’ grew by 67 percent” from 2010 to 2012 (Rosenman, 2013). The
results of these surveys are upsetting and should be of greater concern to American nonprofit
leaders. The fact that the public has little faith in the ability of the nonprofit sector to help people
is also startling, considering that helping people is generally the cornerstone of most charitable
missions. Rosenman (2013) notes that when charity executives are questioned about issues
related to corruption and dishonest spending, they are generally dismissive and avoidant, failing
to address the issue. This reaction is also troubling seeing as negative perceptions of the sector
may have the consequence of reduced funding.
Many researchers hypothesize that negative public perception of the nonprofit sector will
result in a decrease in donations. One great example of this theory in action is the decrease in
donations to the nonprofit sector as a whole following the Red Cross 9/11 scandal. In their
research, Yallapragada, Roe, and Toma (2010) revealed that “When the scandal became public in
2002, donations to local charities dropped 60% from $45 million to $18 million” (p. 90). While
donation data regarding how much income the Red Cross lost specifically as a result of the
scandal was not available, the collective hit the sector took was devastating.
Additional research conducted by the Organizational Performance Initiative reports that
public confidence in the sector is “closely related to the willingness to donate” (Light, 2006, p.
3). These findings were also revealed in a 2003 survey conducted by the Brookings Center for
Public Services which “showed a clear and significant statistical relationship between general

15
confidence and willingness to contribute discretionary dollars and time” (Light, 2005, p. 4).
Further research supporting this relationship by Heller & Reitsema (2010) found that if an
organization with a positive reputation partnered with an organization with a bad reputation,
prospective donors would be less willing to donate to both, solely because of the negative
association. One area of concern which has been explored in depth by many researchers is
whether there is a statistically significant relationship between donor perception of efficiency as
it relates to low administrative costs and increased financial support. Numerous researchers have
discovered that donors are, in fact, more likely to give to organizations perceived as efficient
(Timkelman & Mankaney, 2007; Okten & Weisbrod, 2000; Jacobs & Marudas, 2009). While
some current research does suggest a relationship between donor perception and giving behavior,
there is also research that suggests the opposite.
On the other end of the spectrum, there is research that suggests there may be no
correlation between public perception and giving behavior. Research conducted by Szper and
Prakash (2010) explored whether ratings of nonprofits on a website called Charity Navigator
affected donor support. Interestingly, they found that “changes in charity ratings tend not to
affect donor support to these nonprofits” (Szper & Prakash, 2010, p. 1). A study conducted by
Frumkin and Kim (2001) explored whether “operational efficiency is recognized and rewarded
by the private funders that support nonprofit organizations” (p. 266). In this study, efficiency
referred to low administrative costs. Contrary to what was mentioned in the previous paragraph,
Frumkin and Kim (2001) discovered that “reporting low administrative to total expense ratios
and positioning an organization as efficient does not lead to greater success in garnering
contributions” (p. 271). While not directly related to financial giving, a study by Bekkers and
Bowman (2009) found that “a decline in charitable confidence is unlikely to reduce

16
volunteering” (p. 884). It is also interesting to note that donations to the United Way only fell 3.3
percent following the scandal in 1992, from those collected in 1991 (Center, Jackson, Smith, &
Stansberry, 2014). United Way chapter executives also alluded to the fact that the drop in funds
was likely “attributed to the recession and corporate down-sizing, not the Aramony shake-up”
(Center, Jackson, Smith, & Stansberry, 2014, p. 375).
While a few studies have explored the relationship between public perception and
charitable giving, most of the existing research focuses solely on donor perception of the sector
and what motivates individuals to donate (Frumkin & Kim, 2001). Limited data exists which
indicates a causal relationship between public perception and giving, and what does exist is
inconsistent. While it is clear that scandals and corrupt charitable behavior has threatened public
trust and donor perceptions of the nonprofit sector, it is not exactly clear whether public
perception directly affects historical donating behavior and planned giving. The focus of this
research is to evaluate whether public perception does, in fact, influence one’s giving choices.
More specifically, the nonprofit leaders at Swings for Dreams want to survey their 2013-2014
donor population to assess: their historical and planned donation behavior; their perceptions of
the nonprofit sector as it relates to trustworthiness, management, and donation impact; and,
whether or not there is a statistically significant relationship between perception and behavior.
As a startup nonprofit just finishing its first year of development efforts, Swings for Dreams’
founders plan to use this research to better understand their donors to implement more
customized marketing, reporting, and fundraising strategies to current and future financial
supporters.

17
Methodology
The nonprofit, Swings for Dreams, requested that a survey be designed to gather a wide
range of information about their 2013-2014 donor population. The survey was designed to
examine a number of different variables related to donating behavior and donor perceptions of
nonprofits. Historical and planned donating behavior was measured by asking respondents to
disclose how many times they had donated to a charitable organization in the past 12 months and
how likely they were to donate to a charity over the next 12 months. Respondents were also
asked about their perceptions regarding nonprofit trustworthiness, management, and donation
impact. This information was then analyzed to evaluate whether a statistically significant
relationship existed between donor perceptions and donating behavior.
While Swings for Dreams is largely interested in these research topics, the startup
nonprofit also requested that a series of additional questions be included in the questionnaire for
future follow-up surveys and their overall organizational data needs. Although the supplemental
questions were not included in this research, they were intended to give the organization added
insight about their first-year donor population. These questions were designed to reveal
information related to demographics, preferred solicitation methods, donor motivators, desirable
donation incentives, and the types of nonprofit organizations respondents were most inclined to
donate to (e.g. social services, education, religion, international, etc.).
Surveys were distributed to the 176 donors who had made financial contributions to the
organization during its first year of operation from the Fiscal Year 2013-2014. A list of donor
email addresses were readily accessible through Swings for Dreams’ detailed donor database,
and were provided by the organization’s founders. Prior to distributing the online survey, a
personal email was sent by Swings for Dreams’ founders to each of their 176 donors informing

18
them that a subsequent email would be sent from a San Jose State graduate student requesting
feedback and demographic information in the form of an online survey. Immediately following
the founders’ email to their financial supporters, a second email was sent, which included a brief
statement on the purpose of the research and a link to the online survey. A completion due date
of two weeks from when the survey was sent was given. Each donor was also informed that the
survey had to be completed in full, or it would be discarded, as Swings for Dreams’ founders
wanted the most comprehensive picture of their donors as possible.
The survey was created and published using Qualtrics, an online survey platform which
enables users to collect, store, and analyze online survey respondent data (Qualtrics, 2015). The
survey began with a statement of consent which informed the participant that the survey was
voluntary and anonymous, and that continuing the survey served as their official approval and
acknowledgment that the responses could be used in this research. Each survey was estimated to
take 5-10 minutes. In its entirety, the survey consisted of 28 multiple choice questions, but the
focus of this research entails a detailed analysis of only five, in addition to a brief examination of
Swings for Dreams’ donor demographics. Of these five questions, two asked about previous and
intended donation behavior and three related to donor perceptions of nonprofits. With the
exception of one, all of the questions were close-ended, requesting ordinal data or a yes or no
response. The exception was a yes/no question which asked the respondent whether they viewed
nonprofits as honest and trustworthy in their use of funds. If the respondent answered “no,” they
were given the option to provide an open-ended explanation, but this was not required.
In addition to analyzing respondent donation behavior and perceptions of the nonprofit
sector, Swings for Dreams also wanted to examine the demographics of their first year donors.
To account for this, the survey included multiple choice questions related to age, gender,

19
employment, marital status, education, political affiliation, religious affiliation, annual household
income, and whether or not participants had children.
Once the designated two weeks had passed from when the surveys were sent to Swings
for Dreams’ donors, the Qualtrics survey portal was officially closed to prevent additional
respondents from submitting. The survey responses were then exported as raw data into Excel.
For the demographic questions, percentage totals for each given response were calculated in
Excel using cross-tabulation tables. For the five relevant research questions, a numerical value
was designated to correspond to each available multiple choice response. The raw data was then
coded, and imported into R for statistical analysis. The statistical software R was used to manage
the coded data and run the statistical tests described in the subsequent analysis. On a technical
level, R is defined as a “scripting language for statistical data manipulation and analysis”
(Matloff, 2011, p. x). This increasingly popular free statistical analysis and visualization software
is a useful tool in the social sciences because of its flexibility, its online support, and the level of
control the package offers its users (Tippmann, 2014).
Since essentially all of the data was ordinal, responses to the five close-ended questions
were analyzed in R using Crosstabs and Chi-Square tests of independence to assess statistical
significance. The open-ended comments related to perceptions of nonprofit trustworthiness were
assessed for common themes and will discussed in more detail in the findings section.
After the initial Crosstabs and Chi-Square tests of independence were conducted,
subsequent tests using the same statistical tools were performed, but with collapsed versions of
the responses to simplify the results, to reduce the degrees of freedom, and to limit the number of
rows and columns in the tables. All of the tables were reduced to a two by two format. For
instance, planned giving Likert scale responses were combined into “likely” (very likely,
20
somewhat likely, likely) and “unlikely” (somewhat likely, unlikely, very unlikely); and,
“undecided” responses were excluded from the analysis entirely. Donation history responses
were also collapsed to reduce the number of rows to “1-5” and “6 or more.” In regards to
perceptions, responses were combined into “favorable” and “skeptical” categories. For
management perceptions, for instance, those who responded that they viewed nonprofits to be
managed “extremely well” or “quite well” would fall under the “favorable” category. Those who
responded that they viewed nonprofits to be managed “moderately well,” “slightly well,” or “not
at all well” would fall under the “skeptical” category. Similarly, for impact, those who responded
that they viewed donations to nonprofits to have “a great deal” or “a lot” of impact fell within the
“favorable” category, while those who responded that their donations had a “moderate” or “a
little” impact fell within the “skeptical” category. This secondary analysis was performed in the
hope of making the tables easier to interpret, and to assess whether the initial results were
discovered as a result of small cell populations.
Of the 176 donors who were emailed with a request to participate, 141, or 80.11 percent,
began the survey. Of the 141 who began the survey, 133 completed it in its entirety, with a total
response rate of 75.57 percent. The data from the 133 donors that completed the entire survey
will be the subject of this research (N=133).
Findings
Sample Demographics (Table 1)
Table 1 presents the demographic characteristics of the 133 survey respondents that
completed the survey from beginning to end.

21
Table 1. Sample Demographics (n=133)
Age Marital Status Employment Status
18-24 22.46% (30)
25-34 30.83% (41)
35-44 15.79% (21)
45-54 18.05% (24)
55-64 8.27% (11)
65+ 4.51% (6)
Single 48.87% (65)
Married 42.86% (57)
Partnered 1.5% (2)
Separated 0.75% (1)
Divorced 4.51% (6)
Widowed 1.5% (2)
Unemployed 6.02% (8)
Part-time 13.53% (18)
Full-time 77.44% (103)
Retired 3.01% (4)
Gender Children Religious Identification
Male 33.83% (45)
Female 66.17% (88)
Yes 39.85% (53)
No 60.15% (80)
Yes 42.86% (57)
No 57.14% (76)
Highest Education Completed
Annual Household Income Political Affiliation
Associate 4.51% (6)
Trade/technical 1.5% (2)
Some college 15.04% (20)
Bachelor’s 40.6% (54)
Some graduate 6.02% (8)
Master’s 21.8% (29)
Doctoral 3.76% (5)
MD or JD 6.77% (9)
> $25,000 10.53% (14)
$25k-$34,999 6.02% (8)
$35k-$49,999 9.77% (13)
$50k-$74,999 21.05% (28)
$75k-$99,999 9.77% (13)
$100k-$149,999 15.04% (20)
$150k or more 27.82% (37)
Democrat 51.13% (68)
Republican 12.03% (16)
Independent 14.29% (19)
Other 1.5% (2)
No Affiliation 21.05% (28)
30.82 percent, the largest proportion of Swings for Dreams’ first year donors were
between 25 to 34 years old, followed by 22.46 percent in the 18 to 24 age range. The third largest
group were the 18.05 percent of donors who fell within the 45 to 54 age range, which was only
2.26 percent higher than the 15.79 percent of respondents that were in the 35 to 44 category. The
least amount of donors were 55 to 64 and 65 or older, with a combined total of 12.78 percent.
Over half of Swings for Dreams’ donors were 44 years old or younger.
The majority of respondents (66.17%) identified as female. 39.85 percent of the survey
participants had children. Nearly half of respondents were single (48.87%), followed by the
42.86 percent that reported being married. The remaining 8.26 percent of donors were either
divorced, separated, partnered, or widowed.

22
The majority of Swings for Dreams’ first year donors had a bachelor’s degree or higher.
While 20.05 percent of respondents did not complete their undergraduate degree, they reported
having at least an associate’s degree, some college credit, or had completed trade, technical, or
vocational training. 40.6 percent, the highest percentage of respondents, had their bachelor’s,
followed by 21.8 percent having completed their Master’s degree. 6.02 percent had not finished
their graduate degree when they took the donor survey, but reported completing at least some of
their graduate program. Roughly 10 percent had completed their doctoral, medical, or law
degree. Most of Swings for Dreams’ donors reported having some type of employment. More
than 75 percent had full-time jobs, followed by 13.53 percent with part-time positions. The
remaining 9.03 percent of donors were either unemployed or retired.
More donors (57.14%) reported that they did not identify as religious, than those that
were religious (42.86%). Over half of Swings for Dreams’ donors categorized themselves as
Democrats (51.13%), followed by the 21.05 percent of respondents with no political affiliation.
14.29 percent identified as independents, and only 12.03 percent as Republicans. The lowest
percentage were the two respondents that reported having a different affiliation than the options
provided.
27.82 percent, the largest proportion of donors, reported having an annual household
income of $150,000 or more, followed by the 21.05 percent that made between $50,000 and
$74,999 per year. Next, were the 15.04 percent that reported an income between $100,000 and
$149,999. An equal percentage of donors were in the $35,000 to $49,999 (9.77%) and the
$75,000 to $99,999 (9.77%) income brackets. A little over 10 percent made less than $25,000 per
year, and the least proportion of donors made $25,000 to $34,999.

23
Donation Behavior (Table 2)
Table 2 illustrates the historical and planned donation behavior of the 133 survey
respondents.
Table 2. Donation Behavior (n=133)
2-A. Historical Donating Behavior
(Past 12 months)
0-1 17.29 % (23)
2-5 46.62% (62)
6-10 15.79% (21)
11-20 14.28% (19)
21+ 6.02% (8)
2-B. Likelihood of Making a Donation to a
Charitable Organization
(Next 12 months)
Very likely 35.34 % (47)
Likely 21.8% (29)
Somewhat likely 16.54% (22)
Undecided 6.02% (8)
Somewhat unlikely 2.26% (4)
Unlikely 3.76% (5)
Very unlikely 14.28% (19)
It is important to note that the survey question assessing historical donating behavior
asked donors to identify the total combined amount of donations made over the past year, even if
given to different organizations. As shown in table 2-A, 46.62 percent, the largest proportion of
respondents, reported donating between 2-5 times over the past 12 months. 17.29 percent, the
second largest group, reported donating 0-1 times over the past year. Because all of the survey
respondents were contacted as a result of making financial contributions to Swings for Dreams
during the past year, it is safe to say the individuals who responded donating only 0-1 times had
only donated to Swings for Dreams in the last 12 months. The lowest percentage was the 6.02
percent (8) of respondents that made an impressive 21 or more donations during the past year.
24
The percentages of those who reported making between 6-10 and 11-20 donations were fairly
similar, at around 15 percent.
As shown in 2-B, 35.34 percent, the largest proportion of respondents, reported they were
“very likely” to make a donation in the next 12 months. 14.28 percent were “very unlikely” to
make donations during the next year. This percentage is quite a bit higher than those who
reported they were “somewhat unlikely” or “unlikely” to donate. Less respondents were on the
unlikely end of the spectrum (“somewhat unlikely,” “unlikely,” and “very unlikely”) than the
73.69 percent on the likely end (“very likely,” “likely,” “somewhat likely”).
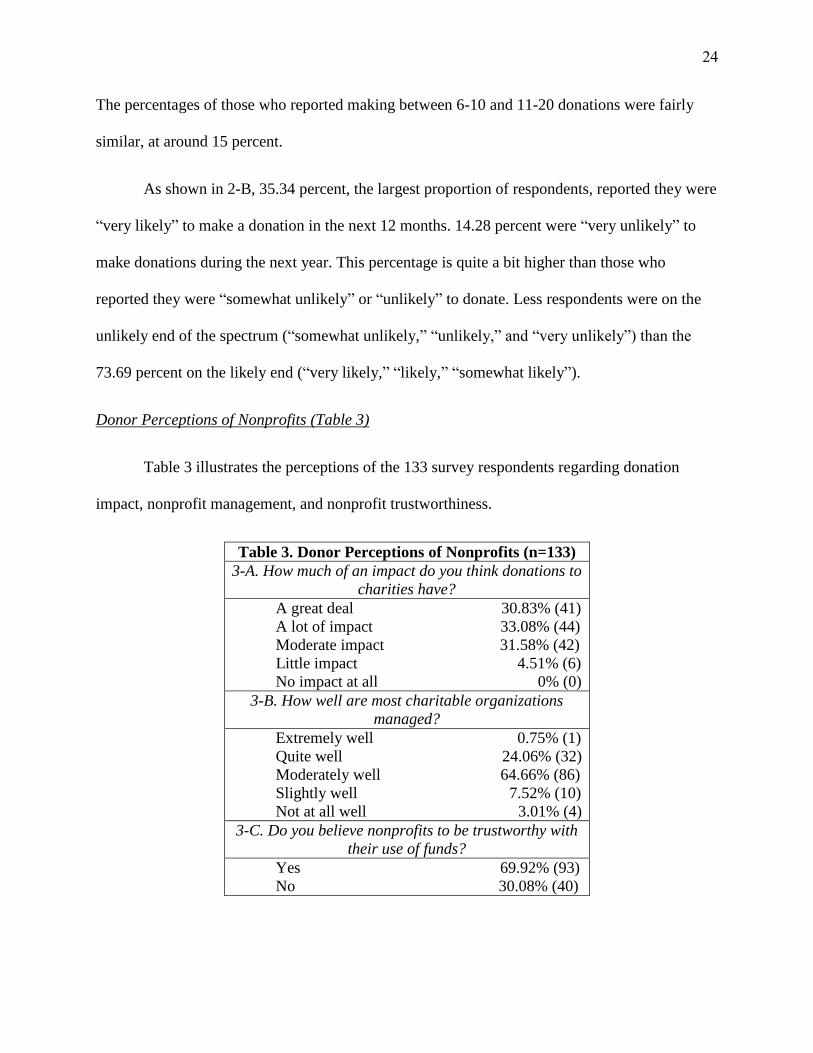
Donor Perceptions of Nonprofits (Table 3)
Table 3 illustrates the perceptions of the 133 survey respondents regarding donation
impact, nonprofit management, and nonprofit trustworthiness.
Table 3. Donor Perceptions of Nonprofits (n=133)
3-A. How much of an impact do you think donations to
charities have?
A great deal 30.83% (41)
A lot of impact 33.08% (44)
Moderate impact 31.58% (42)
Little impact 4.51% (6)
No impact at all 0% (0)
3-B. How well are most charitable organizations
managed?
Extremely well 0.75% (1)
Quite well 24.06% (32)
Moderately well 64.66% (86)
Slightly well 7.52% (10)
Not at all well 3.01% (4)
3-C. Do you believe nonprofits to be trustworthy with
their use of funds?
Yes 69.92% (93)
No 30.08% (40)

25
As shown in 3-A, 33.08 percent, the largest proportion of respondents, believed their
donations to have “a lot of impact.” None of the survey participants perceived their donations to
have “no impact at all,” and only 4.51 percent thought their donations had “a little impact.” 95.49
percent of respondents perceived their donations to have an impact that ranged between
“moderate,” “a lot,” and “a great deal.” These three impact categories resulted in fairly similar
percentages around 30.
As shown in 3-B, 64.66 percent of respondents believed nonprofits to be managed
“moderately well,” followed by 24.06 percent that perceived nonprofits to be managed “quite
well.” Only 3.01 percent of the survey participants believed nonprofits to be managed “not at
all,” and a mere 0.75% (1) perceived nonprofits to be managed “extremely well.”
As shown in 3-C, 69.92 percent of survey respondents believed nonprofits to be honest
and trustworthy in their use of funds. While this represents the majority of respondents, the
percentage of those who viewed nonprofits as untrustworthy was still relatively high at 30.08
percent. Those respondents who reported they did not believe nonprofits to be trustworthy were
given the option to explain this belief on the survey as an open-ended response. Of the 31
respondents who offered explanations, the majority referenced: a lack of financial reporting and
transparency regarding how donations are spent; concerns about too much money being spent on
overhead and administration; worries about dishonest management and fraudulent practices; too
many organizations to choose from; and, assumptions that only a small percentage of donated
funds actually go to the cause.
Donor Perceptions of Nonprofits and Donation Behavior
Swings for Dreams was also interested in assessing whether there was a statistically
significant relationship between donor perception of nonprofits and their historical and planned

26
donation behavior. It was assumed that if a donor had negative perceptions regarding nonprofit
trustworthiness, management, and donation impact, they would have made less donations over
the past 12 months and would have less of a likelihood to make donations in the future.
Tables 4 through 9 show the cross-tabulated and chi-square test of independence results
of respondent perceptions of donation impact, nonprofit trustworthiness, and nonprofit
management as it relates to planned and historical donation behavior. According to these
calculations, all but two chi-square tests of independence resulted in p-values exceeding 0.05,
which fails to reject the null hypotheses (𝐻0) in Tables 4 through 6, 7-B and 8-B, and 9. This
indicates that there is no statistically significant relationship between the independent variables,
being donor perception, and the dependent variables, being donation history and future giving.
Only Tables 7-A (impact & planned giving) and 8-A (management & planned giving)
present p-values low enough to illicit interest. Both p-values are below significance of both 5 and
1 percent. However, both tables have significantly high numbers of degrees of freedom, and they
fail the expected cell frequency condition, which mandates expected cell values of at least five in
each cross-tabulated cell. In fact, 7-A has five cells that are completely empty, and a total of 17
cells with values less than five. Similarly, 8-A has 15 empty cells, and a collective 26 cells with
values less than five. While 7-A and 8-A offer the most promising results in terms of statistical
significance, conclusions still cannot be drawn as not all of the conditions for the test have been
met. Even in their most compressed formats, which was intended to account for the low cell
populations, the results of the chi-square tests actually produced significantly higher p-values.
While 7-B was the closest to a p-value less than 0.05 at 0.056678, the results still do not reveal
significance between the variables, being donor perceptions of nonprofit impact and their
planned giving behavior.

27
Although the results of the statistical analyses in the subsequent sections do not generate
significance amongst the variables, there are some interesting patterns Swings for Dreams may
find helpful, which will be discussed in more detail below.
Impact & Donation History (Appendix 4-A & Table 4-B)
As shown in Appendix 4-A, the largest proportion of respondents donated 2-5 times with
a nearly equal percentage distribution among the “moderate,” “a lot,” and “great deal” of impact
categories. However, the percentage of those that donated 2-5 times declined dramatically once
one perceived donations to have only “a little” impact. Although the percentage difference
equated to only one respondent, it is noteworthy that the highest percentage of respondents
(15.04%) fell within the “moderate” impact and 2-5 donation category.
In general, the giving history of those who perceived their donations to have a
“moderate” to a “great deal” of impact was relatively consistent across perception categories. For
instance, the collective 15.78 percent of those who donated 6-10 times over the past year was
evenly distributed between the “moderate,” “a lot,” and “great deal” of impact categories. The
only perception category that exhibited even remotely different donation patterns was the “little”
impact classification which included a mere 4.51 percent (6) of the total survey participants.
Although, it is noteworthy that one respondent (.75%) in the “little impact” category donated 11
to 20 times over the past year.
Table 4-B. Cross tabulation of donation history by views on
donation impact (n=133)
x² = 1.251952
p = 0.26318
df= 1
History
1-5
6+
Favorable View
39.1% (52)
25.57% (34)
Skeptical View
24.8% (33)
10.53% (14)
28
Table 4-B shows the compressed and simplified categories. While the chi-square test
value, p-value, and degrees of freedom are significantly lower than the values in 4-A, the
compressed results do not reveal significance between perception of impact and donation history.
However, the compressed results do uncover that amongst the 64.67 percent of respondents with
favorable perceptions of donation impact, 39.1 percent had donated 1-5 times over the past year,
while the remaining 25.57 percent made six or more donations. The 35.33 percent of respondents
who reported being more skeptical of the impact of their donations were split with 24.8 percent
having made 1-5 donations, and 10.53 percent having made six or more donations during the last
year.
Management & Donation History (Appendix 5-A & Table 5-B)
As shown in Appendix 5-A, 29.32 percent, the largest proportion of donors, made 2-5
donations over the past 12 months with the belief that nonprofits were managed only
“moderately well.” Those who had more extreme views about nonprofit management
(“extremely well” & “not at all well”) did not exceed the 2-5 donation history category, whereas
only one respondent in the “slightly well” group surpassed the more than five donations mark.
The individuals who viewed the sector to be managed “quite” or “moderately well” contributed
the most amount of donations over the past year. In fact, the 20.31 percent of respondents that
made 11 or more donations last year fell within the “quite” and “moderately well” categories.
The one respondent that believed nonprofits to be managed “extremely well” made 2-5 donations
last year, while the three donors that believed nonprofits to be managed “not at all well” donated
2-5 times during the past 12 months.

29
Table 5-B.
Cross tabulation of donation history by views
on nonprofit management (n=133)
x² = 0.207689
p = 0.648585
df= 1
History
1-5
6+
Favorable View
15.04% (20)
9.77% (13)
Skeptical View
48.87% (65)
26.32% (35)
Table 5-B shows the compressed and simplified categories. While the chi-square test
value and the degrees of freedom are lower in this table, the p-value is actually higher, which
indicates even less significance than in 5-A. However, 5-B reveals that 75.19 percent of
respondents expressed some skepticism in regards to how they perceive nonprofits to be
managed. Yet, 26.32 of those in the skeptical category still managed to make six or more
donations over the past year. In fact, the percentages of those in the 1-5 and 6+ donation history
groups were significantly higher amongst those who had skeptical perceptions of nonprofit
management versus those who had favorable opinions.
Trust & Donation History (Appendix 6-A & Table 6-B)
As shown in Appendix 6-A, the largest percentage of individuals (46.62%) donated 2-5
times over the past year, regardless of their views on nonprofit trustworthiness. Among the 69.94
percent of respondents that perceived nonprofits as trustworthy, 14.29 percent made one
donation last year. The percentages of those that made 6-10 and 11-20 donations were equal with
a collective total of 22.56 percent, while the percentage of those who made 21 or more donations
was quite a bit lower at 3.01 percent.
The donation history of the 30.08 percent of those who perceived the nonprofit sector to
be untrustworthy was relatively consistent across all but the 2-5 donation category, which was
dramatically higher. The eight respondents (6.02%) that reported making 21 or more donations
30
over the past year was split evenly between the trustworthy (3.01%) and untrustworthy (3.01%)
perception categories.
Table 6-B. Cross tabulation of donation history by views
on nonprofit trustworthiness (n=133)
x² = 0.029478
p = 0.863679
df= 1
History
1-5
6+
Favorable View
44.36% (59)
25.56% (34)
Skeptical View
19.55% (26)
10.53% (14)
As shown in Table 6-B, the chi-test value and degrees of freedom are lower than in 6-A,
but the p-value is higher, even further reducing the significance between the variables.
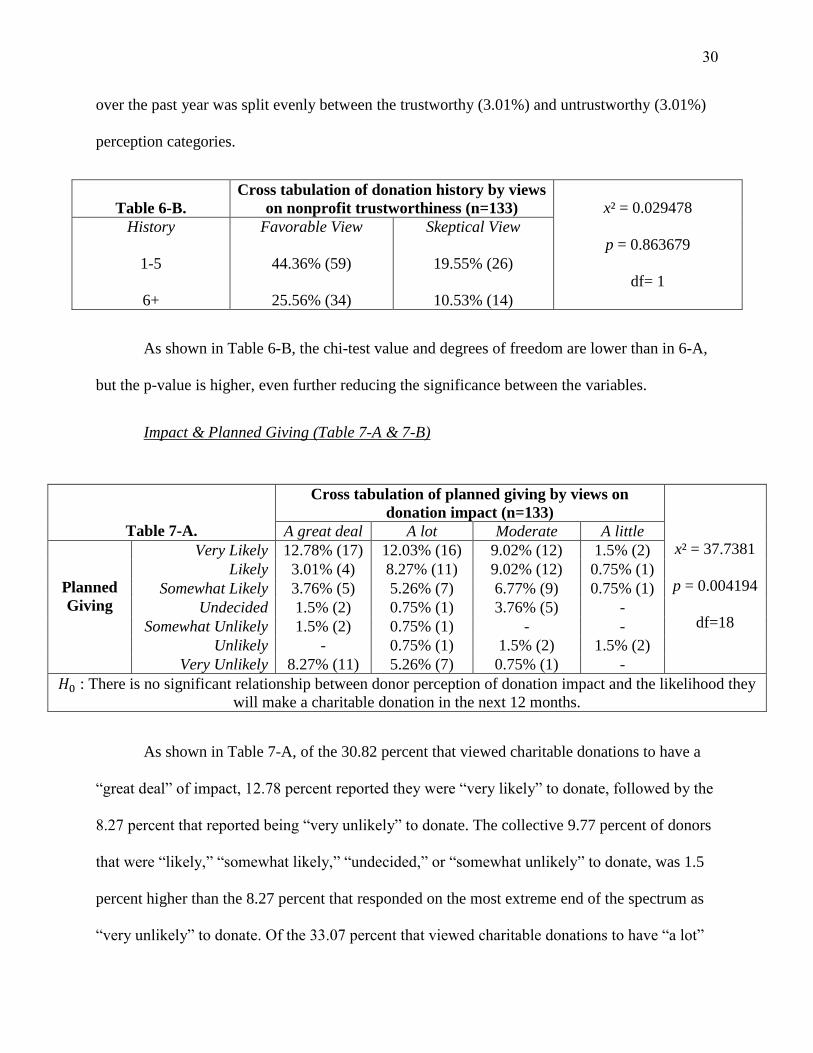
Impact & Planned Giving (Table 7-A & 7-B)
Table 7-A.
Cross tabulation of planned giving by views on
donation impact (n=133)
x² = 37.7381
p = 0.004194
df=18
A great deal A lot Moderate A little
Planned
Giving
Very Likely 12.78% (17) 12.03% (16) 9.02% (12) 1.5% (2)
Likely 3.01% (4) 8.27% (11) 9.02% (12) 0.75% (1)
Somewhat Likely 3.76% (5) 5.26% (7) 6.77% (9) 0.75% (1)
Undecided 1.5% (2) 0.75% (1) 3.76% (5) -
Somewhat Unlikely 1.5% (2) 0.75% (1) - -
Unlikely - 0.75% (1) 1.5% (2) 1.5% (2)
Very Unlikely 8.27% (11) 5.26% (7) 0.75% (1) -
𝐻0 : There is no significant relationship between donor perception of donation impact and the likelihood they
will make a charitable donation in the next 12 months.
As shown in Table 7-A, of the 30.82 percent that viewed charitable donations to have a
“great deal” of impact, 12.78 percent reported they were “very likely” to donate, followed by the
8.27 percent that reported being “very unlikely” to donate. The collective 9.77 percent of donors
that were “likely,” “somewhat likely,” “undecided,” or “somewhat unlikely” to donate, was 1.5
percent higher than the 8.27 percent that responded on the most extreme end of the spectrum as
“very unlikely” to donate. Of the 33.07 percent that viewed charitable donations to have “a lot”

31
of impact, 12.03 percent, the largest proportion of respondents, were “very likely” to donate,
followed by 8.02 percent that were “likely.” The next highest percentages were the 5.26 percent
that were “somewhat likely” and the 5.26 that reported being “very unlikely” to donate. The
other three categories were tied at 0.75 percent each.
Similarly to the 30.82 percent of donors that perceived charitable donations to have a
“great deal” of impact, 30.82 percent of the survey participants also perceived donations to have
a “moderate” amount of impact. Of the 30.82 percent in this category, Swings for Dreams’
donors were tied with a collective 18.04 percent being “very likely” or “likely” to donate over
the next year. In this “moderate” impact category, the percentage of respondents decreased as the
likelihood of making a donation was lessened. Those who perceived their donations to have only
“a little” impact was a much smaller group totaling a mere 4.5 percent, with a relatively similar
distribution between the “very likely,” “likely,” “somewhat likely,” and “unlikely” planned
giving options. Not one of the six respondents in this category reported being “very unlikely” to
make a donation.
Table 7-B.
Cross tabulation of planned giving by views
on donation impact (n=125)
x² = 3.632029
p = 0.056678
df= 1
Planned Giving
Likely
Unlikely
Favorable View
48.39% (60)
17.74% (22)
Skeptical View
29.84% (37)
4.03% (5)
While the results of 7-A represented the most promising p-values, collapsing the
categories in 7-B did not assist in increasing the significance. In fact, the p-value in 7-B was
higher. However, of all the variables that were tested for significance in this research,
perceptions of impact and planned giving appear to have the closest relationship. Of those
respondents who reported being likely to donate over the next year, close to half (48.39%) had

32
favorable opinions of nonprofit management, while almost 30 percent were skeptical. Of the
nearly 22 percent of those who reported being unlikely to donate over the next year, the majority
(17.74%) had favorable opinions of nonprofit impact, while a mere 4.03 percent were skeptical.
Management & Planned Giving (Tables 8-A & 8-B)
Table 8-A.
Cross tabulation of planned giving by views on nonprofit
management (n=133)
x² = 50.5833
p = 0.001192
df=24
Extremely
well
Quite well Moderately
well
Slightly
well
Not at all
well
Planned
Giving
Very Likely - 8.27% (11) 26.32% (35) - 0.75% (1)
Likely - 6.02% (8) 12.78% (17) 3.01% (4) -
Somewhat Likely - 2.26% (3) 9.77% (13) 3.76% (5) 0.75% (1)
Undecided 0.75% (1) - 4.51% (6) - 0.75% (1)
Somewhat Unlikely - 1.5% (2) 0.75% (1) - -
Unlikely - - 2.26% (3) 0.75% (1) 0.75% (1)
Very Unlikely - 6.02% (8) 8.27% (11) - -
𝐻0 : There is no significant relationship between donor perception of nonprofit management and the likelihood
they will make a charitable donation in the next 12 months.
As shown in Table 8-A, only one respondent, out of the 133 total survey participants
reported that they perceived the nonprofit sector to be managed “extremely well,” yet they were
“undecided” as to whether or not they planned to make a charitable donation during the next 12
months. Most of Swings for Dreams’ donors believed the sector to be managed “quite” or
“moderately” well, with the highest percentage of donors in each category reporting that they
were “very likely” to donate. In fact, most respondents in the “quite” to “moderately” well
categories were on “likely” to donate end of the spectrum. However, these two categories still
resulted in a combined total of 14.29 percent that were “very unlikely” to donate. The
respondents that perceived the sector to be managed “slightly” or “not at all” well had a
combined total of roughly 10.52 percent, with over eight percent reporting they were between
“somewhat likely” to “very likely” to make a donation.
33
Table 8-B. Cross tabulation of planned giving by views
on nonprofit management (n=125)
x² = 2.365167
p = 0.124071
df= 1
Planned Giving
Likely
Unlikely
Favorable View
17.6% (22)
8% (10)
Skeptical View
60.8% (76)
13.6% (17)
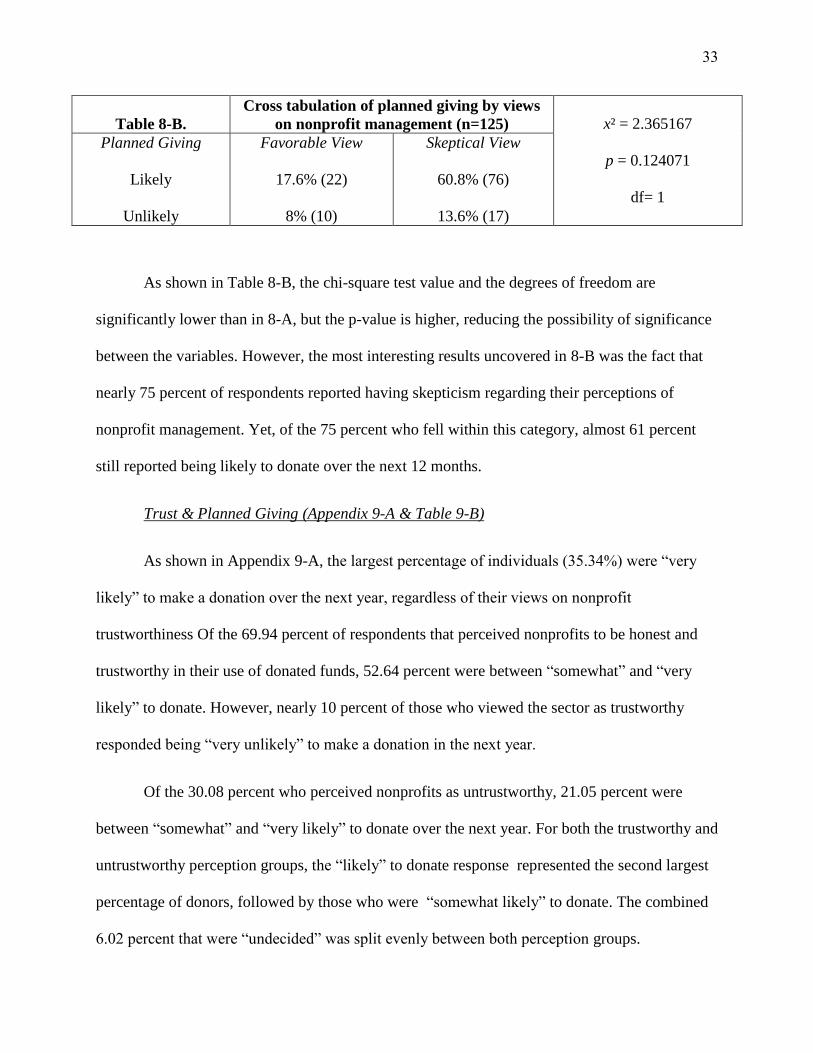
As shown in Table 8-B, the chi-square test value and the degrees of freedom are
significantly lower than in 8-A, but the p-value is higher, reducing the possibility of significance
between the variables. However, the most interesting results uncovered in 8-B was the fact that
nearly 75 percent of respondents reported having skepticism regarding their perceptions of
nonprofit management. Yet, of the 75 percent who fell within this category, almost 61 percent
still reported being likely to donate over the next 12 months.
Trust & Planned Giving (Appendix 9-A & Table 9-B)
As shown in Appendix 9-A, the largest percentage of individuals (35.34%) were “very
likely” to make a donation over the next year, regardless of their views on nonprofit
trustworthiness Of the 69.94 percent of respondents that perceived nonprofits to be honest and
trustworthy in their use of donated funds, 52.64 percent were between “somewhat” and “very
likely” to donate. However, nearly 10 percent of those who viewed the sector as trustworthy
responded being “very unlikely” to make a donation in the next year.
Of the 30.08 percent who perceived nonprofits as untrustworthy, 21.05 percent were
between “somewhat” and “very likely” to donate over the next year. For both the trustworthy and
untrustworthy perception groups, the “likely” to donate response represented the second largest
percentage of donors, followed by those who were “somewhat likely” to donate. The combined
6.02 percent that were “undecided” was split evenly between both perception groups.

34
Table 9-B. Cross tabulation of planned giving by views
on nonprofit trustworthiness (n=125)
x² = 0.01156
p = 0.91438
df= 1
Planned Giving
Likely
Unlikely
Favorable View
56% (70)
15.2% (19)
Skeptical View
22.4% (28)
6.4% (8)
As shown in Table 9-B, the chi-square test value and the degrees of freedom are
significantly lower than in 9-A, but the p-value is higher, which eliminates the possibility of
significance between the variables.
Analysis & Conclusion
The unit of analysis in this research were the individual donors who made financial
contributions to Swings for Dreams in 2013-2014. Because the sample was neither random nor
representative, it is important to note that the results of this research cannot be applied to a larger
population. However, representativeness was not a requirement and a nonprobability sample was
appropriate for this research question, as it targeted a specific population based on a
commonality, being those individuals who had made financial contributions to Swings for
Dreams during a 12 month period. It is also important to note that the results of this research are
somewhat limited by the relatively small sample size, which contributed to the failed expected
cell frequency condition in the first round of statistical tests (4-A, 5-A, 6-A, 7-A, 8-A, 9-A). The
expected cell frequency condition mandates expected values of at least five in each cross-
tabulated cell, which essentially works to make certain there is a large enough sample size to
ensure a true test of categorical independence. While the results of the chi-square tests of
independence in 7-A and 8-A offered the most promising results in terms of low enough p-values
to indicate statistical significance, conclusions still cannot be drawn using strict statistics as all of

35
the conditions for the test have not been met. Attempts to remedy the failed cell frequency
conditions by compressing responses into two by two tables eliminated the low cell value issue,
but increased the p-values in all but one table, 4-B.
In addition to providing Swings for Dreams with valuable information about their first
year donors, the purpose of this study was to fill a gap in the existing research that confirmed a
statistically significant relationship between donor perception and donation behavior. However,
the results of the survey and subsequent statistical analysis suggest there is no relationship
between Swings for Dreams’ donors’ perceptions of the nonprofit sector and their historical and
planned donating behavior, which is contrary to what the organization’s founders had thought
prior to the survey. While this is somewhat surprising, these results are not completely
unexpected seeing as a portion of the existing research also fails to find a statistically significant
relationship between perception and behavior. Although no correlation can be concluded, this
research contributes to Swings for Dreams’ understanding of their donor population and their
respective donation patterns nonetheless. The results also shed light on the reputation issues still
facing the sector as a whole, and raise additional questions as to what variables, if any, impact
donation behavior.
In regards to donor demographics, the survey paints a partial picture of Swings for
Dreams’ donor population, and raises additional questions as to whether one’s demographic
profile contributes to donation behavior. Some of the more interesting results relate to donor
education and income levels. According to the survey results, Swings for Dreams’ first year
donors were rather affluent - mostly educated individuals with full-time jobs and notably high
household incomes. This may be as a result of the fact that the organization’s founders
predominantly solicited donations from individuals they knew personally. With the knowledge

36
that both founders were born and raised in the San Francisco Bay Area, a region known for its
concentration of wealth and highly educated individuals (Morello & Mellnick, 2013; Knight,
2014), it is not surprising over 78 percent of respondents had at least a bachelor’s degree, over 77
percent were employed full-time, and over half had household incomes of $75,000 or higher.
While the demographic data was not explored in too much detail in this study, it might be
worthwhile for Swings for Dreams to conduct a follow-up study to see if demographics play a
role in historical and planned giving behavior. More specifically, Swings for Dreams may want
to explore which organizational factors or values attract wealthier, more educated populations to
donate. This information could then aid in the creation and implementation of targeted
fundraising strategies to further Swings for Dreams’ long-term growth and development goals.
The survey also revealed that Swings for Dreams’ donors appeared to be a relatively
generous group. Regardless of their perceptions of the nonprofit sector, almost 83 percent made
two or more financial contributions to a charity over the past twelve months, and over 73 percent
reported that they were likely to make a donation in the upcoming twelve months. It also appears
that Swings for Dreams’ donors have more favorable opinions of the nonprofit sector than what
was described in much of the research. However, similar to the mixed opinions in the existing
research regarding the relationship between perceptions of the sector and donation behavior,
Swings for Dreams’ donors’ responses to the survey present some equally conflicting results.
Some of the most interesting and contradictory results entailed the instances where
negative perceptions of the sector had no effect on one’s decision to make a significantly large
number of donations, or the high likelihood of making financial contributions in the future. For
instance, the perception that donations had only “a little” impact did not prevent one respondent
from making 11-20 donations over the past year. In addition, the 26.52 percent of donors who

37
reported having a skeptical view of nonprofit management still donated 6 or more times over the
past year. Similarly, positive perceptions of the sector did not necessarily result in frequent
historical donation patterns or the likelihood one would donate in the future. For example, among
the 69.94 percent of respondents that perceived nonprofits as trustworthy, 14.29 percent made a
mere one donation last year, and nearly 10 percent responded that they were “very unlikely” to
donate in the upcoming year. These results seem contradictory to what one would expect using
both common sense and basic psychological theory. This also leads one to believe what other
factors come into play when making the strategic decision to donate.
The results of this study provided valuable insight into Swings for Dreams’ donor
demographics, their overall generosity, and their mixed perceptions of the nonprofit sector.
However, it seems more inquiries arose than were answered from this research related to what
impacts donation behavior. It also appears that nonprofits have a long way to go to restore public
trust in the sector. Whether or not perceptions impact donation behavior, it cannot be beneficial
to have prospective donors perceiving charities as untrustworthy, poorly managed, and incapable
of creating impact with the money that is given to them. While Swings for Dreams’ donors
reported having more positive opinions of the nonprofit sector than those individuals surveyed in
some of the studies discussed in the literature review, there is still a significant degree of doubt.
The fact that only one out of 133 respondents believed nonprofits to be managed “extremely
well” is one such statistic that should trouble the founders at Swings for Dreams, and the sector
as a whole.
While a statistically significant relationship does not exist between the perceptions and
donation behavior of Swings for Dreams’ first year donors, further research conducted on a
larger sample over a few years could provide a more useful and comprehensive analysis. For
38
instance, if a few years’ worth of historical and planned giving data was available, an analysis
could be conducted to investigate if multiple years of donating behavior declines or increases
over time as a result of donor perception. Thus, Swings for Dreams may want to consider
distributing another survey once they have been in operation for a longer period of time, are
more established as an organization, and have a larger donor pool to survey.
Regardless, Swings for Dreams should make every effort to strengthen the relationship
they have with current and future donors so they can continue to serve their beneficiaries. Donor
support is essential for continued operations and cannot be anything less than a priority. To
address donor misgivings, Swings for Dreams should take steps to: build trust with their donors
and future supporters; to adopt transparent reporting and measurement procedures; to uphold
efficient management practices; and, to be cautious as to how much money is spent on overhead
and administration. As a start-up nonprofit in the beginning stages of development, Swings for
Dreams can learn from the United Way and Red Cross scandals, which highlight the devastation
that can occur to the reputation of the nonprofit sector as a whole due to the bad practices
exercised by just one or two organizations. Furthermore, Swings for Dreams should play an
active role in the restoration of public trust and faith in the sector by listening to their donors and
adopting good practices.

39
Works Cited
Anheier, H.K. (2014). Nonprofit organizations: An introduction (2nd edition): Theory,
management, policy. New York, NY: Routledge
Ashley, S.R. & Van Slyke, D.M. (2012). The influence of administrative cost ratios on state
government grant allocations to nonprofits. Public Administration Review, 72(1), S47-
S46. doi: 10.1111/j.1540-6210.2012.02666.x
Ashley, S. & Faulk, L. (2010). Nonprofit competition in the grants marketplace: Exploring the
relationship between nonprofits financial ratios and grant amount. Nonprofit
Management & Leadership, 21(1), 43-57. doi: 10.1002/nml.20011
Attkisson, S. (2002). Disaster strikes in Red Cross backyard. CBS. Retrieved from
http://www.cbsnews.com/news/disaster-strikes-in-red-cross-backyard/
Barman, E.A. (2002). Asserting difference: The strategic response of nonprofit organizations to
competition. Social Forces, 80(4), 1191-1222. Retrieved from
http://www.discover.sjlibrary.org:50080/ebsco-w-a/ehost/pdfviewer/ pdfviewer?sid=a63
a8d99-b911-49c7-ac4a-1d9e998f7e4e%40sessionmgr4005&vid=1&hid=4212
BBB Wise Giving Alliance. (2015). Implementation guide to BBB Wise Giving Alliance
standards for charity accountability. Retrieved from http://www.bbb.org/new-york-
city/charities-donors/implementation-guide/
Bekkers, R. & Bowman, W. (2009). The relationship between confidence in charitable
organizations and volunteering revisited. Nonprofit and Volunteer Sector Quarterly,
38(5), 884-897. doi: 10.1177/0899764008324516
Blackwood, A.S., Pettijohn, S.L., & Roeger, K.L. (2012). The nonprofit almanac 2012.
Washington DC: Urban Institute Press.
Blanchard, L.D. (2014). Charitable nonprofits' use of noncompetition agreements: Having the
best of both worlds. Golden Gate University Law Review, 44(3), 1-35. Retrieved from
http://digitalcommons.law.ggu.edu/cgi/viewcontent.cgi?article=2125&context=ggulrev
Bosman, J. (2009). Newly poor swell lines at food banks. New York Times. Retrieved from
http://www.nytimes.com/2009/02/20/nyregion/20food.html?pagewanted=all&_r=0
40
Bray, I. (2013). Effective fundraising for nonprofits: Real-world strategies that work. Berkeley,
CA: NOLO.
Breeze, B. (2013). How donors choose charities: The role of personal taste and experiences in
giving decisions. Voluntary Sector Review, 4(2), 165-183. doi:
10.1177/0899764006293176
Bryce, H.J. (2012). Players in the public policy process: Nonprofits as social capital and agents.
New York, NY: Palgrave Macmillan.
Burt, C.D. (2014). Managing the public’s trust in non-profit organizations. New York, NY:
Springer.
Carson, E.D. (2002). Pubic expectations and nonprofit sector realities: A growing divide with
disastrous consequences. Nonprofit and Voluntary Sector Quarterly, 31(3), 429-436.
doi: 10.1177/0899764002313007
Center, A.H., Jackson, P., Smith, S., & Stansberry, F.R. (2014). Public relations practices:
Managerial case studies and problems. San Francisco, CA: Pearson Education Inc.
CharityWatch. (2014). CharityWatch hall of shame. Retrieved from www.charitywatch.org/
Charitywatch-articles/charitywatch-hall-of-chame/63
Chase, S. (2012). The bloody truth: Examining America’s blood industry and its tort liability
through the Arkansas prison plasma scandal. William & Mary Law Review, 3(2), 597-
644. Retrieved from http://www.scholarship.law.wm.edu/cgi/viewcontent.cgi?article=
1042&context=wmblr
Evans, D.M. (2012). Charities deceive donors unaware money goes to a telemarketer.
Bloomberg Business. Retrieved from http://www.bloomberg.com/news/articles/2012-09-
12/charities-deceive-donors-unaware-money-goes-to-a-telemarketer
Feeding America. (2014). Hunger in America 2014 executive summary: A report on charitable
food distribution in the United States in 2013. Chicago, IL: Feeding America.
Foundation Center. (2002). September 11: The philanthropic response. Retrieved from
http://www.Foundationcenter.org/gainknowledge/research/pdf/911book3.pdf
Frumkin, P. & Kim, M.T. (2001). Strategic positioning and the financing of nonprofit

41
organizations: Is efficiency rewarded in the contributions marketplace? Public
Administration Review, 61(3), 266-275. Retrieved from
http://discover.sjlibrary.org:50080/ebsco-w-b/ehost/pdfviewer/pdfviewer?sid=ddf15db7-
c6d9-417b-ba51-be3169687c9a%40sessionmgr198&vid=1&hid=102
Fussell-Sisco, H., Collins, E.. & Zoch, L. (2010). Through the looking glass: A decade of Red
Cross crisis response and situational crisis communication theory. Public Relations
Review, 36(1), 21-27. doi: 10.1016/j.pubrev.2009.08.018
Harrison, T. & Thornton, J. (2014). Too many nonprofits? An empirical approach to estimating
trends in nonprofit demand density. Nonprofit Policy Forum, 5(2), 213–229.
doi: 10.1515/npf-2014-0009
Heller, N. & Reitsema, K. (2010). The use of brand alliances to change perceptions of nonprofit
and private organizations. Journal of Applied Business and Economics, 11(4), 128-140.
Retrieved from http://na-businesspress.homestead.com/JABE/HellerWeb.pdf
Hsu, J.L., Liang, G.Y., & Tien, C.P. (2005). Social concerns and willingness to support
charities. Social Behavior and Personality: An International Journal, 33(2), 189-200.
doi: 10.2224/sbp.2005.33.2.189
Independent Sector. (2014). Sector Impact: What is a nonprofit organization? Retrieved from
https://www.independentsector.org/nonprofit
Internal Revenue Service. (2015). Charitable solicitation: Initial state registration. Retrieved
from http://www.irs.gov/Charities-&-Non-Profits/Charitable-Organizations/Charitable-
Solicitation-Initial-State-Registration
Internal Revenue Service. (2014). Applying for exemption: Difference between nonprofit and
tax-exempt status. Retrieved from http://www.irs.gov/Charities-&-Non-Profits/
Applying-for-Exemption-Difference-Between-Nonprofit-and-Tax-Exempt-Status
Jacobs, F.A. & Marudas, N.P. (2009). The combined effect of donation price and administrative
inefficiency on donations to U.S. nonprofit organizations. Financial Accountability and
Management, 25(1), 33-53. doi:10.1111/j.1468-0408.2008.00464.x
Kavoussi, B. (2012). InfoCision charity scam: Report finds telemarketing company takes largest
cut of donations. Huffington Post. Retrieved from
42
http://www.huffingtonpost.com/2012/09/12/infocision-charity-scam_n_1871328.html
Kearney, M., Harris, B., Jacome, E., & L. Parker. (2013). A dozen facts about America’s
struggling middle class. The Hamilton Project. Retrieved from http://www.brookings.edu
/research/reports/2013/122/12-facts-lower-middle-class
Keating, E.K. Parsons, L.M, & Roberts, A.A. (2003). Cost-effectiveness of nonprofit
telemarketing campaigns. New Directions for Philanthropic Fundraising, 2003(41), 79-
94. Retrieved from http://web.a.ebscohost.com/libaccess.sjlibrary.org/ehost/pdfviewer/
pdfviewer?sid=0b47ce72-3416-485e- b97765426809c39e%40sessionmgr4005&vid=3&
&hid=4207
Knight, H. (2014). Income inequality on par with developing nations. SF Gate. Retrieved from
http://www.sfgate.com/bayarea/article/Income-inequality-on-par-with-developing-
nations-5486434.php
Light, P.C. (2006). Confidence in charitable organizations, 2006. NYU Robert F Wagner
Graduate School of Public Service. Retrieved from
https://www.wagner.nyu.edu/files/performance/charities06.pdf
Light, P.C. (2005). Rebuilding confidence in charitable organizations. NYU Robert F Wagner
Graduate School of Public Service. Retrieved from
http://wagner.nyu.edu/files/faculty/publications/wpb1_light.pdf
Matloff, N. (2011). The art of R programming: A tour of statistical software design. San
Francisco, CA: No Starch Press.
Mead, J. (2008). Confidence in the nonprofit sector through Sarbanes-Oxley-style reforms.
Michigan Law Review, 106(5), 881-900. Retrieved from http://www.jstor.org/stable/
40041642
Montague, J. (2013). The law and financial transparency in churches: Reconsidering the form
990 exemption. Cardoza Law Review, 35, 203-265. Retrieved from
http://www.cardozolawreview.com/content/35-1/MONTAGUE.35.1.pdf
Morello, C., & Mellnik, T. (2013). Washington: A world apart. The Washington Post. Retrieved
from http://www.washingtonpost.com/sf/local/2013/11/09/washington-a-world-apart/
43
Nash, D. (Producer). (2012, September 12). Donors unaware charity money goes to telemarketer
[video file]. New York, NY: National Broadcasting Company. Retrieved from
from http://www.today.com/video/today/49000523#49000523
National Philanthropic Trust. (2014). Charitable giving statistics. Retrieved from
http://www.nptrust.org/philanthropic-resources/charitable-giving-statistics/
Nonprofit Finance Fund. (2014). 2014 state of the nonprofit sector survey results. Retrieved from
http://www.nonprofitfinancefund.org/files/docs/2014/2014survey_natl_summary.pdf
Okten, C. & Weisbrod, B.A. (2000). Determinants of donations in private nonprofit markets.
Journal of Public Economics, 75(2), 255-272. Retrieved from http://www.econpapers.
Repec.org/paper/wopnwuipr/99-10.htm
Ottenhoff, B. & Ulrich, G. (2012). Three steps to more informed giving. Stanford Social
Innovation Review. Retrieved from http://www.ssireview.org/blog/entry/three_steps_to_
More_informed_giving
Pew Research Center. (2012). The lost decade of the middle class: Fewer, poorer, gloomier.
Retrieved from http://www.pewsocialtrends.org/2012/08/22/the-lost-deacde-of-the-
middle-class/
Prufer, J. (2011). Competition and mergers among nonprofits. Journal of Competition Law &
Economics, 7(1), 69-92. doi: 10.1093/joclec/nhq015
Qualtrics. (2015). About us. Retrieved from http://www.qualtrics.com/about/
Red Cross. (2015). What we do. Retrieved from http://www.redcross.org/what-we/do
Rhode, D.L. & A.K. Packel. (2009). Ethics and nonprofits. Stanford Social Innovation Review.
Retrieved from www.ssireview.org/articles/entry/ethics_and_nonprofits
Rose, D. (2014). Philanthropy vs. charity: America's third sector. Retrieved from
http://discover.sjlibrary.org:50080/ebsco-w-b/ehost/pdfviewer/pdfviewer?sid=99eb7a4b-
31a3-4c48-b506-12332a03f532%40sessionmgr110&vid=1&hid=125
Rosenman, M. (2014). Dishonesty by people in positions of trust is eroding public confidence.
Chronicle of Philanthropy, 26(8), 1-4. Retrieved from http://www.philanthropy.com/
article/Dishonesty-by-people-in/153497

44
Rosenman, M. (2013). Nonprofits need to denounce bad fundraising practices. Chronicle of
Philanthropy, 25(16), 1-4. Retrieved from http://www.philanthropy.com/article/
nonprofits-need-to-denounce/154633
Schloderer, M., Sarstedt, M., & Ringle, C.M. (2014). The relevance of reputation in the nonprofit
sector: The moderating effect of socio-demographic characteristic. International Journal
of Nonprofit & Voluntary Sector Marketing, 19(2), 110-126. Doi: 10.1002/nvsm.1491
Shapiro, T.R. (2011). United Way leader’s fraud scandal marred charitable legacy. The
Washington Post. Retrieved from http://www.washingtonpost.com/local/obituaries/
united-way-leaders-fraud-scandal-\marred-charitable-legacy/2011/11/14/glQALnwb
MN_story.html
Simon, C.A., Yak, M., & J.S. Ott. (2013). MPA program partnerships with nonprofit
organizations: Benefits to MPA programs, MPA students and graduates, nonprofit
organizations, and communities. Journal of Public Affairs Education, 19(2), 355-374.
Retrieved from http://www.naspaa.org/jpaemessenger/Article/VOL19-
2/10_Simon%20Yack%20Ott.pdf
Swings for Dreams. (2014). History of the organization. Retrieved from
http://www.swingsfordreams.org/history
Szper, R. & Prakash, A. (2010). Charity watchdogs and the limits of information-based
regulation. International Journal of Voluntary and Nonprofit Organizations, 22(1), 112-
141. doi: 10.1007/s11266-010-9156-2
Tinkelman, D. & Mankaney, K. (2007). When is administrative efficiency associated with
charitable donations? Nonprofit and Voluntary Sector Quarterly, 36(1), 41-64.
doi: 10.1177/0899764006293176
Tippmann, S. (2014). Programming tools: Adventures with R. Nature International Weekly
Journal of Science, 517(7532). Retrieved from http://www.nature.com/news/
Programming-tools-adventures-with-r.1.16609
United Way. (2015). Vision, mission, and goals. Retrieved from
http://www.unitedway.org/pages/mission-and-goals

45
Vaughan, S.K. (2010). The importance of performance assessment in local government decisions
to fund health and human services nonprofit organizations. Journal of Health and Human
Services Administration 32(4), 486-512. Retrieved from
http://www.jstor.org.stable/41548442
Vogelsang, J., Brazzel, M., Gordon, A., Mayes, A., Royal, C., & Viets, A. (2015). Introduction
to OD and the nonprofit sector. OD Practitioner, 47(1), 3-7. Retrieved from
http://discover.sjlibrary.org:50080/ebsco-w-b/ehost/pdfviewer/pdfviewer?sid=57cf5491-
5edf-41ea-95f3-c2a835207e12%40sessionmgr115&vid=3&hid=110
Wallace, N. (2006). Confidence in charities rises, but not to levels before 9/11. Chronicle of
Philanthropy, 18(23), 1-3. Retrieved from http://www.philanthropy.com/article/
confidence-in-charities-rises/171763
Wilhelm, I. & Williams, G. (2002). United Way in the nation’s capital tries to win back donors’
confidence. Chronicle of Philanthropy, 14(23). Retrieved from http://www.philanthopy.
com/article/United-Way-in-the-nations/184639#
Yallapragada, R.R., Roe, W, & Toma, A.G. (2010). Sarbanes-Oxley Act of 2002 and non-profit
organizations. Journal of Business & Economic Research, 8(2), 89-94. Retrieved from
http://www.cluteinstitute.com/ojs/index.php/JBER/article/viewFile/676/662
Yurenka, D. (2007). Growth in the nonprofit sector and competition for funding. University of
Chicago. Retrieved from http://www.economics.uchicago.edu/yurenka_nonprofit.pdf

46
Appendix 4-A. Impact & Donation History
Table 4-A.
Cross tabulation of donation history by views on donation
impact (n=133)
x² = 5.0903
p = 0.95489
df=12
A great deal A lot Moderate A little
Donation
History
0-1 6.02% (8) 4.51% (6) 6.02% (8) 0.75% (1)
2-5 14.29% (19) 14.29% (19) 15.04% (20) 3.01% (4)
6-10 5.26% (7) 5.26% (7) 5.26% (7) -
11-20 3.76% (5) 6.02% (8) 3.76% (5) 0.75% (1)
21+ 2.26% (3) 3.01% (4) 0.75% (1) -
𝐻0 : There is no significant relationship between donor perception of donation impact and the number
of instances they made charitable donations over the past 12 months.

47
Appendix 5-A. Management & Donation History
Table 5-A.
Cross tabulation of donation history by views on nonprofit
management (n=133)
x² = 15.9004
p = 0.459933
df=16
Extremely
well
Quite well Moderately
well
Slightly
well
Not at all
well
Donation
History
0-1 - 5.26% (7) 9.77% (13) 1.5% (2) 0.75% (1)
2-5 0.75% (1) 9.02% (12) 29.32% (39) 5.26% (7) 2.26% (3)
6-10 - 2.26% (3) 12.78% (17) 0.75% (1) -
11-20 - 3.76% (5) 10.53% (14) - -
21+ - 3.76% (5) 2.26% (3) - -
𝐻0 : There is no significant relationship between donor perception of nonprofit management and the
number of instances they made charitable donations over the past 12 months.

48
Appendix 6-A. Trust & Donation History
Table 6-A.
Cross tabulation of donation history
by views on nonprofit
trustworthiness (n=133)
x² = 4.89024
p = 0.298745
df=4
Yes No
Donation
History
0-1 14.29% (19) 3.01% (4)
2-5 30.08% (40) 16.54% (22)
6-10 11.28% (15) 4.51% (6)
11-20 11.28% (15) 3.01% (4)
21+ 3.01% (4) 3.01% (4)
𝐻0 : There is no significant relationship between donor perception of nonprofit
trustworthiness and the number of instances they made charitable donations over the
past 12 months.

49
Appendix 9-A. Trust & Planned Giving
Table 9-A.
Cross tabulation of planned
giving by views on nonprofit
trustworthiness (n=133)
x² = 3.56094
p = 0.73584
df=6
Yes No
Planned Giving
Very Likely 26.32% (35) 9.02% (12)
Likely 15.04% (20) 6.77% (9)
Somewhat Likely 11.28% (15) 5.26% (7)
Undecided 3.01% (4) 3.01% (4)
Somewhat Unlikely 2.26% (3) -
Unlikely 2.26% (3) 1.5% (2)
Very Unlikely 9.77% (13) 4.51% (6)
𝐻0 : There is no significant relationship between donor perception of nonprofit
trustworthiness and the likelihood they will make a charitable donation in the next 12
months.

50
Donor Survey
1. How likely are you to donate money to a charity or non-profit organization in the next 12
months?
I. Extremely likely
II. Quite likely
III. Moderately likely
IV. Slightly likely
V. Not at all likely
2. About how many times have you donated money to a charitable organization within the
past 12 months (total combined, even if given to different organizations)?
I. 0-1
II. 2-5
III. 6-10
IV. 11-20
V. 21 or more times
3. Have you ever enrolled in an automatic donation payment plan with a particular
organization?
I. Yes
II. No (if no, please skip to question 4)
4. Did you find that this automatic payment plan made it easier to donate?
I. Yes
II. No
5. What has been the most common approach method you have experienced when being
asked to donate?
I. In person
II. Email
III. Phone
IV. Social Media
V. Mail
VI. Other:
6. Did this method of approach play a role in motivating you to donate?
I. Yes
i. Please specify why:
II. No
7. What is your preferred method of approach?
I. In person
II. Email
III. Phone
IV. Social Media
V. Other:
8. Do you believe that the vast majority of charitable organizations are trustworthy and are
honest in their use of funds?
I. Yes
II. No
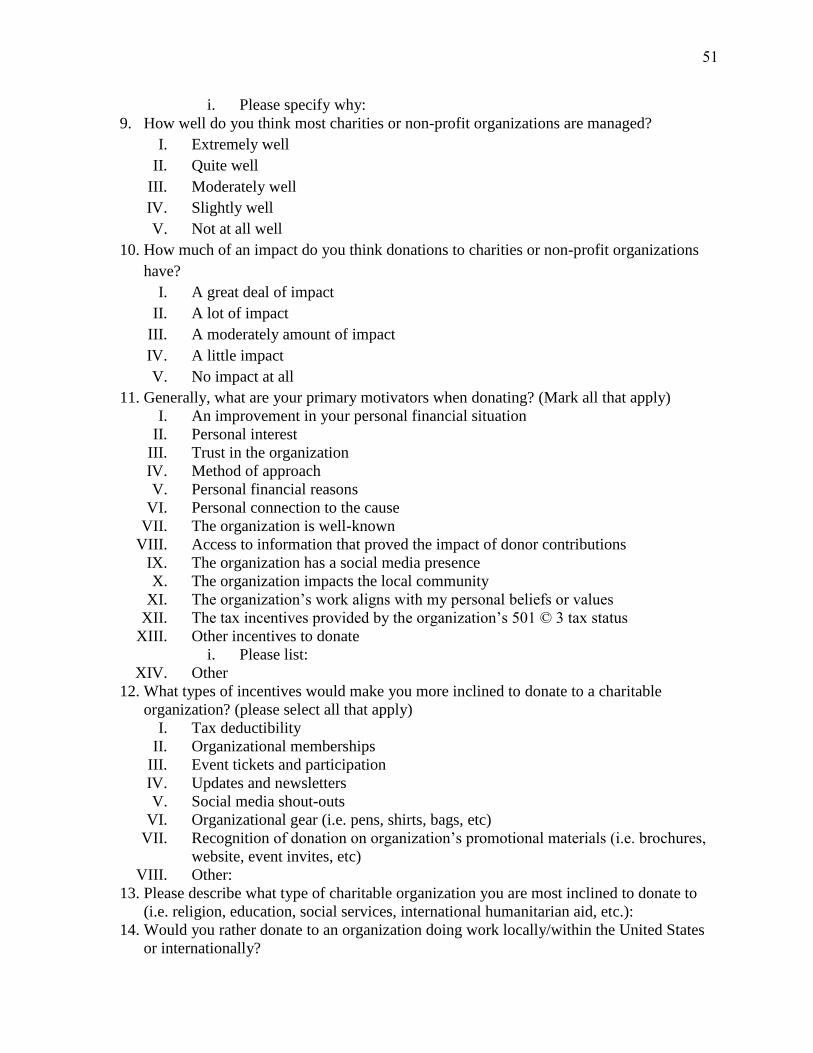
51
i. Please specify why:
9. How well do you think most charities or non-profit organizations are managed?
I. Extremely well
II. Quite well
III. Moderately well
IV. Slightly well
V. Not at all well
10. How much of an impact do you think donations to charities or non-profit organizations
have?
I. A great deal of impact
II. A lot of impact
III. A moderately amount of impact
IV. A little impact
V. No impact at all
11. Generally, what are your primary motivators when donating? (Mark all that apply)
I. An improvement in your personal financial situation
II. Personal interest
III. Trust in the organization
IV. Method of approach
V. Personal financial reasons
VI. Personal connection to the cause
VII. The organization is well-known
VIII. Access to information that proved the impact of donor contributions
IX. The organization has a social media presence
X. The organization impacts the local community
XI. The organization’s work aligns with my personal beliefs or values
XII. The tax incentives provided by the organization’s 501 © 3 tax status
XIII. Other incentives to donate
i. Please list:
XIV. Other
12. What types of incentives would make you more inclined to donate to a charitable
organization? (please select all that apply)
I. Tax deductibility
II. Organizational memberships
III. Event tickets and participation
IV. Updates and newsletters
V. Social media shout-outs
VI. Organizational gear (i.e. pens, shirts, bags, etc)
VII. Recognition of donation on organization’s promotional materials (i.e. brochures,
website, event invites, etc)
VIII. Other:
13. Please describe what type of charitable organization you are most inclined to donate to
(i.e. religion, education, social services, international humanitarian aid, etc.):
14. Would you rather donate to an organization doing work locally/within the United States
or internationally?

52
I. I would be more inclined to donate to an organization doing work locally or
within the United States (Please proceed to question 15-16)
II. I would be more inclined to donate to an organization doing work internationally
III. I have no preference
15. Please explain why you are more inclined to donate to an organization doing work locally
or within the United States?
16. Please explain why you are less inclined to donate to an organization doing work
internationally?
17. Are there any incentives an international organization could provide to encourage you to
donate? Please describe.
18. Is there anything else you would like to include regarding nonprofits and donations?
Demographics:
1. What is your age?
I. Below 18
II. 18-24
III. 25-34
IV. 35-44
V. 45-54
VI. 55-64
VII. 65 or older
2. What year were you born in?
I. Before 1945
II. 1946-1964
III. 1965-1980
IV. 1981-present
3. How do you identify?
I. Male
II. Female
III. Other
4. What is your marital status?
I. Single, Never married
II. Married
III. Partnered
IV. Divorced
V. Separated
VI. Widowed
5. Do you have children?
I. No
II. Yes
i. If yes, how many?
6. Do you identify as religious?
I. Yes
II. No
7. What political party do you identify with?
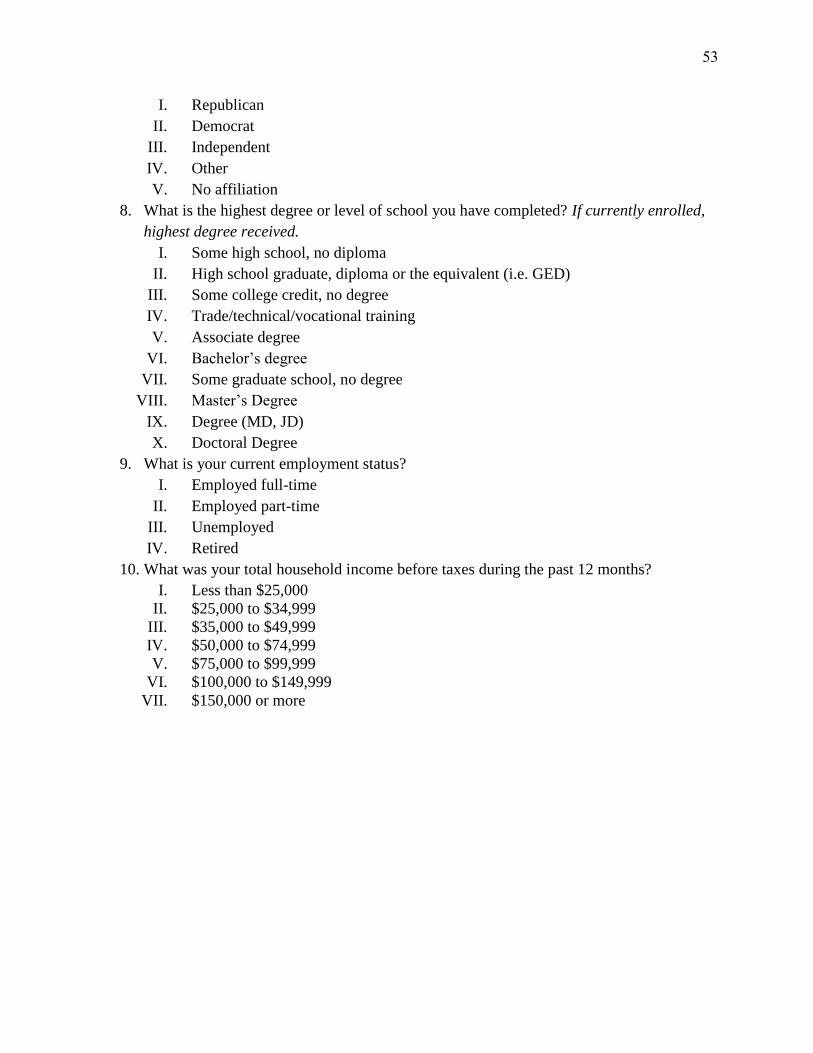
53
I. Republican
II. Democrat
III. Independent
IV. Other
V. No affiliation
8. What is the highest degree or level of school you have completed? If currently enrolled,
highest degree received.
I. Some high school, no diploma
II. High school graduate, diploma or the equivalent (i.e. GED)
III. Some college credit, no degree
IV. Trade/technical/vocational training
V. Associate degree
VI. Bachelor’s degree
VII. Some graduate school, no degree
VIII. Master’s Degree
IX. Degree (MD, JD)
X. Doctoral Degree
9. What is your current employment status?
I. Employed full-time
II. Employed part-time
III. Unemployed
IV. Retired
10. What was your total household income before taxes during the past 12 months?
I. Less than $25,000
II. $25,000 to $34,999
III. $35,000 to $49,999
IV. $50,000 to $74,999
V. $75,000 to $99,999
VI. $100,000 to $149,999
VII. $150,000 or more
Recommended