Marker-assisted backcrossing to introgress resistance to Fusarium wilt (FW) race 1 and Ascochyta blight
(AB) in C 214, an elite cultivar of chickpea
R. K. Varshney1,2*, S. M. Mohan1, P. M. Gaur1
, S. K. Chamarthi1, V. K. Singh1, S. Srinivasan1, N. Swapna1,
M. Sharma1, S. Singh3, L. Kaur3, S. Pande1
1International Crops Research Institute for the Semi-Arid Tropics (ICRISAT), Hyderabad, 502324, India
2CGIAR Generation Challenge Programme (GCP), c/o CIMMYT, DF, 06600, Mexico
3Department of Plant Breeding and Genetics, Punjab Agricultural University (PAU), Ludhiana, 141004, India
*Corresponding author: [email protected]
Telephone: 91-40-30713305
Fax: 91-40-30713074
The Plant Genome: Posted 5 Dec. 2013; doi: 10.3835/plantgenome2013.10.0035
Abstract
Fusarium wilt (FW), caused by Fusarium oxysporum f. sp. ciceris and Ascochyta blight (AB), caused by Ascochyta
rabiei are two major constraints to chickpea production. Therefore, two parallel marker-assisted backcrossing
(MABC) programmes by targeting foc 1 locus and two QTL regions, ABQTL-I and ABQTL-II were undertaken to
introgress resistance to FW and AB, respectively in C 214, an elite cultivar of chickpea. In the case of FW,
foreground selection was conducted with 6 markers (TR19, TA194, TAA60, GA16, TA110 and TS82) linked to foc
1 in the cross C 214 × WR 315 (FW-resistant). On the other hand, 8 markers (TA194, TR58, TS82, GA16, SCY17,
TA130, TA2 and GAA47) linked with ABQTL-I and ABQTL-II were used in the case of AB by deploying C 214 ×
ILC 3279 (AB-resistant) cross. Background selection in both crosses was employed with evenly distributed 40 (C
214 × WR 315) to 43 (C 214 × ILC 3279) SSR markers in the chickpea genome to select plant(s) with higher
recurrent parent genome (RPG) recovery. By using three backcrosses and three rounds of selfing, 22 BC3F4 lines
were generated for C 214 × WR 315 cross and 14 MABC lines for C 214 × ILC 3279 cross. Phenotyping of these
lines has identified 3 resistant lines (with 92.7-95.2% RPG) to race 1 of FW and 7 resistant lines (with 81.7-85.40%
RPG) to AB that may be tested for yield and other agronomic traits under multi-location trials for possible release
and cultivation.
Keywords: disease resistance; marker-assisted selection; molecular markers; marker-assisted backcrossing;
molecular breeding.
The Plant Genome: Posted 5 Dec. 2013; doi: 10.3835/plantgenome2013.10.0035
Introduction
Chickpea (Cicer arietinum L.) is an important cool season food legume grown extensively by the poor farmers
throughout the Indian sub-continent. India alone contributes about 67% to the global chickpea production; however,
there has been a little improvement in the crop productivity (0.8 t ha-1) (Gaur et al., 2012). Several biotic and abiotic
stresses impose adverse effect on plants at most of the growth stages leading to low productivity. Among the biotic
stresses, Fusarium wilt (FW) caused by soil borne fungus Fusarium oxysporum f. sp. ciceris (foc) and Ascochyta
blight (AB) caused by Ascochyta rabiei in chickpea are the two most severe yield reducers in India and can cause
complete yield losses under favourable conditions (Navas-Cortes et al., 2000; Dubey et al., 2007; Udupa and Baum
2003). AB and FW are prevalent diseases across all chickpea growing regions of the world including India.
However, AB mainly occurs in north western plains due to favourable climatic conditions, while FW is mostly
restricted to central and southern parts of India (Ghosh et al., 2013).
Till date, two pathotypes (yellowing and wilting) and eight pathogenic races (races 0, 1A, 1B/C, 2, 3, 4, 5, and 6)
have been described for FW (Jiménez-Fernández et al., 2013; Jiménez-Gasco and Jiménez-Díaz 2003). Furthermore,
genetics of five races (1A, 2, 3, 4 and 5) has also been studied (Sharma et al., 2005). In context of India, the race 1
(synonymous 1A, Indian isolate) is highly virulent in Andhra Pradesh, a major chickpea growing state of India.
To address such problems, molecular breeding strategies have been deployed in several crop species (Kulwal et al.
2011). However, availability of markers associated with trait of interest for instance, resistance to a disease is a pre-
requisite for molecular breeding. In the case of FW in chickpea, molecular markers associated with resistance to six
different races (0, 1A, 2, 3, 4 and 5) have been identified (see Varshney et al., 2013). These mapping studies have
located resistance genes for FW races 1 (foc 1), 3 (foc 3), 4 (foc 4) and 5 (foc 5), forming a cluster, on CaLG02
(Mayer et al., 1997; Ratnaparkhe et al., 1998; Tullu et al., 1998; Winter et al., 2000; Sharma et al., 2004).
For AB resistance, high level of variability exists for the pathogenicity trait in A. rabiei populations and a number of
pathotypes were reported (Nene and Reddy 1987). On the basis of aggressiveness of the pathogen, pathotypes have
been classified mainly into two broad categories: pathotype I (less aggressive) and pathotype II (aggressive) (Chen
et al. 2004).
The Plant Genome: Posted 5 Dec. 2013; doi: 10.3835/plantgenome2013.10.0035
In terms of molecular mapping, a considerable number of QTLs have been identified on several linkage groups (2, 3,
4, 6 and 8) for AB resistance in many studies (see Varshney et al., 2013). However, majority of AB resistance QTLs
were reported mainly on two linkage groups namely CaLG02 and CaLG04. For instance, AB resistance QTLs
namely ar1, ar2a identified by Udupa and Baum (2003) and QTLAR3 identified by Iruela et al. (2007) are present in
the same genomic region mainly flanked by GA16 and TA110 markers on CaLG02 (Supplemental Figure S1).
QTLs present in this genomic region confer resistance to both pathotype I and II of A. rabiei and contribute up to
20% phenotypic variation. This region has been referred as ABQTL-I, hereafter in the present study. Similarly, a
region, referred as ABQTL-II hereafter in this study, contains QTLs, namely ar2b mapped by Udupa and Baum
(2003), QTLAR1 and QTLAR2 mapped by Iruela et al. (2006) (Supplemental Figure S2). This genomic region
contributes up to 34% of the phenotypic variation.
Deployment of host plant resistance is the preferred strategy for managing the above two diseases as it is economical
and eco-friendly approach. Marker-assisted backcrossing (MABC) aims at conversion of targeted lines with respect
to one or two traits without disturbing remaining all other native traits of target variety (Varshney et al., 2009).
MABC has been successfully employed recently to introgress AB resistance with double podding traits in chickpea
varieties CDC Xena, CDC Leader and FLIP98-135C (Taran et al., 2013) and a QTL-hotspot containing QTLs for
root traits and abiotic stress tolerance in JG 11, a leading chickpea variety from India (Varshney et al., 2013).
Keeping in view of above, the present study employs two parallel MABC programmes that include introgression of
foc1, resistant locus for race 1 of FW and two QTL clusters for AB resistance namely ABQTL-I (ar1, ar2a and
QTLAR3) and ABQTL-II (ar2b, QTLAR1 and QTLAR2) in the genetic background of C 214, a high yielding chickpea
variety but susceptible to both of the devastating diseases. Phenotypic evaluation of these MABC lines identified
several lines with high level of resistance to FW and AB.
The Plant Genome: Posted 5 Dec. 2013; doi: 10.3835/plantgenome2013.10.0035

Materials and Methods
Parent Materials
C 214, a well-adapted FW and AB susceptible desi variety suitable for rainfed conditions (Bhardwaj et al., 2010;
Kaur et al., 2012) was chosen as recurrent parent for introgression of resistance to FW and AB. WR 315, a desi
landrace from central India resistant to race 1A and race 3 of FW (Mayer et al., 1997; Sharma et al., 2005) was
selected as donor parent for introgression of genomic segment carrying foc 1 and foc 3. For AB resistance, ILC 3279
a kabuli landrace (Udupa et al., 1998) originated from former USSR was used as donor for transferring two QTL
clusters namely ABQTL-I and ABQTL-II in the present MABC programme.
Deoxyribonucleic Acid Extraction
Deoxyribonucleic Acid (DNA) was isolated from fresh leaves of 15-day old seedlings of the parental genotypes, F1s
and backcross progenies using the modified cetyl trimethyl ammonium bromide (CTAB) extraction method, as
described in Cuc et al. (2008). Quality and quantity of DNA were checked on 0.8% agarose gel and concentration
was normalized to ~5ng/ul.
Polymerase Chain Reaction (PCR) and Marker Genotyping
Polymerase chain reaction for simple sequence repeat (SSR) markers from target genomic region (Table 1) and
SSRs from complete genome (Varshney et al. 2013) for background selection was performed in 5 µl reaction
volumes as mentioned in our earlier studies (Nayak et al., 2010; Thudi et al., 2011). Amplified PCR products were
separated by capillary electrophoresis using an ABI Prism 3730 DNA Sequencer and analysed using GeneMapper®
software of Applied Biosystems, USA.
Backcross Breeding
Two parallel crossing programmes namely C 214 × WR315 and C 214 × ILC 3279 were employed for generation of
F1 seeds and the lines derived thereof designated as ICCX-100175 and ICCX-100176, respectively. Molecular
markers associated with resistance to FW and AB were employed for identification of true hybrid plants in each
cross and these plants were selected for generation of backcross progenies. Further, foreground selection for
genomic regions of interest and background selection using SSR markers were employed for identification of plants
The Plant Genome: Posted 5 Dec. 2013; doi: 10.3835/plantgenome2013.10.0035

for further backcrossing. After undertaking three rounds of backcrossing, selected plants were selfed three times
(BC3F4) for making plants homozygous as well as multiplication of improved seeds of C 214 for FW and AB,
separately.
Phenotyping for Fusarium wilt and Ascochyta Blight
The selected BC3F4 families along with their parents were sown in controlled conditions and specific to race 1
isolates at Patancheru, India during off-season (July-October 2012) in two replications using randomized complete
block design (RCBD) as described by Pande et al. (2012). Data on FW reaction of the entries were recorded at 60
days after inoculation (DAI) and classified as resistant (0-20%), moderately susceptible (21-50%) and susceptible
(>50%) as described by Sharma et al. (2005).
Phenotyping for AB resistance for selected BC3F4 families along with parental lines were screened for adult plant
resistance (APR). The entries were planted in RCBD with two replications at PAU, Ludhiana, during crop season
2012-13. The experimental units were one row plots of 2 m length with 10 cm spacing between plants and 40 cm
between rows. Another highly susceptible check ICC 4991 was planted after every four-test rows to provide a
constant disease pressure for the AB. The disease reaction was recorded when the susceptible check showed the
maximum disease severity of ‘9’ on a scale of 1-9. The lines were classified as immune (1), resistant (1.1-3.0),
moderately resistant (3.1-5.0), susceptible (5.1-7.0) and highly susceptible (>7.0) as described by Kottapalli et al.
(2009)
The Plant Genome: Posted 5 Dec. 2013; doi: 10.3835/plantgenome2013.10.0035

Results
Selection of Molecular Markers
For introgressing foc1 locus conferring resistance to race 1 of FW, three SSR markers (TR19, TA194, TAA60)
present in the genomic region on linkage group CaLG02 and a few adjoining markers (GA16, TS82 and TA110) in
the same region (Sharma et al., 2004; Sharma and Muehlbauer, 2005; Millan et al., 2006; Gowda et al., 2009) were
targeted for deployment. However, after screening a total of 10 reported markers (9 SSRs and 1 allele specific
associated primer) between C 214 and WR 315, 6 were polymorphic between parents and were deployed for
selection of target genomic region in segregating generations.
For introgressing resistance to AB, two QTL regions namely ABQTL-I and ABQTL-II, conferring resistance for
pathotype I and pathotype II of AB present on CaLG02 and CaLG04, respectively were targeted. Genomic region
ABQTL-I consisting of QTLAR3 (Iruela et al., 2007), ar1 and ar2a (Udupa and Baum 2003), on CaLG02 contributes
up to 20% phenotypic variation. Another genomic region ABQTL-II consisting of QTLAR1, QTLAR2 (Iruela et al.,
2006) and ar2b (Udupa and Baum 2003) located on CaLG04 contributing up to 34% phenotypic variation was also
chosen for deployment. For ABQTL-I region, out of 13 reported markers, 7 were found polymorphic between
parents and only 4 markers were employed on the basis of differences in fragment sizes (bp) (TA194, TR58, TS82
and GA16) in the backcross generations. In the case of ABQTL-II region, out of 9, 5 markers were found
polymorphic and 4 markers (SCY17, TA130, TA2 and GAA47) were used in the targeted cross C 214 × ILC 3279.
It is important to note that one molecular marker SCY17 (Iruela et al., 2006) from the ABQTL-II region is a
diagnostic marker and this marker has been given higher importance to select the plants. Details of these markers
and sequences are given in Table 1.
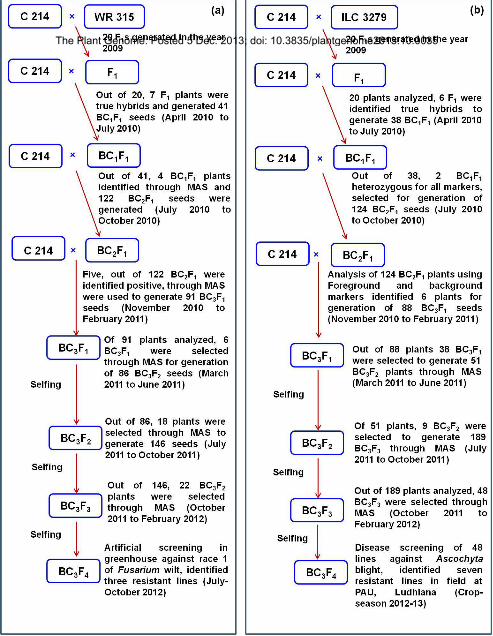
Marker-Assisted Backcrossing for Fusarium wilt
Marker-assisted backcrossing scheme used to introgress FW resistance from WR 315 into C 214 is given in Figure
1a. C 214 (recurrent parent) was used as female and crossed with WR 315 (donor parent) as male to generate 20 F1
seeds. Out of 20 F1 plants generated and grown in the off-season in April 2010, 7 true hybrids were identified with
the polymorphic markers (TAA60, TA194 and TS82) and this cross was named as ICCX-100175. All F1s were used
to make first backcross (C 214 × (C 214 × WR 315) of which, 41 BC1F1 seeds were harvested in June 2010. All 41
BC1F1 seeds were sown in the off-season (starting July 2010). Further, DNA was isolated from 41 plants and
The Plant Genome: Posted 5 Dec. 2013; doi: 10.3835/plantgenome2013.10.0035

foreground selection (FGS) was done with four SSR markers namely GA16, TAA60, TA110 and TR19. Based on
FGS results, 4 plants having common heterozygotes for all markers were used for second cycle of backcrossing to
obtain BC2F1 seeds. Although molecular markers were selected for undertaking background selection (as mentioned
in Table 2), because of less number of plants identified in FGS, background selection was not done with the BC1F1
plants.
Subsequently, second cycle of backcrossing was undertaken and 122 BC2F1 seeds were harvested in October, 2010.
After growing 122 BC2F1 plants in November 2010, marker analysis with 6 markers namely GA16, TAA60,
TA194, TS82, TA110 and TR19, a total of 30 BC2F1 plants heterozygous for all the FGS markers were selected. All
30 BC2F1 plants were subjected to background selection with 32 SSR markers. As a result, 5 BC2F1 plants having
89-95% genome recovery were selected and used for third round of backcrossing. From this backcrossing, 91
BC3F1 seeds were harvested in February 2011. Subsequently, after growing 91 BC3F1 plants in the March 2011,
marker analysis with 6 markers namely GA16, TAA60, TA194, TS82, TA110 and TR19, a total of 30 BC3F1 plants
heterozygous for all the FGS markers were selected. All 30 BC3F1 plants were subjected to background selection
with 40 SSR markers and based on this analysis 6 BC3F1 plants showing 90-98% genome recovery were selfed. As
a result, 86 BC3F2 seeds were harvested in June 2011.
A total of 18 BC3F2 plants with 98% of the recurrent parent genome along with the target regions were selfed to
obtain a set of more than 150 BC3F3 seeds. A total of 146 plants obtained from this seed set were analyzed and
finally, a total of 22 BC3F4 homozygous plants with >98% genetic background recovery were selected based on
marker analysis. Details about number of plants analyzed in foreground and background selection, number of plants
found heterozygous/ homozygous and used for next generation for crossing or for generation advancement have
been provided in Table 2.
Marker-Assisted Backcrossing for Ascochyta Blight
In the MABC programme for AB (Figure 1b), C 214 (recurrent parent), was used as female and crossed with ILC
3279 (donor parent) as male to generate 20 F1 seeds. Out of 20 F1 plants generated and grown in the off-season
(starting in April 2010), 6 true hybrids were confirmed with the markers (GAA47 and TA130). All 6 true F1 plants
were used to make the first backcross (C 214 × (C 214 × ILC 3279) and 38 BC1F1 seeds were harvested in June,
The Plant Genome: Posted 5 Dec. 2013; doi: 10.3835/plantgenome2013.10.0035

2010. All 38 BC1F1 seeds were sown in the off-season (starting July 2010). Genotyping of 38 BC1F1 plants with
one SSR marker (GA16) for ABQTL-I region of CaLG02 and 3 SSR markers (TA130, TA2 and GAA47) for
ABQTL-II region located on CaLG04 identified only 2 BC1F1 plants showing heterozygosity for all the markers for
both ABQTL-I and ABQTL-II regions. These two plants were selected for second cycle of backcrossing.
Subsequently, second cycle of backcrossing was undertaken using pollen from above selected 2 BC1F1 plants and
124 BC2F1 seeds were harvested in October, 2010. After growing 124 BC2F1 plants in the main crop season
(starting in November 2010), initially all 124 BC2F1 plants were screened with the diagnostic marker SCY17 and 60
BC2F1 plants were selected as positive for the this marker. These plants were further screened with 6 markers
namely TA194, TS82 and GA16 from ABQTL-I region and TA130, TA2 and GAA47 from ABQTL-II region. As a
result, 46 BC2F1 plants heterozygous for all markers i.e. both QTL regions were selected. All 46 BC2F1 plants were
subjected to background selection with 29 SSR markers. On the basis of background selection, six BC2F1 plants
with 80-87% recurrent parent genome (RPG) recovery were selected and used for third round of backcrossing. As a
result, a total of 88 BC3F1 seeds were harvested in February 2011. Subsequently, after growing 88 BC3F1 seeds in
the off-season (starting March 2011), marker analysis was initially done with SCY17 marker and 38 BC3F1 plants
were found positive for SCY17 marker. Subsequently, these 38 BC3F1 plants were screened with 6 markers namely
TA194, TS82, GA16 from ABQTL-I region and TA130, TA2 and GAA47 from ABQTL-II regions for background
selection with 43 SSR markers.
Although 23 BC3F1 plants showed 80-90% genome recovery in background selection, all 38 BC3F1 plants positive
for the diagnostic marker (SCY17) were used for selfing to obtain more number of seeds. Therefore, a total of 166
BC3F2 seeds were harvested in the month of June 2011. After growing 51 BC3F2 plants, in the first instance, in the
month of July 2011, and a total of 9 BC3F2 plants were selected on the basis of phenotypic similarity to the
recurrent parent to generate BC3F3 generation. These plants have been selfed further to generate more than 200
BC3F3 seeds. A total of 189 BC3F3 plants from this generation were analyzed and finally 48 homozygous lines
showing more than 85% genome recovery were selected to obtain BC3F4 seeds. Although 48 BC3F3 lines were
selected, seeds from only fourteen lines could be harvested (from green house in 2012) due to poor seed set. On the
basis of phenotypic data (see later), seven resistant plants were identified and analyzed with foreground markers of
both QTL regions and background data with SSR markers reflected RPG recovery ranged from (81.7 to 85.4%).
The Plant Genome: Posted 5 Dec. 2013; doi: 10.3835/plantgenome2013.10.0035
Further on the basis of foreground selection, it was revealed that five plants were found positive for ABQTL-I
region and three plants were found positive for ABQTL-II region. However, only one plant (ICCX-100176-470-2-
16) was found positive for both QTL regions. Details of each activity viz. number of seeds generated, plants
analyzed for foreground and background selection, number of plants found heterozygous/ homozygous and used for
next generation have been given in Table 3.
Phenotyping of Marker-Assisted Backcrossing Lines for Resistance to Fusarium wilt
All selected 22 BC3F4 progenies were grown and subjected to phenotyping against race 1 of FW under controlled
conditions at ICRISAT in the off-season (July-October 2012). Of these, three progenies namely ICCX-100175-349-
2-2, ICCX-100175-382-4-6 and ICCX-100175-389-3-2 showed high to moderate level of resistance (Figure 2 and
Table 4). One of these three progenies namely ICCX-100175-349-2-2 has not shown any wilt symptoms i.e.,
complete resistance (100%) while the other two progenies have shown 95% (ICCX-100175-389-3-2) and 80%
(ICCX-100175-382-4-6) resistance at sixty days after inoculation.
Phenotyping of Marker-Assisted Backcrossing Lines For Resistance to Ascochyta Blight
Fourteen BC3F4 lines homozygous for ABQTL-I and ABQTL-II regions were used for AB screening under field
conditions (Kaur et al. 2011) during the main crop season 2012-13 at PAU, Ludhiana (disease hotspot region of
India). Of fourteen lines tested in the field, a total of seven BC3F4 lines (Table 5) showed resistance reaction (Figure
3). Out of 7 lines, 4 lines showed resistant score of 2, and 3 lines showed resistant score of 3, in comparison to a
score of 7 and 4 of recurrent (C 214) and donor parent (ILC 3279), respectively. The lines possess either of the
genomic regions showed higher level of resistance compared to ICCX-100176-470-2-16 line possessing both QTL
regions.
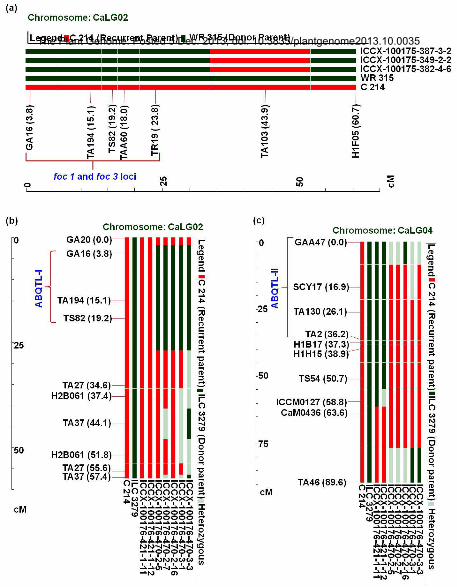
Molecular Analysis of Carrier Chromosomes in Marker-Assisted Backcrossing Lines
To analyze the recovery of recurrent parent genome on the carrier chromosomes namely CaLG02 and CaLG04, SSR
markers present on these chromosomes were used to analyze backcross progenies for the respective chromosomes.
In the case of FW resistant progenies, 14 additional SSR makers (other than those that were used for FGS and BGS)
were used for parental polymorphism survey between C 214 and WR 315. Out of 14, only 2 SSR markers were
found polymorphic between parents, and used for identification of donor parent genome. Due to identification of
The Plant Genome: Posted 5 Dec. 2013; doi: 10.3835/plantgenome2013.10.0035

less number of polymorphic markers, all three improved lines showed similar pattern with the nearest flanking
marker TA103 (Figure 4A). Interestingly, the next marker, H1F05 showed donor parent alleles in all three improved
lines.
In the case of AB resistance progenies, additional 24 and 32 SSR markers corresponding to CaLG02 (for ABQTL-I)
and CaLG04 (for ABQTL-II) regions were targeted for analyzing donor parent genome introgression on carrier
chromosome in BC3F4 lines. Screening of 24 and 32 markers on parental lines showed 7 and 6 markers polymorphic
in CaLG02 and CaLG04, respectively. Genotyping of BC3F4 lines with these polymorphic markers identified
superior recombinant lines for ABQTL-I and ABQTL-II regions. On the basis of recurrent parent genome recovery
on carrier chromosomes, one improved line ICCX-100176-470-2-5, with lesser introgression of donor parent
genome in both the chromosomes (CaLG02 and CaLG04) (Figure 4B and 4C) was identified that may be used for
further detailed evaluation in multi-location trials.
The Plant Genome: Posted 5 Dec. 2013; doi: 10.3835/plantgenome2013.10.0035
Discussion
FW and AB are two most devastating diseases of chickpea causing severe yield losses. Conventional method of
breeding for disease resistance is tedious and time taking process. However, MABC applying foreground selection
using QTL linked markers and background selection using genome-wide SSR markers for recovery of recurrent
parent genome (RPG) is an environment independent, precise and quick approach for the development of cultivars
for the trait of interest (Varshney et al. 2010). This study reports successful introgression of resistance to FW and
AB in the genetic background of C 214.
QTL mapping identified resistance loci with flanking molecular markers for resistance to a number of races of FW
viz. foc 0 locus for race 0 (Cobos et al. 2005), foc 1 locus for race 1 (Gowda et al., 2009), foc 2 locus for race 2
(Gowda et al., 2009), foc 3 locus for race 3 (Sharma et al., 2004; Gowda et al. 2009), foc 4 locus for race 4 (Winter
et al., 2000; Sharma et al., 2004; Sharma and Muelbauer, 2005) and foc 5 locus for race 5 (Cobos et al., 2009).
Recently two novel QTLs (FW-Q-APR-6-1 and FW-Q-APR-6-2) for FW for race 1 explaining 10.4–18.8% of
phenotypic variation have also been reported (Sabbavarapu et al., 2013). Similarly, a large number of QTLs for AB
resistance were reported namely ar2b (Udupa and Baum, 2003), QTLAR3 (Iruela et al., 2007), ar1 (Iruela et al.,
2007), ar2 (Iruela et al., 2007) etc. Recently, we have mapped six QTLs for AB resistance explaining up to 31.9% of
phenotypic variation (Sabbavarapu et al., 2013).
In view of above, foc1 locus conferring resistance to race 1 of FW, and two QTL regions (ABQTL-I and ABQTL-II)
for AB resistance located on two different LGs were targeted for introgression into the recurrent parent C 214.
Foreground selection with QTL linked markers and background selection using genome-wide SSR markers were
employed in each backcross generation to select positive plants for crossing or selfing. However, in case of FW, due
to identification of only four BC1F1 plants positive for all foreground markers, background selection was not
imposed. In the BC2F1 generation, five plants with recurrent parent genome recovery ranging from 89-95% were
identified based on SSR analysis in comparison to 87.5% of expected average similarity. Following foreground and
background selection with molecular markers, several plants up to 98% of similarity were developed as early as in
BC3F1 generation. Similarly, in the case of AB in BC1F1 generation, due to identification of only two plants
positive for all markers from both QTL regions, ABQTL-I and ABQTL-II, background selection was not imposed.
However, the BC2F1 generation had plants up to 87% of RPG as expected (87.5%). However, plants with 80-90%
The Plant Genome: Posted 5 Dec. 2013; doi: 10.3835/plantgenome2013.10.0035

RPG were identified in BC3F1 generation, further based on resistance reaction seven plants were selected in BC3F3
generation which showed the RPG recovery ranged from 81.7 to 85.4%. The lower recovery of recurrent genome of
selected plants was might be fixations of heterozygous alleles at BC3F1 generation towards donor parent genome.
To analyze the recovery of recurrent parent alleles on carrier chromosomes in BC3F4 MABC lines, carrier
chromosome specific (CaLG02 for FW cross, CaLG02 and CaLG04 for AB cross) polymorphic SSR markers were
also used to identify recombinant lines with lesser donor parent segments in both crosses. However, due to lesser
number of polymorphic markers identified between C 214 × WR 315, the real selection of lines in the case of
MABC progenies for FW was not effective. Analyzing MABC for AB resistance lines using carrier chromosome
specific markers for two LGs (CaLG02 and CaLG04) in C 214 × ILC 3279, one line namely ICCX-100176-470-2-5,
was identified with lesser donor parent introgression in both the carrier chromosomes. This line with lesser donor
parent introgression will be used for further evaluations for other important traits.
Phenotyping for FW resistance of MABC and parental lines showed resistance reaction in sick plot nursery.
However, three MABC lines showed resistance reaction from 0% to 20% of FW resistance reaction in comparison
to C 214 (recurrent parent) of 54.5% and 6% of WR 315 (donor parent). Of three, two lines have shown better
resistance ICCX-100175-349-2-2 (0% of FW incidence) and ICCX-100175-389-3-2 (5% of FW incidence). It is also
important to mention here that the introgressed segment in C 214 also carries foc 3 locus, resistance to race 3 of FW.
Therefore, the MABC lines generated in this study may show resistance to race 3 of FW as well. Phenotypic
evaluation, in the target region of FW race 3, however needs to be undertaken to confirm above mentioned
speculation.
Similarly, MABC lines for AB resistance showed disease reaction score <3.0 in comparison to 7 and 4 of recurrent
(C 214) and donor parent (ILC 3279), respectively on 1-9 scale. However, one line identified with minimum donor
parent chromosome namely ICCX-100176-470-2-5 on both of the carrier chromosome showed high level of
resistant reaction (score of 2), in comparison to donor parent ILC 3279 (score of 4) and recurrent parent C 214
(score of 7). Surprisingly, one line which was positive for both the QTL regions (ABQTL-I and ABQTL-II) showed
resistant reaction score of 3, in comparison to lines possessing either ABQTL-I or ABQTL-II with resistant score of
2, except ICCX-100176-470-3-3, which showed resistant reaction of 3 and possess only ABQTL-I.
The Plant Genome: Posted 5 Dec. 2013; doi: 10.3835/plantgenome2013.10.0035
In the present study MABC lines with single genomic region (either ABQTL-I or ABQTL-II) compared to that of a
line having both ABQTL-I and ABQTL-II regions showed higher level of resistance to AB. This may be due to
antagonistic epistatic interaction of two genomic regions that was also evident by the disease reaction of donor
parent ILC 3214, which has comparatively low level of resistance as compared to MABC lines (Jannick, 2009).
Similar observation was made by Castro et al. (2003) that during the transfer of resistant QTLs for barley strip rust
into the elite background, presence of single QTL alleles in lines showed higher level of resistance in comparison to
presence of two QTL alleles, and they explained it may due to double crossover between markers and disease
resistance loci, undetected resistance genes and/or incomplete penetrance. Therefore, more experiments are
necessary to determine the specific role of each QTL in this study. However, based on our experiments it can be
concluded that either ABQTL-I or ABQTL-II can be targeted for development of AB resistant breeding lines.
In summary, this study demonstrates use of MABC to develop superior lines with enhanced resistance to race 1 (and
possibly race 3) of FW and AB. These lines may be used for multi-location field trials of All India Coordinated
Research Project (AICRP) on Chickpea of Indian Council of Agricultural Research (ICAR) in India for possible
release of most promising MABC lines as improved variety for commercial cultivation. However, to add value
further, intercrossing may be undertaken using superior MABC lines for FW and AB resistance, developed in the
present study. Pyramided lines for resistance to FW (foc 1 and possibly foc 3) and AB (ABQTL-I and ABQTL-II)
are expected to perform better in different agro-climatic zones. Therefore, it is planned to undertake intercrossing of
FW and AB-resistant lines and then selfing of the products of intercrossing to make them homozygous.
Homozygous and pyramided version of C 214 subsequently will be evaluated for yield and yield related traits in
disease hot-spot locations of India. After due testing, superior lines will be tested further under AICRP on Chickpea
of ICAR for release of improved variety with enhanced resistance to FW and AB for commercial cultivation.
Acknowledgments
The authors are thankful to B. Vinay Kumar, B.V. Rao, T. Rameshwar and Md. Aziz for their technical help.
Authors also appreciate useful discussions held with Mahendar Thudi, Manish K. Pandey, Pawan Khera and Manish
Roorkiwal in various ways. The present study was supported under the Accelerated Crop Improvement Programme
(ACIP) from the Department of Biotechnology (DBT), Government of India. This work has been undertaken as part
of the CGIAR Research Program on Grain Legumes. ICRISAT is a member of CGIAR Consortium.
The Plant Genome: Posted 5 Dec. 2013; doi: 10.3835/plantgenome2013.10.0035
References
Bhardwaj, R., J.S. Sandhu, L. Kaur, S.K. Gupta, P.M. Gaur, and R.K. Varshney. 2010. Genetics of Ascochyta blight
resistance in chickpea. Euphytica 171:337–343.
Castro, A.J., X. Chen, P. Hayes, and M. Johnston. 2003. Pyramiding quantitative trait locus (QTL) alleles
determining resistance to barley stripe rust. Crop Sci 43:651–659.
Chen, W., C.J. Coyne, T.L. Peever, F.J. Muehlbauer. 2004. Characterization of chickpea differentials for
pathogenicity assay of Ascochyta blight and identification of chickpea accessions resistant to Didymella rabiei.
Plant Pathol 53:759–769.
Cobos, M.J., M.J. Fernández, J. Rubio, M. Kharrat, M.T. Moreno, J. Gil, and T. Millan. 2005. A linkage map of
chickpea (Cicer arietinum L.) based on populations from Kabuli × Desi crosses: location of genes for
resistance to Fusarium wilt race 0. Theor. Appl. Genet. 110:1347–1353.
Cobos, M.J., P. Winter, M. Kharrat, J.I. Cubero, J. Gil, T. Millan, and J. Rubio. 2009. Genetic analysis of agronomic
traits in a wide cross of chickpea. Field Crop Res 111:130–136.
Cuc, L.M., E. Mace, J. Crouch, V.D. Quang, T.D. Long, and R.K. Varshney. 2008. Isolation and characterization of
novel microsatellite markers and their application for diversity assessment in cultivated groundnut (Arachis
hypogaea L.). BMC Plant Biol 8:55.
Dubey, S.C., M. Suresh, and B. Singh 2007 Evaluation of Trichoderma species against Fusarium oxysporum fsp.
ciceris for integrated management of chickpea wilt. Biol Contr 40:118–127.
Gaur, P.M., A.K. Jukanti, and R.K. Varshney. 2012. Impact of genomic technologies on chickpea breeding
strategies. Agron J 2:199–221.
Ghosh, R., M. Sharma, T. Rameshwar, and S. Pande. 2013. Occurrence and distribution of chickpea diseases in
central and southern parts of India. Amer J Plant Sci 4:940–944.
Gowda, S.J.M., P. Radhika, N.Y. Kadoo, L.B. Mhase, and V.S. Gupta. 2009. Molecular mapping of wilt resistance
genes in chickpea. Mol. Breed. 24:177–183.
Iruela, M., P. Castro, J. Rubio, J.I. Cubero, C. Jacinto, T. Millán, and J. Gil. 2007. Validation of a QTL for
resistance to Ascochyta blight linked to resistance to Fusarium wilt race 5 in chickpea (Cicer arietinum L.).
Eur J Plant Pathol 119:29–37.
Iruela, M., J. Rubio, F. Barro, J.I. Cubero, T. Millán, and J. Gil. 2006. Detection of two quantitative trait loci for
resistance to Ascochyta blight in an intra-specific cross of chickpea (Cicer arietinum L.): development of
SCAR markers associated with resistance. Theor. Appl. Genet. 112:278–287.
The Plant Genome: Posted 5 Dec. 2013; doi: 10.3835/plantgenome2013.10.0035

Jannink, J.L., L. Moreau, G. Charmet, and A. Charcosset 2009. Overview of QTL detection in plants and tests for
synergistic epistatic interactions. Genetica 136: 225-236.
Jiménez-Fernández, D., B.B. Landa, S. Kang, R.M. Jiménez-Díaz, and J.A. Navas-Cortés. 2013. Quantitative and
microscopic assessment of compatible and incompatible interactions between chickpea cultivars and Fusarium
oxysporum f. sp. ciceris races. PloS one 8: e61360.
Jiménez-Gasco, M.M., R.M. Jiménez-Díaz. 2003. Development of a specific polymerase chain reaction-based assay
for the identification of Fusarium oxysporum f. sp. ciceris and its pathogenic races 0, 1A, 5, and 6.
Phytopathology 93:200–209.
Kaur, L., S. Pande, J.S. Sandhu, P.M. Gaur, M. Sharma, and C.L.L. Gowda. 2011. Characterization of chickpea lines
for resistance to Ascochyta blight. J Fd Legume 24:310–312.
Kaur, L., V.P. Singh, and V.P. Gupta. 2012. Peroxidase: a marker for Ascochyta blight resistance in chickpea. Arch
Phytopathol Plant Protect 45:42–46.
Kottapalli, P., P.M. Gaur, S.K. Katiyar, J.H. Crouch, H.K. Buhariwalla, S. Pande, and K.K. Gali. 2009. Mapping
and validation of QTLs for resistance to an Indian isolate of Ascochyta blight pathogen in chickpea. Euphytica
165:79–88.
Kulwal, P.L., M. Thudi, R.K. Varshney. 2011. Genomics interventions in crop breeding for sustainable agriculture.
In: Meyers RA (ed) Encyclopedia of sustainability science and technology, Springer, New York.
doi:10.1007/978-1-4419-0851-3.
Mayer, M.S., A. Tullu, C.J. Simon, J. Kumar, W.J. Kaiser, J.M. Kraft, and F.J. Muehlbauer. 1997. Development of a
DNA marker for Fusarium wilt resistance in chickpea. Crop Sci 37:1625–1629.
Millan, T., H.J. Clarke, K.H.M. Siddique, H.K. Buhariwalla, P.M. Gaur, J. Kumar, J. Gil, G. Kahl, and P. Winter.
2006. Chickpea molecular breeding: New tools and concepts. Euphytica 147:81–103.
Navas-Cortes, J.A., B. Hau, and R.M. Jiménez-Díaz. 2000. Yield loss in chickpeas in relation to development of
Fusarium wilt epidemics. Phytopathology 90:1269–1278.
Nayak, S.N., H. Zhu, N. Varghese, S. Datta, H.K. Choi, R. Horres, R. Jüngling, J. Singh, P.B. Kavi Kishore, S.
Sivaramakrihnan, D.A. Hoisington, G. Kahl, P. Winter, D.R. Cook, and R.K. Varshney. 2010. Integration of
novel SSR and gene-based SNP marker loci in the chickpea genetic map and establishment of new anchor
points with Medicago truncatula genome. Theor Appl Genet 120:1415–1441.
Nene, Y.L., M.V. Reddy. 1987. Chickpea diseases and their control. In: Saxena MC, Singh KB (eds) The Chickpea.
CABI, Oxon, pp 233–270.
The Plant Genome: Posted 5 Dec. 2013; doi: 10.3835/plantgenome2013.10.0035

Pande, S., M. Sharma, A. Nagavardhini, and T. Rameshwar. 2012. High throughput phenotyping of chickpea
diseases: Stepwise identification of host plant resistance. Information Bulletin No. 92 Patancheru 502324
Andhra Pradesh, India: International Crops Research Institute for the Semi-Arid Tropics 56 pp. ISBN 978-92-
9066-552-6 Order Code: IBE092.
Ratnaparkhe, M.B.., D.K. Santra, A. Tullu, and F.J. Muehlbauer. 1998. Inheritance of inter-simple sequence-repeat
polymorphisms and linkage with a Fusarium wilt resistance gene in chickpea. Theor. Appl. Genet. 96:348–
353.
Sabbavarapu, M.M., M. Sharma, S.K. Chamarthi, N. Swapna, A. Rathore, M. Thudi, P.M. Gaur, S. Pande, S. Singh
, L. Kaur, and R.K. Varshney. 2013. Molecular mapping of QTLs for resistance to Fusarium wilt (race 1) and
Ascochyta blight in chickpea (Cicer arietinum L.). Euphytica 93: 121–133.
Sharma, K.D., W. Chen, and F.J. Muehlbauer. 2005. Genetics of chickpea resistance to five races of Fusarium wilt
and a concise set of race differentials for Fusarium oxysporum f. sp. Ciceris Plant Dis 89: 385–390.
Sharma, K.D., and F.J. Muehlbauer. 2005. Genetic mapping of Fusarium oxysporum f. sp. ciceris race-specific
resistance genes in chickpea (Cicer arietinum L.). In: International Food Legume Research Conference-IV,
Indian Agricultural Research Institute, New Delhi, India, pp 18–22.
Sharma, K.D., P. Winter, G. Kahl, and F. Muehlbauer. 2004. Molecular mapping of Fusarium oxysporum f. sp.
ciceris race 3 resistance gene in chickpea. Theor. Appl. Genet. 108:1243–1248.
Taran, B., T.D. Warkentin, and A. Vandenberg. 2013. Fast track genetic improvement of Ascochyta blight resistance
and double podding in chickpea by marker-assisted backcrossing. Theor. Appl. Genet. 126:1639–1647.
Thudi, M., A. Bohra, S.N. Nayak, N. Varghese, T.M. Shah, R.V. Penmetsa, N. Thirunavukkarasu, S. Gudipati, P.M.
Gaur, P.L. Kulwal, H.D. Upadhyaya, P.B. KaviKishor, P. Winter, G. Kahl, C.D. Town, A. Kilian, D.R. Cook ,
and R.K. Varshney. 2011. Novel SSR markers from BAC-End sequences, DArT arrays and a comprehensive
genetic map with 1,291 marker loci for chickpea (Cicer arietinum L.). PLoS One 6:e27275.
Tullu, A., F.J. Muehlbauer, C.J. Simon, M.S. Mayer, J. Kumar, W.J. Kaiser, and J.M. Kraft. 1998. Inheritance and
linkage of a gene for resistance to race 4 of Fusarium wilt and RAPD markers in chickpea. Euphytica
102:227–232.
Udupa, S.M., and M. Baum. 2003. Genetic dissection of pathotype-specific resistance to Ascochyta blight disease in
chickpea (Cicer arietinum L.) using microsatellite markers. Theor. Appl. Genet. 106:1196–1202.
Udupa, S.M., F. Weigand, M.C. Saxena, and G. Kahl. 1998. Genotyping with RAPD and microsatellite markers
resolves pathotype diversity in the Ascochyta blight pathogen of chickpea. Theor. Appl. Genet. 97:299–307.
Varshney, R.K., J.C. Glaszmann, H. Leung, and M. Ribaut. 2010. More genomic resources for less-studied crops.
Trends Biotechnol. 28:452–460.
The Plant Genome: Posted 5 Dec. 2013; doi: 10.3835/plantgenome2013.10.0035

Varshney, R.K., S.M. Mohan, P.M. Gaur, N.V.P.R. Gangarao, M.K. Pandey, A. Bohra, S.L. Sawargaonkar, A.
Chitikineni, P.K. Kimurto, P. Janila, K.B. Saxena, A. Fikre, M. Sharma, A. Rathore, A. Pratap, S. Tripathi, S.
Datta, S.K. Chaturvedi, N. Mallikarjuna, G. Anuradha, A. Babbar, A.K Choudhray, M.B. Mhase, C.H.
Bhardwaj, D.M. Mannur, P.N. Harer, B. Guo, X. Liang, N. Nadrajan, and C.L.L. Gowda. 2013. Achievements
and prospects of genomics-assisted breeding in three legume crops of the semi-arid tropics. Biotechnol Adv
doi: 10.1016/j.biotechadv.2013.01.001.
Varshney, R.K., S.N. Nayak, G.D. May, and S.A. Jackson. 2009. Next-generation sequencing technologies and their
implications for crop genetics and breeding. Trends Biotechnol. 27:522–530.
Winter, P., A.M. Benko-Iseppon, B. Hüttel, M. Ratnaparkhe, A. Tullu, G. Sonnante, T. Pfaff, M. Tekeoglu, D.
Santra, V.J. Sant, P.N. Rajesh, G. Kahl, and Muehlbauer. 2000. A linkage map of the chickpea (Cicer
arietinum L.) genome based on recombinant inbred lines from a C. arietinum × C. reticulatum cross:
localization of resistance genes for Fusarium wilt races 4 and 5. Theor. Appl. Genet. 101:1155–1163.
The Plant Genome: Posted 5 Dec. 2013; doi: 10.3835/plantgenome2013.10.0035
Legend to Figures
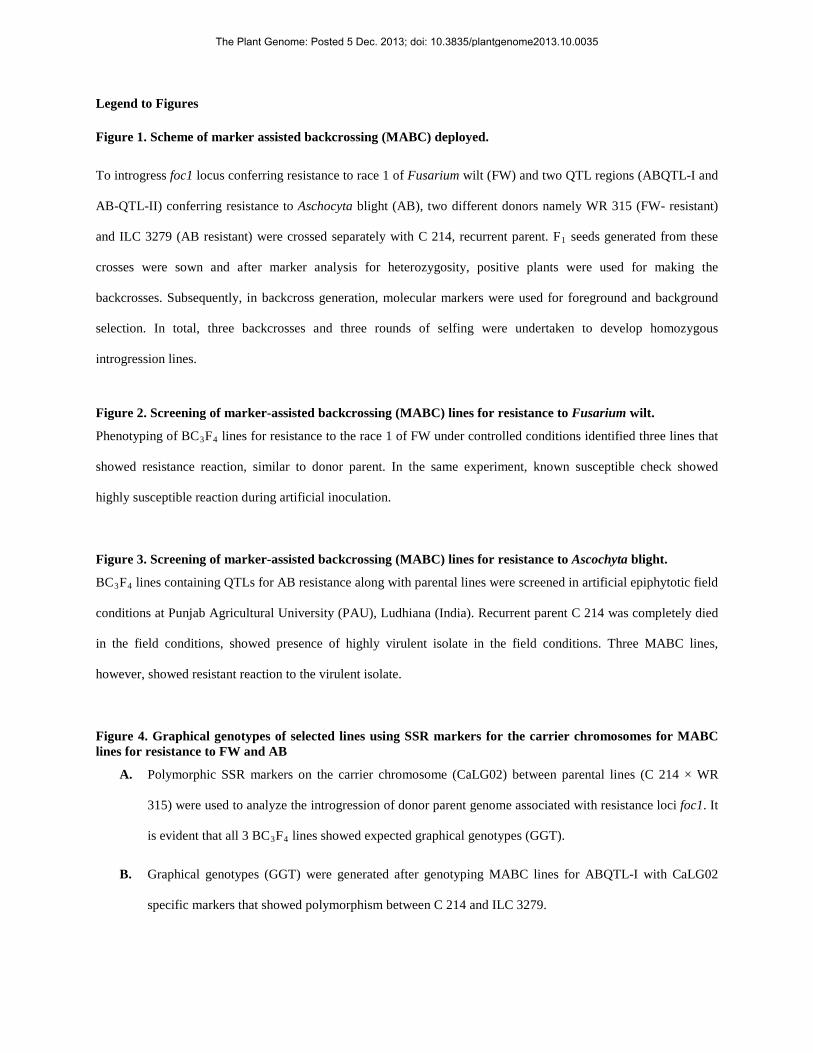
Figure 1. Scheme of marker assisted backcrossing (MABC) deployed.
To introgress foc1 locus conferring resistance to race 1 of Fusarium wilt (FW) and two QTL regions (ABQTL-I and
AB-QTL-II) conferring resistance to Aschocyta blight (AB), two different donors namely WR 315 (FW- resistant)
and ILC 3279 (AB resistant) were crossed separately with C 214, recurrent parent. F1 seeds generated from these
crosses were sown and after marker analysis for heterozygosity, positive plants were used for making the
backcrosses. Subsequently, in backcross generation, molecular markers were used for foreground and background
selection. In total, three backcrosses and three rounds of selfing were undertaken to develop homozygous
introgression lines.
Figure 2. Screening of marker-assisted backcrossing (MABC) lines for resistance to Fusarium wilt.
Phenotyping of BC3F4 lines for resistance to the race 1 of FW under controlled conditions identified three lines that
showed resistance reaction, similar to donor parent. In the same experiment, known susceptible check showed
highly susceptible reaction during artificial inoculation.
Figure 3. Screening of marker-assisted backcrossing (MABC) lines for resistance to Ascochyta blight.
BC3F4 lines containing QTLs for AB resistance along with parental lines were screened in artificial epiphytotic field
conditions at Punjab Agricultural University (PAU), Ludhiana (India). Recurrent parent C 214 was completely died
in the field conditions, showed presence of highly virulent isolate in the field conditions. Three MABC lines,
however, showed resistant reaction to the virulent isolate.
Figure 4. Graphical genotypes of selected lines using SSR markers for the carrier chromosomes for MABC lines for resistance to FW and AB
A. Polymorphic SSR markers on the carrier chromosome (CaLG02) between parental lines (C 214 × WR
315) were used to analyze the introgression of donor parent genome associated with resistance loci foc1. It
is evident that all 3 BC3F4 lines showed expected graphical genotypes (GGT).
B. Graphical genotypes (GGT) were generated after genotyping MABC lines for ABQTL-I with CaLG02
specific markers that showed polymorphism between C 214 and ILC 3279.
The Plant Genome: Posted 5 Dec. 2013; doi: 10.3835/plantgenome2013.10.0035
C. MABC lines for ABQTL-II region were genotyped with CaLG04 specific markers that showed
polymorphism between C 214 and ILC 3279. The genotyping data was used for preparation of GGT.
In each case, the GGT identified the plants with minimum amount of the donor parent genome.
Supplemental Figure S1. Representative nomenclature for ABQTL-I on CaLG02 showing position of QTLAR3
as
per Iruela et al. 2007 (Cross: ILC 3279 × WR 315) and ar1/ ar2a as per Udupa and Baum (2003) (cross: ILC 1272 ×
ILC 3279) contributing up to 20% of phenotypic variation.
Supplemental Figure S2. Representative nomenclature for ABQTL-II on CaLG04 (QTLAR1 / QTLAR2 as per Iruela
et al. (2006) (cross: ILC 3279 × WR 315) and ar2b as per Udupa and Baum (2003) (cross: ILC 1272 × ILC 3279)
contributing up to 34% phenotypic variation.
Table 1 Details on molecular markers used for undertaking foreground selection in marker-assisted backcrossing (MABC) programmes for Fusarium wilt (FW) and Ascochyta blight (AB)
LG Marker name
Forward primer sequence (5’-3’)
Reverse primer sequence (5’-3’)
Reference
wilt (FW) foc
2 GA16 CACCTCGTACCATGGTTTCTG TAAATTTCATCCTCTCCGGC Millan et al. (2006) 2 TAA60 TCATGCTTGTTGGTTAGCTAGAAA CAAAGACATAATCGAGTTAAAGAAAA Millan et al. (2006) 2 TA194 TTTTTGGCTTATTAGACTGACTT TTGCCATAAAATACAAAATCC Millan et al. (2006) 2 TS82 TCAAGATTGATATTGATTAGATAAAAGC CTTTATTTACCACTTGCACAACACTAA Millan et al. (2006)
The Plant Genome: Posted 5 Dec. 2013; doi: 10.3835/plantgenome2013.10.0035
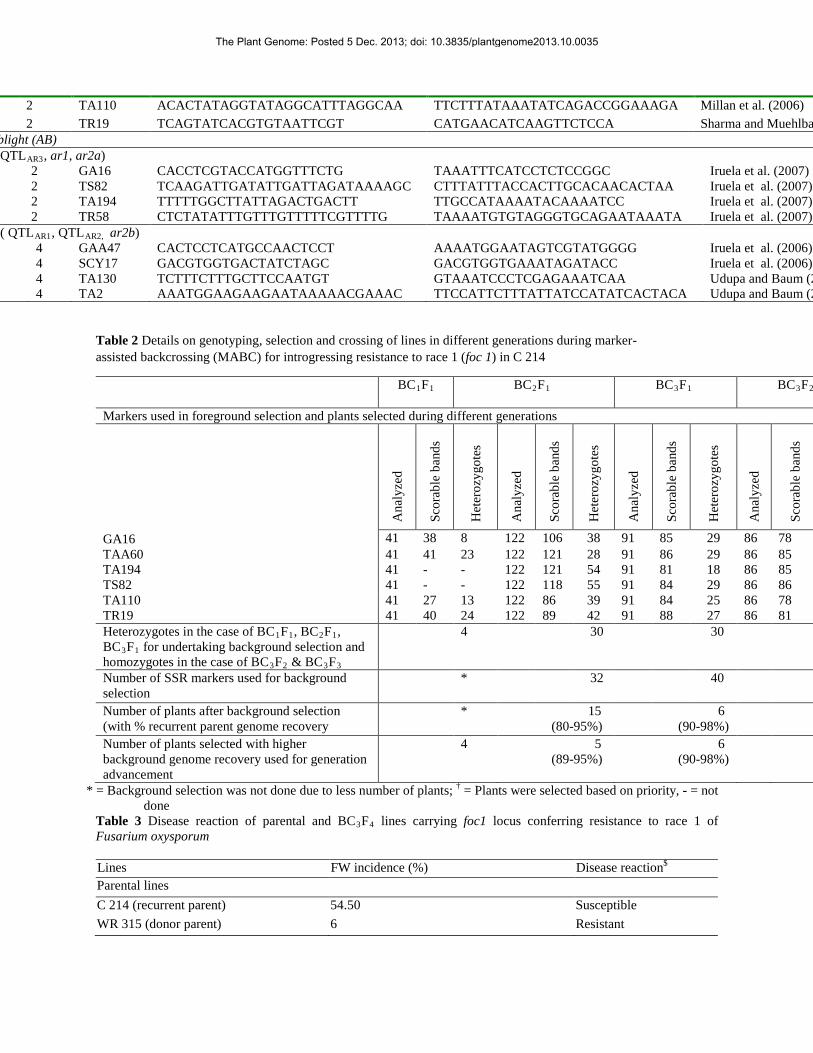
Table 2 Details on genotyping, selection and crossing of lines in different generations during marker-assisted backcrossing (MABC) for introgressing resistance to race 1 (foc 1) in C 214
BC1F1
BC2F1
BC3F1
BC3F2
Markers used in foreground selection and plants selected during different generations GA16
Ana
lyze
d
Scor
able
ban
ds
Het
eroz
ygot
es
Ana
lyze
d
Scor
able
ban
ds
Het
eroz
ygot
es
Ana
lyze
d
Scor
able
ban
ds
Het
eroz
ygot
es
Ana
lyze
d
Scor
able
ban
ds
41 38 8 122 106 38 91 85 29 86 78 TAA60 41 41 23 122 121 28 91 86 29 86 85 TA194 41 - - 122 121 54 91 81 18 86 85 TS82 41 - - 122 118 55 91 84 29 86 86 TA110 41 27 13 122 86 39 91 84 25 86 78 TR19 41 40 24 122 89 42 91 88 27 86 81 Heterozygotes in the case of BC1F1, BC2F1, BC3F1 for undertaking background selection and homozygotes in the case of BC3F2 & BC3F3
4 30 30
Number of SSR markers used for background selection
* 32 40
Number of plants after background selection (with % recurrent parent genome recovery
* 15 (80-95%)
6 (90-98%)
Number of plants selected with higher background genome recovery used for generation advancement
4 5 (89-95%)
6 (90-98%)
* = Background selection was not done due to less number of plants; † = Plants were selected based on priority, - = not done
Table 3 Disease reaction of parental and BC3F4 lines carrying foc1 locus conferring resistance to race 1 of Fusarium oxysporum
Lines FW incidence (%) Disease reaction$
Parental lines C 214 (recurrent parent) 54.50 Susceptible WR 315 (donor parent) 6 Resistant
2 TA110 ACACTATAGGTATAGGCATTTAGGCAA TTCTTTATAAATATCAGACCGGAAAGA Millan et al. (2006) 2 TR19 TCAGTATCACGTGTAATTCGT CATGAACATCAAGTTCTCCA Sharma and Muehlba
blight (AB) QTLAR3, ar1, ar2a)
2 GA16 CACCTCGTACCATGGTTTCTG TAAATTTCATCCTCTCCGGC Iruela et al. (2007) 2 TS82 TCAAGATTGATATTGATTAGATAAAAGC CTTTATTTACCACTTGCACAACACTAA Iruela et al. (2007) 2 TA194 TTTTTGGCTTATTAGACTGACTT TTGCCATAAAATACAAAATCC Iruela et al. (2007) 2 TR58 CTCTATATTTGTTTGTTTTTCGTTTTG TAAAATGTGTAGGGTGCAGAATAAATA Iruela et al. (2007)
( QTLAR1, QTLAR2, ar2b) 4 GAA47 CACTCCTCATGCCAACTCCT AAAATGGAATAGTCGTATGGGG Iruela et al. (2006) 4 SCY17 GACGTGGTGACTATCTAGC GACGTGGTGAAATAGATACC Iruela et al. (2006) 4 TA130 TCTTTCTTTGCTTCCAATGT GTAAATCCCTCGAGAAATCAA Udupa and Baum (2 4 TA2 AAATGGAAGAAGAATAAAAACGAAAC TTCCATTCTTTATTATCCATATCACTACA Udupa and Baum (2
The Plant Genome: Posted 5 Dec. 2013; doi: 10.3835/plantgenome2013.10.0035

MABC lines ICCX-100175-349-2-2 0 Resistant ICCX-100175-389-3-2 5 Resistant ICCX-100175-382-4-6 20 Resistant $FW disease reaction of each line was scored as per the scale of Sharma et al. (2005). The plants were categories as
resistant (0-20%), moderately susceptible (21-50%) and susceptible (>50%)
Table 4 Details on genotyping, selection and crossing of lines in different generations during marker-assisted backcrossing (MABC) for introgressing Ascochyta blight (AB) resistance in C 214
Targeted QTL region Markers BC1F1
BC2F1
BC3F1
BC
Markers used in foreground selection and plants selected during different generations
Ana
lyze
d
Scor
able
ban
ds
Het
eroz
ygot
es
Ana
lyze
d
Scor
able
ban
ds
Het
eroz
ygot
es
Ana
lyze
d
Scor
able
ban
ds
Het
eroz
ygot
es
Ana
lyze
d
Scor
able
ban
ds
ABQTL-I TA194 - - - 60 60 31 38 38 21 51 44 TR58 - - - - - - - - - 51 47 TS82 - - - 60 60 31 38 38 21 51 49 GA16 38 37 14 60 60 22 38 12 8 51 47 Common heterozygotes / homozygotes for all ABQTL-I markers NA - - NA - - NA - -
ABQTL-II SCY17 - - - 124 61 - 88 38 - 51 50 TA130 38 38 21 60 58 50 38 32 31 51 50 TA2 38 28 19 60 60 53 38 37 30 51 49 GAA47 38 29 14 60 55 29 38 33 27 51 43 Common heterozygotes / homozygotes for all ABQTL-II markers NA - - NA - - NA - -
Heterozygotes in case of BC1F1, BC2F1, BC3F1 for undertaking background selection and homozygotes in case of BC3F2 and BC3F3
2
46
38
No co homo
Number of SSR markers used for background selection * 29 43
Number of plants after background selection (with % recurrent parent genome recovery
*
23 (80-90%)
Number of plants selected with higher background genome recovery used for generation advancement
2 6 (80-87%)
38$
Table 5 Disease reaction of parental and BC3F4 lines carrying two QTL regions (ABQTL-I and ABQTL-II) conferring resistance to Ascochyta blight
$ = Although foreground and background selection was done, all 38 plants which were positive with SCAR marker (SCY17) for selfing to obtain more number o was not done due to less number of plants; † = Plants were selected based on the priority; NA = not available
The Plant Genome: Posted 5 Dec. 2013; doi: 10.3835/plantgenome2013.10.0035
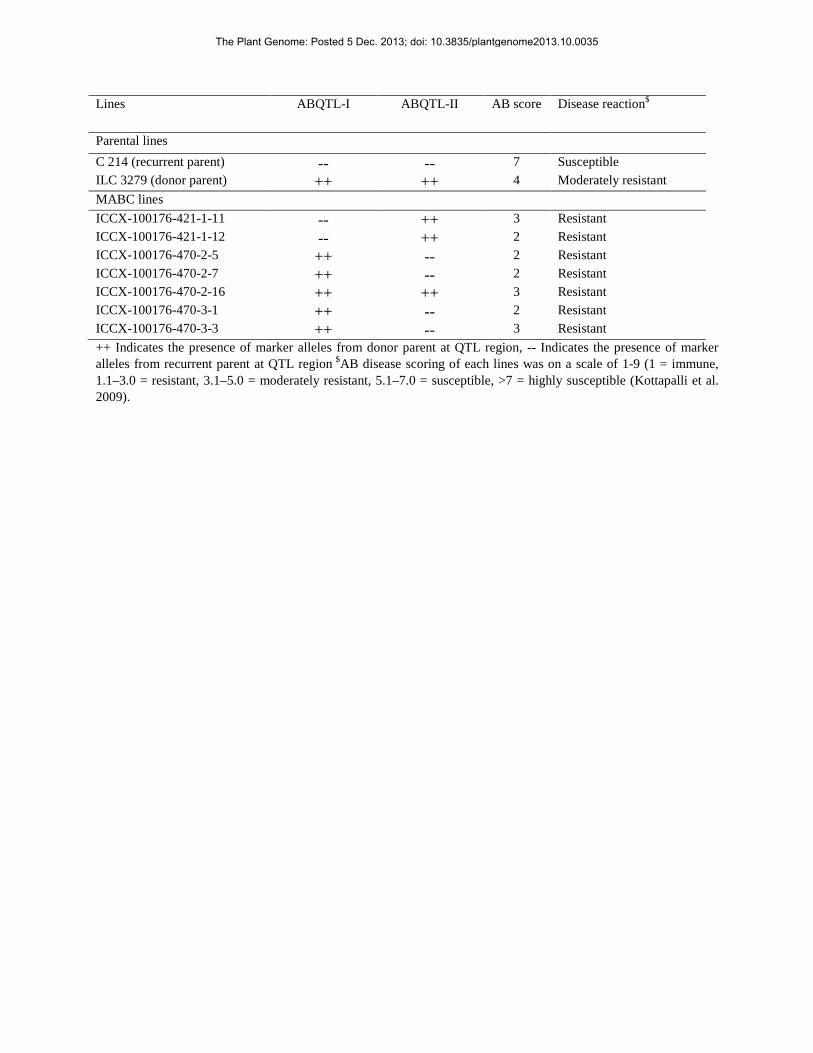
Lines ABQTL-I ABQTL-II AB score Disease reaction$
Parental lines C 214 (recurrent parent) -- -- 7 Susceptible ILC 3279 (donor parent) ++ ++ 4 Moderately resistant MABC lines ICCX-100176-421-1-11 -- ++ 3 Resistant ICCX-100176-421-1-12 -- ++ 2 Resistant ICCX-100176-470-2-5 ++ -- 2 Resistant ICCX-100176-470-2-7 ++ -- 2 Resistant ICCX-100176-470-2-16 ++ ++ 3 Resistant ICCX-100176-470-3-1 ++ -- 2 Resistant ICCX-100176-470-3-3 ++ -- 3 Resistant ++ Indicates the presence of marker alleles from donor parent at QTL region, -- Indicates the presence of marker alleles from recurrent parent at QTL region $AB disease scoring of each lines was on a scale of 1-9 (1 = immune, 1.1–3.0 = resistant, 3.1–5.0 = moderately resistant, 5.1–7.0 = susceptible, >7 = highly susceptible (Kottapalli et al. 2009).
The Plant Genome: Posted 5 Dec. 2013; doi: 10.3835/plantgenome2013.10.0035
The Plant Genome: Posted 5 Dec. 2013; doi: 10.3835/plantgenome2013.10.0035

The Plant Genome: Posted 5 Dec. 2013; doi: 10.3835/plantgenome2013.10.0035

The Plant Genome: Posted 5 Dec. 2013; doi: 10.3835/plantgenome2013.10.0035
The Plant Genome: Posted 5 Dec. 2013; doi: 10.3835/plantgenome2013.10.0035
Recommended


![Breeding schemes for the implementation of genomic ... · gies have been developed, including marker assisted backcrossing [5–7] with foreground and background selection [8,9],](https://img.dokumen.tips/doc/110x75/5ebdc7a887ea1526d967c790/breeding-schemes-for-the-implementation-of-genomic-gies-have-been-developed.jpg)