3015 SW First Avenue, Portland, OR 97201 T 503.924.4704 F 503.943.6357 www.apexcos.com
March 28, 2014 Ms. Pamela Green Kansas Department of Health and Environment Bureau of Environmental Remediation 1000 SW Jackson Street, Suite 410 Topeka, Kansas 66612 Re: SVE Evaluation and Proposed Soil Investigation Report NuStar Andover Quail Crossing
Andover, Kansas 1641-04
Dear Ms. Green: Enclosed, please find the SVE Evaluation and Proposed Soil Investigation Report (Report). This Report was prepared by Apex Companies, LLC (Apex) on behalf of NuStar Pipeline Operating Partnership L.P. (NuStar) in response to a gasoline release from a NuStar refined petroleum pipeline. As discussed earlier this week, NuStar is prepared to implement the proposed soil investigation as soon as April 7, 2014. If you have any questions or would like to discuss this further, please contact me at (503) 924-4704 ext. 111 Sincerely, Sam Jackson Associate Engineer ATTACHMENT
SVE Evaluation and Proposed Soil Investigation Report cc: Ms. Renee Robinson, NuStar Energy, L.P. (electronic deliverable)

SVE Evaluation and Proposed Soil Investigation Report
Quail Crossing Neighborhood Andover, Kansas
Prepared for: NuStar Pipeline Operating Partnership L.P.
March 28, 2014 1641-04
Approved with Comment


SVE Evaluation and Proposed Soil Investigation Report Page i Quail Crossing Neighborhood – Andover, Kansas March 28, 2014 1641-04
Table of Contents
1.0 INTRODUCTION ...................................................................................................................................... 1
1.1 Objectives .......................................................................................................................................... 2
1.2 Report Organization ........................................................................................................................... 2
2.0 BACKGROUND ........................................................................................................................................ 2
2.1 Site Description .................................................................................................................................. 3
2.2 IRM and CI Activities .......................................................................................................................... 3
3.0 SVE PILOT TEST RESULTS .................................................................................................................... 4
3.1 Pilot Test and Evaluation ................................................................................................................... 4
3.2 System Layout and Specifications ..................................................................................................... 5
3.3 System Operation .............................................................................................................................. 7
3.4 Schedule ............................................................................................................................................ 8
4.0 NEIGHBORHOOD MEETING AND PUBLIC OUTREACH ....................................................................... 8
5.0 SOIL INVESTIGATION ............................................................................................................................. 9
5.1 Proposed Soil Boring Locations ....................................................................................................... 10
5.2 Preparatory Activities ....................................................................................................................... 10
5.3 Procedures ...................................................................................................................................... 10
5.4 Drilling and Soil Sample Collection .................................................................................................. 10
5.5 Soil Sampling and Analysis .............................................................................................................. 10
5.6 Field Screening ................................................................................................................................ 11
5.7 Quality Assurance and Quality Control ............................................................................................ 11
5.8 Investigation-Derived Waste ............................................................................................................ 11
6.0 SCHEDULE ............................................................................................................................................ 11
7.0 REFERENCES ....................................................................................................................................... 12
Table
1 SVE Pilot Test Effluent Data
Figures
1 Site Location Map
2 Site Plan and Sampling Location Map
3 Soil Vapor Extraction Test Well Locations
4 Conceptual Soil Vapor Extraction System
5 Soil Vapor Extraction System Schematic
6 Conceptual SVE Enclosure
7 Proposed Soil Boring Locations

SVE Evaluation and Proposed Soil Investigation Report Page ii Quail Crossing Neighborhood – Andover, Kansas March 28, 2014 1641-04
Appendices
A Field Notes and SVE Pilot Test Flow Rate Data
B Analytical Laboratory Report – SVE Effluent Data
C Sampling and Analysis Plan

SVE Evaluation and Proposed Soil Investigation Report Page 1 Quail Crossing Neighborhood – Andover, Kansas March 28, 2014 1641-04
1.0 Introduction
This Soil Vapor Extraction (SVE) Evaluation and Proposed Soil Investigation Report was prepared by Apex
Companies, LLC (Apex) on behalf of NuStar Pipeline Operating Partnership L.P. (NuStar) in response to a
gasoline release from a NuStar refined petroleum pipeline. The pipeline release was discovered after
separate-phase hydrocarbons (SPH) were detected in an irrigation well at 2006 N Colt Court, in the Quail
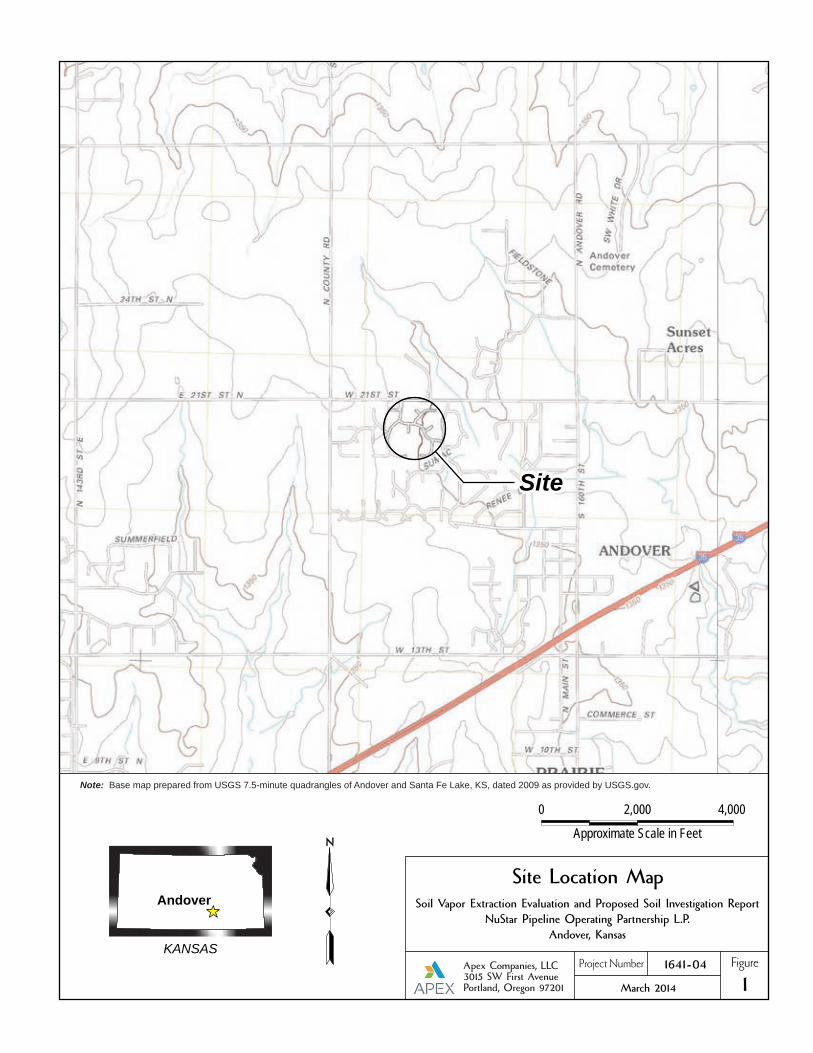
Crossing Neighborhood (the Neighborhood) of Andover, Kansas (the Site; Figure 1). The NuStar pipeline
release location is approximately 80 feet north of the affected irrigation well.
Upon notification of the discovery of SPH in the irrigation well, NuStar immediately mobilized to the Site and
implemented several initial response and abatement activities. Following the initial response activities,
NuStar: (1) performed a number of interim remedial measures (IRMs); and (2) planned and implemented a
Comprehensive Investigation (CI) in coordination with Kansas Department of Health and Environment
(KDHE) and the Quail Crossing Neighborhood Association. These activities were performed in accordance
with the Consent Agreement and Final Order (CAFO), dated May 10, 2013, and are described in detail in the
CI Report (Apex, 2014). A groundwater monitoring program and weekly vacuum extraction events are
ongoing at the Site.
Although a significant amount of soil containing gasoline constituents was removed during pipeline repair
activities, information developed during the CI indicates that residual gasoline constituents remain in soil at
some locations in the vicinity of the pipeline release. This material may be an ongoing source of gasoline
constituents to groundwater. To evaluate the feasibility of SVE technology for removing gasoline constituents at
the pipeline release area, NuStar performed an SVE pilot test during the week of December 9, 2013. This pilot
test was performed in accordance with the KDHE-approved SVE Pilot Test Work Plan (Apex, 2013c). The
methods and results of the pilot test, and a complete evaluation of the pilot test results, are presented herein.
A preliminary evaluation of the SVE pilot test results indicated that SVE may be an effective remedial
technology to remove source area material in the vicinity of the release location. Accordingly, NuStar presented
the preliminary results of the SVE pilot test and a conceptual SVE system design at a
KDHE-organized Neighborhood meeting on February 17, 2014. In the week after the meeting, the
Neighborhood evaluated the proposal and then stated that they would not approve of the construction and
operation of an SVE system in the Neighborhood. Neighborhood representatives cited a number of reasons for
not accepting an SVE system, including concerns about noise, emissions, and the appearance of
above-ground infrastructure.
In an effort to evaluate other remedial alternatives that may be acceptable to Neighborhood residents and
effective for removing hydrocarbon mass from the subsurface, NuStar proposes additional soil investigation
in the vicinity of the pipeline release. The purpose of the additional soil investigation is to obtain data that
SVE Evaluation and Proposed Soil Investigation Report Page 2 Quail Crossing Neighborhood – Andover, Kansas March 28, 2014 1641-04
will be useful for refining the understanding of the extent of gasoline constituents in soil. These data will be
used to select and design a remedial alternative that is acceptable to the Neighborhood.
1.1 Objectives
The objectives of this report are: (1) document the results of the SVE pilot test that was performed in
December 2013; (2) present a conceptual SVE system design; (3) document outreach activities to the
Neighborhood and the Neighborhood response to the proposed SVE system; and (4) propose additional
activities to refine the understanding of the nature and extent of gasoline constituents in soil at the pipeline
release area.
1.2 Report Organization
The following sections of this report include:
Background and Site Description – This section describes the Site characteristics and findings of
the CI and describes the interim remedial measures (IRMs) that have been implemented at the
Site.
Soil Vapor Extraction Test Results – This section presents the methods and results of the SVE pilot
test and a design for a conceptual SVE system at the Site.
Neighborhood Feedback – This section describes NuStar and KDHE outreach efforts to the
Neighborhood regarding the potential installation of an SVE system, and the Neighborhood
response to the proposed SVE system.
Proposed Activities – This section describes investigation activities that are proposed to further
refine the understanding of the nature and extent of gasoline constituents in soil; these data will be
used, in coordination with KDHE, to evaluate alternative remedial options that may be acceptable to
the Neighborhood.
2.0 Background
The gasoline release from the NuStar pipeline was discovered on June 8, 2012, following the detection of
SPH in an irrigation well at the property at 2006 N Colt Court. Upon notification of the discovery of SPH in
the irrigation well, NuStar immediately mobilized to the Site and implemented several initial response and
abatement activities, including: (1) inspecting and testing of the pipeline; (2) hydrotesting of the affected
portion of the pipeline; (3) excavation and removal of soil containing gasoline constituents along a 45-foot
section of pipeline; (4) replacement of a portion of the pipeline; (5) collection and analysis of water samples
from the irrigation well at 2006 N Colt Court; (6) field screening of nearby irrigation wells; (7) vacuum and
manual removal of SPH and water from the irrigation well at 2006 N Colt Court; and (8) deactivation of the
irrigation well at 2006 N Colt Court and irrigation wells at other properties, and connection of the associated

SVE Evaluation and Proposed Soil Investigation Report Page 3 Quail Crossing Neighborhood – Andover, Kansas March 28, 2014 1641-04
irrigation systems to the municipal water supply. Many of these activities were discussed in the Initial
Response Summary Report (Apex, 2012a) as well as in the Comprehensive Investigation Report
(Apex, 2014).
Following the initial response activities, NuStar planned and implemented the CI and performed a number of
IRMs in coordination with KDHE and the Quail Crossing Neighborhood Association. These activities are
described in detail below.
2.1 Site Description
The Site is located in the northern portion of the City of Andover, in southwest Butler County, Kansas
(Figure 1). Land use at the Site and surrounding areas is residential. As shown on Figure 2, a stormwater
retention pond is located near the Site, approximately 250 feet south of the NuStar pipeline.
The NuStar pipeline is constructed of 8-inch-diameter carbon steel and is used to transport liquefied
petroleum products. The pipeline was installed to an approximate depth of 3 feet below the ground surface
(bgs) in agricultural land in 1959. The pipeline remained in agricultural and/or undeveloped land until the late
1990s when development of the Quail Crossing Neighborhood began.
As part of the Neighborhood development, the pipeline depth was increased to approximately 6 feet bgs by
re-excavating and backfilling with native material. An approximately 50-foot-wide pipeline right of
way (ROW) was created along the pipeline pathway for safety purposes during Neighborhood development.
The ROW limits development activities near the pipeline. The pipeline location and associated ROW are
shown on Figure 2.
The Neighborhood is located on 21st Street between 159th Street and Andover Road in the City of Andover,
and encompasses approximately a one-quarter- by one-half-mile area. The Neighborhood is currently zoned
for residential use (R-2) by Butler County. Approximately 165 homes are present in the Neighborhood.
Utilities in the Neighborhood (power, natural gas, water, and sewer) are underground. The general location
of underground utilities in the vicinity of the pipeline release is shown on Figure 2. Utilities will be mapped in
greater detail during future work at the Site.
2.2 Interim Remedial Measures and Comprehensive Investigation Activities
In addition to the initial response and abatement activities discussed above, ongoing IRMs include weekly
vacuum extraction of SPH and water from the irrigation well at 2006 N Colt Court. Since removal measures
were initiated in June 2012, SPH levels have decreased significantly; and since August 2013, SPH have
been only intermittently present in the irrigation well. SPH have not been detected in other wells in the
Neighborhood.

SVE Evaluation and Proposed Soil Investigation Report Page 4 Quail Crossing Neighborhood – Andover, Kansas March 28, 2014 1641-04
The CI was performed following the initial response activities. Activities completed during the CI included:
(1) the advancement of 24 soil borings; (2) collection and analysis of soil samples from 16 soil borings;
(3) installation of 16 groundwater monitoring wells, three soil vapor monitoring points, and four soil vacuum
extraction (SVE) test wells; (4) collection and analysis of water samples from the 16 monitoring wells and 13
irrigation wells during one monitoring event and 16 irrigation wells during a second monitoring event; and (5)
collection and analysis of vapor samples from the soil vapor monitoring points. The results of the CI were
presented in the Comprehensive Investigation Report submitted in February 2014. During the CI, NuStar
also performed a pilot test to evaluate if SVE would be an effective remediation technology for the Site.
3.0 SVE Pilot Test Results
To evaluate the feasibility of SVE technology for remediating gasoline constituents in the subsurface, NuStar
performed an SVE pilot test on December 9 and 10, 2013. This pilot test was performed in accordance with the
KDHE-approved SVE Pilot Test Work Plan (Apex, 2013c). The methods and results of the pilot test are
presented below.
3.1 Pilot Test and Evaluation
The SVE pilot test was performed using pilot test wells that were installed specifically for pilot testing purposes
(i.e., wells SVE-2, SVE-3, and SVE-4), and using appropriately constructed groundwater monitoring wells (that
is, wells with adequate sections of the screen interval exposed to vadose zone soil). Details regarding the
construction of these wells were presented in the CI Report (Apex, 2014).
The SVE pilot test consisted of two primary elements: (1) vacuum was induced individually at three SVE pilot
test wells (SVE-2, SVE-3, and SVE-4) at a range of levels (ranging from 34 to 115 inches of water vacuum); and
(2) vacuum pressure was measured at five monitoring points (SVE-1, SVE-2, SVE-3, SVE-4, MW-3, and/or
MW-9) at varying distances from the extraction well. Vacuum was induced using a self-contained mobile blower
unit. For each phase, a constant flow rate was maintained and the vacuum pressure in the extraction well and
the five monitoring wells was periodically measured and recorded until conditions stabilized. SVE pilot test well
locations are shown on Figure 3; field notes and pilot test flow rate data are presented in Appendix A.
3.1.1 Estimated Radius of Influence
Using data gathered during the pilot test, an analytical model (e.g., Air2D; USGS, 1987) was used to estimate
the intrinsic air permeability of the geologic formation at the Site (using the collected data from each monitoring
point, at each flow rate, and at varying radial distances of each monitoring well from the active extraction point).
The estimated intrinsic air permeability was determined to be approximately 1x10⁻⁷ square centimeters (cm2).
Using this derived permeability, the Air2D model was also used to assess the site-specific relationship between

SVE Evaluation and Proposed Soil Investigation Report Page 5 Quail Crossing Neighborhood – Andover, Kansas March 28, 2014 1641-04
air flow (and the resultant vacuum pressure) and the potential radius of influence (ROI) of each soil vapor
extraction point. The results of the Air2D model are included in Appendix A.
In accordance with the U.S. Army Corps of Engineers (USACE) design guidance for SVE systems (USACE,
2002), the ROI is defined as the distance at which the soil vapor velocity is a minimum of 0.001 cm/sec. Based
on this evaluation, the ROI for an SVE system at the Site would be between 19 feet and 24 feet (corresponding
to a per-well air flow of 7 to 10 cubic feet per minute [cfm]). Higher soil vapor flow rates may be attainable, but
would be potentially unsustainable due to high stresses on system equipment.
3.1.2 VOC Concentrations in System Effluent
At intervals during the SVE pilot test, volatile organic compound (VOC) concentrations were measured at the
blower exhaust using a photoionization detector (PID). In addition, two samples of the system effluent were
collected and submitted for laboratory analysis of VOCs (benzene, 1,2-dichloroethane, ethylbenzene,
naphthalene, toluene, 1,2,4-trimethylbenzene, 1,3,5-trimethylbenzene, xylenes, n-butylbenzene, and
n-propylbenzene) using U.S. Environmental Protection Agency (EPA) Method TO-15.
As shown in Table 1, effluent samples collected during the SVE pilot study identified an overall VOC
concentration in effluent of up to 50,000 micrograms per cubic meter (µg/m3). The analytical laboratory
report is included in Appendix B. The effluent data were evaluated to assess whether effluent discharge
from a conceptual SVE system would meet Kansas criteria for discharge to the atmosphere, or if effluent
treatment would be required prior to discharge. The effluent evaluation is discussed in more detail in Section
3.2.
3.2 System Layout and Specifications
Based on the SVE pilot test data, presented in Section 3.1, and the understanding of the distribution of
gasoline constituents in soil, described in detail in the CI report, an SVE system was designed that would
maximize removal of hydrocarbon mass from the subsurface, while minimizing aesthetic impacts and
inconvenience to the Neighborhood. The proposed location of the extraction well network for the conceptual
SVE system is within the immediate release area, which contains the highest vadose-zone concentrations of
gasoline constituents at the Site. The conceptual location for the aboveground components of the system is
on community-owned land in proximity to the source area, maximizing the efficiency of the conceptual
system. The SVE system design and specifications are presented below.
The layout and size of SVE system components is dependent on the surface cover, soil type, depth to
groundwater (the thickness of the vadose zone), and horizontal and vertical extent of the target VOCs. This
section provides the parameters used for the design of the SVE system. In general, the design is based on
the recommendations provided in the USACE Soil Vapor Extraction Engineer Manual (2002) and the results
of the December 2013 SVE pilot test.

SVE Evaluation and Proposed Soil Investigation Report Page 6 Quail Crossing Neighborhood – Andover, Kansas March 28, 2014 1641-04
The conceptual layout of the system is shown on Figure 4, a schematic of the SVE system components is
shown on Figure 5, and the conceptual remediation building is shown on Figure 6. The bulk of the
underground components of the SVE system (e.g., extraction wells) would be installed in the NuStar
easement and City of Andover ROW in the vicinity of the pipeline release location. Aboveground
infrastructure, consisting of a blower, control systems, knock-out drum, and effluent treatment vessels, would
be housed in a small building constructed on property owned by the Quail Crossing Homeowner Association
(HOA) south of the NuStar pipeline. The building would secure and weatherize aboveground equipment,
improve equipment aesthetics, and mitigate noise from the blower.
Chemical Profile. The SVE system was designed to target gasoline constituents. Published information
about the volatility of these gasoline constituents has been used to verify the applicability of SVE as a
removal technology.
Soil Profile. The ground surface in the treatment area is mostly paved. The underlying soil profile consists
of continuous fine-grained soil (clays) through the thickness of the vadose zone (to a typical depth of about
30 feet bgs). The intrinsic air permeability measured during the SVE pilot study is 5 x 10⁻⁶ cm2. The air
permeability, calculated based on the SVE pilot test data, is provided in Appendix A.
Extraction Points. As discussed in Section 3.1, the SVE extraction wells would have an ROI of up to
24 feet. To provide complete coverage over the treatment area, the radii of each well should overlap by
about 20 percent (so that the radii of adjacent offset rows converge). The proposed SVE well spacing for
the conceptual design, therefore, is 38 feet. At this spacing, a total of 5 wells would be needed to remove
source area material in the vicinity of the release location. The proposed layout of the vapor extraction points
is shown on Figure 4. Each proposed extraction well would be comprised of a 2-inch-diameter Schedule 80
PVC well, with 10 feet of screen, installed between approximately 20 and 30 feet bgs.
Blower Selection. The required air flow for the SVE system is on the order of up to 50 cfm, based upon five
SVE wells at a flow rate of 10 cfm each and vacuum pressures of on the order of 80 inches of water. These
specifications are within the operating parameters of medium-sized positive displacement blowers (such as
the 7.5 hp Rotron EN633).
Piping Selection and Layout. For the conceptual design, piping is sized so that the pressure drop through
the pipe (due to friction losses) is less than 0.01 inch of water per foot of pipe. The selected piping
diameters are 2 inches at each vapor extraction well and for lengths of single-well piping. Larger piping
(3- to 4-inch-diameter) would be used for manifold piping and blower system components. The proposed
piping consists of Schedule 80 PVC. The concentrations of vapors in the operating airflow are not expected
to adversely affect the PVC material during the operating life of the system. The conceptual layout of the
system is shown on Figure 5. Piping would be installed below ground.

SVE Evaluation and Proposed Soil Investigation Report Page 7 Quail Crossing Neighborhood – Andover, Kansas March 28, 2014 1641-04
Effluent Treatment. Activated carbon would be used to remove VOCs from the air stream prior to
discharge into the atmosphere (other removal technologies, such as catalytic or thermal oxidation, require
significant energy and are generally incompatible with the neighborhood noise levels). Two approximately
1,000-pound carbon vessels would be installed in series to treat the effluent. The carbon vessels are sized
to accommodate the required air flow and to reasonably limit the frequency of carbon replacement. Effluent
monitoring would be performed before, between, and after the carbon vessels to verify efficient use of the
carbon and compliance with air discharge limitations.
Based on effluent measurements collected during the SVE pilot test, the estimated initial carbon usage rates
are on the order of 30 pounds of carbon per day. While even small effluent carbon vessels (i.e.,
55-gallon drums) will allow the design flow rate of 50 cfm (with a head loss of less than 5 inches of water),
the mass loading on such a vessel would require replacement frequency that would be on the order of
6 days. To allow a reasonable frequency of carbon replacements (requiring mobilization to the site, removal
of the spent carbon for regeneration, and replacement of new carbon), the system would be installed with
two 1,000-pound carbon vessels, which would have an initial change-out frequency of on the order of
monthly. It is expected that the usage rate would decrease with time as the VOC concentrations in the
treatment area are reduced. The carbon usage rate would be re-evaluated after the startup of the system to
assess the likely frequency of carbon changes.
Noise Mitigation. Noise generated by an SVE system includes mechanical noise generated by the blower
unit and flow noise from air being discharged from the exhaust stack. Without mitigation, this noise can
exceed 80 decibels (dba) in close proximity to the equipment. To reduce noise, the exhaust stack would be
oversized to reduce air velocity and would include a muffler unit. The system equipment would be enclosed
in an insulated building (as shown on Figure 6), which would reduce sound emissions to generally
acceptable levels (i.e., less than 40 dba at a distance of 20 feet, a reference sound level consistent with
quiet suburban neighborhoods). If further noise reduction is required (such as between the system and a
sensitive receptor), a sound attenuation wall could be installed to further reduce noise levels.
3.3 System Operation
System Startup. Initial startup of the system includes powering up of the SVE blower and verifying proper
operation of the equipment (including measurement of the induced vacuum at each of the SVE wellheads,
monitoring wells, and at each of the system influents). Vacuum measurements at the influent are monitored
to verify system performance (e.g., changes in vacuum pressure may indicate problems in system operation)
and to verify that the blower is not overloaded (excessive input vacuums may overstress the blower).
Vacuum pressures at each of the SVE wellheads would be balanced by adjusting flow control valves at each
wellhead. The vacuum pressure would be monitored while the system is in operation, using magnehelic
pressure gauges.

SVE Evaluation and Proposed Soil Investigation Report Page 8 Quail Crossing Neighborhood – Andover, Kansas March 28, 2014 1641-04
Vacuum pressure data would be evaluated to confirm the ROI of the vapor extraction wells. Adjustments to
the system would be made as appropriate (such as adjusting the air flow rate) to provide operation
consistent with the design goals.
Startup Monitoring. Following the initial startup of the system, VOCs would be measured at each wellhead
and at blower effluent using a PID. The PID measures volatile organics in the effluent stream using a low
vacuum to withdraw an effluent sample from the air stream. Therefore, samples from the vacuum side (the
influent branches) of the blower are collected with the system off. Samples of the system effluent would also
be collected and submitted for laboratory analysis of VOC concentrations.
The data from the startup monitoring would be used to assess the operation of the system and the carbon
vessel mass loading rate. Carbon vessel sizing may be adjusted if actual mass removal rates are
significantly different from the conditions encountered during the pilot test.
Routine System Monitoring. Routine monitoring of the SVE system would be conducted weekly during the
first month of operation and monthly thereafter. Effluent sampling downstream of the first of the two carbon
vessels would allow a determination of when the carbon has been saturated and breakthrough is occurring
(with the second carbon maintaining protection of air quality). When breakthrough of the first (lead) carbon
occurs, the spent carbon would be exchanged for fresh carbon and the carbon vessels would be reversed
such that the new carbon is in the second (lag) position while the former lag carbon becomes the lead
carbon. The monitoring consists of PID and pressure monitoring. System effluent samples will be collected
to corroborate the PID data. The results of ongoing system monitoring may be used to adjust the monitoring
frequency if appropriate.
3.4 Schedule
Implementing the system described herein could begin within six months of KDHE and Neighborhood
approval, barring delays beyond the control of NuStar.
4.0 Neighborhood Meeting and Public Outreach
On February 17, 2014, a public meeting was held near the Quail Crossing Neighborhood. Attendees
included approximately 50 Neighborhood residents; as well as representatives from KDHE, NuStar, and
Apex. NuStar representatives presented to the residents the results of the CI followed by the proposed SVE
design for remediation. The suburban residential setting of the Site was taken into consideration and played
a key role in the conceptual cleanup design. As such, the proposal to the residents highlighted design
enhancements and modifications including the location of infrastructure, noise mitigation, and aesthetics.
The extraction well network will be located primarily in W Mountain Street in the immediate release
area adjacent to the pipeline rather than on private property.

SVE Evaluation and Proposed Soil Investigation Report Page 9 Quail Crossing Neighborhood – Andover, Kansas March 28, 2014 1641-04
The conceptual remediation building, as shown on Figure 6, was enhanced to be more aesthetically
pleasing, with an appearance more similar to other structures in the Neighborhood rather than
standard remediation design.
Sound dampening insulation was proposed for use in the building to minimize the decibel leveI. In
addition, a separate sound attenuation wall was proposed outside of the building to further reduce
noise levels.
The proposed location for the remediation building was on HOA property rather than private
homeowner property.
Fencing and/or a wall along the abutting property boundary was proposed for additional aesthetic
and noise mitigation.
Responses during the meeting and following the meeting indicated that Neighborhood residents were
overwhelmingly opposed to construction and operation of an SVE system in the Neighborhood. The primary
concerns cited as a basis for opposition were: (1) sound levels associated with operation of the SVE
system; (2) visual impact of the system enclosure; and (3) the expected duration of operation of an SVE
system. In an email dated February 22, 2014, the Quail Crossing Neighborhood Association stated, “The
proposed building site is unacceptable because it is too close to the Lee’s home [1023 W Mountain] and
because it will significantly detract from and negatively impact the Lee’s home and the neighborhood’s
appearance.”
NuStar and KDHE reviewed the feedback provided by Neighborhood residents and, in consideration of the
concerns voiced by the residents, determined that SVE was not a feasible approach for removing petroleum
hydrocarbon mass from the subsurface. In the email dated February 22, 2014, the Quail Crossing
Neighborhood Association stated that the residents wanted to evaluate other source removal options,
including excavation of the soil that contains gasoline constituents. In response to the Neighborhood
request, and as outlined in the next section, NuStar proposes to perform additional soil investigation to refine
the understanding of the extent of soil with gasoline constituents and to evaluate excavation as a source
removal option for the Site in lieu of SVE and/or other remedial technologies which would require similar
infrastructure.
5.0 Soil Investigation
The following sections detail the methods for the proposed soil investigation at the Site. The soil
investigation will be focused on the pipeline release area, where residual gasoline constituents are present in
vadose zone soil. The information obtained during the soil investigation will be used to evaluate alternative
source removal options for the Site, including soil excavation.

SVE Evaluation and Proposed Soil Investigation Report Page 10 Quail Crossing Neighborhood – Andover, Kansas March 28, 2014 1641-04
5.1 Proposed Soil Boring Locations
In June 2012, NuStar excavated approximately 16 cubic yards of soil containing gasoline constituents from
the pipeline release area. The lateral extent of the excavation was limited by buried utilities and private
property. Soil data obtained during the CI indicate that soil containing gasoline constituents is generally
limited to the immediate vicinity of the pipeline release location. Consequently, twelve soil borings are
proposed in this area (within approximately 15 feet of the NuStar pipeline) to further delineate the lateral and
vertical extent of gasoline constituents in soil. The proposed locations for the soil borings are shown on
Figure 7. The number and locations of soil borings may be adjusted based on field observations during
drilling.
5.2 Preparatory Activities
Preparatory activities, such as the preparation of a Health and Safety Plan (HASP), procurement of
subcontractors, site clearing, and the location of underground utilities, will be performed. These activities are
detailed in the Sampling and Analysis Plan (SAP) in Appendix C.
5.3 Procedures
The specific procedures for completing field work are detailed in the SAP in Appendix C. The following
provides a brief description of the methods to be used for the soil investigation.
5.4 Drilling and Soil Sample Collection
Borings will be advanced using a hollow stem auger (HSA) drill rig. Borings will be advanced to an
approximate depth of 20 feet bgs. Soil cores will be extracted and soil lithology and conditions will be logged
in general accordance with ASTM 2487/2488. Descriptions will include visual indications of petroleum
impacts. Soil cores will be field screened for VOCs and SPH using a PID, and sheen tests will be conducted
on soil at 2.5-foot intervals. Detailed soil sampling procedures and the proposed analytical program are
described in Appendix C. A field log of lithology and soil conditions will be maintained for the borings.
Drilling equipment (i.e., auger stems, split-spoon sampler, etc.) will be decontaminated before and after each
boring is complete. The location of each boring will be recorded using a handheld global positioning system
(GPS) instrument.
5.5 Soil Sampling and Analysis
Soil samples will be collected using split-spoon sampling equipment. The split-spoon sampling method
provides essentially continuous soil samples during the advancement of the boring. Discrete soil samples
will be collected at approximately 2.5-foot intervals using the split spoon. Each soil sample will be logged for
lithologic description, field screened, and held for possible chemical analysis. Samples will be selected for
laboratory analysis based on field screening results, and as necessary to adequately define the nature and

SVE Evaluation and Proposed Soil Investigation Report Page 11 Quail Crossing Neighborhood – Andover, Kansas March 28, 2014 1641-04
extent of gasoline constituents in the subsurface. If the soil type changes or field screening suggests
contamination in a portion of the core, each distinct portion of the core will be sampled. Up to six soil
samples from each boring will be submitted for laboratory analysis, including one sample from the bottom of
each boring. Detailed soil sampling procedures are described in the SAP (Appendix C).
Soil samples will submitted to an accredited laboratory for analysis of: gasoline-range organics (GRO) by
Iowa Method OA-1; and benzene, toluene, ethylbenzene, and xylenes (BTEX), 2-butanone,
n-butylbenzene, naphthalene, n-propylbenzene, 1,2,4-trimethylbenzene, 1,3,5-trimethylbenzene,
cyclohexane, isopropylbenzene, and methylcyclohexane by EPA Method 8260B.
5.6 Field Screening
During the completion of the borings, soil cores will be screened for VOCs using a PID and SPH through
sheen testing. The field screening procedures are outlined in the SAP, which is included as Appendix C.
5.7 Quality Assurance and Quality Control
Quality assurance / quality control (QA/QC) procedures will be used throughout this project and are
described in detail in the SAP (Appendix C). The QA/QC procedures detailed in the SAP include sampling
and custody procedures, QA sampling analyses (such as analysis of duplicates), laboratory detection limit
goals, laboratory QC, and QA reporting.
5.8 Investigation-Derived Waste
Investigation-derived waste (IDW) will consist of soil from the soil cores, decontamination water, and
personal protection equipment (PPE). Soil and water IDW be containerized, labeled with the project name,
general contents, and date. The IDW will be profiled and transported to appropriate facilities for disposal.
6.0 Schedule
The scope of work described herein will be initiated within 60 days of KDHE’s approval of the Work Plan,
barring delays beyond the control of NuStar. Access agreements required to advance borings and stage
drilling equipment were finalized prior to performance of the Comprehensive Investigation in 2013. It is
estimated that the field activities will take approximately three days. The results of the investigation will be
presented and discussed in a report to be submitted within 60 days following receipt of the analytical data.
The report will: (1) document the results of the activities proposed herein; and (2) present an evaluation of
the analytical data. Based on the analytical data review, NuStar may propose excavation of soil that
contains gasoline constituents, or other appropriate measures.

SVE Evaluation and Proposed Soil Investigation Report Page 12 Quail Crossing Neighborhood – Andover, Kansas March 28, 2014 1641-04
If additional investigation is necessary to define the nature and extent soil with gasoline constituents following
implementation of the work described herein, NuStar will coordinate with KDHE regarding
follow-up activities and schedule.
7.0 References
Apex, 2012a. Initial Response Report, Separate –Phase Hydrocarbons in Irrigation Well, 2006 Colt Court, Quail
Crossing Neighborhood, Andover, Kansas. July 9, 2012.
Apex, 2012b. Groundwater Investigation Work Plan. Quail Crossing Neighborhood, Andover, Kansas.
September 9, 2012.
Apex, 2013a. Revised Groundwater Investigation Work Plan. Quail Crossing Neighborhood, Andover, Kansas.
July 2, 2013.
Apex, 2013b. Addendum to the Revised Groundwater Investigation Work Plan NuStar Pipeline Release Site,
Quail Crossing Neighborhood. September 20, 2013.
Apex, 2013c. Soil Vapor Extraction Pilot Test Work Plan. Quail Crossing Neighborhood, Andover, Kansas.
November 15, 2013.
Apex, 2014. Comprehensive Investigation Report. Quail Crossing Neighborhood, Andover, Kansas. February
4, 2014.
USGS, 1997. AIR2D - A Computer Code to Simulate Two-Dimensional, Radially Symmetric Airflow in the
Unsaturated Zone. File Report 97-588, 106 p. by Craig J. Joss and Arthur L. Baehr.
USACE, 2002. Engineering and Design. Soil Vapor Extraction and Bioventing. Manual No. 1110-1-4001.
June 3, 2002.

Table 1
SVE Initial 12/10/2013 <2,500 11,000 24,000 <2,500 <7,500 <2,500 <2,500 <2,500 <2,500 <2,500
SVE Completion 12/10/2013 <830 3,200 18,000 5,800 20,700 <830 <830 1,000 <830 <830
Notes:1. 1,2-dichloroethane, benzene, toluene, ethylbenzene, total xylenes, n-propylbenzene, 1,3,5 trimethylbenzene, 1,2,4 trimethylbenzene, naphthalene, and n-butylbenzene by Environmental Protection Agency (EPA) Method TO-15.
2. ug/m3 (ppm) = Micrograms per cubic meter.3. < = Not detected above the method reporting limit (MRL).
SVE Pilot Test Effluent DataAndover Colt Court Release SiteAndover, Kansas
Sample LocationSample
Date1,2 Dichloroethane Benzene Toluene Ethylbenzene
Concentrations in ug/m3 (micrograms per cubic meter)
n-ButylbenzeneTotal
Xylenes1,3,5
Trimethylbenzene1,2,4
TrimethylbenzeneNaphthalenen-Propylbenzene
SVE Evaluation and Proposed Soil Investigation ReportQuail Crossing Neighborhood – Andover, Kansas
1641-04Page 1 of 1
Site
Project Number
Site Location Map
1641-04
1Figure
March 2014
Soil Vapor Extraction Evaluation and Proposed Soil Investigation ReportNuStar Pipeline Operating Partnership L.P.
Andover, Kansas
Note: Base map prepared from USGS 7.5-minute quadrangles of Andover and Santa Fe Lake, KS, dated 2009 as provided by USGS.gov.
KANSAS
0 2,000
Approximate Scale in Feet
4,000
Andover
Apex Companies, LLC3015 SW First AvenuePortland, Oregon 97201

HOA-1
Excavation
(July 5-7, 2012)
Excavation
(June 14, 2012)
25'
25'
P
P
P
P
P
P
P
P
P
P
P
P
P
P
P
P
P
P
P
P
P
P
P
P
P
P
P
P
P
W
M
o
u
n
t
a
i
n
N C
olt C
t.
N
R
u
g
e
r
C
i
r
.
N Q
ua
il C
ro
ssin
g S
t.
2006 N
Colt Ct.
N
u
S
ta
r
R
ig
h
t-
o
f-
W
a
y
2004 N
Colt Ct.
2002 N
Colt Ct.
2001 N
Colt Ct.
2005 N
Colt Ct.
2007 N
Colt Ct.
2022 N Quail
Crossing St.
2019 N
Ruger Cir.
1023 W
Mountain
2020 N
Ruger Cir.
Pipeline
Release Location
N
R
u
g
e
r
C
t
.
2008 N
Quail Crossing St.
2002 N
Quail Crossing St.
1950 N
Quail Crossing St.
1942 N
Quail Crossing St.
1936 N
Quail Crossing St.
1930 N
Quail Crossing St.
1019 W
Mountain
1017 W
Mountain
1013 W
Mountain
1009 W
Mountain
R
em
ington C
ir.
N
Q
u
a
il C
r
o
s
s
in
g
S
t.
1012 W
Mountain
1006 W
Mountain
2030 N Quail
Crossing St.
1211 W Quail
Crossing Ct.
1217 W Quail
Crossing Ct.
1221 W Quail
Crossing Ct.
HOA
2024 N
Ruger Cir.
2021 N
Ruger Ct.
2023 N
Ruger Ct.
2007 N
Mountain Ct.
2009 N
Mountain Ct.
2011 N
Mountain Ct.
2010 N
Mountain Ct.
HOA
HOA
2025 N
Ruger Ct.
2028 N
Ruger Cir.
2032 N
Ruger Cir.
2031 N
Ruger Ct.
2036 N
Ruger Cir.
2040 N
Ruger Cir.
2044 N
Ruger Cir.
2043 N
Ruger Cir.
2039 N
Ruger Cir.
2037 N
Ruger Cir.
2035 N
Ruger Cir.2033 N
Ruger Cir.
W 21st St.
2029 N
Ruger Ct.
2027 N
Ruger Ct.
2046 N Quail
Crossing St.
2040 N Quail
Crossing St.
2034 N Quail
Crossing St.
1212 W Quail
Crossing Ct.
W. Quail Crossing Ct.
1218 W Quail
Crossing Ct.
1224 W Quail
Crossing Ct.
926 W
Mountain
920 W
Mountain
1934
Remington
Cir.
N
M
o
u
n
t
a
i
n
C
t
.
Site Plan and Sampling Location Map
Project Number Figure
2
Legend:
Monitoring Well Location
Irrigation Well
Soil Vapor Monitoring Point
Boring Location
Soil Sample Location
Property Line
Pipeline
Pipeline Easement Boundary
Pipeline Excavation Extent
(July 5-7, 2012 and June 14, 2012)
Lot Owned by Quail Crossing
Homeowner's Association
Deactivated Irrigation Well or Not Currently
in Use/Targeted for Deactivation
Scale in Feet
0 100 200
1641-04
Aerial photograph provided by Google
Maps.com (dated February 25, 2012).
P
MW-1
HOA
VP-1
B-1
B-1
STORMWATER
POND
B-1
N
M
o
u
n
t
a
i
n
C
t
.
MW-4
MW-1
MW-5
MW-3
MW-2
MW-7
MW-6
MW-9
MW-10
MW-8
HOA-1HOA-1
MW-11
MW-14
MW-16
MW-13
MW-12
MW-15
VP-1
VP-2
VP-3
South
Wall
Floor
North
Wall
March 2014
Soil Vapor Extraction Evaluation and Proposed Soil Investigation Report
NuStar Pipeline Operating Partnership L.P.
Andover, Kansas
Floor

\A1;25'P
P
P
P
P
P
P
P
P
P
P
P
P
P
P
P
P
P
P
P
Soil Vapor Extraction Test Well Locations
Project Number Figure
3
Scale in Feet
0 20 40
Apex Companies, LLC3015 SW First AvenuePortland, Oregon 97201
MW-3
MW-9
Legend:
Monitoring Well Location
Irrigation Well
Soil Vapor Extraction Pilot Test Well
Property Line
Pipeline
Pipeline Easement Boundary
Pipeline Excavation Extent (June 14, 2012)
Lot Owned by Quail CrossingHomeowner's Association
P
MW-1
HOA
W Mountain
1023 WMountain
HOA
1641-04
March 2014
Soil Vapor Extraction Evaluation and Proposed Soil Investigation ReportNuStar Pipeline Operating Partnership L.P.
Andover, Kansas
SVE-3
SVE-2
SVE-1
SVE-1
SVE-4

P
P
P
P
P
P
P
P
P
P
P
P
P
P
P
P
P
P
P
P
P
P
P
P
P
P
P
P
SVE-3
SVE Well
SVE Well
SVE Well
SVE Well
Project Number Figure
Legend:
Soil Vapor Extraction (SVE) Well Location
SVE Well Location (December 2013)
SVE Piping
Anticipated 20' Radius of Vacuum Influence
Monitoring Well Location
Irrigation Well
Boring Location
Soil Sample Location
Property Line
Pipeline
Pipeline Easement Boundary
Pipeline Excavation Extent
(July 5-7, 2012 and June 14, 2012)
Lot Owned by Quail Crossing
Homeowner's Association
Sample Depth (Feet)
Benzene Concentration in mg/kg
(Highlight Indicates a Concentration Above
KDHE Tier 2 RBSV for Soil to
Groundwater Pathway; 0.168 mg/kg)
Not Sampled
Scale in Feet
0 30 60
P
MW-3
HOA
Conceptual SVE System
1641-04
4
N C
olt C
t.
2006 N
Colt Ct.
2019 N
Ruger Cir.
1023 W
Mountain
2020 N
Ruger Cir.
HOA
N
R
u
g
e
r
C
i
r
.
W
M
o
u
n
ta
in
SVE-3
Equipment and
Treatment Building
Excavation
(July 5-7, 2012)
Aerial photograph provided by Google
Maps.com (dated February 25, 2012).
SVE Well
MW-9
NS
B-1
March 2014
Soil Vapor Extraction Evaluation and Proposed Soil Investigation Report
NuStar Pipeline Operating Partnership L.P.
Andover, Kansas
Excavation
(June 14, 2012)
NS
Floor
BEN 2.0
13'
B-1
BEN
21'
<0.0085
9'
2.3
MW-3
BEN
19.75'
<0.0068
16'
0.12
MW-1
BEN <0.0072
13.5'
MW-2
BEN <0.0072
12.5'
MW-2
BEN <0.007
14.75'
MW-5
BEN <0.0074
17.5'
MW-4
BEN <0.064
10.5'
MW-11
BEN <0.005
40'
South
Wall
6'
North
Wall
6'
Floor
BEN
13'
BEN
BEN 0.02
2.0
1.0
Floor

Apex Companies, LLC3015 SW First AvenuePortland, Oregon 97201
VAPOR EXTRACTION WELLS
(TYPICAL)
MOISTURE
KNOCKOUT
TANK
2"Ø
2"Ø
MAIN
MANIFOLD PIPE
VACUUM
BLOWER
AIR FLOW
DISCHARGE STACK20' X 15' BUILDING
CARBON TREATMENT
Project Number
SVE System Schematic
1641-04
5Figure
March 2014
Legend:
Flow Control Valve
Sample Port
Pressure Gauge
Flowmeter
Soil Vapor Extraction Evaluation and Proposed Soil Investigation ReportNuStar Pipeline Operating Partnership L.P.
Andover, Kansas

Project Number 1641-04 Figure
March 2014
Soil Vapor Extraction Evaluation and Proposed Soil Investigation ReportNuStar Pipeline Operating Partnership L.P.
Andover, Kansas
Apex Companies, LLC3015 SW First AvenuePortland, Oregon 97201
Proposed SVE Enclosure
6

P
P
P
P
P
P
P
P
P
P
P
P
P
P
P
P
P
P
P
P
P
P
P
P
P
P
P
P
Project Number Figure
Legend:
Proposed Soil Boring Location
Monitoring Well Location
Irrigation Well
Boring Location
Soil Sample Location
Property Line
Pipeline
Pipeline Easement Boundary
Pipeline Excavation Extent
(July 5-7, 2012 and June 14, 2012)
Lot Owned by Quail Crossing
Homeowner's Association
Sample Depth (Feet)
Benzene Concentration in mg/kg
(Highlight Indicates a Concentration Above
KDHE Tier 2 RBSV for Soil to
Groundwater Pathway; 0.168 mg/kg)
Not Sampled
P
MW-3
HOA
Proposed Soil Boring Locations
1641-04
7
2019 N
Ruger Cir.
1023 W
Mountain
2020 N
Ruger Cir.
HOA
W
M
o
u
n
ta
in
Pipeline Release
Location
March 2014
Aerial photograph provided by Google
Maps.com (dated February 25, 2012).
MW-9
B-1
B-1
BEN
21'
<0.0085
9'
South
Wall
6'
North
Wall
6'
Floor
BEN
13'
BEN
BEN 0.02
2.3
2.0
1.0
NS
Floor
BEN 2.0
13'
MW-2
BEN <0.0072
12.5'
MW-2
BEN <0.007
14.75'
N C
olt C
t.
2006 N
Colt Ct.
N
R
u
g
e
r
C
i
r
.
MW-3
BEN
19.75'
<0.0068
16'
0.12
MW-1
BEN <0.0072
13.5'
MW-5
BEN <0.0074
17.5'
MW-4
BEN <0.064
10.5'
MW-11
BEN <0.005
40'
Underground Utility
Corridor (Approximate)
NS
Soil Vapor Extraction Evaluation and Proposed Soil Investigation Report
NuStar Pipeline Operating Partnership L.P.
Andover, Kansas
Excavation
(July 5-7, 2012)
Excavation
(June 14, 2012)
Floor
Scale in Feet
0 30 60

Appendix A
Field Notes and SVE Pilot Test Flow Rate Data

file:///S|/...Field%20Notes%20and%20SVE%20Pilot%20Test%20Flow%20Data/A%20-%20SVE%20test%20result%20data/AND1_1F.TXT[3/28/2014 2:29:49 PM]
152.40 -731.52 -0.320537E-02 0.306564E-04 -0.320551E-02 182.88 -731.52 -0.258998E-02 0.109937E-03 -0.259231E-02 213.36 -731.52 -0.214933E-02 0.159971E-03 -0.215527E-02 243.84 -731.52 -0.181863E-02 0.188278E-03 -0.182835E-02 274.32 -731.52 -0.156172E-02 0.201442E-03 -0.157466E-02 304.80 -731.52 -0.135677E-02 0.204515E-03 -0.137210E-02 335.28 -731.52 -0.118982E-02 0.201129E-03 -0.120670E-02 365.76 -731.52 -0.105150E-02 0.193794E-03 -0.106921E-02 396.24 -731.52 -0.935280E-03 0.184217E-03 -0.953249E-03 426.72 -731.52 -0.836489E-03 0.173522E-03 -0.854297E-03 457.20 -731.52 -0.751672E-03 0.162443E-03 -0.769024E-03 487.68 -731.52 -0.678228E-03 0.151441E-03 -0.694930E-03 518.16 -731.52 -0.614158E-03 0.140800E-03 -0.630091E-03 548.64 -731.52 -0.557903E-03 0.130678E-03 -0.573003E-03 579.12 -731.52 -0.508226E-03 0.121170E-03 -0.522471E-03 609.60 -731.52 -0.464135E-03 0.112301E-03 -0.477528E-03 640.08 -731.52 -0.424824E-03 0.104071E-03 -0.437386E-03 670.56 -731.52 -0.389632E-03 0.964624E-04 -0.401395E-03 701.04 -731.52 -0.358013E-03 0.894436E-04 -0.369017E-03 731.52 -731.52 -0.329509E-03 0.829777E-04 -0.339796E-03 762.00 -731.52 -0.303736E-03 0.770253E-04 -0.313351E-03 792.48 -731.52 -0.280370E-03 0.715466E-04 -0.289355E-03 822.96 -731.52 -0.259132E-03 0.665032E-04 -0.267530E-03 853.44 -731.52 -0.239785E-03 0.618583E-04 -0.247635E-03 883.92 -731.52 -0.222123E-03 0.575780E-04 -0.229464E-03
VOLUMETRIC FLOW SIGN CONVENTION : ---------- ---- ---- ----------
NEGATIVE HORIZONTAL FLOW => FLOW TOWARDS WELL
POSITIVE HORIZONTAL FLOW => FLOW AWAY FROM WELL
NEGATIVE VERTICAL FLOW => FLOW UPWARDS
POSITIVE VERTICAL FLOW => FLOW DOWNWARDS

file:///S|/...Field%20Notes%20and%20SVE%20Pilot%20Test%20Flow%20Data/A%20-%20SVE%20test%20result%20data/AND1_2F.TXT[3/28/2014 2:29:47 PM]
152.40 -731.52 -0.643413E-02 0.615366E-04 -0.643442E-02 182.88 -731.52 -0.519663E-02 0.220581E-03 -0.520131E-02 213.36 -731.52 -0.431097E-02 0.320858E-03 -0.432289E-02 243.84 -731.52 -0.364661E-02 0.377523E-03 -0.366610E-02 274.32 -731.52 -0.313068E-02 0.403817E-03 -0.315662E-02 304.80 -731.52 -0.271925E-02 0.409889E-03 -0.274997E-02 335.28 -731.52 -0.238419E-02 0.403028E-03 -0.241802E-02 365.76 -731.52 -0.210666E-02 0.388266E-03 -0.214215E-02 396.24 -731.52 -0.187355E-02 0.369022E-03 -0.190955E-02 426.72 -731.52 -0.167543E-02 0.347554E-03 -0.171110E-02 457.20 -731.52 -0.150537E-02 0.325325E-03 -0.154013E-02 487.68 -731.52 -0.135814E-02 0.303260E-03 -0.139159E-02 518.16 -731.52 -0.122973E-02 0.281924E-03 -0.126163E-02 548.64 -731.52 -0.111699E-02 0.261634E-03 -0.114722E-02 579.12 -731.52 -0.101745E-02 0.242579E-03 -0.104597E-02 609.60 -731.52 -0.929116E-03 0.224806E-03 -0.955926E-03 640.08 -731.52 -0.850366E-03 0.208318E-03 -0.875511E-03 670.56 -731.52 -0.779876E-03 0.193076E-03 -0.803421E-03 701.04 -731.52 -0.716548E-03 0.179018E-03 -0.738572E-03 731.52 -731.52 -0.659466E-03 0.166068E-03 -0.680054E-03 762.00 -731.52 -0.607857E-03 0.154148E-03 -0.627098E-03 792.48 -731.52 -0.561071E-03 0.143178E-03 -0.579051E-03 822.96 -731.52 -0.518549E-03 0.133080E-03 -0.535354E-03 853.44 -731.52 -0.479816E-03 0.123780E-03 -0.495525E-03 883.92 -731.52 -0.444458E-03 0.115211E-03 -0.459148E-03
VOLUMETRIC FLOW SIGN CONVENTION : ---------- ---- ---- ----------
NEGATIVE HORIZONTAL FLOW => FLOW TOWARDS WELL
POSITIVE HORIZONTAL FLOW => FLOW AWAY FROM WELL
NEGATIVE VERTICAL FLOW => FLOW UPWARDS
POSITIVE VERTICAL FLOW => FLOW DOWNWARDS

file:///S|/...Field%20Notes%20and%20SVE%20Pilot%20Test%20Flow%20Data/A%20-%20SVE%20test%20result%20data/AND1_3F.TXT[3/28/2014 2:29:45 PM]
152.40 -731.52 -0.968668E-02 0.926443E-04 -0.968712E-02 182.88 -731.52 -0.782018E-02 0.331944E-03 -0.782723E-02 213.36 -731.52 -0.648508E-02 0.482674E-03 -0.650302E-02 243.84 -731.52 -0.548404E-02 0.567747E-03 -0.551335E-02 274.32 -731.52 -0.470696E-02 0.607136E-03 -0.474596E-02 304.80 -731.52 -0.408748E-02 0.616131E-03 -0.413366E-02 335.28 -731.52 -0.358315E-02 0.605703E-03 -0.363399E-02 365.76 -731.52 -0.316553E-02 0.583419E-03 -0.321885E-02 396.24 -731.52 -0.281483E-02 0.554421E-03 -0.286891E-02 426.72 -731.52 -0.251685E-02 0.522099E-03 -0.257043E-02 457.20 -731.52 -0.226112E-02 0.488648E-03 -0.231331E-02 487.68 -731.52 -0.203976E-02 0.455457E-03 -0.208999E-02 518.16 -731.52 -0.184671E-02 0.423373E-03 -0.189462E-02 548.64 -731.52 -0.167727E-02 0.392869E-03 -0.172267E-02 579.12 -731.52 -0.152768E-02 0.364226E-03 -0.157050E-02 609.60 -731.52 -0.139495E-02 0.337517E-03 -0.143520E-02 640.08 -731.52 -0.127663E-02 0.312742E-03 -0.131438E-02 670.56 -731.52 -0.117074E-02 0.289842E-03 -0.120608E-02 701.04 -731.52 -0.107561E-02 0.268723E-03 -0.110867E-02 731.52 -731.52 -0.989872E-03 0.249272E-03 -0.102078E-02 762.00 -731.52 -0.912364E-03 0.231369E-03 -0.941244E-03 792.48 -731.52 -0.842103E-03 0.214893E-03 -0.869090E-03 822.96 -731.52 -0.778252E-03 0.199729E-03 -0.803473E-03 853.44 -731.52 -0.720093E-03 0.185766E-03 -0.743669E-03 883.92 -731.52 -0.667007E-03 0.172900E-03 -0.689052E-03
VOLUMETRIC FLOW SIGN CONVENTION : ---------- ---- ---- ----------
NEGATIVE HORIZONTAL FLOW => FLOW TOWARDS WELL
POSITIVE HORIZONTAL FLOW => FLOW AWAY FROM WELL
NEGATIVE VERTICAL FLOW => FLOW UPWARDS
POSITIVE VERTICAL FLOW => FLOW DOWNWARDS

file:///S|/...Field%20Notes%20and%20SVE%20Pilot%20Test%20Flow%20Data/A%20-%20SVE%20test%20result%20data/AND1_4F.TXT[3/28/2014 2:29:44 PM]
152.40 -731.52 -0.129634E-01 0.123983E-03 -0.129640E-01 182.88 -731.52 -0.104609E-01 0.444034E-03 -0.104703E-01 213.36 -731.52 -0.867183E-02 0.645430E-03 -0.869582E-02 243.84 -731.52 -0.733103E-02 0.758961E-03 -0.737021E-02 274.32 -731.52 -0.629063E-02 0.811409E-03 -0.634275E-02 304.80 -731.52 -0.546153E-02 0.823248E-03 -0.552323E-02 335.28 -731.52 -0.478675E-02 0.809160E-03 -0.485465E-02 365.76 -731.52 -0.422813E-02 0.779259E-03 -0.429934E-02 396.24 -731.52 -0.375915E-02 0.740418E-03 -0.383137E-02 426.72 -731.52 -0.336075E-02 0.697159E-03 -0.343230E-02 457.20 -731.52 -0.301891E-02 0.652415E-03 -0.308861E-02 487.68 -731.52 -0.272307E-02 0.608035E-03 -0.279013E-02 518.16 -731.52 -0.246513E-02 0.565149E-03 -0.252908E-02 548.64 -731.52 -0.223875E-02 0.524384E-03 -0.229934E-02 579.12 -731.52 -0.203892E-02 0.486114E-03 -0.209607E-02 609.60 -731.52 -0.186163E-02 0.450435E-03 -0.191535E-02 640.08 -731.52 -0.170362E-02 0.417343E-03 -0.175399E-02 670.56 -731.52 -0.156221E-02 0.386761E-03 -0.160937E-02 701.04 -731.52 -0.143520E-02 0.358560E-03 -0.147931E-02 731.52 -731.52 -0.132073E-02 0.332589E-03 -0.136196E-02 762.00 -731.52 -0.121726E-02 0.308688E-03 -0.125579E-02 792.48 -731.52 -0.112347E-02 0.286694E-03 -0.115947E-02 822.96 -731.52 -0.103824E-02 0.266453E-03 -0.107189E-02 853.44 -731.52 -0.960619E-03 0.247815E-03 -0.992069E-03 883.92 -731.52 -0.889770E-03 0.230644E-03 -0.919178E-03
VOLUMETRIC FLOW SIGN CONVENTION : ---------- ---- ---- ----------
NEGATIVE HORIZONTAL FLOW => FLOW TOWARDS WELL
POSITIVE HORIZONTAL FLOW => FLOW AWAY FROM WELL
NEGATIVE VERTICAL FLOW => FLOW UPWARDS
POSITIVE VERTICAL FLOW => FLOW DOWNWARDS

file:///S|/...Field%20Notes%20and%20SVE%20Pilot%20Test%20Flow%20Data/A%20-%20SVE%20test%20result%20data/AND1_5F.TXT[3/28/2014 2:29:42 PM]
152.40 -731.52 -0.162647E-01 0.155557E-03 -0.162655E-01 182.88 -731.52 -0.131190E-01 0.556864E-03 -0.131308E-01 213.36 -731.52 -0.108714E-01 0.809139E-03 -0.109015E-01 243.84 -731.52 -0.918770E-02 0.951177E-03 -0.923681E-02 274.32 -731.52 -0.788178E-02 0.101665E-02 -0.794707E-02 304.80 -731.52 -0.684144E-02 0.103125E-02 -0.691872E-02 335.28 -731.52 -0.599501E-02 0.101341E-02 -0.608006E-02 365.76 -731.52 -0.529449E-02 0.975793E-03 -0.538366E-02 396.24 -731.52 -0.470652E-02 0.927016E-03 -0.479695E-02 426.72 -731.52 -0.420716E-02 0.872739E-03 -0.429673E-02 457.20 -731.52 -0.377878E-02 0.816628E-03 -0.386601E-02 487.68 -731.52 -0.340811E-02 0.760997E-03 -0.349204E-02 518.16 -731.52 -0.308497E-02 0.707253E-03 -0.316501E-02 548.64 -731.52 -0.280142E-02 0.656181E-03 -0.287725E-02 579.12 -731.52 -0.255117E-02 0.608244E-03 -0.262268E-02 609.60 -731.52 -0.232917E-02 0.563559E-03 -0.239638E-02 640.08 -731.52 -0.213133E-02 0.522122E-03 -0.219435E-02 670.56 -731.52 -0.195430E-02 0.483833E-03 -0.201331E-02 701.04 -731.52 -0.179531E-02 0.448529E-03 -0.185049E-02 731.52 -731.52 -0.165204E-02 0.416020E-03 -0.170361E-02 762.00 -731.52 -0.152254E-02 0.386105E-03 -0.157073E-02 792.48 -731.52 -0.140517E-02 0.358580E-03 -0.145020E-02 822.96 -731.52 -0.129852E-02 0.333250E-03 -0.134060E-02 853.44 -731.52 -0.120139E-02 0.309928E-03 -0.124072E-02 883.92 -731.52 -0.111275E-02 0.288444E-03 -0.114952E-02
VOLUMETRIC FLOW SIGN CONVENTION : ---------- ---- ---- ----------
NEGATIVE HORIZONTAL FLOW => FLOW TOWARDS WELL
POSITIVE HORIZONTAL FLOW => FLOW AWAY FROM WELL
NEGATIVE VERTICAL FLOW => FLOW UPWARDS
POSITIVE VERTICAL FLOW => FLOW DOWNWARDS

file:///S|/...ield%20Notes%20and%20SVE%20Pilot%20Test%20Flow%20Data/A%20-%20SVE%20test%20result%20data/ANDOVER_K.txt[3/28/2014 2:29:39 PM]
PROJECT : NUSTAR ANDOVER =======
SCOPE : RESULTS OF FULL-SCALE PERMEABILITY TESTS TEST DATE : 12/10/2013 WELL NUMBER : SVE-2
1. MODEL INPUT SUMMARY ----- ----- ------- MODEL DOMAIN : THICKNESS = 914.400 cm : ESTIMATED PERMEABILITY = 0.100E-07 cm^2 : ESTIMATED ANISOTROPY RATIO = 1.00 WELL DEPTH (HANTUSH d) : TOP OF SCREEN = 457.20 cm WELL DEPTH (HANTUSH l) : BOTTOM OF SCREEN = 863.19 cm WELL RADIUS : EFFECTIVE RADIUS = 15.24 cm AIR FLOW DIRECTION : VAPOR EXTRACTION
2. MODEL OUTPUT SUMMARY ----- ------ -------
******************************************************************************
AIR SOIL ATMOS. SYSTEM FLOW SCALE PREVAIL. ACTUAL TEMP TEMP PRESS. PRESS. METER READING FLOW FLOW degC degC atm atm TYPE -- cm^3/sec cm^3/sec
******************************************************************************
0.00 15.00 1.000 0.727 NONE -- -- 3586.800 0.00 15.00 1.000 0.765 NONE -- -- 3303.630
******************************************************************************
******************************************************************************
MASS HORIZON. VERTICAL LEAKAGE ANISOTPY MEAN OF STD DEV FLOW PERM. PERM. RATIO(k/b) RATIO ERROR IN OF ERROR g/sec cm^2 cm^2 cm^2/cm (kr/kz) PRESS. IN PRESS.
******************************************************************************
3.261 0.990E-07 0.990E-07 0.000E+00 1.000 -0.752E-03 0.179E-02 3.161 0.277E-06 0.277E-06 0.000E+00 1.000 -0.783E-03 0.185E-02
******************************************************************************

file:///S|/...ld%20Notes%20and%20SVE%20Pilot%20Test%20Flow%20Data/A%20-%20SVE%20test%20result%20data/ANDOVER4_K.txt[3/28/2014 2:29:35 PM]
PROJECT : NUSTAR ANDOVER =======
SCOPE : RESULTS OF FULL-SCALE PERMEABILITY TESTS TEST DATE : 12/10/2013 WELL NUMBER : SVE-4
1. MODEL INPUT SUMMARY ----- ----- ------- MODEL DOMAIN : THICKNESS = 914.400 cm : ESTIMATED PERMEABILITY = 0.900E-07 cm^2 : ESTIMATED ANISOTROPY RATIO = 1.00 WELL DEPTH (HANTUSH d) : TOP OF SCREEN = 609.60 cm WELL DEPTH (HANTUSH l) : BOTTOM OF SCREEN = 882.70 cm WELL RADIUS : EFFECTIVE RADIUS = 15.52 cm AIR FLOW DIRECTION : VAPOR EXTRACTION
2. MODEL OUTPUT SUMMARY ----- ------ -------
******************************************************************************
AIR SOIL ATMOS. SYSTEM FLOW SCALE PREVAIL. ACTUAL TEMP TEMP PRESS. PRESS. METER READING FLOW FLOW degC degC atm atm TYPE -- cm^3/sec cm^3/sec
******************************************************************************
0.00 15.00 1.000 0.914 NONE -- -- 3303.630 0.00 15.00 1.000 0.864 NONE -- -- 5191.420 0.00 15.00 1.000 0.813 NONE -- -- 7551.160
******************************************************************************
******************************************************************************
MASS HORIZON. VERTICAL LEAKAGE ANISOTPY MEAN OF STD DEV FLOW PERM. PERM. RATIO(k/b) RATIO ERROR IN OF ERROR g/sec cm^2 cm^2 cm^2/cm (kr/kz) PRESS. IN PRESS.
******************************************************************************
3.776 0.490E-07 0.490E-07 0.000E+00 1.000 0.231E-03 0.669E-02 5.609 0.308E-07 0.308E-07 0.000E+00 1.000 0.152E-03 0.116E-01 7.677 0.264E-07 0.264E-07 0.000E+00 1.000 -0.751E-05 0.156E-01
******************************************************************************


Appendix B
Analytical Laboratory Report – SVE Effluent Data

Appendix B — Laboratory Analytical Reports and Quality Assurance/Quality Control Results Summary
SVE Evaluation and Proposed Soil Investigation Report Page B-1 Andover Release Site, Kansas March 26, 2014 1641-04
1.0 Introduction
This appendix documents the results of a quality assurance (QA) review of the analytical data for two air
samples that were collected during the SVE Pilot Test performed December 9 through 11, 2013 at the Quail
Crossing neighborhood (the Neighborhood) in Andover, Kansas (Site). The air samples were analyzed by
ALS of Simi Valley, California.
The QA review outlines the applicable quality control criteria utilized during the data review process, as well
as any deviations from those criteria. Examination and validation of the laboratory summary reports
includes:
Analytical methods;
Reporting limits;
Detection limits and estimated concentrations;
Sample holding times;
Custody records and sample receipt;
Spikes, blanks, and surrogates; and
Duplicates.
The QA review did not include a review of calibration or raw data. Section 2.0 lists the analytical methods
used in sample analysis. Section 3.0 defines the QA terms used in this report. Section 4.0 provides the QA
results for each sampling event.
2.0 Analytical Methods
Chemical analyses performed on air samples consisted of the following:
1,2,4-trimethylbenzene, 1,2-dichloroethane, 1,3,5-trimethylbenzene, BTEX, naphthalene,
n-butylbenzene, and n-propylbenzene by EPA Method TO-15.
3.0 Quality Assurance Objectives and Review Procedures
The general QA objectives for this project were to develop and implement procedures for obtaining,
evaluating, and confirming the usability of environmental data of a specified quality. To collect such
information, analytical data must have an appropriate degree of accuracy and reproducibility, samples

Appendix B — Laboratory Analytical Reports and Quality Assurance/Quality Control Results Summary
SVE Evaluation and Proposed Soil Investigation Report Page B-2 Andover Release Site, Kansas March 26, 2014 1641-04
collected must be representative of actual field conditions, and samples must be collected and analyzed
using unbroken chain-of-custody (COC) procedures.
Reporting limits and analytical results were compared to action levels for each parameter in each media of
concern. Precision, accuracy, representativeness, completeness, and comparability parameters used to
indicate data quality are defined below.
Reporting Limits. Method reporting limits (MRLs) are set by the laboratory and are based on
instrumentation abilities and sample matrix. In some cases, the MRLs are raised due to high concentrations
of analytes in the samples or matrix interferences.
Detection Limits and Estimated Concentrations. The method detection limit (MDL) is the lowest quantity
of a substance that can be distinguished from the absence of that substance within a stated confidence limit.
The MDL is estimated from the mean of the blank, the standard deviation of the blank and some confidence
factor.
Holding Times. Holding times are the length of time a sample can be stored after collection and prior to
analysis without significantly affecting the analytical results.
Custody Records and Sample Receipt. COC refers to the document or paper trail showing the collection,
custody, control, transfer, analysis, and disposition of physical materials. The sample receipt identifies the
condition of samples upon arrival at the analytical laboratory.
Method Blanks. A method, or laboratory, blank is a sample prepared in the laboratory along with the field
samples and analyzed for the same parameters at the same time. It is used to assess for laboratory
introduced contamination.
Laboratory Control Sample. A laboratory control sample (LCS) is analyzed by the laboratory to assess
the accuracy of the analytical equipment. The sample is prepared from an analyte-free matrix that is then
spiked with known levels of the constituents of interest (i.e., a standard). The concentrations are measured
and the results compared to the known spiked levels. This comparison is expressed as percent recovery.
Laboratory Control Sample Duplicate. A laboratory control sample duplicate [LCSD]) is prepared and
analyzed along with the LCS. The LCS and LCSD data are compared to assess the precision of the
analytical method (i.e., the relative percent difference [RPD]).
Matrix Spike Analyses. Matrix spike (MS) analyses are performed on samples submitted to the laboratory
that are of the same matrix as the field sample. The MS sample is spiked with known levels of the

Appendix B — Laboratory Analytical Reports and Quality Assurance/Quality Control Results Summary
SVE Evaluation and Proposed Soil Investigation Report Page B-3 Andover Release Site, Kansas March 26, 2014 1641-04
constituents of interest and analyzed to assess the potential for matrix interference with recovery or
detection of the constituents of interest and the accuracy of the determination. The spiked sample results
are compared to the expected result (i.e., sample concentration plus spike amount) and reported as percent
recovery.
Lab Duplicate. A laboratory duplicate is a second analysis of a QA/QC sample, which serves as an internal
check on laboratory quality as well as potential variability of the sample matrix. The laboratory duplicate is
analyzed and compared to the primary sample results to assess the precision of the analytical method. This
comparison can be expressed by the RPD between the primary and duplicate samples.
Surrogate Recovery. Surrogates are organic compounds that are similar in chemical composition to the
analytes of interest and spiked into environmental and batch QC samples prior to sample preparation and
analysis. Surrogate recoveries for environmental samples are used to evaluate matrix interference on a
sample-specific basis.
Field Duplicate. A field duplicate is a second field sample collected from a sampling location (e.g.., a well
or soil core). Field duplicate samples serve as a check on laboratory quality as well as potential variability of
the sample matrix. The field duplicate is analyzed and compared to the primary sample to assess the
precision of the analytical method. This comparison can be expressed by the RPD between the original and
duplicate samples.
Trip Blanks. A trip blank is a sample prepared in the laboratory that is shipped along with the sample
bottles to the field, kept with soil and groundwater samples during collection, and shipped back to the
laboratory with the field samples. The trip blank is analyzed for constituents of interest, along with the
primary samples, to assess if detected contaminants may have been the result of contamination of the
samples during transport or storage.
Equipment Blank. An equipment blank is a sample collected in the field along with the primary samples
and analyzed for the same parameters. Equipment blanks are collected by pouring deionized water over or
through decontaminated equipment used to collect the samples, into laboratory supplied containers. The
equipment blank is used to assess if field samples may have been affected by inadequate decontamination
of field equipment.

Appendix B — Laboratory Analytical Reports and Quality Assurance/Quality Control Results Summary
SVE Evaluation and Proposed Soil Investigation Report Page B-4 Andover Release Site, Kansas March 26, 2014 1641-04
4.0 QA/QC Review Results
The data reviewed includes two air samples collected on December 10, 2013. Samples were analyzed for
1,2,4-trimethylbenzene, 1,2-dichloroethane, 1,3,5-trimethylbenzene, BTEX, naphthalene, n-butylbenzene,
and n-propylbenzene by EPA Method TO-15.
Reporting Limits. MRLs were not elevated for samples. No data are flagged.
Detection Limits and Estimated Concentrations. Due to the high concentrations of benzene and toluene
in the samples, the detection limits were elevated for other VOCs; however, the detection limits were
sufficient for the intended use.
Holding Times. The samples were analyzed within applicable holding times.
Custody Records and Sample Receipt. The samples were received at ambient temperature and
consistent with the accompanying COC.
Method Blanks. No compounds were detected in the method blanks. No data are flagged.
Laboratory Control Sample. Percent recoveries of the LCS were within control limits.
Laboratory Control Sample Duplicate. Percent recoveries of the LCSD were within control limits.
LCS/LCSD RPDs were within control limits for all tested compounds.
Lab Duplicate. No lab duplicate was analyzed.
Field Duplicate. Per KDHE guidance, no field duplicate was analyzed.
Trip Blank. No trip blank was analyzed.
Equipment Blank. No reusable equipment was utilized during this sampling event; therefore, an equipment
blank was not collected.
Conclusion. In conclusion, the overall QA objectives have been met, and the data are of adequate quality
for use in this project.

2655 Park Center Dr., Suite A Simi Valley, CA 93065 T: +1 805 526 7161 F: +1 805 526 7270 www.alsglobal.com
LABORATORY REPORT December 27, 2013 Samuel Jackson Apex Companies, LLC 3015 SW First Avenue Portland, OR 97201-4707 RE: ANDOVER / COLT COURT / 320001641-04.002 Dear Samuel: Enclosed are the results of the samples submitted to our laboratory on December 11, 2013. For your reference, these analyses have been assigned our service request number P1305477. All analyses were performed according to our laboratory’s NELAP and DoD-ELAP-approved quality assurance program. The test results meet requirements of the current NELAP and DoD-ELAP standards, where applicable, and except as noted in the laboratory case narrative provided. For a specific list of NELAP and DoD-ELAP-accredited analytes, refer to the certifications section at www.alsglobal.com. Results are intended to be considered in their entirety and apply only to the samples analyzed and reported herein. If you have any questions, please call me at (805) 526-7161. Respectfully submitted, ALS | Environmental For Samantha Henningsen Project Manager
R I G H T S O L U T I O N S | R I G H T P A R T N E R
1 of 13
2655 Park Center Dr., Suite A Simi Valley, CA 93065 T: +1 805 526 7161 F: +1 805 526 7270 www.alsglobal.com
Client: Apex Companies, LLC Service Request No: P1305477 Project: ANDOVER / COLT COURT / 320001641-04.002 _______________________________________________________________________________
CASE NARRATIVE
The samples were received intact under chain of custody on December 11, 2013 and were stored in accordance with the analytical method requirements. Please refer to the sample acceptance check form for additional information. The results reported herein are applicable only to the condition of the samples at the time of sample receipt. Volatile Organic Compound Analysis The samples were analyzed for selected volatile organic compounds in accordance with EPA Method TO-15 from the Compendium of Methods for the Determination of Toxic Organic Compounds in Ambient Air, Second Edition (EPA/625/R-96/010b), January, 1999. This procedure is described in laboratory SOP VOA-TO15. The analytical system was comprised of a gas chromatograph / mass spectrometer (GC/MS) interfaced to a whole-air preconcentrator. This method is not included on the laboratory’s AIHA-LAP scope of accreditation. Any analytes flagged with an X are not included on the laboratory’s NELAP or DoD-ELAP scope of accreditation. The Summa canisters were cleaned, prior to sampling, down to the method reporting limit (MRL) reported for this project. Please note, projects which require reporting below the MRL could have results between the MRL and method detection limit (MDL) that are biased high. ______________________________________________________________________________________ The results of analyses are given in the attached laboratory report. All results are intended to be considered in their entirety, and ALS Environmental (ALS) is not responsible for utilization of less than the complete report. Use of ALS Environmental (ALS)’s Name. Client shall not use ALS’s name or trademark in any marketing or reporting materials, press releases or in any other manner (“Materials”) whatsoever and shall not attribute to ALS any test result, tolerance or specification derived from ALS’s data (“Attribution”) without ALS’s prior written consent, which may be withheld by ALS for any reason in its sole discretion. To request ALS’s consent, Client shall provide copies of the proposed Materials or Attribution and describe in writing Client’s proposed use of such Materials or Attribution. If ALS has not provided written approval of the Materials or Attribution within ten (10) days of receipt from Client, Client’s request to use ALS’s name or trademark in any Materials or Attribution shall be deemed denied. ALS may, in its discretion, reasonably charge Client for its time in reviewing Materials or Attribution requests. Client acknowledges and agrees that the unauthorized use of ALS’s name or trademark may cause ALS to incur irreparable harm for which the recovery of money damages will be inadequate. Accordingly, Client acknowledges and agrees that a violation shall justify preliminary injunctive relief. For questions contact the laboratory.
R I G H T S O L U T I O N S | R I G H T P A R T N E R
2 of 13

2655 Park Center Dr., Suite A Simi Valley, CA 93065 T: +1 805 526 7161 F: +1 805 526 7270 www.alsglobal.com
ALS Environmental – Simi Valley
Certifications, Accreditations, and Registrations
Agency Web Site Number
AIHA http://www.aihaaccreditedlabs.org 101661
Arizona DHS http://www.azdhs.gov/lab/license/env.htm AZ0694
DoD ELAP http://www.pjlabs.com/search-accredited-labs L11-203
Florida DOH (NELAP)
http://www.doh.state.fl.us/lab/EnvLabCert/WaterCert.htm E871020
Maine DHHS http://www.maine.gov/dhhs/mecdc/environmental-health/water/dwp-services/labcert/labcert.htm
2012039
Minnesota DOH (NELAP)
http://www.health.state.mn.us/accreditation 581572
New Jersey DEP (NELAP)
http://www.nj.gov/dep/oqa/ CA009
New York DOH (NELAP)
http://www.wadsworth.org/labcert/elap/elap.html 11221
Oregon PHD (NELAP)
http://public.health.oregon.gov/LaboratoryServices/EnvironmentalLaboratoryAccreditation/Pages/index.aspx
CA200007
Pennsylvania DEP http://www.depweb.state.pa.us/labs 68-03307
(Registration) Texas CEQ (NELAP)
http://www.tceq.texas.gov/field/qa/env_lab_accreditation.html T104704413-
13-4 Utah DOH (NELAP)
http://www.health.utah.gov/lab/labimp/certification/index.html CA01627201
3-3
Washington DOE http://www.ecy.wa.gov/programs/eap/labs/lab-accreditation.html C946
Analyses were performed according to our laboratory’s NELAP and DoD-ELAP approved quality assurance program. A complete listing of specific NELAP and DoD-ELAP certified analytes can be found in the certifications section at www.alsglobal.com, or at the accreditation body’s website. Each of the certifications listed above have an explicit Scope of Accreditation that applies to specific matrices/methods/analytes; therefore, please contact the laboratory for information corresponding to a particular certification.
R I G H T S O L U T I O N S | R I G H T P A R T N E R
3 of 13

PEF_Detail.xlsP1305477_Detail Summary_1312271602_RG.xls - DETAIL SUMMARY
Client: Apex Companies, LLC Service Request: P1305477Project ID: ANDOVER / COLT COURT / 320001641-04.002
Date Received: 12/11/2013Time Received: 09:45
Client Sample ID Lab Code MatrixDate
CollectedTime
CollectedContainer
IDPi1
(psig)Pf1
(psig)
SVE 2 Initial P1305477-001 Air 12/10/2013 10:29 1SC00878 13.22 13.22 X
SVE 2 Completion P1305477-002 Air 12/10/2013 12:54 1SC00861 14.22 14.22 X
ALS ENVIRONMENTAL
DETAIL SUMMARY REPORT
TO
-15
- V
OC
Can
s
4 of 13

5 of 13

12/27/13 4:18 PMP1305477_Apex Companies, LLC_ANDOVER _ COLT COURT _ 32001641-04.002.xls - Page 1 of 1
ALS EnvironmentalSample Acceptance Check Form
Client: Apex Companies, LLC Work order: P1305477Project: ANDOVER / COLT COURT / 320001641-04.002Sample(s) received on: 12/11/13 Date opened: 12/11/13 by: RMARTENIES
Note: This form is used for all samples received by ALS. The use of this form for custody seals is strictly meant to indicate presence/absence and not as an indication of
compliance or nonconformity. Thermal preservation and pH will only be evaluated either at the request of the client and/or as required by the method/SOP.Yes No N/A
1 Were sample containers properly marked with client sample ID? 2 Container(s) supplied by ALS? 3 Did sample containers arrive in good condition? 4 Were chain-of-custody papers used and filled out? 5 Did sample container labels and/or tags agree with custody papers? 6 Was sample volume received adequate for analysis? 7 Are samples within specified holding times? 8 Was proper temperature (thermal preservation) of cooler at receipt adhered to?
9 Was a trip blank received?
10 Were custody seals on outside of cooler/Box? Location of seal(s)? Sealing Lid?
Were signature and date included? Were seals intact? Were custody seals on outside of sample container?
Location of seal(s)? Sealing Lid? Were signature and date included? Were seals intact?
11 Is there a client indication that the submitted samples are pH preserved? Were VOA vials checked for presence/absence of air bubbles?
12 Tubes: Are the tubes capped and intact?
Do they contain moisture? 13 Badges: Are the badges properly capped and intact?
Are dual bed badges separated and individually capped and intact?
Lab Sample ID Container Required Received Adjusted VOA Headspace
Description pH * pH pH (Presence/Absence) Comments
1.0 L Source Can
1.0 L Source Can
RSK - MEEPP, HCL (pH<2); RSK - CO2, (pH 5-8); Sulfur (pH>4)
Explain any discrepancies: (include lab sample ID numbers):
Do containers have appropriate preservation, according to method/SOP or Client specified information?
Does the client/method/SOP require that the analyst check the sample pH and if necessary alter it?
Receipt / Preservation
P1305477-001.01P1305477-002.01
6 of 13

TO15SCAN.XLS - NL - PageNo.:P1305477_TO15_1312261037_SC.xls - Sample
ALS ENVIRONMENTAL
RESULTS OF ANALYSIS
Page 1 of 1
Client: Apex Companies, LLCSVE 2 Initial ALS Project ID: P1305477ANDOVER / COLT COURT / 320001641-04.002 ALS Sample ID: P1305477-001
Test Code: EPA TO-15 Date Collected: 12/10/13Instrument ID: Tekmar AUTOCAN/Agilent 5973inert/6890N/MS8 Date Received: 12/11/13Analyst: Wida Ang Date Analyzed: 12/19/13Sample Type: 1.0 L Summa Canister Volume(s) Analyzed: 0.00020 Liter(s)Test Notes: Container ID: 1SC00878
Initial Pressure (psig): 13.22 Final Pressure (psig): 13.22
Canister Dilution Factor: 1.00
CAS # Compound MRL MRL Dataµg/m³ ppbV Qualifier
107-06-2 1,2-Dichloroethane ND 2,500 ND 620 71-43-2 Benzene 11,000 2,500 3,400 780 108-88-3 Toluene 24,000 2,500 6,400 660 100-41-4 Ethylbenzene ND 2,500 ND 580 179601-23-1 m,p-Xylenes ND 5,000 ND 1,200 95-47-6 o-Xylene ND 2,500 ND 580 103-65-1 n-Propylbenzene ND 2,500 ND 510 108-67-8 1,3,5-Trimethylbenzene ND 2,500 ND 510 95-63-6 1,2,4-Trimethylbenzene ND 2,500 ND 510 91-20-3 Naphthalene ND 2,500 ND 480 104-51-8 n-Butylbenzene ND 2,500 ND 460
ND = Compound was analyzed for, but not detected above the laboratory reporting limit.MRL = Method Reporting Limit - The minimum quantity of a target analyte that can be confidently determined by the referenced method.
Client Sample ID:Client Project ID:
ResultppbV
Resultµg/m³
7 of 13

TO15SCAN.XLS - NL - PageNo.:P1305477_TO15_1312271547_SC.xls - Sample (2)
ALS ENVIRONMENTAL
RESULTS OF ANALYSIS
Page 1 of 1
Client: Apex Companies, LLCSVE 2 Completion ALS Project ID: P1305477ANDOVER / COLT COURT / 320001641-04.002 ALS Sample ID: P1305477-002
Test Code: EPA TO-15 Date Collected: 12/10/13Instrument ID: Tekmar AUTOCAN/Agilent 5973inert/6890N/MS8 Date Received: 12/11/13Analyst: Wida Ang Date Analyzed: 12/26/13Sample Type: 1.0 L Summa Canister Volume(s) Analyzed: 0.00060 Liter(s)Test Notes: Container ID: 1SC00861
Initial Pressure (psig): 14.22 Final Pressure (psig): 14.22
Canister Dilution Factor: 1.00
CAS # Compound MRL MRL Dataµg/m³ ppbV Qualifier
107-06-2 1,2-Dichloroethane ND 830 ND 210 71-43-2 Benzene 3,200 830 990 260 108-88-3 Toluene 18,000 830 4,900 220 100-41-4 Ethylbenzene 5,800 830 1,300 190 179601-23-1 m,p-Xylenes 13,000 1,700 3,000 380 95-47-6 o-Xylene 3,700 830 850 190 103-65-1 n-Propylbenzene ND 830 ND 170 108-67-8 1,3,5-Trimethylbenzene ND 830 ND 170 95-63-6 1,2,4-Trimethylbenzene 1,000 830 200 170 91-20-3 Naphthalene ND 830 ND 160 104-51-8 n-Butylbenzene ND 830 ND 150
ND = Compound was analyzed for, but not detected above the laboratory reporting limit.MRL = Method Reporting Limit - The minimum quantity of a target analyte that can be confidently determined by the referenced method.
ResultppbV
Resultµg/m³
Client Sample ID:Client Project ID:
8 of 13

TO15SCAN.XLS - NL - PageNo.:P1305477_TO15_1312261037_SC.xls - MBlank
ALS ENVIRONMENTAL
RESULTS OF ANALYSIS
Page 1 of 1
Client: Apex Companies, LLCMethod Blank ALS Project ID: P1305477ANDOVER / COLT COURT / 320001641-04.002 ALS Sample ID: P131219-MB
Test Code: EPA TO-15 Date Collected: NAInstrument ID: Tekmar AUTOCAN/Agilent 5973inert/6890N/MS8 Date Received: NAAnalyst: Wida Ang Date Analyzed: 12/19/13Sample Type: 1.0 L Summa Canister Volume(s) Analyzed: 1.00 Liter(s)Test Notes:
Canister Dilution Factor: 1.00
CAS # Compound MRL MRL Dataµg/m³ ppbV Qualifier
107-06-2 1,2-Dichloroethane ND 0.50 ND 0.12 71-43-2 Benzene ND 0.50 ND 0.16 108-88-3 Toluene ND 0.50 ND 0.13 100-41-4 Ethylbenzene ND 0.50 ND 0.12 179601-23-1 m,p-Xylenes ND 1.0 ND 0.23 95-47-6 o-Xylene ND 0.50 ND 0.12 103-65-1 n-Propylbenzene ND 0.50 ND 0.10 108-67-8 1,3,5-Trimethylbenzene ND 0.50 ND 0.10 95-63-6 1,2,4-Trimethylbenzene ND 0.50 ND 0.10 91-20-3 Naphthalene ND 0.50 ND 0.095 104-51-8 n-Butylbenzene ND 0.50 ND 0.091
ND = Compound was analyzed for, but not detected above the laboratory reporting limit.MRL = Method Reporting Limit - The minimum quantity of a target analyte that can be confidently determined by the referenced method.
ResultppbV
Resultµg/m³
Client Sample ID:Client Project ID:
9 of 13

TO15SCAN.XLS - NL - PageNo.:P1305477_TO15_1312271547_SC.xls - MBlank (2)
ALS ENVIRONMENTAL
RESULTS OF ANALYSIS
Page 1 of 1
Client: Apex Companies, LLCMethod Blank ALS Project ID: P1305477ANDOVER / COLT COURT / 320001641-04.002 ALS Sample ID: P131226-MB
Test Code: EPA TO-15 Date Collected: NAInstrument ID: Tekmar AUTOCAN/Agilent 5973inert/6890N/MS8 Date Received: NAAnalyst: Wida Ang Date Analyzed: 12/26/13Sample Type: 1.0 L Summa Canister Volume(s) Analyzed: 1.00 Liter(s)Test Notes:
Canister Dilution Factor: 1.00
CAS # Compound MRL MRL Dataµg/m³ ppbV Qualifier
107-06-2 1,2-Dichloroethane ND 0.50 ND 0.12 71-43-2 Benzene ND 0.50 ND 0.16 108-88-3 Toluene ND 0.50 ND 0.13 100-41-4 Ethylbenzene ND 0.50 ND 0.12 179601-23-1 m,p-Xylenes ND 1.0 ND 0.23 95-47-6 o-Xylene ND 0.50 ND 0.12 103-65-1 n-Propylbenzene ND 0.50 ND 0.10 108-67-8 1,3,5-Trimethylbenzene ND 0.50 ND 0.10 95-63-6 1,2,4-Trimethylbenzene ND 0.50 ND 0.10 91-20-3 Naphthalene ND 0.50 ND 0.095 104-51-8 n-Butylbenzene ND 0.50 ND 0.091
ND = Compound was analyzed for, but not detected above the laboratory reporting limit.MRL = Method Reporting Limit - The minimum quantity of a target analyte that can be confidently determined by the referenced method.
Resultµg/m³
Client Sample ID:Client Project ID:
ResultppbV
10 of 13

TO15SCAN.XLS - NL - PageNo.:P1305477_TO15_1312271547_SC.xls - Surrogates
ALS ENVIRONMENTAL
SURROGATE SPIKE RECOVERY RESULTS
Page 1 of 1
Client: Apex Companies, LLCANDOVER / COLT COURT / 320001641-04.002 ALS Project ID: P1305477
Test Code: EPA TO-15Instrument ID: Tekmar AUTOCAN/Agilent 5973inert/6890N/MS8 Date(s) Collected: 12/10/13Analyst: Wida Ang Date(s) Received: 12/11/13Sample Type: 1.0 L Summa Canister(s) Date(s) Analyzed: 12/19 - 12/26/13Test Notes:
Client Sample ID ALS Sample ID Acceptance DataLimits Qualifier
P131219-MB 70-130 P131226-MB 70-130 P131219-LCS 70-130 P131226-LCS 70-130 P1305477-001 70-130 P1305477-002 70-130
Surrogate percent recovery is verified and accepted based on the on-column result.Reported results are shown in concentration units and as a result of the calculation, may vary slightly from the on-column percent recovery.
99 102118
110
107
11287 104
100 102
111
97 102115
Bromofluorobenzene
97 10195
Toluene-d8
RecoveredRecoveredPercent
Recovered
105
Percent1,2-Dichloroethane-d4
Percent
Client Project ID:
SVE 2 Initial
Lab Control Sample
Method Blank
SVE 2 Completion
Lab Control Sample
Method Blank
11 of 13

TO15SCAN.XLS - NL - PageNo.:P1305477_TO15_1312261037_SC.xls - LCS
ALS ENVIRONMENTAL
LABORATORY CONTROL SAMPLE SUMMARY
Page 1 of 1
Client: Apex Companies, LLCLab Control Sample ALS Project ID: P1305477ANDOVER / COLT COURT / 320001641-04.002 ALS Sample ID: P131219-LCS
Test Code: EPA TO-15 Date Collected: NAInstrument ID: Tekmar AUTOCAN/Agilent 5973inert/6890N/MS8 Date Received: NAAnalyst: Wida Ang Date Analyzed: 12/19/13Sample Type: 1.0 L Summa Canister Volume(s) Analyzed: 0.125 Liter(s)Test Notes:
CAS # Compound Data Qualifier
107-06-2 1,2-Dichloroethane 98 69-11871-43-2 Benzene 91 69-117108-88-3 Toluene 88 65-116100-41-4 Ethylbenzene 93 66-119179601-23-1 m,p-Xylenes 96 64-11895-47-6 o-Xylene 97 65-120103-65-1 n-Propylbenzene 96 65-121108-67-8 1,3,5-Trimethylbenzene 97 64-12595-63-6 1,2,4-Trimethylbenzene 100 64-13191-20-3 Naphthalene 104 56-143104-51-8 n-Butylbenzene 98 66-127
Laboratory Control Sample percent recovery is verified and accepted based on the on-column result.Reported results are shown in concentration units and as a result of the calculation, may vary slightly.
Client Sample ID:Client Project ID:
212420
185210220
206210
220204
202206
197
Spike Amount Resultµg/m³µg/m³
ALSAcceptance
212212
199194
200
% Recovery
215212
206213
405
Limits
12 of 13

TO15SCAN.XLS - NL - PageNo.:P1305477_TO15_1312271547_SC.xls - LCS (2)
ALS ENVIRONMENTAL
LABORATORY CONTROL SAMPLE SUMMARY
Page 1 of 1
Client: Apex Companies, LLCLab Control Sample ALS Project ID: P1305477ANDOVER / COLT COURT / 320001641-04.002 ALS Sample ID: P131226-LCS
Test Code: EPA TO-15 Date Collected: NAInstrument ID: Tekmar AUTOCAN/Agilent 5973inert/6890N/MS8 Date Received: NAAnalyst: Wida Ang Date Analyzed: 12/26/13Sample Type: 1.0 L Summa Canister Volume(s) Analyzed: 0.125 Liter(s)Test Notes:
CAS # Compound Data Qualifier
107-06-2 1,2-Dichloroethane 94 69-11871-43-2 Benzene 85 69-117108-88-3 Toluene 73 65-116100-41-4 Ethylbenzene 83 66-119179601-23-1 m,p-Xylenes 88 64-11895-47-6 o-Xylene 87 65-120103-65-1 n-Propylbenzene 86 65-121108-67-8 1,3,5-Trimethylbenzene 87 64-12595-63-6 1,2,4-Trimethylbenzene 91 64-13191-20-3 Naphthalene 93 56-143104-51-8 n-Butylbenzene 88 66-127
Laboratory Control Sample percent recovery is verified and accepted based on the on-column result.Reported results are shown in concentration units and as a result of the calculation, may vary slightly.
ALSAcceptance
212
369
193190
187
174202206
204220
Limitsµg/m³
212
180
184193
% RecoveryResult
154212420
175210
Client Sample ID:Client Project ID:
µg/m³210 198220
Spike Amount
13 of 13

Appendix C
Sampling and Analysis Plan

Appendix C – Sampling and Analysis Plan: Soil Investigation
SVE Evaluation and Soil Investigation Report Page C-1 Quail Crossing Neighborhood – Andover, Kansas March 26, 2014 1641-04
1.0 Introduction
This sampling and analysis plan (SAP) presents the field and sampling procedures and the analytical testing
program that will be used to perform the soil investigation in the Quail Crossing Neighborhood near
Andover, Kansas (the Site). Quality assurance and quality control (QA/QC) procedures are also discussed
in this appendix.
2.0 Field and Sampling Procedures
The scope of work includes completion of subsurface explorations and soil sampling. Data from these
activities will be used to refine the understanding of the vertical and lateral extent of soil with gasoline
constituents at the Site. These data will be used to evaluate cleanup options. The field and sampling
procedures include:
Advancement of borings using hollow-stem auger equipment;
Collection of soil samples;
Field screening of soil samples;
Selection and containerizing soil samples for laboratory analysis;
Sample management (e.g., containers, storage, and shipment);
Sample location control;
Boring abandonment;
Decontamination procedures; and
Handling of investigation-derived waste (IDW).
2.1 Preparatory Activities
Property Access. The soil investigation will be performed within: (1) the NuStar Pipeline right of way
(ROW); and (2) the City of Andover ROW. NuStar executed an access agreement with the City of Andover
in 2013.
Property Owner Notification. The owners of properties in the Quail Crossing Neighborhood will be notified
of planned drilling activities a minimum of one week in advance of field work.

Appendix C – Sampling and Analysis Plan: Soil Investigation
SVE Evaluation and Soil Investigation Report Page C-2 Quail Crossing Neighborhood – Andover, Kansas March 26, 2014 1641-04
Underground Utility Location. An underground utility locate request will be submitted through Kansas
One-Call Service. A private underground utility locate will also be conducted prior to performing the
subsurface work.
Health and Safety Plan. A Health and Safety Plan (HASP) has been prepared and is included as an
Attachment A to this Appendix. A copy of the HASP will be maintained on site during field activities.
2.2 Soil Borings, Field Screening, and Soil Sample Collection
The soil borings will be advanced using a hollow-stem auger. Discrete soil samples will be collected, using
a stainless steel split-spoon sampler at approximately 2.5-foot intervals, for lithologic description. The soil
sampling procedure includes driving the split-spoon sampler into the soil a distance of 18 inches using a
140-pound hammer with a free-fall height of 30 inches (per ASTM D-1587 guidelines). Each soil sample will
be logged in general accordance with ASTM method D2487/2488. Soil sample descriptions will include
visual indications of petroleum impacts, if any. The soil samples will be field screened for volatile organic
compounds (VOCs) and SPH using a photoionization detector (PID) and sheen tests, in accordance with
Standard Operating Procedure (SOP) 2.1, included in this appendix. Based on field indications of petroleum
impacts, soil samples will be submitted for chemical analysis of gasoline-range organics (GRO) and VOCs
by Iowa Method OA-1 and Environmental Protection Agency (EPA) Method 8260B, respectively. If
indications of petroleum impacts are observed (e.g., sheen, staining, or headspace vapors), additional soil
samples will be collected from the interval that exhibits the maximum impact and from apparently
non-impacted soil overlying and underlying the impacted interval. A field log of lithology and soil conditions
will be maintained for each boring. Drilling equipment (i.e., auger stems, split-spoon sampler, etc.) will be
decontaminated before and after each boring is advanced.
Soil samples intended for analysis of volatile organics will be collected using EPA Method 5035, as
described in SOP 2.7, included in this attachment.
Lithology will be noted on the field logs and described in accordance with the Unified Soil Classification
System (USCS). Features such as sorting, sedimentary features, mineralogy, degree of weathering, and
contacts with other soil types will also be noted if relevant.
2.3 Exploration Abandonment and Sample Location Control.
Explorations will be abandoned by filling each exploration with grout or bentonite to approximately three feet
bgs. The upper three feet will be backfilled to match surrounding grade and surface completion. Following
abandonment, each location will be recorded using a handheld global positioning system (GPS) instrument.

Appendix C – Sampling and Analysis Plan: Soil Investigation
SVE Evaluation and Soil Investigation Report Page C-3 Quail Crossing Neighborhood – Andover, Kansas March 26, 2014 1641-04
2.4 Sample Management
Soil Containers. Clean sample containers will be provided by the analytical laboratory ready for sample
collection, including preservative if required (the container requirements are listed in Table C-1). Specific
container requirements for samples that will undergo multiple analyses will be discussed with the analytical
laboratory prior to sample collection.
Labeling Requirements. A sample label will be affixed to each sample container before sample collection.
Containers will be marked with the project number, sample number, date of collection, and the sampler’s
initials.
Sample Storage and Shipment. Soil samples will be stored in a cooler chilled with ice or blue ice to
4 degrees Celsius (°C). The cooler lid will be sealed with chain-of-custody seals. The samples will be sent
via overnight courier to the analytical laboratory for chemical analysis. Chain of custody will be maintained
and documented at all times.
2.5 Decontamination Procedures
Personnel Decontamination. Personnel decontamination procedures depend on the level of protection
specified for a given activity. The HASP will identify the appropriate level of protection for the type of work
and expected field conditions involved in this project. In general, clothing and other protective equipment
can be removed from the investigation area. Field personnel should thoroughly wash their hands and faces
at the end of each day and before taking any work breaks.
Sampling Equipment Decontamination. To minimize cross-contamination between sampling events,
cleaning of non-disposable items will consist of washing in a detergent (Alconox®) solution, rinsing with tap
water, followed by a de-ionized (DI) water rinse. Decontamination water will be handled as described in
Section 2.6.
Drilling Equipment and Materials. Decontamination procedures are designed to remove trace-level
contaminants from drilling equipment to prevent the cross-contamination of exploration locations and
samples. Drilling equipment shall be decontaminated using high-pressure washing, steam cleaning, or
cleaning with detergent before and after use.
2.6 Handling of Investigation-Derived Waste
IDW will consist of soil from the soil cores and soil cuttings, decontamination water, and purge water. IDW
will be placed in Department of Transportation (DOT)-approved containers. Each container will be labeled

Appendix C – Sampling and Analysis Plan: Soil Investigation
SVE Evaluation and Soil Investigation Report Page C-4 Quail Crossing Neighborhood – Andover, Kansas March 26, 2014 1641-04
with the project name, general contents, and date. The IDW will be stored at the Site pending proper
disposal.
Disposable items, such as sample tubing, disposable bailers, bailer line, gloves, protective overalls (e.g.,
Tyvek®), paper towels, etc., will be placed in plastic bags after use and deposited in trash receptacles for
disposal.
3.0 Analytical Testing Program
An analytical testing program will be performed to assess the chemical quality of soil samples collected as
part of this project. Analytical laboratory QA/QC procedures are discussed in Section 4 of this appendix.
Table C-2 lists the proposed analytical methods and laboratory detection limit goals. Samples will be
collected and handled using methods described in Section 2 of this appendix. Specific container and
storage requirements for samples are listed in Table C-1. The samples will be analyzed for GRO by Iowa
Method OA-1 and VOCs by EPA Method 8260B.
4.0 Quality Assurance Program
4.1 Quality Assurance Objectives for Data Management
The general QA objectives for this project are to develop and implement procedures for evaluating soil
analytical data. To collect such information, analytical data must have an appropriate degree of accuracy
and reproducibility, samples must be representative of actual field conditions, and samples must be
collected and analyzed using unbroken chain-of-custody procedures (see Section 4.3).
Method detection limits (MDLs) and analytical results will be compared to action levels for each parameter in
media of concern. The detection limits listed in Table C-2 are the expected detection limits, based upon
laboratory calculations and experience.
Specific QA objectives are as follows:
1) Establish sampling techniques that will produce analytical data representative of the media
being measured.
2) Collect and analyze a sufficient number of duplicate field samples to establish sampling precision.
Laboratory duplicates of the same sample will provide a measure of precision within that sample
(sample homogeneity).

Appendix C – Sampling and Analysis Plan: Soil Investigation
SVE Evaluation and Soil Investigation Report Page C-5 Quail Crossing Neighborhood – Andover, Kansas March 26, 2014 1641-04
3) Analyze a sufficient number of analytical duplicate samples to assess the performance of the
analytical laboratory.
4) Analyze a sufficient number of duplicate, spiked, and check samples within the laboratory to
evaluate results against numerical QA goals established for precision and accuracy.
Precision, accuracy, representativeness, completeness, and comparability parameters used to indicate data
quality are defined below.
4.1.1 Precision
Precision is a measure of the reproducibility of data under a given set of conditions. Specifically, it is a
quantitative measure of the variability of a group of measurements compared to their average value. For
duplicate measurements, precision can be expressed as the relative percent difference (RPD). Analysis of
field duplicate samples measures the precision of sampling.
4.1.2 Accuracy
Accuracy is the measure of error between the reported test results and the true sample concentration. True
sample concentration is never known due to analytical limitations and error. Consequently, accuracy is
inferred from the recovery data from spiked samples.
Because of difficulties with spiking samples in the field, the laboratory will spike samples. For analyses of
less than five samples, matrix spikes (MS) may be performed on a batch basis.
Perfect accuracy is 100 percent recovery.
4.1.3 Representativeness
Representativeness is a measure of how closely the results reflect the actual concentration of the chemical
parameters in the medium sampled. Sampling procedures as well as sample-handling protocols for
storage, preservation, and transportation are designed to preserve the representativeness of the samples
collected. Proper documentation will confirm that protocols are followed. This helps to assure sample
identification and integrity.
Laboratory method blanks will be run in accordance with established laboratory protocols to ensure samples
are not contaminated during sample preparation in the laboratory.

Appendix C – Sampling and Analysis Plan: Soil Investigation
SVE Evaluation and Soil Investigation Report Page C-6 Quail Crossing Neighborhood – Andover, Kansas March 26, 2014 1641-04
4.1.4 Completeness
Completeness is defined as the percentage of measurements made which are judged to be valid.
The completeness goal is essentially that a sufficient amount of valid data be generated to meet the closure
requirements.
4.1.5 Comparability
Comparability is a qualitative parameter expressing the confidence with which one data set can be
compared with another. The objective of this QA program is to assure that data developed during the
investigation are comparable. Comparability of the data will be assured by using EPA-defined procedures
which specify sample collection, handling, and analytical methods.
4.1.6 Documentation
Essentially, EPA Level III documentation will be generated during this investigation. This level of
documentation is generally considered legally defensible and consists of the following:
Holding times;
Field duplicate data;
Laboratory method blank data;
Sample data;
Matrix/surrogate spike data; and
Duplicate sample data.
4.2 Sampling Procedures
Sampling procedures for soil are presented above in Section 2 of this appendix. These procedures are
designed to ensure:
Samples collected at the Site are consistent with project objectives; and
Samples are identified, handled, and transported in a manner that does not alter the
representativeness of the data from the actual Site conditions.
QA objectives for sample collection will be accomplished by evaluating the following items:
Duplicate Samples. Duplicates will be submitted to evaluate the precision of soil analysis. Three
field duplicates are included in the scope for this work.

Appendix C – Sampling and Analysis Plan: Soil Investigation
SVE Evaluation and Soil Investigation Report Page C-7 Quail Crossing Neighborhood – Andover, Kansas March 26, 2014 1641-04
Laboratory QA. Samples will be analyzed by ALS Laboratories, a KDHE-certified laboratory. The
ALS Quality Assurance Program Plan has been provided to KDHE previously.
4.3 Sample and Document Custody Procedures
The various methods used to document field sample collection and laboratory operation are presented
below.
4.3.1 Field Chain-of-Custody Procedures
Sample chain of custody refers to the process of tracking the possession of a sample from the time it is
collected in the field through the laboratory analysis. A sample is considered to be under a person's custody
if it is:
In a person's physical possession;
In view of the person after possession has been taken; or
Secured by that person so no one can tamper with the sample, or secured by that person in an
area restricted to authorized personnel.
A chain-of-custody form is used to record possession of a sample and to document analyses requested.
Each time the sample bottles or samples are transferred between individuals, both the sender and receiver
sign and date the chain-of-custody form. When a sample shipment is transported to the laboratory, a copy
of the chain-of-custody form is included in the transport container (e.g., ice chest).
The chain-of-custody forms are used to record the following information:
Sample identification number;
Sample collector's signature;
Date and time of collection;
Description of sample;
Analyses requested;
Shipper's name and address;
Receiver's name and address; and
Signatures of persons involved in chain of custody.

Appendix C – Sampling and Analysis Plan: Soil Investigation
SVE Evaluation and Soil Investigation Report Page C-8 Quail Crossing Neighborhood – Andover, Kansas March 26, 2014 1641-04
4.3.2 Laboratory Operations
The analytical laboratory has a system in place for documenting the following laboratory information:
Calibration procedures;
Analytical procedures;
Computational procedures;
QC procedures;
Bench data;
Operating procedures or any changes to these procedures; and
Laboratory notebook policy.
Laboratory chain-of-custody procedures provide the following:
Identification of the responsible party (sample custodian) authorized to sign for incoming field
samples and a log consisting of sequential lab tracking numbers; and
Specification of laboratory sample custody procedures for sample handling, storage, and internal
distribution for analysis.
4.3.3 Corrections to Documentation
Original data are recorded in field notes and on chain-of-custody forms using indelible ink. Documents will
be retained even if they are illegible or contain inaccuracies that require correction.
If an error is made on a document, the individual making the entry will correct the document by crossing a
line through the error, entering the correct information, and initialing and dating the correction. Any
subsequent error discovered on a document is corrected, initialed, and dated by the person who made the
entry.
4.4 Equipment Calibration Procedures and Frequency
Instruments and equipment used during this project will be operated, calibrated, and maintained according
to the manufacturer's guidelines and recommendations. Operation, calibration, and maintenance will be
performed by laboratory personnel fully trained in these procedures.

Appendix C – Sampling and Analysis Plan: Soil Investigation
SVE Evaluation and Soil Investigation Report Page C-9 Quail Crossing Neighborhood – Andover, Kansas March 26, 2014 1641-04
4.5 Analytical Procedures
Samples will be analyzed using GRO by Iowa Method OA-1 and VOCs by EPA Method 8260B. Table C-2
lists analytical parameters and test methods.
4.6 Data Reduction, Validation, and Reporting
The Project Manager will assure validation of the analytical data. The laboratory generating analytical data
for this project will be required to submit results that are supported by sufficient backup and QA/QC data to
enable the reviewer to determine the quality of the data. Validity of the laboratory data will be determined
based on the objectives outlined in Section 4.1 (above). Data validity will also be determined based upon
the sampling procedures and documentation outlined in Sections 4.2 and 4.3 of this SAP. Upon completion
of the review, the Project Manager will be responsible for assuring development of a QA/QC report on the
analytical data. Data will be stored and maintained according to the standard procedures of the laboratory.
The method of data reduction will be described in the final report.
4.7 Performance Audits
Performance audits are an integral part of an analytical laboratory's SOPs and are available upon request.
4.8 Corrective Actions
If the QC audit detects unacceptable conditions or data, the Project Manager will be responsible for
developing and initiating corrective action. The Project Manager will be notified if the nonconformance is
significant or requires special expertise. Corrective action may include the following:
Reanalyzing the samples, if holding time criteria permit;
Resampling and analyzing;
Evaluating and amending sampling and analytical procedures; and
Accepting data and acknowledging level of uncertainty or inaccuracy by flagging the data.
4.9 Quality Assurance Reports
The Project Manager will prepare a QA/QC evaluation of the data collected during the investigation field
activities for inclusion in the final report. In addition to an opinion regarding the validity of the data, the
QA/QC evaluation will address the following:
Adverse conditions or deviations from this SAP;
Assessment of analytical data for precision, accuracy, and completeness;

Appendix C – Sampling and Analysis Plan: Soil Investigation
SVE Evaluation and Soil Investigation Report Page C-10 Quail Crossing Neighborhood – Andover, Kansas March 26, 2014 1641-04
Significant QA problems and recommended solutions; and
Corrective actions taken for any problems previously identified.

Table C-1
Andover, Kansas
Soil SamplesVOCs EPA 8260B/5035 3 x VOAs, 1 x 4 oz jar None 4°C 14 daysTPH-GRO Iowa-OA1 1 x 4 oz jar None 4°C 14 days
Notes:
5. °C = Degrees Celsius.
Preservative Holding TimeAnalysis Method Container
3. VOCs = Volatile organic compounds.
Analytical Methods - Sample Container Requirements
1. EPA = U.S. Environmental Protection Agency.2. TPH-GRO = Gasoline-range petroleum hydrocarbons.
NuStar Pipeline Operating Partnership L.P. - Quail Crossing Neighborhood
StorageTemperature
SVE Evaluation and Proposed Soil Investigation ReportQuail Crossing Neighborhood – Andover, Kansas
1641-04Page 1 of 1

Table C-2
Andover, Kansas
Total Petroleum Hydrocarbons (TPH) Soil
Total Petroleum Hydrocarbons as Gasoline (TPH-GRO) Iowa Method OA-150 mg/kg 0.5
Volatile Organic Compounds (VOCs) SoilBenzene EPA Method 8260B 50 mg/kg 0.001
Cyclohexane EPA Method 8260B 50 mg/kg 0.001Ethylbenzene EPA Method 8260B 50 mg/kg 0.001
Isopropylbenzene EPA Method 8260B 50 mg/kg 0.001Methylcyclohexane EPA Method 8260B 50 mg/kg 0.001
Toluene EPA Method 8260B 50 mg/kg 0.001Xylenes, Total EPA Method 8260B 50 mg/kg 0.003Naphthalene EPA Method 8260B 50 mg/kg 0.001
n-butylbenzene EPA Method 8260B 50 mg/kg 0.0011,2-Dichloroethane EPA Method 8260B 50 mg/kg 0.001
1,3,5-trimethylbenzene EPA Method 8260B 50 mg/kg 0.0011,2,4-trimethylbenzene EPA Method 8260B 50 mg/kg 0.001
2-butanone EPA Method 8260B 50 mg/kg 0.001n-Propylbenzene EPA Method 8260B 50 mg/kg 0.001
Analytical Methods, Anticipated Sample Number, and Detection Limit Goals
DetectionLimitGoal
Units
NuStar Pipeline Operating Partnership L.P. - Quail Crossing Neighborhood
Soil
AnticipatedNumber ofSamples
Analyte Method
SVE Evaluation and Proposed Soil Investigation ReportQuail Crossing Neighborhood – Andover, Kansas
1641-04Page 1 of 1

Attachment A
Health and Safety Plan

Attachment A – Site-Specific Health and Safety Plan
SVE Evaluation and Soil Investigation Report Page C-A-1 Quail Crossing Neighborhood – Andover, Kansas March 26, 2014 1641-04
1.0 Introduction
This Health and Safety Plan includes both site-specific information (including site-specific activities, health
hazards, route to hospital, and toxicity information) and information from the Apex’s general Health and
Safety Plan.
1.1 Emergency Contact Summary
SITE LOCATION 2006 Colt Court, Andover, Kansas
NEAREST HOSPITAL
1124 West 21st Street Andover, KS 67002 (See Figure HSP-1) Telephone ................................................... (316) 300-4000
EMERGENCY RESPONDERS
Police Department ........................................................ 911 Fire Department ............................................................ 911 Ambulance .................................................................... 911
EMERGENCY CONTACTS
Apex Companies, LLC ............................... (503)924-4704 National Response Center ......................... (800)424-8802 Poison Control Center ............................... (800)222-1222 Chemtrec ................................................... (800)424-9300
In the event of an emergency, call for help as soon as possible. Give the following information:
WHERE the emergency is - use cross streets or landmarks
PHONE NUMBER you are calling from
WHAT HAPPENED - type of injury
HOW MANY persons need help
WHAT is being done for the victim(s)
YOU HANG UP LAST - let the person you called hang up first
2.0 Corporate Health and Safety Plan
The Apex General Health and Safety Plan, together with the included site-specific information, cover each of
the 11 required plan elements as specified in Occupational Safety and Health Administration (OSHA)
1910.120, and meet all applicable regulatory requirements. The reader is advised to thoroughly review the
entire plan.

Attachment A – Site-Specific Health and Safety Plan
SVE Evaluation and Soil Investigation Report Page C-A-2 Quail Crossing Neighborhood – Andover, Kansas March 26, 2014 1641-04
3.0 Site Specific Health and Safety Plan
3.1 Site Location and Description
LOCATION: Quail Crossing Neighborhood in Andover, Kansas.
LAND USE OF AREA SURROUNDING FACILITY: Residential
3.2 Site Activity Summary
SITE ACTIVITIES: Hollow-stem auger borehole explorations; sampling of soil.
PROPOSED DATE OF ACTIVITY: April 2014.
POTENTIAL SITE CONTAMINANTS: Benzene, toluene, ethylbenzene, xylenes (BTEX), 2-butanone,
gasoline-range organics (GRO), and other volatile organic compounds (VOCs).
POTENTIAL ROUTES OF ENTRY: Skin contact with soil, incidental ingestion of soil, and inhalation of
dust and volatiles.
PROTECTIVE MEASURES: Engineering controls, safety glasses, safety boots, hard hat, gloves,
protective clothing (including fire-resistant clothing), and respirators, as necessary.
MONITORING EQUIPMENT: Photoionization detector (PID) with 10.2 eV lamp and olfactory
indications.
3.3 Chain of Command
The chain of command for Health and Safety in this project involves the following individuals:
CORPORATE H&S MANAGER: Adam Reese
PROJECT MANAGER: Sam Jackson.
PROJECT H&S OFFICER: Sam Jackson
FIELD H&S MANAGER: Michael Whitson

Attachment A – Site-Specific Health and Safety Plan
SVE Evaluation and Soil Investigation Report Page C-A-3 Quail Crossing Neighborhood – Andover, Kansas March 26, 2014 1641-04
3.4 Hazard Analysis and Applicable Safety Procedures
The following work tasks will be performed:
Soil borings; and
Soil sampling.
The hazards associated with the activities listed above are discussed in detail below.
3.4.1 Soil Borings
Drilling and activities will be conducted with appropriate protection, as discussed under personal protective
equipment requirements. Employees are cautioned to stand clear of all equipment. Noise protection must
also be available and used whenever drilling activities are in progress. In addition, exclusion zones will be
established for worker protection.
Underground Utilities. Any underground activity that disturbs soil has the potential for disrupting
underground utilities. Immediately stop work and evacuate the area pending further evaluation:
If gas or vapor venting occurs during the activity;
If the odor of natural gas is detected; or
If it is suspected a pipeline or utility service has been damaged.
In addition, contact the proper authorities as necessary, and report the incident to the project manager.
If gas or vapor venting occurs from a soil boring, well installation, excavation, or other source, immediately
move upwind of the source. If necessary, use respiratory protection. If the odor of natural gas is detected
or if it suspected that a pipeline has been hit, immediately stop work, evacuate the area, and contact the
proper authorities.
Never continue to work in an area, even if PID readings, LEL, and/or hydrogen sulfide tests are acceptable,
if you begin to notice strange odors or symptoms of overexposure (such as dizziness, nausea, tearing of the
eyes, etc.). Do not resume work until testing shows the hazard has been removed.
Slips, Trips, and Falls. The work area will include uneven surfaces, surfaces with limited traction, and
debris may be present. Caution will be used to avoid slips, trips and falls.

Attachment A – Site-Specific Health and Safety Plan
SVE Evaluation and Soil Investigation Report Page C-A-4 Quail Crossing Neighborhood – Andover, Kansas March 26, 2014 1641-04
3.4.2 Soil Sampling
Soil sampling will occur under the assumption the media is contaminated and appropriate personnel
protection is required.
3.4.3 Air Monitoring and Action Levels
Air monitoring will be conducted to determine possible hazardous conditions and to confirm the adequacy of
personal protection equipment. The results of the air monitoring will be used as the basis for specifying
personal protective equipment and determining the need for upgrading protective measures.
Air monitoring equipment will be calibrated prior to use (where applicable) as specified by the instrument
manuals and results will be documented in the instrument log. All equipment will be maintained as specified
by the manufacturer or more frequently as required by use conditions. Repair records will be maintained
with the instrument log.
PID Monitoring. Air monitoring will be conducted with a PID with 10.2 eV lamp, or equivalent, to measure
organic vapor concentrations during site work activities. Background PID measurements will be taken prior
to the start of activities to quantify levels associated with the ambient air space in the vicinity of the site.
After the completion each open borehole, a separate PID measurement will be collected from within the
borehole to quantify the potential for VOCs to be released into the breathing space. If any of these
workspace PID measurements are elevated relative to the previously measured background levels, then
detector tube readings will be collected from the breathing space (described below). If the detector tube
readings exceed the National Institute for Occupational Safety and Health (NIOSH) recommended exposure
limit (REL) concentrations then site workers exposed to these levels will use air purifying respirators as
appropriate. If detector tubes readings are below the REL concentrations, then a PID measurement will be
collected from the breathing space. If PID measurements are elevated in the breathing zone above
background concentrations, then site workers exposed to these levels will use air purifying respirators as
appropriate. If measured concentrations exceed immediately dangerous to life and health (IDLH)
concentrations, site work will cease and personnel will vacate the work area pending re-evaluation of the
situation by the Health and Safety Manager.
Detector Tubes. If VOCs are detected as described above, air monitoring within the breathing space will
be conducted for specific compounds of concern with detector tubes for each identified compound.
Selected compounds have low permissible exposure limits (PEL) or register less effectively with the PID.
Specific detector tubes will be collected for benzene.
Olfactory. If olfactory senses detect any unfamiliar odor, work will stop until an assessment can be made to
determine whether the need exists to upgrade protective measures.

Attachment A – Site-Specific Health and Safety Plan
SVE Evaluation and Soil Investigation Report Page C-A-5 Quail Crossing Neighborhood – Andover, Kansas March 26, 2014 1641-04
3.5 Chemicals of Concern
Based on site information gathered to date, the following chemicals may be present at this site:
GRO;
BTEX and 2-butanone;
Other VOCs.
3.5.1 Toxicity Information
Pertinent toxicological properties of these chemicals are discussed below. This information generally covers
potential toxic effects which may occur from relatively significant acute and/or chronic exposures, and is not
meant to indicate that such effects will occur from the planned site activities. In general, the chemicals
which may be encountered at this site are not expected to be present at concentrations which could produce
significant exposures. The types of planned work activities should also limit potential exposures at this site.
Furthermore, appropriate protective and monitoring equipment will be used as discussed below to further
minimize any exposures which might occur.
Standards for occupational exposures to these chemicals are included where available. Site exposures are
generally expected to be of short duration and well below the level of any of these exposure limits. These
standards are presented below:
PEL Permissible exposure limit (OSHA).
REL Recommended exposure limit (NIOSH).
IDLH Immediately dangerous to life and health (NIOSH)
TWA Time-weighted average exposure limit for any 8-hour work shift of a 40-hour work week.
STEL Short term exposure limit expressed as a 15-minute time-weighted average and not to be
exceeded at any time during a work day.
C Ceiling exposure limit not to be exceeded at any time during a work day.
Total Petroleum Hydrocarbons. Total petroleum hydrocarbons (TPH) is a term used to describe a broad
family of several hundred chemical compounds that originally come from crude oil. In this sense, TPH is
really a mixture of chemicals. They are called hydrocarbons because almost all of them are made entirely
from hydrogen and carbon. Crude oils can vary in how much of each chemical they contain, and so can the
petroleum products that are made from crude oils. Most products that contain TPH will burn. Some are
clear or light-colored liquids that evaporate easily, and others are thick, dark liquids or semi-solids that do

Attachment A – Site-Specific Health and Safety Plan
SVE Evaluation and Soil Investigation Report Page C-A-6 Quail Crossing Neighborhood – Andover, Kansas March 26, 2014 1641-04
not evaporate. Many of these products have characteristic gasoline, kerosene, or oily odors. Because
modern society uses so many petroleum-based products (for example, gasoline, kerosene, fuel oil, mineral
oil, and asphalt), contamination of the environment by them is potentially widespread. Contamination
caused by petroleum products will contain a variety of these hydrocarbons. Because there are so many, it
is not usually practical to measure each one individually. However, it is useful to measure the total amount
of all hydrocarbons found together in a particular sample of soil, water, or air.
TPH can enter and leave your body when you breathe it in air; swallow it in water, food, or soil; or touch it.
Most components of TPH will enter your bloodstream rapidly when you breathe them as a vapor or mist or
when you swallow them. Some TPH compounds are widely distributed by the blood throughout your body
and quickly break down into less harmful chemicals. Others may break down into more harmful chemicals.
Other TPH compounds are slowly distributed by the blood to other parts of the body and do not readily
break down. When you touch TPH compounds, they are absorbed more slowly and to a lesser extent than
when you breathe or swallow them. Most TPH compounds leave your body through urine or when you
exhale air containing the compounds.
The compounds in different TPH fractions affect the body in different ways. Some of the TPH compounds,
particularly the smaller compounds such as benzene, toluene, and xylene (which are present in gasoline),
can affect the human central nervous system. If exposures are high enough, death can occur. Breathing
toluene at concentrations greater than 100 parts per million (ppm) for more than several hours can cause
fatigue, headache, nausea, and drowsiness. When exposure is stopped, the symptoms will go away.
However, if someone is exposed for a long time, permanent damage to the central nervous system can
occur. One TPH compound (n-hexane) can affect the central nervous system in a different way, causing a
nerve disorder called "peripheral neuropathy" characterized by numbness in the feet and legs and, in severe
cases, paralysis. This has occurred in workers exposed to 500–2,500 ppm of n-hexane in the air.
Swallowing some petroleum products such as gasoline and kerosene causes irritation of the throat and
stomach, central nervous system depression, difficulty breathing, and pneumonia from breathing liquid into
the lungs. The compounds in some TPH fractions can also affect the blood, immune system, liver, spleen,
kidneys, developing fetus, and lungs. Certain TPH compounds can be irritating to the skin and eyes. Other
TPH compounds, such as some mineral oils, are not very toxic and are used in foods. One TPH compound
(benzene) has been shown to cause cancer (leukemia) in people. The International Agency for Research
on Cancer (IARC) has determined that benzene is carcinogenic to humans (Group 1 classification). Some
other TPH compounds or petroleum products, such as benzo(a)pyrene and gasoline, are considered to be
probably and possibly carcinogenic to humans (IARC Groups 2A and 2B, respectively) based on cancer
studies in people and animals. Most of the other TPH compounds and products are considered not
classifiable (Group 3) by IARC.

Attachment A – Site-Specific Health and Safety Plan
SVE Evaluation and Soil Investigation Report Page C-A-7 Quail Crossing Neighborhood – Andover, Kansas March 26, 2014 1641-04
Although there are no federal regulations or guidelines for TPH in general, the government has developed
regulations and guidelines for some of the TPH fractions and compounds. These are designed to protect the
public from the possible harmful health effects of these chemicals. To protect workers, the OSHA has set a
legal limit of 500 ppm in the workplace.
EPA regulates certain TPH fractions, products, or wastes containing TPH, as well as some individual TPH
compounds. For example, there are regulations for TPH as oil; these regulations address oil pollution
prevention and spill response, stormwater discharge, and underground injection control. EPA lists certain
wastes containing TPH as hazardous. EPA also requires that the National Response Center be notified
following a discharge or spill into the environment of 10 pounds or more of hazardous wastes containing
benzene, a component in some TPH mixtures.
Nearly all states have cleanup standards for TPH or components of TPH (common cleanup standards are
for gasoline, diesel fuel, and waste oil). Analytical methods are specified, many of which are considered to
be TPH methods.
Benzene. Benzene, also known as benzol, is a colorless liquid with a sweet odor. Benzene evaporates
into air very quickly and dissolves slightly in water. Benzene is highly flammable. Most people can begin to
smell benzene in air at 1.5–4.7 ppm and smell benzene in water at 2 ppm. Most people can begin to taste
benzene in water at 0.5–4.5 ppm. Benzene is found in air, water, and soil.
Benzene found in the environment is from both human activities and natural processes. Benzene was first
discovered and isolated from coal tar in the 1,800s. Today, benzene is made mostly from petroleum
sources. Because of its wide use, benzene ranks in the top 20 in production volume for chemicals produced
in the United States. Various industries use benzene to make other chemicals, such as styrene (for
Styrofoam® and other plastics), cumene (for various resins), and cyclohexane (for nylon and synthetic
fibers). Benzene is also used for the manufacturing of some types of rubbers, lubricants, dyes, detergents,
drugs, and pesticides. Natural sources of benzene, which include volcanoes and forest fires, also contribute
to the presence of benzene in the environment. Benzene is also a natural part of crude oil and gasoline and
cigarette smoke.
Most people are exposed to a small amount of benzene on a daily basis. You can be exposed to benzene
in the outdoor environment, in the workplace, and in the home. Exposure of the general population to
benzene is mainly through breathing air that contains benzene. The major sources of benzene exposure
are tobacco smoke, automobile service stations, exhaust from motor vehicles, and industrial emissions.
Vapors (or gases) from products that contain benzene, such as glues, paints, furniture wax, and detergents,
can also be a source of exposure. Auto exhaust and industrial emissions account for about 20% of the total
nationwide exposure to benzene. About 50% of the entire nationwide exposure to benzene results from

Attachment A – Site-Specific Health and Safety Plan
SVE Evaluation and Soil Investigation Report Page C-A-8 Quail Crossing Neighborhood – Andover, Kansas March 26, 2014 1641-04
smoking tobacco or from exposure to tobacco smoke. The average smoker (32 cigarettes per day) takes in
about 1.8 milligrams (mg) of benzene per day. This is about 10 times the average daily intake of
nonsmokers.
Measured levels of benzene in outdoor air have ranged from 0.02 to 34 parts of benzene per billion parts of
air (ppb; 1 ppb is 1,000 times less than 1 ppm). People living in cities or industrial areas are generally
exposed to higher levels of benzene in air than those living in rural areas. Benzene levels in the home are
usually higher than outdoor levels. People living around hazardous waste sites, petroleum refining
operations, petrochemical manufacturing sites, or gas stations may be exposed to higher levels of benzene
in air.
Benzene can enter your body through your lungs when you breathe contaminated air. It can also enter
through your stomach and intestines when you eat food or drink water that contains benzene. Benzene can
enter your body through skin contact with benzene-containing products such as gasoline.
When you are exposed to high levels of benzene in air, about half of the benzene you breathe in leaves
your body when you breathe out. The other half passes through the lining of your lungs and enters your
bloodstream. Animal studies show that benzene taken in by eating or drinking contaminated foods behaves
similarly in the body to benzene that enters through the lungs. A small amount will enter your body by
passing through your skin and into your bloodstream during skin contact with benzene or
benzene-containing products. Once in the bloodstream, benzene travels throughout your body and can be
temporarily stored in the bone marrow and fat. Benzene is converted to products, called metabolites, in the
liver and bone marrow. Some of the harmful effects of benzene exposure are believed to be caused by
these metabolites. Most of the metabolites of benzene leave the body in the urine within 48 hours after
exposure.
After exposure to benzene, several factors determine whether harmful health effects will occur, and if they
do, what the type and severity of these health effects might be. These factors include the amount of
benzene to which you are exposed and the length of time of the exposure. Most data involving effects of
long-term exposure to benzene are from studies of workers employed in industries that make or use
benzene. These workers were exposed to levels of benzene in air far greater than the levels normally
encountered by the general population. Current levels of benzene in workplace air are much lower than in
the past. Because of this reduction, and the availability of protective equipment such as respirators, fewer
workers have symptoms of benzene poisoning.
Brief exposure (5–10 minutes) to very high levels of benzene in air (10,000–20,000 ppm) can result in
death. Lower levels (700–3,000 ppm) can cause drowsiness, dizziness, rapid heart rate, headaches,

Attachment A – Site-Specific Health and Safety Plan
SVE Evaluation and Soil Investigation Report Page C-A-9 Quail Crossing Neighborhood – Andover, Kansas March 26, 2014 1641-04
tremors, confusion, and unconsciousness. In most cases, people will stop feeling these effects when they
stop being exposed and begin to breathe fresh air.
Eating foods or drinking liquids containing high levels of benzene can cause vomiting, irritation of the
stomach, dizziness, sleepiness, convulsions, rapid heart rate, coma, and death. The health effects that may
result from eating foods or drinking liquids containing lower levels of benzene are not known. If you spill
benzene on your skin, it may cause redness and sores. Benzene in your eyes may cause general irritation
and damage to your cornea.
Benzene causes problems in the blood. People who breathe benzene for long periods may experience
harmful effects in the tissues that form blood cells, especially the bone marrow. These effects can disrupt
normal blood production and cause a decrease in important blood components. A decrease in red blood
cells can lead to anemia. Reduction in other components in the blood can cause excessive bleeding. Blood
production may return to normal after exposure to benzene stops. Excessive exposure to benzene can be
harmful to the immune system, increasing the chance for infection and perhaps lowering the body's defense
against cancer.
Benzene can cause cancer of the blood-forming organs. The Department of Health and Human Services
(DHHS) has determined that benzene is a known carcinogen. IARC has determined that benzene is
carcinogenic to humans, and the EPA has determined that benzene is a human carcinogen. Long-term
exposure to relatively high levels of benzene in the air can cause cancer of the blood-forming organs. This
condition is called leukemia. Exposure to benzene has been associated with development of a particular
type of leukemia called acute myeloid leukemia (AML).
Exposure to benzene may be harmful to the reproductive organs. Some women workers who breathed high
levels of benzene for many months had irregular menstrual periods. When examined, these women
showed a decrease in the size of their ovaries. However, exact exposure levels were unknown, and the
studies of these women did not prove that benzene caused these effects. It is not known what effects
exposure to benzene might have on the developing fetus in pregnant women or on fertility in men. Studies
with pregnant animals show that breathing benzene has harmful effects on the developing fetus. These
effects include low birth weight, delayed bone formation, and bone marrow damage.
The health effects that might occur in humans following long-term exposure to food and water contaminated
with benzene are not known. In animals, exposure to food or water contaminated with benzene can
damage the blood and the immune system and can even cause cancer.
EPA has set the maximum permissible level of benzene in drinking water at 5 ppb. Because benzene can
cause leukemia, EPA has set a goal of 0 ppb for benzene in drinking water and in water such as rivers and
Attachment A – Site-Specific Health and Safety Plan
SVE Evaluation and Soil Investigation Report Page C-A-10 Quail Crossing Neighborhood – Andover, Kansas March 26, 2014 1641-04
lakes. EPA estimates that 10 ppb benzene in drinking water that is consumed regularly or exposure to
0.4 ppb benzene in air over a lifetime could cause a risk of one additional cancer case for every 100,000
exposed persons. EPA recommends a maximum permissible level of benzene in water of 200 ppb for
short-term exposures (10 days) for children.
EPA requires that the National Response Center be notified following a discharge or spill into the
environment of 10 pounds or more of benzene.
OSHA regulates levels of benzene in the workplace. The maximum allowable amount of benzene in
workroom air during an 8-hour workday, 40-hour workweek is 1 ppm. Since benzene can cause cancer, the
NIOSH) recommends that all workers likely to be exposed to benzene wear special breathing equipment.
Toluene. Toluene is a clear, colorless liquid with a distinctive smell. It is added to gasoline along with
benzene and tolueneylene. Toluene occurs naturally in crude oil and in the tolu tree. It is produced in the
process of making gasoline and other fuels from crude oil, in making coke from coal, and as a by-product in
the manufacture of styrene. Toluene is used in making paints, paint thinners, fingernail polish, lacquers,
adhesives, and rubber and in some printing and leather tanning processes. It is disposed of at hazardous
waste sites as used solvent (a substance that can dissolve other substances) or at landfills where it is
present in discarded paints, paint thinners, and fingernail polish. You can begin to smell toluene in the air at
a concentration of 8 ppm, and taste it in your water at a concentration of 0.04–1 ppm. (One ppm is
equivalent to 1 minute in 2 years.)
Toluene can enter your body when you breathe its vapors or eat or drink contaminated food or water. When
you work with toluene-containing paints or paint thinners, the toluene can also pass through your skin into
your bloodstream. You are exposed to toluene when you breathe air containing toluene. When this occurs
the toluene is taken directly into your blood from your lungs. Where you live, work, and travel and what you
eat affect your daily exposure to toluene. Factors such as your age, sex, body composition, and health
status affect what happens to toluene once it is in your body. After being taken into your body, more than
75% of the toluene is removed within 12 hours. It may leave your body unchanged in the air you breathe
out or in your urine after some of it has been chemically changed to make it more water soluble. Generally,
your body turns toluene into less harmful chemicals such as hippuric acid.
A serious health concern is that toluene may have an effect on your brain. Toluene can cause headaches,
confusion, and memory loss. Whether or not toluene does this to you depends on the amount you take in
and how long you are exposed. Low-to-moderate, day-after-day exposure in your workplace can cause
tiredness, confusion, weakness, drunken-type actions, memory loss, nausea, and loss of appetite. These
symptoms usually disappear when exposure is stopped. Researchers do not know if the low levels of

Attachment A – Site-Specific Health and Safety Plan
SVE Evaluation and Soil Investigation Report Page C-A-11 Quail Crossing Neighborhood – Andover, Kansas March 26, 2014 1641-04
toluene you breathe at work will cause any permanent effects on your brain or body after many years. You
may experience some hearing loss after long-term daily exposure to toluene in the workplace.
If you are exposed to a large amount of toluene in a short time because you deliberately sniff paint or glue,
you will first feel light-headed. If exposure continues, you can become dizzy, sleepy, or unconscious. You
might even die. Toluene causes death by interfering with the way you breathe and the way your heart
beats. When exposure is stopped, the sleepiness and dizziness will go away and you will feel normal again.
If you choose to repeatedly breathe in toluene from glue or paint thinners, you may permanently damage
your brain. You may also experience problems with your speech, vision, or hearing, have loss of muscle
control, loss of memory, poor balance, and decreased mental ability. Some of these changes may be
permanent.
Toluene may change the way your kidneys work, but in most cases, the kidneys will return to normal after
exposure stops. If you drink alcohol and are exposed to toluene, the combination can affect your liver more
than either compound alone. This phenomenon is called synergism. Combinations of toluene and some
common medicines like aspirin and acetaminophen may increase the effects of toluene on your hearing.
In animals, the main effect of toluene is on the nervous system. Animals exposed to moderate or high
levels of toluene may also show slightly adverse effects in their liver, kidneys, and lungs.
Several studies have shown that unborn animals were harmed when high levels of toluene were breathed in
by their mothers. When the mothers were fed high levels of toluene, the unborn animals did not show any
structural birth defects, although some effects on behavior were noted. We do not know if toluene would
harm your unborn child if you drink water or breathe air containing low levels of toluene, because studies in
people are not comprehensive enough to measure this effect. However, if you deliberately breathe in large
amounts of toluene during your pregnancy, your baby can have neurological problems and retarded growth
and development.
Studies in workers and in animals exposed to toluene indicate that toluene does not cause cancer. IARC
and DHHS have not classified toluene for carcinogenic effects. The EPA has determined that toluene is not
classifiable as to its human carcinogenicity.
The federal government has developed regulatory standards and guidelines to protect you from the possible
health effects of toluene in the environment. OSHA has set a limit of 100 ppm of toluene for air in the
workplace, averaged for an 8-hour exposure per day over a 40-hour work week. The American Conference
of Governmental Industrial Hygienists (ACGIH) and NIOSH have recommended that toluene in workplace
air not exceed 100 ppm (as an average level over 8 hours).

Attachment A – Site-Specific Health and Safety Plan
SVE Evaluation and Soil Investigation Report Page C-A-12 Quail Crossing Neighborhood – Andover, Kansas March 26, 2014 1641-04
EPA recommends that drinking water should not contain more than 20 ppm for 1 day, 3 ppm for 10 days, or
1 ppm for lifetime consumption. Any release of more than 1,000 pounds of this chemical to the environment
must be reported to the National Response Center.
Ethylbenzene. Ethylbenzene is a colorless liquid that smells like gasoline. You can smell ethylbenzene in
the air at concentrations as low as 2 ppm. It evaporates at room temperature and burns easily.
Ethylbenzene occurs naturally in coal tar and petroleum. It is also found in many products, including paints,
inks, and insecticides. Gasoline contains about 2 percent (by weight) ethylbenzene. Ethylbenzene is used
primarily in the production of styrene. It is also used as a solvent, a component of asphalt and naphtha, and
in fuels. In the chemical industry, it is used in the manufacture of acetophenone, cellulose acetate,
diethylbenzene, ethyl anthraquinone, ethylbenzene sulfonic acids, propylene oxide, and -methylbenzyl
alcohol. Consumer products containing ethylbenzene include pesticides, carpet glues, varnishes and
paints, and tobacco products. In 1994, approximately 12 billion pounds of ethylbenzene were produced in
the United States. Ethylbenzene is most commonly found as a vapor in the air. This is because
ethylbenzene moves easily into the air from water and soil. Once in the air, other chemicals help break
down ethylbenzene into chemicals found in smog. This breakdown happens in less than 3 days with the aid
of sunlight. In surface water such as rivers and harbors, ethylbenzene breaks down by reacting with other
compounds naturally present in the water. In soil, the majority of ethylbenzene is broken down by soil
bacteria. Since ethylbenzene binds only moderately to soil, it can also move downward through soil to
contaminate groundwater. Near hazardous waste sites, the levels of ethylbenzene in the air, water, and soil
could be much higher than in other areas.
When you breathe air containing ethylbenzene vapor, it enters your body rapidly and almost completely
through your lungs. Ethylbenzene in food or water can also rapidly and almost completely enter your body
through the digestive tract. It may enter through your skin when you come into contact with liquids
containing ethylbenzene. Ethylbenzene vapors do not enter through your skin to any large degree. People
living in urban areas or in areas near hazardous waste sites may be exposed by breathing air or by drinking
water contaminated with ethylbenzene. Once in your body, ethylbenzene is broken down into other
chemicals. Most of it leaves in the urine within 2 days. Small amounts can also leave through the lungs and
in feces. Liquid ethylbenzene that enters through your skin is also broken down. Ethylbenzene in high
levels is broken down slower in your body than low levels of ethylbenzene. Similarly, ethylbenzene mixed
with other solvents is also broken down more slowly than ethylbenzene alone. This slower breakdown will
increase the time it takes for ethylbenzene to leave your body.
At certain levels, exposure to ethylbenzene can harm your health. People exposed to high levels of
ethylbenzene in the air for short periods have complained of eye and throat irritation. Persons exposed to
higher levels have shown signs of more severe effects such as decreased movement and dizziness. No
studies have reported death in humans following exposure to ethylbenzene alone. However, evidence from

Attachment A – Site-Specific Health and Safety Plan
SVE Evaluation and Soil Investigation Report Page C-A-13 Quail Crossing Neighborhood – Andover, Kansas March 26, 2014 1641-04
animal studies suggests that it can cause death at very high concentrations in the air (about 2 million times
the usual level in urban air). Whether or not long-term exposure to ethylbenzene affects human health is
not known, because little information is available. Short-term exposure of laboratory animals to high
concentrations of ethylbenzene in air may cause liver and kidney damage, nervous system changes, and
blood changes. The link between these health effects and exposure to ethylbenzene is not clear because of
conflicting results and weaknesses in many of the studies. Also, there is no clear evidence that the ability to
get pregnant is affected by breathing air or drinking water containing ethylbenzene, or coming into direct
contact with ethylbenzene through the skin. Two long-term studies in animals suggest that ethylbenzene
may cause tumors. One study had many weaknesses, and no conclusions could be drawn about possible
cancer effects in humans. The other, a recently completed study, was more convincing, and provided clear
evidence that ethylbenzene causes cancer in one species after exposure in the air to concentrations greater
than 740 ppm that were approximately 1 million times the levels found in urban air. At present, the federal
government has not identified ethylbenzene as a chemical that may cause cancer in humans. However, this
may change after consideration of the new data.
There are no reliable data on the effects in humans after eating or drinking ethylbenzene or following direct
exposure to the skin. For this reason, levels of exposure that may affect your health after eating, drinking,
or getting ethylbenzene on your skin are estimated from animal studies. There are only two reports of eye
or skin exposure to ethylbenzene. In these studies, liquid ethylbenzene caused eye damage and skin
irritation in rabbits. More animal studies are available that describe the effects of breathing air or drinking
water containing ethylbenzene.
The federal government develops regulations and recommendations to protect public health. Regulations
can be enforced by law. Federal agencies that develop regulations for toxic substances include the EPA,
OSHA, and the Food and Drug Administration (FDA). Recommendations provide valuable guidelines to
protect public health but cannot be enforced by law. Federal organizations that develop recommendations
for toxic substances include the Agency for Toxic Substances and Disease Registry (ATSDR) and NIOSH.
Regulations and recommendations can be expressed in not-to-exceed levels in air, water, soil, or food that
are usually based on levels that affect animals; then they are adjusted to help protect people. Sometimes
these not-to-exceed levels differ among federal organizations because of different exposure times (an
8-hour workday or a 24-hour day), the use of different animal studies, or other factors.
Recommendations and regulations are also periodically updated as more information becomes available.
For the most current information, check with the federal agency or organization that provides it. Some
regulations and recommendations for ethylbenzene include the following:

Attachment A – Site-Specific Health and Safety Plan
SVE Evaluation and Soil Investigation Report Page C-A-14 Quail Crossing Neighborhood – Andover, Kansas March 26, 2014 1641-04
The federal government has developed regulatory standards and guidelines to protect you from possible
health effects of ethylbenzene in the environment. EPA's Office of Drinking Water (ODW) set 700 ppb (this
equals 0.7 milligrams ethylbenzene per liter of water or mg/L) as the acceptable exposure concentration of
ethylbenzene in drinking water for an average weight adult. This value is for lifetime exposure and is set at
a level that is expected not to increase the chance of having (noncancer) adverse health effects. The same
EPA office (ODW) set higher acceptable levels of ethylbenzene in water for shorter periods (20 ppm or
20 mg/L for 1 day, 3 ppm or 3 mg/L for 10 days). EPA has determined that exposures at or below these
levels are acceptable for small children. If you eat fish and drink water from a body of water, the water
should contain no more than 1.4 mg ethylbenzene per liter.
EPA requires that a release of 1,000 pounds or more of ethylbenzene be reported to the federal
government's National Response Center in Washington, D.C.
OSHA set a legal limit of 100 ppm ethylbenzene in air. This is for exposure at work for 8 hours per day.
NIOSH also recommends an exposure limit for ethylbenzene of 100 ppm. This is for exposure to
ethylbenzene in air at work for up to 10 hours per day in a 40-hour work week. NIOSH also set a limit of
125 ppm for a 15-minute period.
Xylenes. There are three forms of xylene in which the methyl groups vary on the benzene ring:
meta-xylene, ortho-xylene, and para-xylene (m-, o-, and p-xylene). These different forms are referred to as
isomers. The term total xylenes refers to all three isomers of xylene (m-, o-, and p-xylene). Mixed xylene is
a mixture of the three isomers and usually also contains 6–15% ethylbenzene. Xylene is also known as
xylol or dimethylbenzene. Xylene is primarily a synthetic chemical. Chemical industries produce xylene
from petroleum. Xylene also occurs naturally in petroleum and coal tar and is formed during forest fires. It is
a colorless, flammable liquid with a sweet odor.
Xylene is one of the top 30 chemicals produced in the United States in terms of volume. It is used as a
solvent (a liquid that can dissolve other substances) in the printing, rubber, and leather industries. Along
with other solvents, xylene is also used as a cleaning agent, a thinner for paint, and in varnishes. It is found
in small amounts in airplane fuel and gasoline. Xylene is used as a material in the chemical, plastics, and
synthetic fiber industries and as an ingredient in the coating of fabrics and papers. Isomers of xylene are
used in the manufacture of certain polymers (chemical compounds), such as plastics.
Xylene evaporates and burns easily. Xylene does not mix well with water; however, it does mix with alcohol
and many other chemicals. Most people begin to smell xylene in air at 0.08–3.7 ppm and begin to taste it in
water at 0.53–1.8 ppm.

Attachment A – Site-Specific Health and Safety Plan
SVE Evaluation and Soil Investigation Report Page C-A-15 Quail Crossing Neighborhood – Andover, Kansas March 26, 2014 1641-04
Xylene is most likely to enter your body when you breathe xylene vapors. Less often, xylene enters the
body through the skin following direct contact. It is rapidly absorbed by your lungs after you breathe air
containing it. Exposure to xylene may also take place if you eat or drink xylene-contaminated food or water.
The amount of xylene retained ranges from 50% to 75% of the amount of xylene that you inhale. Physical
exercise increases the amount of xylene absorbed by the lungs. Absorption of xylene after eating food or
drinking water containing it is both rapid and complete. Absorption of xylene through the skin also occurs
rapidly following direct contact with xylene. Absorption of xylene vapor through the skin is lower than
absorption of xylene vapor by the lungs. However, it is not known how much of the xylene is absorbed
through the skin. At hazardous waste sites, breathing xylene vapors, drinking well water contaminated with
xylene, and direct contact of the skin with xylene are the most likely ways you can be exposed. Xylene
passes into the blood soon after entering the body.
In people and laboratory animals, xylene is broken down into other chemicals especially in the liver. This
process changes most of the xylene that is breathed in or swallowed into a different form. Once xylene
breaks down, the breakdown products rapidly leave the body, mainly in urine, but some unchanged xylene
also leaves in the breath from the lungs. One of the breakdown products of xylene, methylbenzaldehyde, is
harmful to the lungs of some animals. This chemical has not been found in people exposed to xylene.
Small amounts of breakdown products of xylene have appeared in the urine of people as soon as 2 hours
after breathing air containing xylene. Usually, most of the xylene that is taken in leaves the body within 18
hours after exposure ends. Storage of xylene in fat or muscle may prolong the time needed for xylene to
leave the body.
Short-term exposure of people to high levels of xylene can cause irritation of the skin, eyes, nose, and
throat; difficulty in breathing; impaired function of the lungs; delayed response to a visual stimulus; impaired
memory; stomach discomfort; and possible changes in the liver and kidneys. Both short- and long-term
exposure to high concentrations of xylene can also cause a number of effects on the nervous system, such
as headaches, lack of muscle coordination, dizziness, confusion, and changes in one's sense of balance.
People exposed to very high levels of xylene for a short period of time have died. Most of the information on
long-term exposure to xylene is from studies of workers employed in industries that make or use xylene.
Those workers were exposed to levels of xylene in air far greater than the levels normally encountered by
the general population. Many of the effects seen after their exposure to xylene could have been caused by
exposure to other chemicals that were in the air with xylene.
Results of studies of animals indicate that large amounts of xylene can cause changes in the liver and
harmful effects on the kidneys, lungs, heart, and nervous system. Short-term exposure to very high
concentrations of xylene causes death in animals, as well as muscular spasms, incoordination, hearing loss,
changes in behavior, changes in organ weights, and changes in enzyme activity. Long-term exposure of
animals to low concentrations of xylene has not been well studied.

Attachment A – Site-Specific Health and Safety Plan
SVE Evaluation and Soil Investigation Report Page C-A-16 Quail Crossing Neighborhood – Andover, Kansas March 26, 2014 1641-04
Information from animal studies is not adequate to determine whether or not xylene causes cancer in
humans. Both the IARC and EPA have found that there is insufficient information to determine whether or
not xylene is carcinogenic and consider xylene not classifiable as to its human carcinogenicity.
Exposure of pregnant women to high levels of xylene may cause harmful effects to the fetus. Studies of
unborn animals indicate that high concentrations of xylene may cause increased numbers of deaths,
decreased weight, skeletal changes, and delayed skeletal development. In many instances, these same
concentrations also cause damage to the mothers. The higher the exposure and the longer the exposure to
xylene, the greater the chance of harmful health effects. Lower concentrations of xylene are not so harmful.
EPA estimates that, for an adult of average weight, exposure to 10 mg/L (equal to 10 ppm) of water each
day for a lifetime (70 years) is unlikely to result in harmful noncancerous health effects. For a long-term but
less than lifetime exposure (about 7 years), 27.3 ppm is estimated to be a level unlikely to result in harmful
health effects in an adult.
Exposure to 12 ppm xylene in water for 1 day or to 7.8 ppm of xylene in water for 10 days or longer is
unlikely to present a health risk to a small child. EPA has proposed a recommended maximum level of 10
ppm xylene in drinking water.
To protect people from the potential harmful health effects of xylene, EPA regulates xylene in the
environment. EPA has set a legally enforceable maximum level of 10 mg/L (equal to 10 ppm) of xylene in
water that is delivered to any user of a public water system. OSHA has set an occupational exposure limit
of 100 ppm of xylene in air averaged over an 8-hour workday and a 15-minute exposure limit of 150 ppm.
These regulations also match recommendations (not legally enforceable) of the American Conference of
Governmental Industrial Hygienists. NIOSH has recommended an exposure limit (not legally enforceable)
of 100 ppm of xylene averaged over a workday up to 10 hours long in a 40-hour workweek. NIOSH has
also recommended that exposure to xylene not exceed 150 ppm for longer than 15 minutes. NIOSH has
classified xylene exposures of 10,000 ppm as immediately dangerous to life or health.
EPA and the FDA specify conditions under which xylene may be used as a part of herbicides, pesticides, or
articles used in contact with food. The EPA has a chronic drinking water health advisory of 27.3 ppm for an
adult and 7.8 ppm for a 10-kilogram child.
EPA regulations require that a spill of 1,000 pounds or more of xylene or used xylene solvents be reported
to the Federal Government National Response Center.

Project Number
Route to Hospital
HSP-1Figure1641-03
August 2012
Colt CourtNuStar Pipeline Operating Partnership L.P.
Andover, Kansas
Base map prepared from 2012 Google Map data.
Head north on Colt Court toward W Mountain (157 ft)
Turn left onto W Mountain (213 ft)
Turn right onto N Quail Crossing Street (433 ft)
Turn right onto W 21st Street (0.1 mi)
Take the 1st left onto Keystone PkwyDestination will be on the left
End at Kansas Medical Center: 1124 West 21st StreetEnd at
End at End at
Andover, KS 67002(316) 300-4000
1:
2:
3:
4:
5:
6:
Driving Directions:
A Division of Apex Companies, LLCAsh Creek Associates

Attachment B
Standard Operating Procedures

STANDARD OPERATING PROCEDURE SOP Number: 2.1
Date: November 9, 2009
STANDARD FIELD SCREENING PROCEDURES Revision Number: 1.1
Page: 1 of 2 1. PURPOSE AND SCOPE
This Standard Operating Procedure (SOP) provides instructions for standard field screening. Field screening results are used to aid in the selection of soil samples for chemical analysis. This procedure is applicable during all Ash Creek Associates (ACA) soil sampling operations.
Standard field screening techniques include the use of a photoionization detector (PID) to assess for volatile organic compounds (VOCs), for the presence of separate-phase petroleum hydrocarbons using a sheen test. These methods will not detect all potential contaminants, so selection of screening techniques shall be based on an understanding of the site history. The PID is not compound or concentration-specific, but it can provide a qualitative indication of the presence of VOCs. PID measurements are affected by other field parameters such as temperature and soil moisture. Other field screening methods, such as screening for dense non-aqueous phase liquid (DNAPL) using dye or UV light, are not considered “standard” and will be detailed in the site-specific sampling and analysis plan (SAP).
2. EQUIPMENT AND MATERIALS
The following materials are necessary for this procedure:
PID with calibration gas (record daily calibration/calibration check in field notes); Plastic resealable bags (for PID measurement); and Glass jars or stainless steel bowls (for sheen testing).
3. METHODOLOGY
Each soil sample will be field screened for VOCs using a PID and for the presence of separate-phase petroleum hydrocarbons using a sheen test. If the presence of DNAPL is suspected, then screening using dye and UV light may also to be completed. For information regarding screening using dye or UV light, refer to the site specific sampling and analysis plan. PID lamps come in multiple sizes, typically 9.8, 10.6, and 11.7 electron volts (eV). The eV rating for the lamp must be greater than the ionization potential (in eV) of a compound in order for the PID to detect the compound. For petroleum hydrocarbons, a lamp of at least 9.8 eV should be used. For typical chlorinated alkenes (dichloroethene, trichloroethene, tetrachloroethene, or vinyl chloride.), a lamp of at least 10.6 eV should be used. The compatibility of the lamp size with the site constituents should be verified prior to the field event and will be detailed in the site-specific SAP. PID Calibration Procedure: The PID used on-site should be calibrated daily or more frequently if needed. Calibration of the PID should be documented in field notes. Calibrations procedures should be conducted according to the manufacturer’s instructions. .
PID Screening Procedure:
Place a representative portion (approximately one ounce) of freshly exposed, uncompacted soil into a clean resealable plastic bag.
Seal the bag and break up the soil to expose vapors from the soil matrix. Allow the bag to sit to reach ambient temperature. Note: Ambient temperature and weather
conditions/humidity should be recorded in field notes. Changes in ambient temperature and weather during the field work should also be recorded, as temperature and humidity can affect PID readings.
Carefully insert the intake port of the PID into the plastic bag. Record the PID measurement in the field notes or boring logs.
Sheen Test Procedure:
Following the PID screen, place approximately one ounce of freshly exposed, uncompacted soil into a clean glass jar or stainless steel bowl.

STANDARD OPERATING PROCEDURE SOP Number: 2.1
Date: November 9, 2009
STANDARD FIELD SCREENING PROCEDURES Revision Number: 1.1
Page: 2 of 2
Add enough water to cover the sample. Observe the water surface for signs of discoloration/sheen and characterize
No Sheen (NS) No visible sheen on the water surface Biogenic Film (BF) Dull, platy/blocky or foamy film. Slight Sheen (SS) Light sheen with irregular spread, not rapid. May have small spots of
color/iridescence. Majority of water surface not covered by sheen. Moderate Sheen (MS) Medium to heavy coverage, some color/iridescence, spread is irregular to
flowing. Sheen covering a large portion of water surface. Heavy Sheen (HS) Heavy sheen coverage with color/iridescence, spread is rapid, entire water
surface covered with sheen. Separate-phase hydrocarbons may be evident during sheen test.
STANDARD OPERATING PROCEDURE SOP Number: 2.7
Date: January 25, 2010
EPA METHOD 5035A SOIL SAMPLING PROCEDURES Revision Number: 0.01
Page: 1 of 2
1. PURPOSE AND SCOPE
This Standard Operating Procedure (SOP) describes the methods used for obtaining soil samples for chemical analysis for volatile organic compounds (VOCs) by EPA Method 5035A. Samples collected using the 5035A protocols are not exposed to the atmosphere after sampling thereby reducing the potential for loss of VOCs during sample transport, handling, and analysis. This procedure assumes the use of the PowerStop Handle sampler with disposable EasyDraw Syringes or Terra Core Samplers. This procedure is applicable during all Ash Creek Associates (ACA) soil sampling activities where the 5035A protocols are employed.
2. EQUIPMENT AND MATERIALS
The following materials are necessary for this procedure:
• Sampling equipment (PowerStop Handle, disposable EasyDraw Syringes, Terra Core Samplers) • Laboratory-supplied sample containers (pre-weighed 40ml VOA vials including labels, preservative, stir
bars, etc. [number and type as specified by the lab], two ounce jars) - Vials used from ACA stock must be weighed to confirm loss of reagents is less than 0.02
grams. Record vial tare weight in field notes. Discard vials with dates over 6 months old. • Field documentation materials • Decontamination materials • Personal protective equipment (as required by Health and Safety Plan)
3. METHODOLOGY
The project-specific sampling and analysis plan (SAP) will define the specific requirements for 5035A methodology required for a particular site or by a regulatory agency.
Analytical Requirements
• VOCs must be analyzed within 14 days of collection. • Field preserved samples (e.g., sodium bisulfate or methanol) must be maintained at 4° C. • Sample collected without preservative (e.g., reagent water) must frozen or analyzed within 48 hours.
Collection of Samples
• When using the PowerStop Handle, clip the syringe into the handle in one of the three 5 gram positions. Use the heavy position for dense clay, the light position for dry sandy soil, and the medium position for all others.
• Using the handle, push the sampler into the soil to collect the sample. Continue pushing until the soil column has forced the plunger in the syringe to the stopping point or filled the sampler.
• Wipe all debris from the outside of the sampler. The soil plug should be flush with the mouth of the sampler. Remove any excess soil that extends beyond the mouth of the sampler.
• Extrude the 5 gram sample into vial and cap vial immediately. Hold vial at an angle when extruding to minimize splashing. Gently swirl vial for 10 seconds to break up soil particles (do not shake).
• When capping the vial, be sure to remove any soil or debris from the threads of the vial. • Repeat process for each additional vial. • Fill a two ounce container (to capacity) for percent total solids determination.

STANDARD OPERATING PROCEDURE SOP Number: 2.7
Date: January 25, 2010
EPA METHOD 5035A SOIL SAMPLING PROCEDURES Revision Number: 0.01
Page: 2 of 2
Additional Considerations
• Methanol contamination can occur from adjacent activities (e.g., exhaust from running equipment or vehicles, hot tar roofing, facility operations, etc). Collection and analysis of methanol field blank (e.g., additional methanol vial left open during period of sampling) is recommended.
• Acidification of carbonaceous soils with sodium bisulfate can cause effervescence and loss of VOCs. • Certain volatile compounds such as 2-chloroethylvinyl ether may be lost by acidification. • Acidification of certain soils with sodium bisulfate may cause the formation of acetone through oxidation
of soil waxes and humic material (e.g., organic materials such as roots).
Recommended