Principles of Finance Mgmt 260 Natalyia zaiats
Macy’s Inc. Valuation Project
Fabiola Abissa Carla Dasilva Anastasia Mashtaler EiEi Kyawt San
1

Table of Contents
Executive Summary
Macy’s Overview
SWOT analysis
Financial Statement Analysis
Firm Riskiness Analysis
Firm Valuation
Conclusion and Recommendation
Appendix
2

Executive Summary
Macy’s is a wellknown chain of department stores owned by the American multinational corporation
Macy’s Inc.; they are also owners of Bloomingdale’s. The company started out as a dry goods store in 1858
and with time became the profitable department store chain that it is known as today. Macy’s main strengths
as a company include its My Macy’s localization, Omnichannel integration initiative, and its MAGIC Selling
customer engagement strategy. Some other strengths are their price competitiveness and the variety of the
products offered both instore and online.
Macy’s Overview
Macy’s, from the name of his founder Rowland H. Macy was originally a dry goods store founded in
1858 in New York . Eager to push the success of his small company further, Rowland launched R HMacy & 1
Co and associated to his brand the star we are all familiar with
to symbolize success. Although that year Rowland made small sales debut, he saw his revenues increased
from the $11.06 he collected on his first sale day to $85,000 at the end of the year. Soon, Macy moved his
current store location to herald square and increase the size of his store through a renovation project. With the
expansion of its retail space totalizing more than 1 million, macy’s annual sales which was now the biggest
store existing back then were estimated to $36 millions in 1918. Four years later the company went public
and Rowland started to open regional stores. 2
After few years of prosperity and expansion, Macy’s was forced to file for Bankruptcy in 1992, losing many
of its regional store and two years later, R. H macy’s and Co was acquired by the Federated Department
Store, Inc. After Macy’s, the federated department store regrouped numerous other stores under its label for a
few more years and in 1996 was renamed as Macy’s. 3
1 College William & Mary. Macy’s Department store: company History . Retrieve from <http://web.wm.edu/americanstudies/370/2005F/sp4/home_macys_generalhistory.htm> 2 Macy’s Inc. (2014). Macy’s Inc. History. Retrieved from <http://www.macysinc.com/aboutus/macysinchistory/overview/default.aspx> 3 College William & Mary. Macy’s Department store: company History . Retrieve from
3

As one of the giants of the retail industry, Macy’s Inc. accounts for more than 850 stores spread on 45
states and is also present in Guam, the district of Columbia and Puerto Rico operating either under Macy’s or
Bloomingdales . Its market is segmented based on the population’s income and mainly targets upper as well 4
as middle class individual. Some of the items foundMacy’s store are, but not limited to men's, women's, and
children's apparel/accessories, cosmetics, and home furnishings. As one of the geant in the retail industry,
Macy’s
SWOT Analysis
Strength
Omnichannel
Celebrities endorsement
Weaknesses
No physical location for international customers
Opportunities
International market expansion
Threats
Economic conditions
Competitors
Strengths
One strength of Macy’s is its ability efficiently its Omnichannel integration initiative, which allows
the company to provide its merchandise to customers in a variety of ways. This gives customers many
purchasing option and gives them control as to how they want their merchandise to be provided to them.
With approximately 850 stores spread on 45 states as well as US territories, Macy’s is capable of fulfilling
<http://web.wm.edu/americanstudies/370/2005F/sp4/home_macys_generalhistory.htm> 4 SEC filing Data (2014). Retrieved from <https://www.sec.gov/Archives/edgar/data/794367/000079436714000071/m02012014x10k.htm>
4

purchases instore, online, and through mailorder which gives customers flexibility when it comes to how
they would like to make their purchase and the variety of merchandise available to them increases. This
guarantees a more responsive and customized for of customer service and ensures a quicker, more efficient
delivery of their merchandise.
The ability to use celebrities endorsement is also one of macy’s strength. By using celebrities, Macy’s
is bringing its products and its brand to the people who did not know anything about the products it offers.as
a result, it adds more customers to the ones who are already faithful to the brand, thus increasing its sales.
Weaknesses
the biggest weakness of Macy’s is the absence of physical store on an international scale. Although
Macy’s did a great job in making sure that the stores are accessible to most of its customers in the US, the
same cannot be said for the ones which leave in countries such as France, Japan, China or Morocco.
International customers are left only with option of online shopping which might not be at everyone’s
preference. It might push away customers who are not used to technologies and would like to visit a store to
buy a product rather than sit behind a screen and place an order.
Opportunities
by being present only in the US and on US territories, Macy’s has the opportunity to expand its
business operations internationally. Market such as Asia, Brazil, Europe have a lot of potential to be exploit
and could contribute in Macy’s success and profitability. Having an international representation of Macy’s at
the international level could be made by doing a partnership with other local companies a first and then in the
long run, open a Macy’s chain.
5

Threats
Because it is only present in the US, one threat that Macy’s would constantly have to face is the
economic condition of the country. indeed, in the event that there is a recession, the purchasing power of
households will decrease. Macy’s will suffer a decrease in the sales as its activities will slowdown. as a
results we might observe a decline in the growth rate and a loss might be incurred by Macy’s.
Competitors are also another threat Macy’s has to face as one of the giants of the retail industry. The
indirect competitors of Macy’s in industry include JC Penney and Sacks whereas Dillard’s is a more direct
competitor.
Competitive Advantage
Macy’s must compete with other department stores that offer similar products and services. It must
also face variable macroeconomic conditions and low customer switching costs, both challenges to
maintaining a sustained competitive advantage. There are certain aspects of the company that allow it to have
a competitive advantage over rival departments stores. Developed in 2013, Macy’s has orchestrated three
main strategies that have allowed its business to prosper: My Macy’s localization, Omnichannel integration,
and MAGIC Selling customer engagement. These strategies are known by the acronym M.O.M.
Macy’s has benefitted greatly from its My Macy’s localization strategy and it continues to do so
because it adds familiarity and personalization to it’s department store based on varying location and climate.
Each of Macy’s stores provides merchandise that is directly related to the location and thus all of the
customers who shop and live there. This makes merchandise variety very different for each store, answering
the different tastes and needs customers seek when it comes to merchandise style, fit, color, weight, and
overall quality.
Macy’s also considers the demographic, economic, and socioeconomic background of each of their
store locations to offer optimal customer service and relevant marketing to their customers. Representing the
6

needs and wants of their multicultural customers is one of Macy’s main goals as they account for a large
proportion of their overall customers. The company continues to make improvements to this initiative such as
refining its merchandise localization from store to store, store fulfillment processes, testing and adding a Buy
Online Pickup InStore option, and expanding their capacity in directtocustomer fulfillment centers.
The next strategy utilized by Macy’s is its Omnichannel integration initiative, which allows the
company to provide its merchandise to customers in a variety of ways. This gives customers many
purchasing option and gives them control as to how they want their merchandise to be provided to them.
Macy’s is capable of fulfilling purchases instore, online, and through mailorder which gives customers
flexibility when it comes to how they’d like to make their purchase and the variety of merchandise available
to them increases. In addition to these methods, as of 2013 there are over 292 out of the total 850 stores
nationally and internationally that collectively participate in the fulfillment of orders. The number of stores is
expected to increase in future years. This guarantees a more responsive and customized for of customer
service and ensures a quicker, more efficient delivery of their merchandise.
The third key strategy Macy’s utilizes is the MAGIC Selling customer engagement initiative. This
strategy focuses on employees and ensures all sales associates are trained and equipped with the tools they
need to be more confident and engaged with customers on the sales floor. This is another initiative that
improves the overall quality of Macy’s customer service because it encourages associates to be more caring
and responsive to their customer’s needs, both actual and perceived.
Macy’s also functions in other ways to ensure that its competitive advantage is sustained, regardless
of its competitor’s success. The company has decided to target the Millennial customer, commonly known as
those aged from 1330 years old. Since they often go to speciality stores because they cannot find their
desired merchandise in department stores, Macy’s is now providing more specialty brands that will draw this
segment into their stores. It has even successfully created brands that are considered national or exclusive to
the company itself, increasing its differentiation amongst competitors. It has also has unique purchasing and
7

advertising economies of scale that successfully compete with smaller retailers.
Finally, Macy’s takes advantage of different technologies both instore and online to maximize the
customer experience. This includes using tablet computers instore, tapandpay mobile technology,
providing paperless digital receipts, promoting the use of QR code technology to further engage shoppers,
and delivering special offers to shoppers via Foursquare, Shopkick, Google and Facebook, as well as through
other social media.
Even if competitors can also provide exclusive brands and maintain their own purchasing and advertising
economies of scale, it is a challenge for more centralized national retailers to copyMacy’s top three strategies
that have promoted its success in the industry. Local merchandising would take much time and resources
these retailers and would be complex to build internally.
By using My Macy’s localization, Omnichannel integration, and MAGIC Selling customer
engagement, Macy’s has been able to differentiate itself from its competitors and sustain competitive
advantage in its industry. It has succeeded in providing quality merchandise at competitive costs and to a
highly diverse customer base, regardless of varying customer location or need.
8

Financial Ratios Analysis 5
Macy's Inc. Industry 6
Jan. 2011 Jan. 2012 Jan. 2013 Jan. 2013
PROFITABILITY
ROA 6.09% 6.04% 7.08% 5.20%
ROE 22.71% 22.50% 24.56% 17.20%
Profit margin 4.76% 4.82% 5.32% 2.00%
DEBT MANAGEMENT
Times Interest Earned 4.40 4.95 5.87 4.90
Total Debt Ratio 0.73 0.73 0.71 0.40
LIQUIDITY
Quick Ratio 0.43 0.58 0.51 .5
Current Ratio 1.38 1.40 1.55 1.9
ASSET MANAGEMENT
Total Asset Turnover 1.28 1.25 1.33 2.3
Fixed Asset Turnover Ratio 1.92 2.08 2.13 10.9
DSO 4.67 4.85 4.85 1.63
Inventory Turnover Ratio 5.55 5.41 5.26 3.2
MARKET VALUE
M/B 2.30 2.80 3.60 2.60
P/E 11.8 11.9 14.9 12.06 7
5 SEC Filings Data (2014). Retrieved from (Anastasia put your source here) 6 Estatements industry ratio (2014). Department store. Retrieved from <http://www.statementstudies.org/IndustryResources.aspx> 7 Dillards P/E computed from the historic prices of Dillard’s and the EPS for 2013
9

Trend Analysis
Liquidity Ratios
current ratio :Macy’s current ratio values from 2011 to 2013 were respectively 1.38, 1.40 and 1.55.
The increase in the values of the current ratio shows that Macy’s in improving it ability to pay off its
debt.
quick ratio: from 2011 to 2013, we can see an increase in macy’s quick ratio values which went
from 0.43 to 0.58 from 2011 to 2012 and from 0.58 to 0.51 from 2012 to 2013. The trend observed
indicates that Macy’s is improving its ability to pay its current debts at the time they are due.
Overall, macy’s liquidity has been improving meaning that Macy’s is doing good when it comes to its
assets into cash to meet its obligations.
Asset Management Ratios
inventory turnover ratio :As we look at the Macy’s turnover inventory ratio from 2011 to 2013, we
can see that it slightly decreased over this 3year span, the values being respectively 5.55 , 5.41 and
5.26. The decrease in inventory turnover ratio could be the result of a decrease in sale or an
overstock resulting in high inventories.
Days’ sales outstanding (DSO):as we look at the Days’ sales outstanding (DSO) ratios of macy’s
frm 2011 to 2013, we see can see that the values are trending up. This means that Macy’s is taking
longer to converts it account receivable into cash.
Fixed Asset turnover :Macy’s fixed asset turnover ratio were 1.92, 2.08 and 2.13 respectively for
2011, 2012 and 2013. The increase observed in macy’s fixed asset turnover ratio indicates that
Macy’s is improving its ability to generate more income per dollar using its fixed assets.
total asset turnover ratio: the values observed over the 20112013 period were 1.28, 1.25 and 1.33.
10
The increase observed in macy’s total asset turnover ratio indicates that Macy’s is improving its
ability to generate more income per dollar using its total assets.
Debt Management Ratios
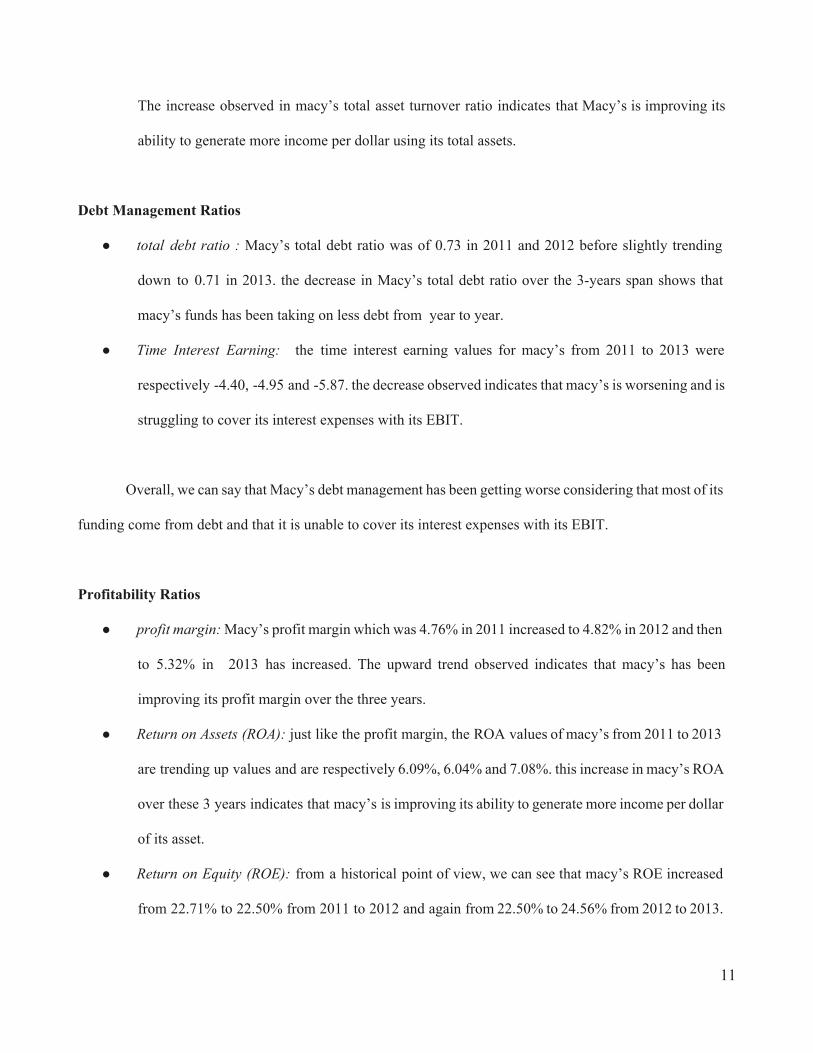
total debt ratio : Macy’s total debt ratio was of 0.73 in 2011 and 2012 before slightly trending
down to 0.71 in 2013. the decrease in Macy’s total debt ratio over the 3years span shows that
macy’s funds has been taking on less debt from year to year.
Time Interest Earning: the time interest earning values for macy’s from 2011 to 2013 were
respectively 4.40, 4.95 and 5.87. the decrease observed indicates that macy’s is worsening and is
struggling to cover its interest expenses with its EBIT.
Overall, we can say that Macy’s debt management has been getting worse considering that most of its
funding come from debt and that it is unable to cover its interest expenses with its EBIT.
Profitability Ratios
profit margin:Macy’s profit margin which was 4.76% in 2011 increased to 4.82% in 2012 and then
to 5.32% in 2013 has increased. The upward trend observed indicates that macy’s has been
improving its profit margin over the three years.
Return on Assets (ROA): just like the profit margin, the ROA values of macy’s from 2011 to 2013
are trending up values and are respectively 6.09%, 6.04% and 7.08%. this increase in macy’s ROA
over these 3 years indicates that macy’s is improving its ability to generate more income per dollar
of its asset.
Return on Equity (ROE): from a historical point of view, we can see that macy’s ROE increased
from 22.71% to 22.50% from 2011 to 2012 and again from 22.50% to 24.56% from 2012 to 2013.
11

%. this increase in macy’s ROE over these 3 years indicates that macy’s is improving its ability to
generate more income per dollar of its equity and increase its rate of return on equity investments.
Overall, macy’s is becoming more efficient over the years in generating more income per dollar of
assets and increasing its rate of return on equity investments. Macy’s profitability is furthermore supported by
the increase in its profit margin over the 3year span
Market Value Ratios
Price/ Earnings Ratio : The Price/ Earnings Ratio for Macy’s ever so slightly increased from
2011 to 2012 from 11.8 to 11.9 to increase significantly in 2013, going from 11.9 to 14.9.
These increasing values mean that investors are willing to pay more money per dollar of reported
profits and thus that have confidence in the company and its future growth.
Benchmark Analysis
Liquidity Ratios
current ratio :Macy’s current ratio values from 2011 to 2013 were respectively 1.38, 1.40 and 1.55
while the industry average was 1.5. Macy’s values are overall slightly lower than the industry
average which means that it is worse than the industry in term of its ability to pay of its debt.
quick ratio: the industry quick ratio average for 2013 was 0.9 while the values recorded for macy’s
from 2011 to 2013 were 0.43, 0.58 and 0.51. from these observations, we can see that Macy’s is
worse than the industry when it comes to paying its sort term debts.
Overall, macy’s liquidity is worse than the industry, meaning that it is struggling to covert asset into
12

liquidity quickly enough to meet its obligation and pay its debts.
Asset Management Ratios
turnover inventory ratio : even thoughMacy’s turnover inventory ratio from 2011 to 2013, slightly
decreased over this 3year span, being respectively 5.55 , 5.41 and 5.26, they are significantly
higher than the industry average which is 3.2.
macy’s is better than the industry in selling the inventory and making more sales.
Days’ sales outstanding (DSO):as we look at the Days’ sales outstanding (DSO) ratios of macy’s
from 2011 to 2013, we see can see that the values are trending up being respectively 4.67, 4.85 and
4.85 compared to the industry average which is 1.63.
From these observations we can say that macy’s is doing worse than the industry as it takes longer to Macy’s
to converts its account receivable into cash.
Fixed Asset turnover :Macy’s fixed asset turnover ratio were 1.92, 2.08 and 2.13 respectively for
2011, 2012 and 2013 while the average industry ratio was 10.9. Since
these values are substantially lower than the average and thus, macy’s is worse than the industry in its ability
to generate more revenue per dollar of fixed asset.
total asset turnover ratio: the values observed over the 20112013 period were 1.28, 1.25 and 1.33
for Macy’s total asset turnover ratio against 2.3 for the industry average. The fact that the total asset
turnover ratios for macy’s are lower than the industry indicates that macy’s is worse than the
industry in term of generating more income per dollar using its total assets.
Overall, we can say that macy’s asset management is worse than the industry meaning that Macy’s is
not efficient in generating more income per dollar of assets
13

Debt Management Ratios
total debt ratio : Even if Macy’s total debt ratio over the 3years span decreased going from 0.73
for 2011 and 2012 to 0.71 in 2013, it is substantially higher than the industry average which is 0.40.
we can thus say that macy’s is worse than the industry as it is financed more by debt than the
average industry company.
Time Interest Earning: the time interest earning values for macy’s from 2011 to 2013 were
respectively 4.40, 4.95 and 5.87 while the average industry value is 4.90 . the fact that the values
are lower than the industry average indicates that macy’s is worse than the industry when it comes
to covering its interest expenses with its EBIT.
Macy’s debt management is worse than the industry as it is more debt funded than the average
industry company and struggles to cover its interest expenses using its EBIT.
Profitability Ratios
profit margin:Macy’s profit margin which was 4.76% in 2011 increased to 4.82% in 2012 and then
to 5.32% in 2013. Since these values are higher than the industry average which is 2.00% , we can
say that macy’s is doing better than the industry in generating more profit..
Return on Assets (ROA): just like the profit margin, the ROA values of macy’s from 2011 to 2013
are trending up values and are respectively 6.09%, 6.04% and 7.08% and remained significantly
higher than the industry average which is 5.20%. this indicates that macy’s is better than the
industry at generating more income per dollar of its asset.
Return on Equity (ROE): from a historical point of view, we can see that macy’s ROE increased
from 22.71% to 22.50% from 2011 to 2012 and again from 22.50% to 24.56% from 2012 to 2013.
%. When comparing these values to the industry average which is 17.20% , we can say that macy’s
14

is doing better than the industry at generating more income per dollar of its equity and increase its
rate of return on equity investments.
Overall, macy’s profitability is better than the average industry company since it is more efficient at
generating more revenue per dollar on asset and equity and make more profit.
Market Value Ratios
Price/ Earnings Ratio : The Price/ Earnings Ratio for Macy’s ever so slightly increased from 2011 to
2012 from 11.8 to 11.9 and increase significantly in 2013, going from 11.9 to 14.9. comparing the
values of Macy’s to the P/E of macy’s main competitor , Dillard’s, which is 12.60 we can say that
macy’s is doing better than the industry.
Overall, macy’s market value is better than the average industry company because investors are
willing to pay more from year to year
DuPont Analysis
ROE = Net Profit Margin
X Total Asset Turnover
X Equity Multiplier
2011 22.71% = 4.76% X 1.28 X 3.73
2012 22.50% = 4.82% X 1.25 X 3.72
2013 24.56% = 5.32% X 1.33 X 3.47
Ind. 17.20% = 2.00% X 2.30 X 3.74
By breaking down ROE in the DuPont Analysis, it can be on one hand determined that Macy’s main
weakness in generating more revenues on equity is its Assets turnover ratio. Indeed, we see that Macy’s
15

performance in all the other components of the Dupont equation is good if not better than the industry on the
other hand we see that profit margin plays an important role in the ROE yield of Macy’s. To be able to
improve its performance, Macy’s will have to come up with better asset management strategies to increase
revenues while improving and if not, maintaining its current performance.
Analysis of Firm Riskiness
Although Macy’s faces similar types of risks that other corporations do, such as the threat of an
industry takeover (monopoly?) by other competitors they have other sources of risks. The risks that are
within the company are a low inventory turnover and variety, its loss of regional brand value that comes with
being an established national brand, and its repositioning efforts. A lower inventory in stores can lead to
decrease in net sales if customers choose to go to different apparel stores. Customer loyalty may decrease if
smaller, regional brands choose to market to Macy’s current segments. Regional brands cater to unique
customer needs and wants based on geographical, demographic, and even behavioral information. The
impersonality of a national brand may hurt Macy’s market share and profitability overtime if it does not
diversify its products and services.
This also ties into Macy’s repositioning strategy in which it had to switch from being known as a
department store to a company providing “affordable luxury” with brands such as Calvin Klein, Ralph
Lauren, and Liz Claiborne. Their brand repositioning may have negative effects such as store closings, loss or
transfer of employees, loss of suppliers, loss of distribution channels, and unsatisfied customers.
If inventory turnover and variety aren’t up to par then the company will experience a loss in profits
which will limit its ability to pay back its debts and ultimately reduce the value of the firm for both
stockholders and general consumers. It’s unique brand identity also adds value to the firm because it
promotes loyalty and recognition among competitors nationally and internationally. Successful repositioning
efforts also may yield favorable results for the company
16

The risks within the market and industry are other competitors, seasonality, and consumer behaviors.
Other competitors may offer more apparel selection of a higher quality for less than Macy’s, may be
successful in niche markets with more specific needs according to the targeted market segments, or have
differentiated products and services that exceed that of Macy’s. The retail fashion industry is highly affected
by the seasonality of certain apparel items. Sales tend to increase during the holiday season but costs also go
up in relation to this trend. Varying consumer needs and wants also influence how they perceive Macy’s as
brand. Some consumers from a particular segment may prefer to shop at smaller, more luxurious boutiques in
place of department stores. It may even be that some consumers are interest in smaller chains that provide
unique styles for similar prices and quality.
The value of Macy’s itself is directly reflected through how Macy’s strategizes in response to the
firmspecific, market, and industry risks it faces. If they are successful in their efforts to adapt then investors
will see the company as being a good investment.
Beta
we computed beta through a regression function on Excel using the historical prices of Macy’s
against those of S&P 500 and found it to be equal to 0.99. Although result is different from the one obtained
from Yahoo! Finance (0.94), Morning star (0.95) or Bloomberg (0.94), it is very close from all of them and
identical to the one published by the online investor (0.99). the reason why these betas are different could be
that companies use different computation techniques, different reference share as well as different value to
calculate it. since our beta is lower than one, we can say that Macy’s risk is lower than the market risk.
Firm Valuation
Dividend Discount Model (DDM)
The use of the Dividend Discount Model was one method used to find the stock price of
17

Macy’s. the first step toward finding the stock price of Macy’s was to compute Re using the CAPM
formula Re=rf+Rpm * , where the riskfree rate of return rf=3.00 % which is the rate of return on a β
30year treasury bill as of November 2014; beta = 0.99 and the market risk premium RPm=5%. we β
chose that value for RPm based on the analysts speculations that were evoked during class. we then
plugged all the numbers into the CAPM equation and got Re=7.95%.
consulting the historical dividend growth rate of macy’s for the past 10 years, we found that the growth
rate in 2011, 2012 and 2013 were respectively 75.00%, 128.00% and 18.75%
FY 2004
FY 2005
FY 2006
FY 2007
FY 2008
FY 2009
FY 2010
FY 2011
FY 2012
FY 2013
Dividends USD
0.27 0.39 0.51 0.52 0.53 0.2 0.2 0.35 0.8 0.95
% change
- 44.44%
30.77%
1.96% 1.92% -100.00%
0.00% 75.00%
128.00%
18.75%
after finding historical values for Macy’s dividends growth rate we looked at the predicted 5year
growth rate estimated by the analysts which is of 12.40 % according to Yahoo finance. Next using the
formula g=ROE* (1dividend per share/EPS), we computed g using ROE= 24.56% which is the value
obtained after computation of the numbers contained in Macy’s financial statements. as a value for the
dividend per share and EPS we used respectively 0.95 and 3.86. Replacing all the variables in the equation
with the numbers mentioned above we have: g=24.56* [1(0.95/3.86)] with a resulting growth rate of
18.52%. Comparing the computed value with the estimated one published on Yahoo finance, we decided to
set our g= 12.40% . this choice is justified by the fact that Macy’s sales have been stalling since july and
earlier this year, the company announced the closing of five of its stores, resulting in a cut of approximately
2500 jobs.
18

Using the dividend discount formula D1= D0* (1+g), we were able to compute the expected dividend for
2014 fiscal year and the calculation was done as follow :
D1= 0.95*(1+0.1240), yielding an expected dividend D1=0.84. after gathering all the information needed our
final step in the firm valuation using the dividend discount model was to compute Macy’s stock price. to do
so we used the formula P0=D1/(rg) where r=Re=0.0795 and g for the purpose of the calculation is equal to
the GDP which is 3.5%. We then have: P0=0.84/(0.07950.035) yielding a price stock P0= $18.87.
Valuation using Multiples
Valuation using multiples allowed us to perform a relative valuation of Macy’s Inc. to do so, we
multiplied the industry P/E ratio which is 12.06 by the EPS of Macy’s for 2013 which value is 3.86.
Replacing the variables in the equation Stock Price= P/E * EPS, we were able to find that the stock price of
Macy’s was of P0=$46.55.
Weighted average
Macy’s Inc. valuation using DDM allows to take a closer look at elements such as the firm riskiness,
the market risk premium, the dividend growth rate which are all critical in determining the stock price of a
company while the valuation using multiple provides us which a much broader view of the company that
might not necessarily reflect its true performance. For that reason, we weighted the DDM stock price at 80%
and the stock price obtained using the multiples at 20%. Applying those weight to the respective stock prices
obtained, the weighted average stock price of Macy’s was:
P0= (0.2*46.55)+(0.8*18.87)= $24.40
Conclusion and Recommendations
After analyzing Macy’s financial statements, its riskiness, its strengths and weaknesses, and overall
19

value in regards to its dividends we have concluded that Macy’s is a fairly valued firm and they can be
considered a good investment. The company is aware of the swiftly changing marketing and customer
engagement trends in the retail industry and they are implementing them. The three main retail trends Macy’s
has been integrating into their operation are Omnichannel marketing, mobile marketing, and
personalized/connected instore and online shopping experiences. Macy’s has worked to integrate each of
these and is experiencing success so they ought to continue doing this as well as listening to their customers’
preferences so they will keep up with current demands.
However, Macy’s must be aware of the internal risks of the firm and the external risks of the market
and industry it competes in. It needs to become more efficient with its inventory, maintain its unique brand
identity, and reposition itself strategically in order to achieve competitive advantage.
20

References http://workshop.macysinc.com/businessoffashion/expertise/ https://www.macysinc.com/macys/m.o.m.strategies/default.aspx http://analysisreport.morningstar.com/stock/research?t=M®ion=USA&culture=enUS&productcode=MLE http://www.forbes.com/sites/walterloeb/2013/02/27/macyslovesmomandconsumersdotoo/ http://www.hoovers.com/companyinformation/cs/competition.Macys_Inc.954ec8ce037ed0d1.html http://macysinc.com/about-us/macysinc-history/overview/default.aspx
http://web.wm.edu/americanstudies/370/2005F/sp4/home_macys_generalhistory.htm
http://macysinc.com/for-investors/store-information/overview/default.aspx
http://www.vendhq.com/retailtrendsandpredictions
http://www.heathanderson.com/MBA/mkt6340/Test1/Group3Test1Q2.pdf
http://seekingalpha.com/article/1530282ismacysbackontop?page=2
http://www.ukessays.com/essays/marketing/themacyscaseanalysismarketingessay.php
http://www.bloomberg.com/news/2014-08-13/macy-s-profit-trails-estimates-after-discounts-eat-into-marg
ins.html
http://www.nytimes.com/reuters/2014/08/13/business/13reutersmacysresults.html
http://www.bloomberg.com/markets/ratesbonds/governmentbonds/us/
http://financials.morningstar.com/ratios/r.html?t=M®ion=usa&culture=enUS
http://finance.yahoo.com/q/ae?s=M+Analyst+Estimates
http://www.tradingeconomics.com/unitedstates/gdpgrowth
http://financials.morningstar.com/valuation/priceratio.html?t=M®ion=usa&culture=enUS
21
Recommended