Michael Müller, Morten Hundt, Lukas Emmenegger, Christoph Hüglin, Béla Tuzson,
Christoph Zellweger
and many other from the
Empa, Laboratory for Air Pollution / Environmental Technology
Low-cost sensors and high-end instruments
for mapping urban NOx pollution
GAW Reactive Gases SAG Meeting, Stanley, Tasmania, 10. November 2016
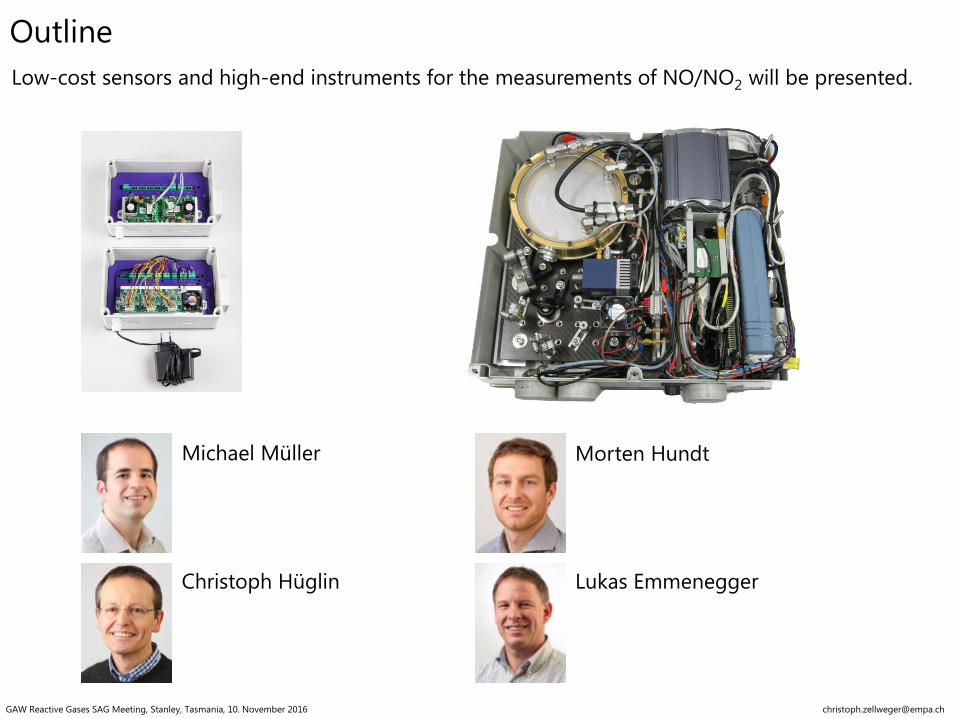
Outline
GAW Reactive Gases SAG Meeting, Stanley, Tasmania, 10. November 2016 [email protected]
Low-cost sensors and high-end instruments for the measurements of NO/NO2 will be presented.
Michael Müller
Christoph Hüglin
Morten Hundt
Lukas Emmenegger
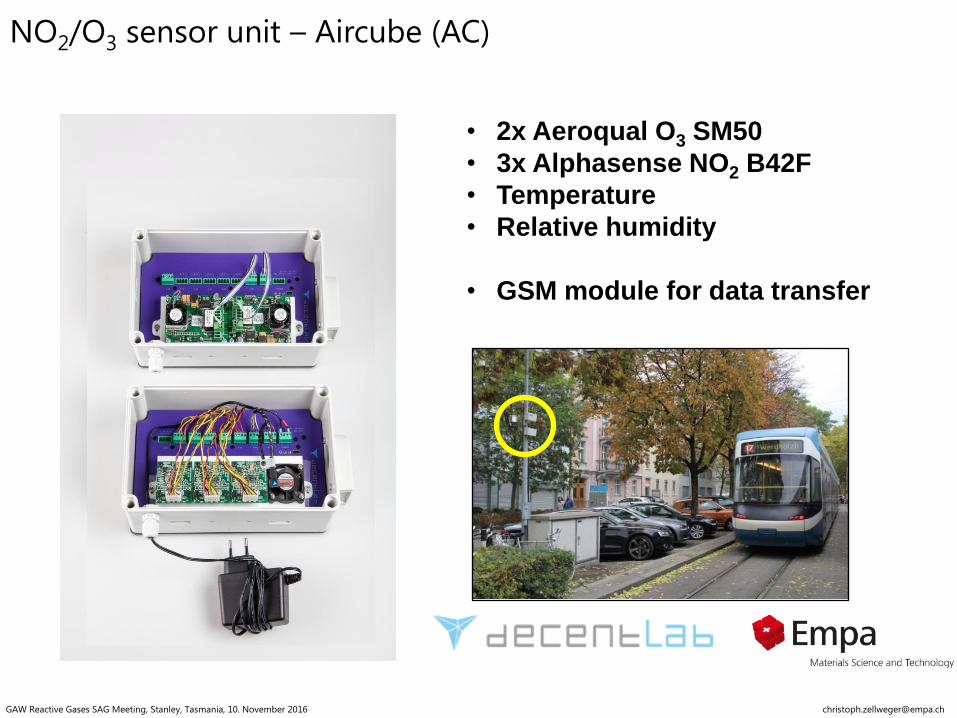
• 2x Aeroqual O3 SM50
• 3x Alphasense NO2 B42F
• Temperature
• Relative humidity
• GSM module for data transfer
NO2/O3 sensor unit – Aircube (AC)
GAW Reactive Gases SAG Meeting, Stanley, Tasmania, 10. November 2016 [email protected]
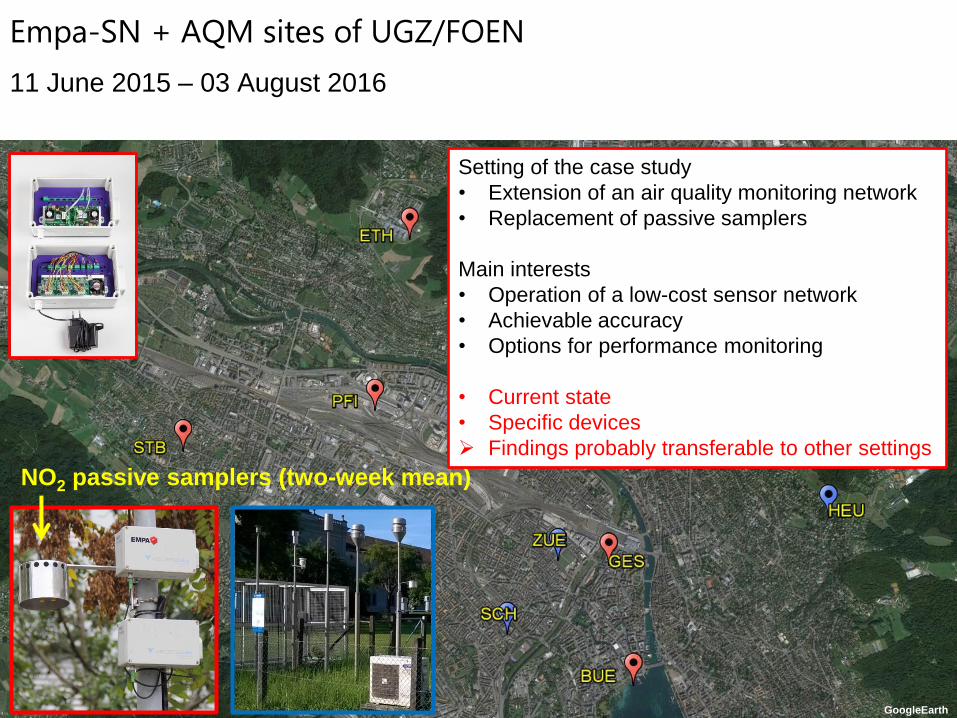
11 June 2015 – 03 August 2016
NO2 passive samplers (two-week mean)
GoogleEarth
Setting of the case study
• Extension of an air quality monitoring network
• Replacement of passive samplers
Main interests
• Operation of a low-cost sensor network
• Achievable accuracy
• Options for performance monitoring
• Current state
• Specific devices
Findings probably transferable to other settings
Empa-SN + AQM sites of UGZ/FOEN
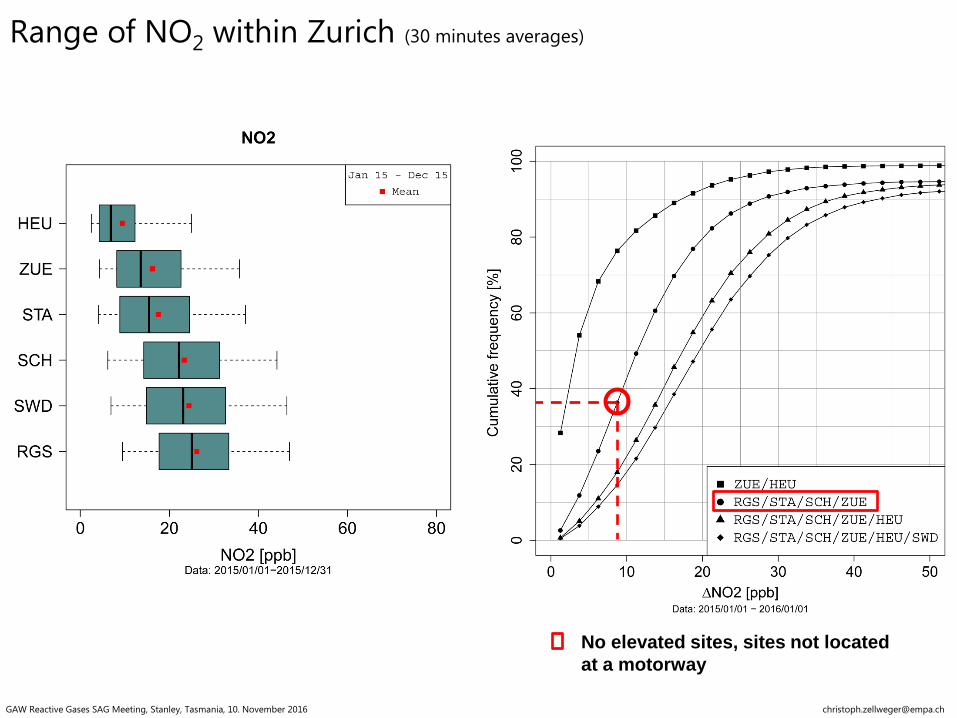
No elevated sites, sites not located
at a motorway
Range of NO2 within Zurich (30 minutes averages)
GAW Reactive Gases SAG Meeting, Stanley, Tasmania, 10. November 2016 [email protected]
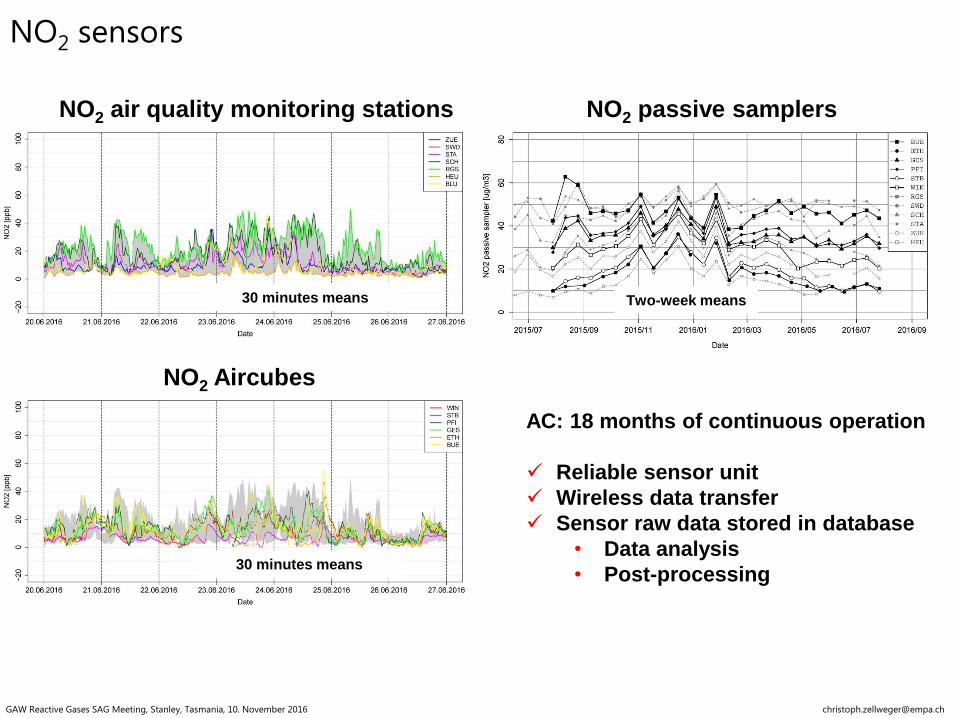
AC: 18 months of continuous operation
Reliable sensor unit
Wireless data transfer
Sensor raw data stored in database
• Data analysis
• Post-processing
NO2 air quality monitoring stations
NO2 Aircubes
NO2 passive samplers
30 minutes means
30 minutes means
Two-week means
NO2 sensors
GAW Reactive Gases SAG Meeting, Stanley, Tasmania, 10. November 2016 [email protected]
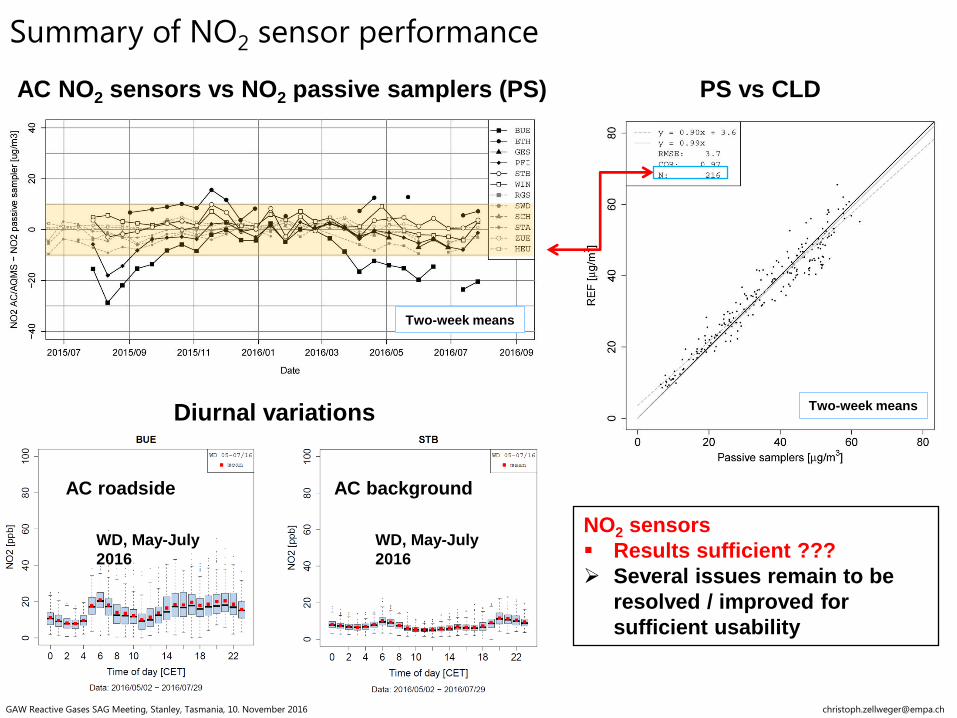
AC NO2 sensors vs NO2 passive samplers (PS) PS vs CLD
Two-week means
Two-week means
AC roadside AC background
Diurnal variations
NO2 sensors
Results sufficient ???
Several issues remain to be
resolved / improved for
sufficient usability
WD, May-July
2016
WD, May-July
2016
Summary of NO2 sensor performance
GAW Reactive Gases SAG Meeting, Stanley, Tasmania, 10. November 2016 [email protected]
REF NO2 [ppb]
AC
NO
2 [
pp
b]
REF O3 [ppb]
AC
O3 [
pp
b]
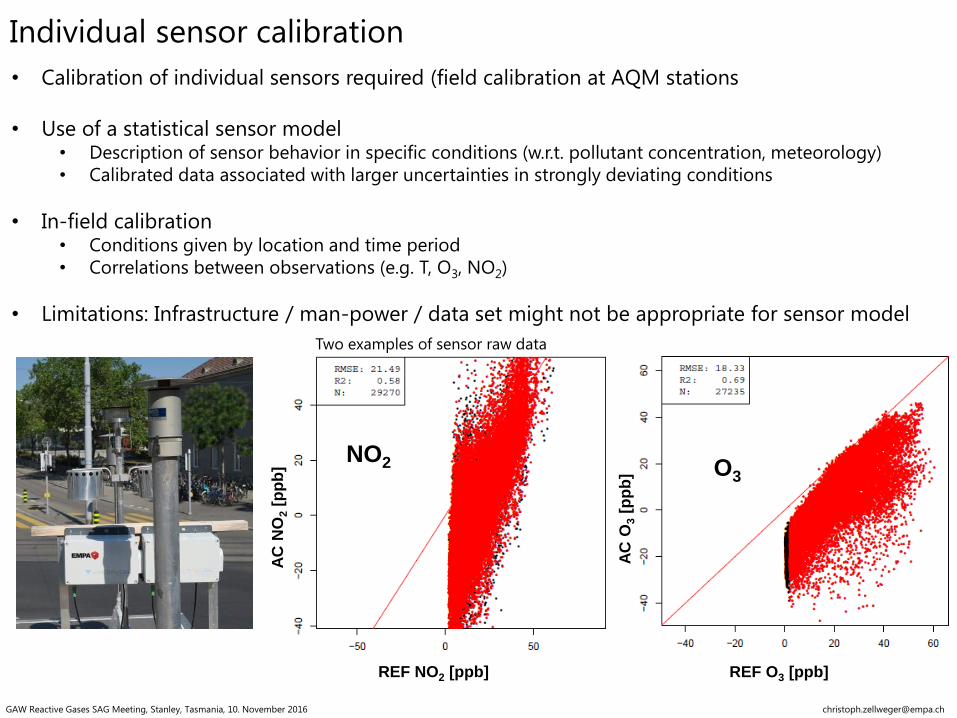
Two examples of sensor raw data
NO2 O3
Individual sensor calibration
• Calibration of individual sensors required (field calibration at AQM stations
• Use of a statistical sensor model • Description of sensor behavior in specific conditions (w.r.t. pollutant concentration, meteorology)
• Calibrated data associated with larger uncertainties in strongly deviating conditions
• In-field calibration • Conditions given by location and time period
• Correlations between observations (e.g. T, O3, NO2)
• Limitations: Infrastructure / man-power / data set might not be appropriate for sensor model
GAW Reactive Gases SAG Meeting, Stanley, Tasmania, 10. November 2016 [email protected]

AC
NO
2 [
pp
b]
REF NO2 [ppb] REF O3 [ppb]
AC
O3 [
pp
b]
Initial calibration: 06 Feb 2015 – 18 May 2015
Check: 05 Feb 2016 – 14 Mar 2016
Slow / sudden changes in sensor behavior possible
Need for continuous sensor performance monitoring / sensor adjustment
Redundancy in sensor network
Link sensor data to data from AQM sites
Changes in sensor behavior
GAW Reactive Gases SAG Meeting, Stanley, Tasmania, 10. November 2016 [email protected]
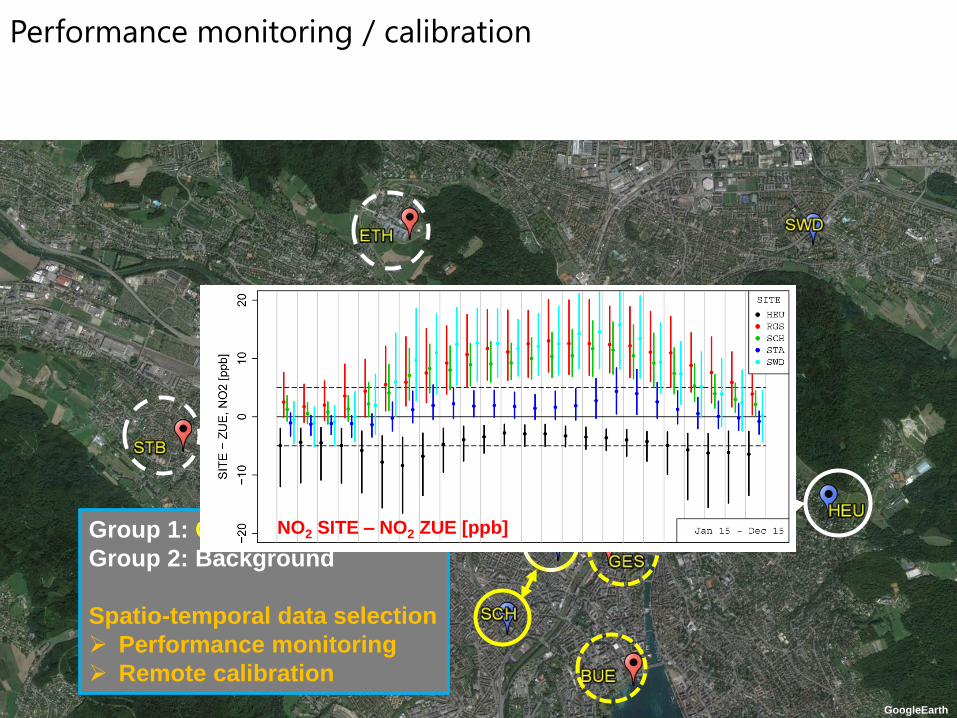
GoogleEarth
Group 1: City
Group 2: Background
Spatio-temporal data selection
Performance monitoring
Remote calibration
NO2 SITE – NO2 ZUE [ppb]
Performance monitoring / calibration

Lab tests (sensitivity to different pollutants, RH)
Sensor tests in the laboratory
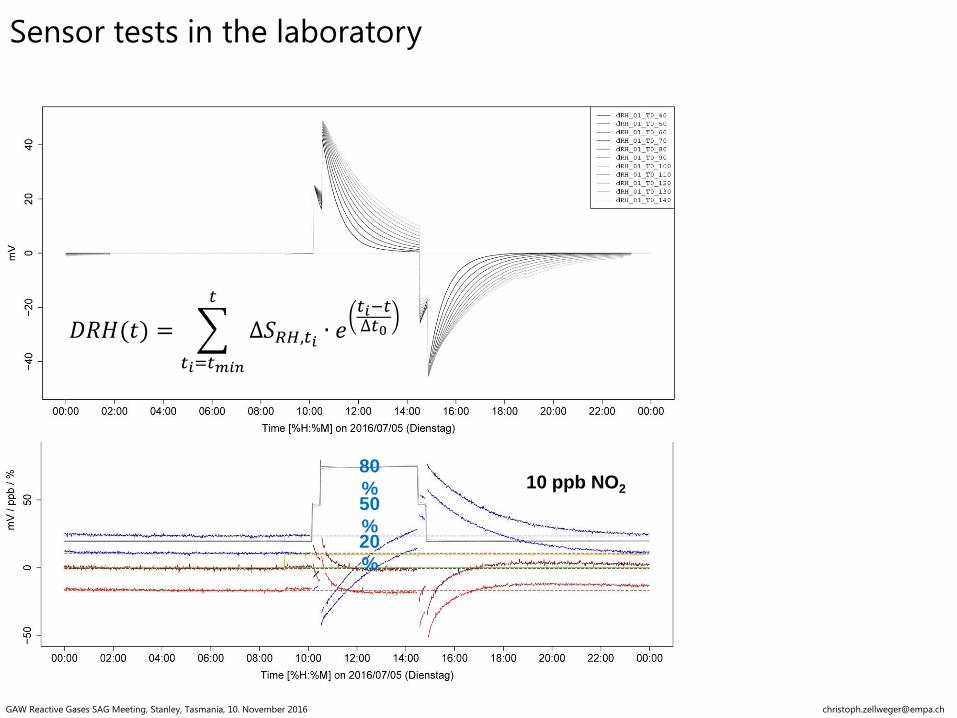
80
% 50
% 20
%
10 ppb NO2
𝐷𝑅𝐻(𝑡) = ∆𝑆𝑅𝐻,𝑡𝑖 ∙ 𝑒𝑡𝑖−𝑡∆𝑡0
𝑡
𝑡𝑖=𝑡𝑚𝑖𝑛
Sensor tests in the laboratory
GAW Reactive Gases SAG Meeting, Stanley, Tasmania, 10. November 2016 [email protected]

New features
• Single box
• 2 NO + 2 NO2
sensors
• Battery-powered
• Improved inlet
NO2 B42F
NO2 B43F
NO2
NO
Second generation Aircubes
GAW Reactive Gases SAG Meeting, Stanley, Tasmania, 10. November 2016 [email protected]
Performance of NO2 sensors good but not yet sufficient Data post-processing not trivial
Challenging to obtain accuracy of passive samplers
Optimized mathematical description of the sensor
Laboratory / Factory calibration of the sensors
o Further improved sensors needed
Comprehensive sensor testing necessary, depending on application Required accuracy
Expected operating time
Environmental conditions
Continuous performance monitoring Link between low-cost sensor data and data from AQM sites feasible
Low-cost sensors are currently by no means a suitable replacement of either traditional AQ instruments or passive samplers. However, future developmens might improve capabilities of such sensors.
Summary and conclusions low cost sensors
GAW Reactive Gases SAG Meeting, Stanley, Tasmania, 10. November 2016 [email protected]
GAW Reactive Gases SAG Meeting, Stanley, Tasmania, 10. November 2016 [email protected]
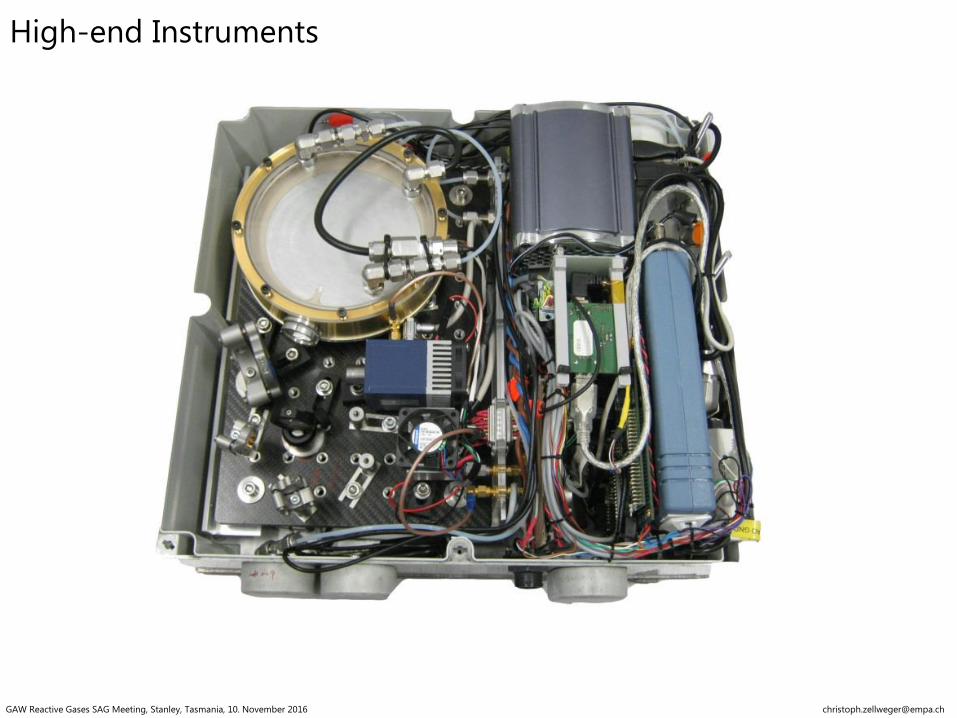
High-end Instruments
NAREP Seminar – Morten Hundt
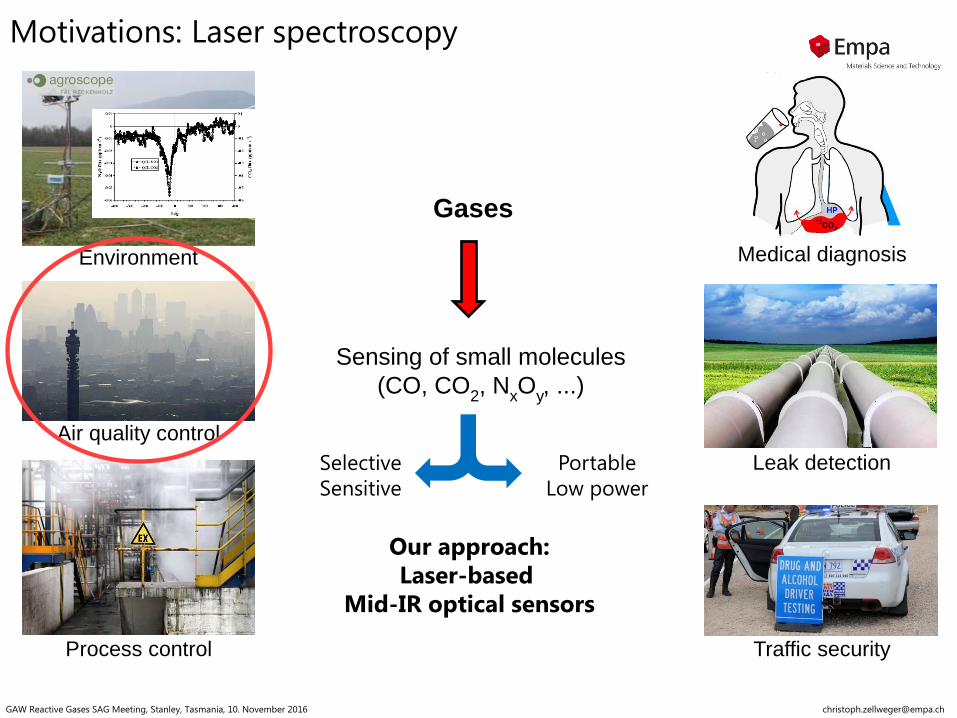
Motivations: Laser spectroscopy
Sensing of small molecules
(CO, CO2, N
xO
y, ...)
Environment
Air quality control
Process control
Medical diagnosis
Traffic security
Gases
Selective
Sensitive
Portable
Low power
Leak detection
Our approach:
Laser-based
Mid-IR optical sensors
Motivations: Laser spectroscopy
GAW Reactive Gases SAG Meeting, Stanley, Tasmania, 10. November 2016 [email protected]

NAREP Seminar – Morten Hundt
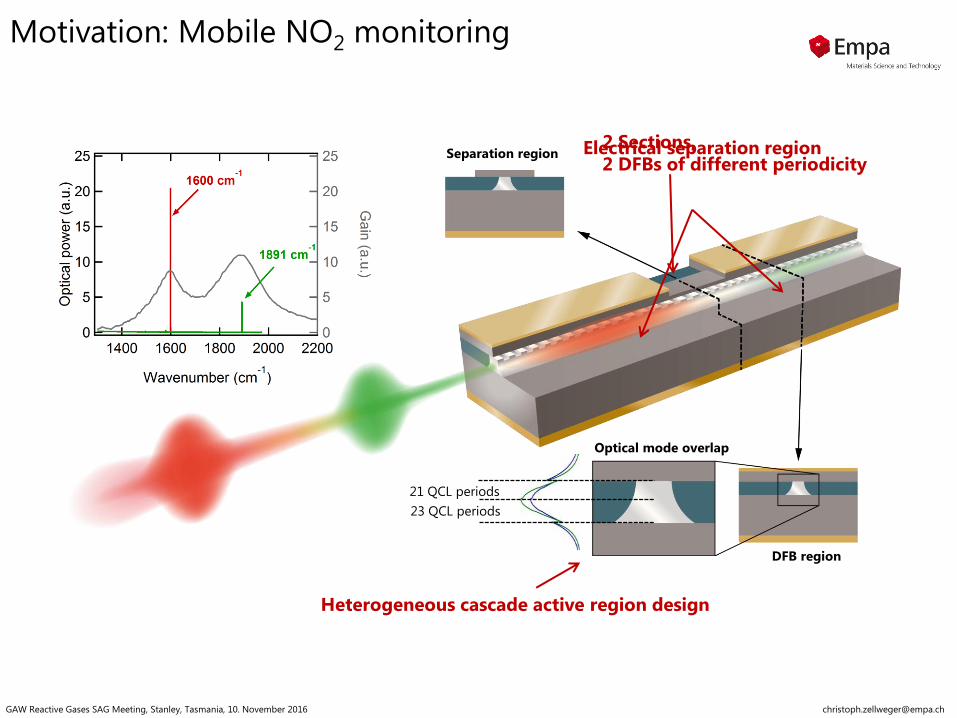
Motivation: Mobile NO2 monitoring
NO/NO2 are pollutants responsible for damage to human’s
respiratory systems
Monitoring of these gases in cities is difficult due to their large
spatial (on the scale of meters) and temporal variability
A small number of fixed measurement stations cannot give a complete
picture
Mobile measurements are an option to extend the data basis
Problem: CLD is bulky, slow and very shock sensitive, electrochemical
detectors lack sensitivity and need frequent recalibration
-> Laser spectroscopy!
Motivation: Mobile NO2 monitoring
GAW Reactive Gases SAG Meeting, Stanley, Tasmania, 10. November 2016 [email protected]
NAREP Seminar – Morten Hundt
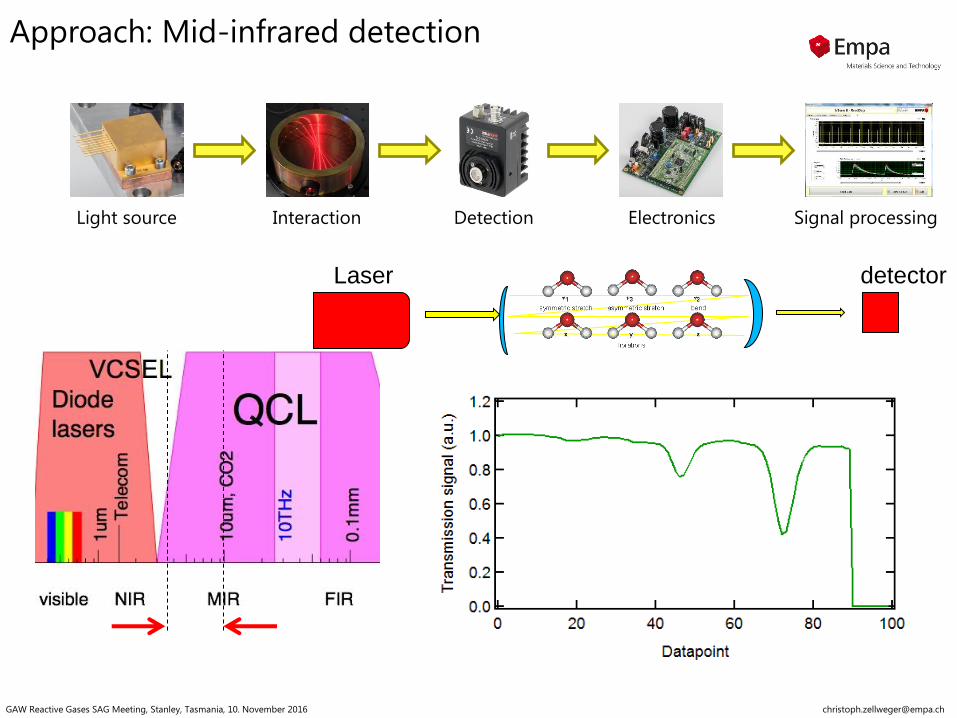
Light source Interaction Detection Signal processing Electronics
Laser detector
Approach: Mid-infrared detection
GAW Reactive Gases SAG Meeting, Stanley, Tasmania, 10. November 2016 [email protected]
NAREP Seminar – Morten Hundt
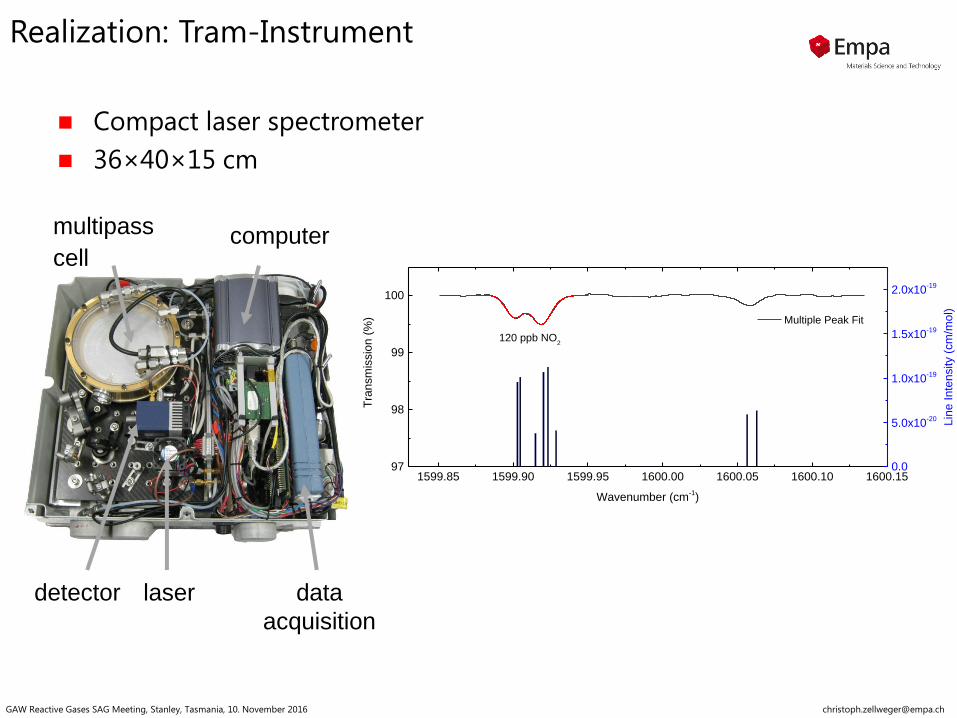
Realization: Tram-Instrument
Compact laser spectrometer
36×40×15 cm
multipass cell
computer
detector laser data
acquisition
1599.85 1599.90 1599.95 1600.00 1600.05 1600.10 1600.1597
98
99
100
Tra
nsm
issio
n (
%)
Wavenumber (cm-1)
Multiple Peak Fit
120 ppb NO2
0.0
5.0x10⁻²⁰
1.0x10⁻¹⁹
1.5x10⁻¹⁹
2.0x10⁻¹⁹
Lin
e Inte
nsity (
cm
/mol)
Realization: Tram-Instrument
GAW Reactive Gases SAG Meeting, Stanley, Tasmania, 10. November 2016 [email protected]
NAREP Seminar – Morten Hundt
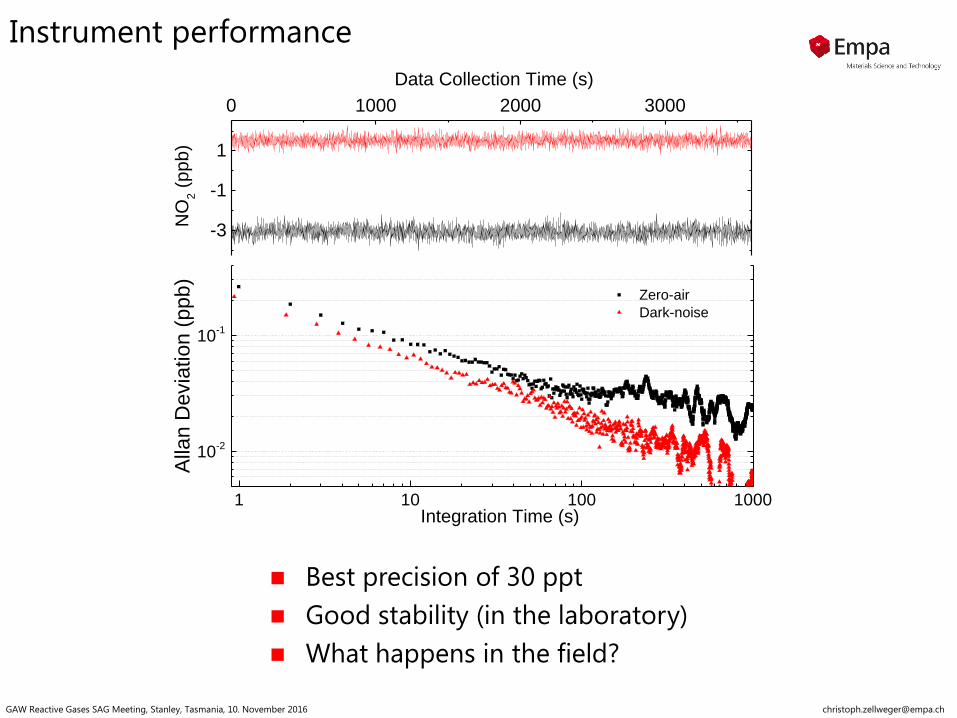
Instrument performance
Best precision of 30 ppt
Good stability (in the laboratory)
What happens in the field?
1 10 100 1000
10-2
10-1
Zero-air
Dark-noise
Alla
n D
evia
tion (
ppb)
Integration Time (s)
0 1000 2000 3000
-3
-1
1
Data Collection Time (s)
NO
2 (
pp
b)
Instrument performance
GAW Reactive Gases SAG Meeting, Stanley, Tasmania, 10. November 2016 [email protected]
NAREP Seminar – Morten Hundt
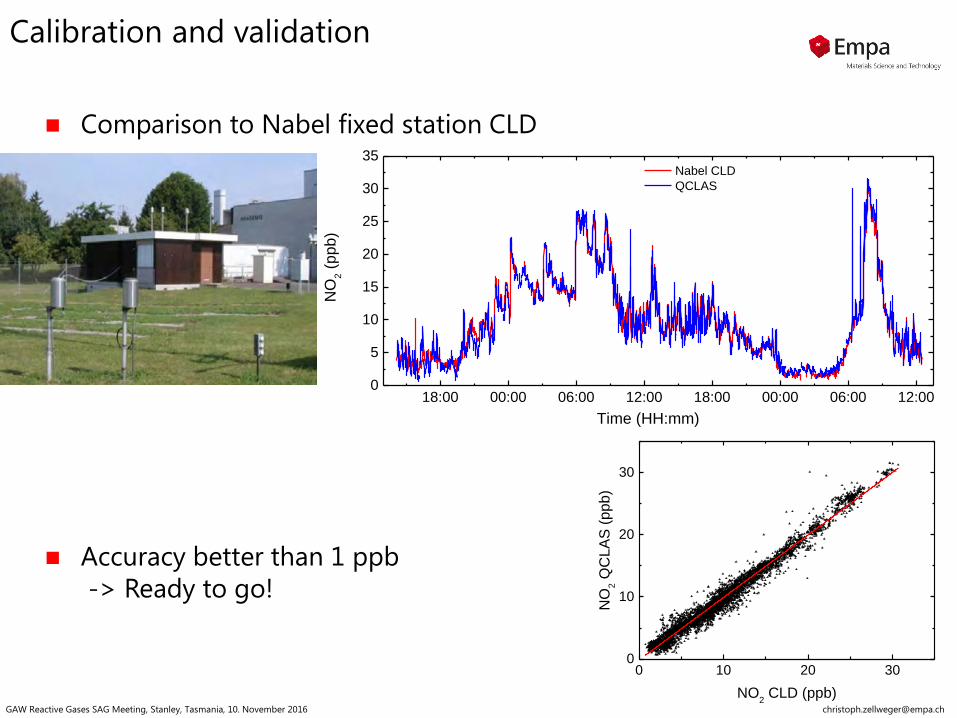
Calibration and validation
Comparison to Nabel fixed station CLD
Accuracy better than 1 ppb
-> Ready to go!
Calibration and validation
18:00 00:00 06:00 12:00 18:00 00:00 06:00 12:000
5
10
15
20
25
30
35
NO
2 (
ppb
)
Time (HH:mm)
Nabel CLD
QCLAS
0 10 20 300
10
20
30
NO
2 Q
CL
AS
(p
pb
)
NO2 CLD (ppb)
GAW Reactive Gases SAG Meeting, Stanley, Tasmania, 10. November 2016 [email protected]
NAREP Seminar – Morten Hundt
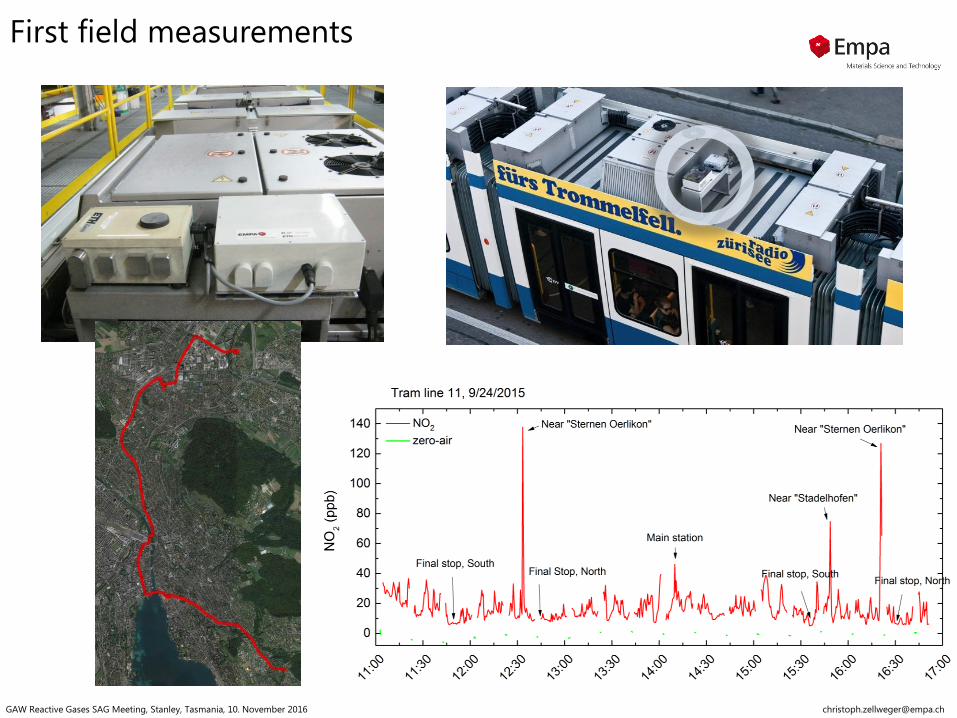
First field measurements First field measurements
GAW Reactive Gases SAG Meeting, Stanley, Tasmania, 10. November 2016 [email protected]
NAREP Seminar – Morten Hundt
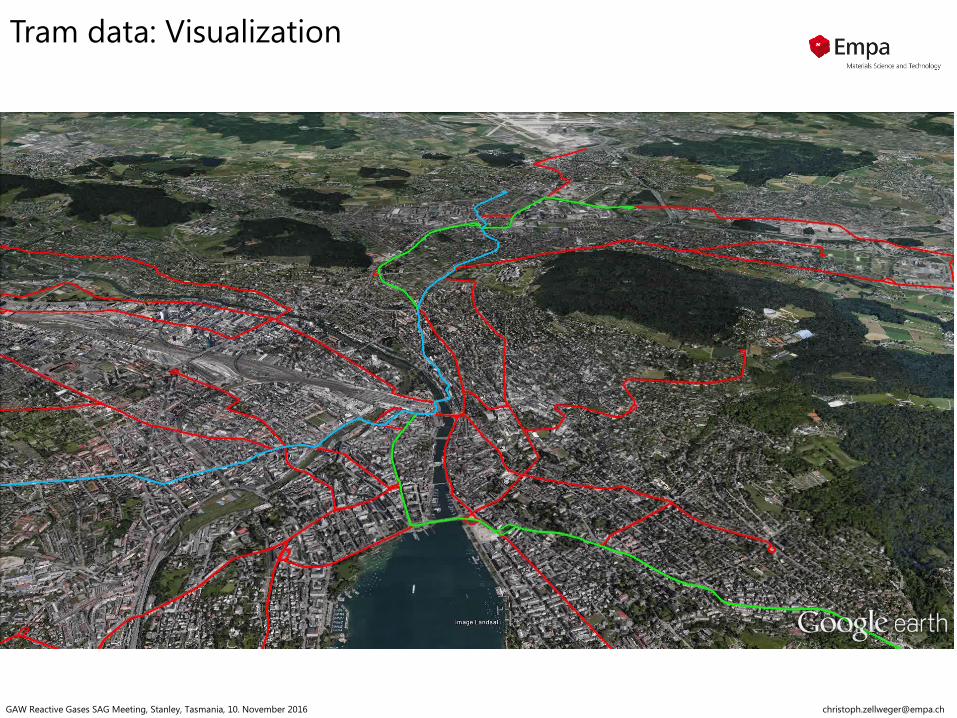
Tram data: Visualization Tram data: Visualization
GAW Reactive Gases SAG Meeting, Stanley, Tasmania, 10. November 2016 [email protected]
NAREP Seminar – Morten Hundt
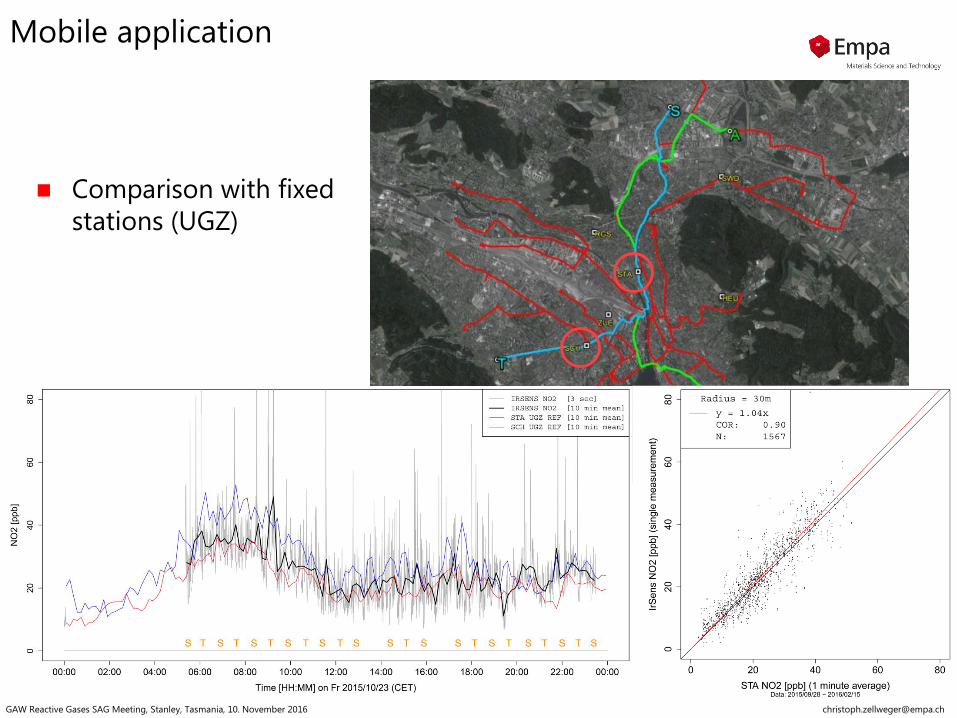
Mobile application
Comparison with fixed
stations (UGZ)
Mobile application
GAW Reactive Gases SAG Meeting, Stanley, Tasmania, 10. November 2016 [email protected]
NAREP Seminar – Morten Hundt
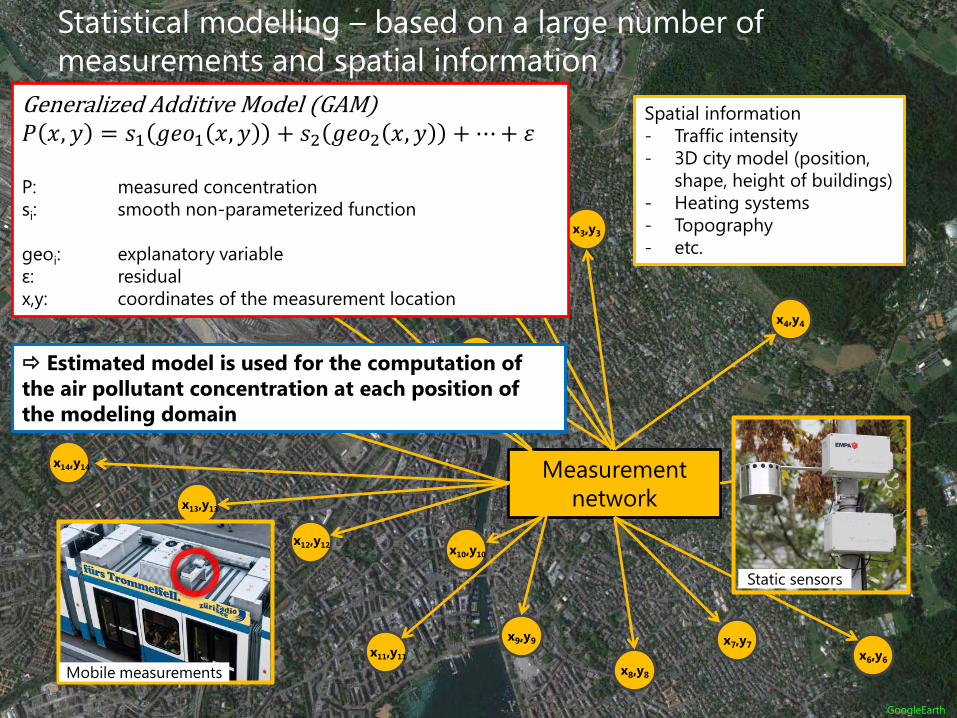
Statistical modelling – based on a large number of
measurements and spatial information
x5,y5
x12,y12
x6,y6
x18,y18
x4,y4
x15,y15
x10,y10
Measurement
network
GoogleEarth
x7,y7
x8,y8
x9,y9
x11,y11
x14,y14
x13,y13
x16,y16
x3,y3
x2,y2
x1,y1
x17,y17
Spatial information
- Traffic intensity
- 3D city model (position,
shape, height of buildings)
- Heating systems
- Topography
- etc.
Generalized Additive Model (GAM) 𝑃 𝑥, 𝑦 = 𝑠1 𝑔𝑒𝑜1 𝑥, 𝑦 + 𝑠2 𝑔𝑒𝑜2 𝑥, 𝑦 + ⋯+ 𝜀 P: measured concentration
si: smooth non-parameterized function
geoi: explanatory variable
ε: residual
x,y: coordinates of the measurement location
Mobile measurements
Static sensors
Estimated model is used for the computation of
the air pollutant concentration at each position of
the modeling domain

NAREP Seminar – Morten Hundt
Statistical modelling of NO2 in Zurich Statistical modelling of NO2 in Zurich
GAW Reactive Gases SAG Meeting, Stanley, Tasmania, 10. November 2016 [email protected]

NAREP Seminar – Morten Hundt
New Technology: Dual-color QC laser
DFB region
21 QCL periods
Optical mode overlap
23 QCL periods
Separation region
New Technology: Dual-color QC laser
GAW Reactive Gases SAG Meeting, Stanley, Tasmania, 10. November 2016 [email protected]
NAREP Seminar – Morten Hundt
New Technology: Dual-color QC laser
DFB region
21 QCL periods
Optical mode overlap
23 QCL periods
Separation region
Heterogeneous cascade active region design
Electrical separation region 2 Sections,
2 DFBs of different periodicity
Motivation: Mobile NO2 monitoring
GAW Reactive Gases SAG Meeting, Stanley, Tasmania, 10. November 2016 [email protected]
NAREP Seminar – Morten Hundt
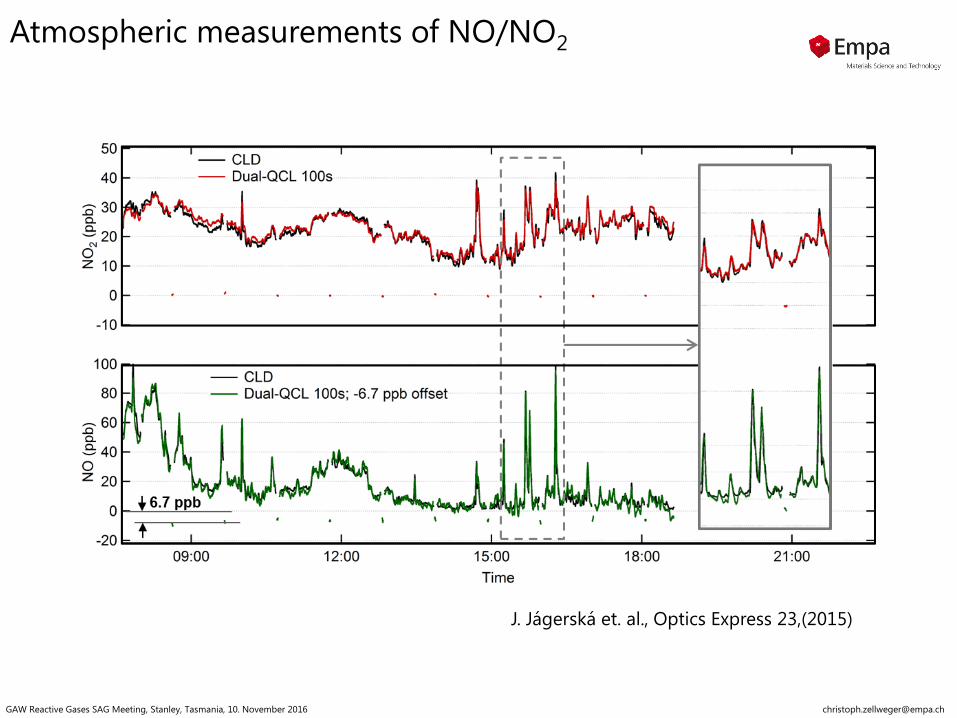
Atmospheric measurements of NO/NO2
J. Jágerská et. al., Optics Express 23,(2015)
Atmospheric measurements of NO/NO2
GAW Reactive Gases SAG Meeting, Stanley, Tasmania, 10. November 2016 [email protected]

NAREP Seminar – Morten Hundt
Conclusion
We developed a QC laser spectrometer for measurements on a tram
in Zurich
We obtained high precision NO2 data that can be used for statistical
modelling to generate pollution maps
We are developing a compact high precision dual-laser instrument
for simultaneous measurements of NO and NO2
Next steps:
Further exploration and validation of the statistical modelling for
pollution maps
Development of multi-component gas sensors
Conclusion and Outlook
GAW Reactive Gases SAG Meeting, Stanley, Tasmania, 10. November 2016 [email protected]

Thank you!
Recommended