–––
Los Cerritos Channel
Coordinated Integrated Monitoring Program
Participants Bellflower Cerritos Downey Lakewood Long Beach Paramount Signal Hill Los Angeles County Flood Control District
Prepared by:
Revised
June 29, 2015
LOS CERRITOS
CHANNEL WATERSHED


i
Contents
1 INTRODUCTION ......................................................................................................................................... 1
1.1 MONITORING OBJECTIVES .................................................................................................................................. 1
1.2 MONITORING SITES AND APPROACH ..................................................................................................................... 3
1.2.1 Receiving Water ....................................................................................................................................... 3
1.2.2 Primary Watershed Segmentation (PWS) Monitoring ............................................................................. 8
1.2.3 Non‐Stormwater Outfall Monitoring ..................................................................................................... 10
1.2.4 New Development/Re‐Development Effectiveness Tracking ................................................................. 11
1.2.5 Regional Studies ..................................................................................................................................... 11
2 OVERVIEW OF THE SCHEDULE AND SAMPLING FREQUENCIES FOR EACH CIMP ELEMENT ........................... 14
3 CHEMICAL/PHYSICAL PARAMETERS .......................................................................................................... 19
3.1 GENERAL AND CONVENTIONAL POLLUTANTS ........................................................................................................ 23
3.2 MICROBIOLOGICAL CONSTITUENTS ..................................................................................................................... 24
3.3 NUTRIENTS .................................................................................................................................................... 25
3.4 TOTAL AND DISSOLVED TRACE METALS ............................................................................................................... 26
3.5 ORGANOCHLORINE PESTICIDES AND PCBS ........................................................................................................... 27
3.6 ORGANOPHOSPHATE PESTICIDES AND HERBICIDES ................................................................................................. 29
3.7 SEMIVOLATILE ORGANIC COMPOUNDS (ACID, BASE/NEUTRAL) ............................................................................... 30
4 AQUATIC TOXICITY TESTING AND TOXICITY IDENTIFICATION EVALUATIONS .............................................. 33
4.1 SENSITIVE SPECIES SELECTION ............................................................................................................................ 33
4.2 TESTING PERIOD ............................................................................................................................................. 35
4.3 TOXICITY ENDPOINT ASSESSMENT AND TOXICITY IDENTIFICATION EVALUATION TRIGGERS ............................................. 35
4.4 TOXICITY IDENTIFICATION EVALUATION APPROACH ................................................................................................ 36
4.5 FOLLOW UP ON TOXICITY TESTING RESULTS ......................................................................................................... 38
4.6 SUMMARY OF AQUATIC TOXICITY MONITORING .................................................................................................... 39
5 RECEIVING WATER QUALITY MONITORING (WET AND DRY WEATHER) ...................................................... 41
5.1 SAMPLING FREQUENCY AND MOBILIZATION REQUIREMENTS ................................................................................... 41
5.2 SAMPLING CONSTITUENTS ................................................................................................................................ 42
6 PRIMARY WATERSHED SEGMENTATION (PWS) SITES ................................................................................ 45
6.1 SAMPLING FREQUENCY AND MOBILIZATION REQUIREMENTS ................................................................................... 45
6.2 PWS SAMPLING CONSTITUENTS ........................................................................................................................ 45
7 SECONDARY WATERSHED SEGMENTATION (SWS) SITES (WET WEATHER) .................................................. 46
8 NON‐STORMWATER (NSW) OUTFALL MONITORING .................................................................................. 48
8.1 NON‐STORMWATER OUTFALL SCREENING AND MONITORING PROGRAM ................................................................... 50
8.1.1 Identification of Outfalls with Significant Non‐Stormwater Discharges ................................................ 54
8.1.2 Inventory of MS4 Outfalls with Non‐Stormwater Discharges ................................................................ 55
8.1.3 Prioritized Source Identification ............................................................................................................. 57

ii
8.1.4 Identify Source(s) of Significant Non‐Stormwater Discharges ............................................................... 58
8.1.5 Monitor Non‐Stormwater Discharges Exceeding Criteria ...................................................................... 59
9 NEW DEVELOPMENT/RE‐DEVELOPMENT EFFECTIVENESS TRACKING ......................................................... 63
10 REPORTING............................................................................................................................................... 65
11 REFERENCES ............................................................................................................................................. 66
APPENDICES
A. AUTOMATED STORMWATER MONITORING EQUIPMENT
B. CLEANING AND BLANKING PROTOCOL FOR EQUIPMENT AND SUPPLIES USED IN COLLECTION OF
FLOW OR TIME‐WEIGHTED COMPOSITES
C. QUALITY ASSURANCE/QUALITY CONTROL
D. NON‐STORMWATER IC/ID AND OUTFALL TRACKING
E. MAJOR AND MINOR OUTFALLS TO THE LOS CERRITOS CHANNEL WATERSHED
F. GENERAL FIELD SAMPLING PROCEDURES FOR COMPOSITE AND GRAB SAMPLES
G. LOS CERRITOS CHANNEL OUTFALL INSPECTION REPORT (provided separately)
LIST OF FIGURES
Figure 1‐1. Jurisdictions Participating in the WMP and CIMP. ..................................................................... 2
Figure 1‐2. Locations of Potential Wet Weather Monitoring Sites in the Los Cerritos Channel
Watershed. .............................................................................................................................. 4
Figure 1‐3. HUC‐12 Equivalent Boundaries, Los Cerritos Watershed ............................................................ 5
Figure 1‐4. Los Cerritos Watershed Land Uses. ........................................................................................... 6
Figure 1‐5. Estimated Concentrations of Metals from each Sub‐basin of the Los Cerritos Channel
Watershed. .............................................................................................................................. 7
Figure 4‐1. Detailed Aquatic Toxicity Assessment Process ........................................................................ 40
Figure 8‐1. Flow Diagram of NSW Outfall Program after Classifying Outfalls during Initial Screening. ........ 53

iii
LIST OF TABLES
Table 1‐1. Summary of Land Use Associated with Monitored Segments of the Los Cerritos Channel
Watershed. ............................................................................................................................ 12
Table 1‐2. Monitoring Site Designation and Monitoring Function. ........................................................... 13
Table 2‐1. Schedule for Implementation of Monitoring Activities in the Los Cerritos Channel
Watershed. ............................................................................................................................ 18
Table 3‐1. Waterbody‐Pollutant Categories for the Los Cerritos Channel Watershed. .............................. 19
Table 3‐2. Summary of Constituents to be Monitored on a Regular Basis at the Mass Emission Site
(LCC1) and the Primary Watershed Segmentation (PWS) Sites. ............................................... 21
Table 3‐3. Conventional Constituents, Analytical Methods and Quantitation Limits. ............................... 24
Table 3‐4. Microbiological Constituents, Analytical Methods and Quantitation Limits. ............................ 25
Table 3‐5. Nutrients, analytical methods, and quantitation limits ............................................................ 25
Table 3‐6. Metals Analytical Methods, and Quantitation Limits. .............................................................. 27
Table 3‐7. Chlorinated Pesticides and PCB Analytical Methods, and Quantitation Limits .......................... 28
Table 3‐8. Organophosphate Pesticides and Herbicides Analytical Methods, and Quantitation Limits ...... 30
Table 3‐9. Semivolatile Organic Compounds, Analytical Methods, and Quantification Limits., ................. 31
Table 4‐1. Phase I and II Toxicity Identification Evaluation Sample Manipulations .................................. 37
Table 5‐1. Toxicity Test Volume Requirements for Aquatic Toxicity Testing as part of the Los Cerritos
Channel Coordinated Integrated Monitoring Program. ........................................................... 44
Table 6‐1. Constituents Monitored at Primary Watershed Segment (PWS) Sites. ..................................... 45
Table 8‐1. Outline of the NSW Outfall Screening and Monitoring Program. ............................................. 52
Table 8‐2. Potential Indicator Parameters for Identification of Sources of NSW Discharges. ..................... 54
Table 8‐3. Basic Database and Mapping Information for the Watershed.................................................. 56
Table 8‐4. Minimum Physical Attributes Recorded during the Outfall Screening Process. ........................ 57
Table 9‐1. Information Required in the New Development/Re‐Development Tracking Database. ............ 64

iv
ACRONYMS
ALERT AutomaticLocalEvaluationinRealTime
AMEL AverageMonthlyEffluentLimitation
BasinPlanWaterQualityControlPlanfortheCoastalWatershedsofLosAngelesandVenturaCounties
BMP BestManagementPractices
BPJ BestProfessionalJudgment
BOD BiochemicalOxygenDemand5‐day@20°C
CASQA CaliforniaStormwaterQualityAssociation
CCR CaliforniaCodeofRegulations
CD CompactDisc
CEQA CaliforniaEnvironmentalQualityAct
CFR CodeofFederalRegulations
CIMP CoordinatedIntegratedMonitoringProgram
CL ControlLimit
COD ChemicalOxygenDemand
CTR CaliforniaToxicsRule
CV CoefficientofVariation
CWA CleanWaterAct
CWC CaliforniaWaterCode
CWP CenterforWatershedProtection
Discharger LosAngelesCountyMS4PermitteesDNQ DetectedButNotQuantified
DDD Dichlorodiphenyldichloroethane
DDE Dichlorodiphenyldichloroethylene
DDT Dichlorodiphenyltrichloroethane
EFA EffectiveFiltrationArea
EIA EffectiveImperviousArea
ELAPCaliforniaDepartmentofPublicHealthEnvironmentalLaboratoryAccreditationProgram
Facility LosAngelesCountyMS4s
FEB FluorinatedEthylenePropylene
FIB FecalIndicatorBacteria
GIS GeographicalInformationSystem
gpd gallonsperday
HUC HydrologicUnitCode
IC50 Concentrationatwhichtheorganismis50%inhibited
IC/ID IllicitConnectionandIllicitDischargeElimination
IWC In‐StreamWasteConcentration
LA LoadAllocations
LACFCD LosAngelesCountyFloodControlDistrict
LARWQCB RegionalWaterQualityControlBoard,LosAngeles
LCC LosCerritosChannel
LID LowImpactDevelopment

v
LOEC LowestObservedEffectConcentration
MAL MunicipalActionLimits
MBAS MethyleneBlueActiveSubstances
MCM MinimumControlMeasure
mg/L milligramsperLiter
MDEL MaximumDailyEffluentLimitation
ME MassEmission
µg/L microgramsperLiter
MDL MethodDetectionLimit
MEC MaximumEffluentConcentration
MGD MillionGallonsPerDay
ML MinimumLevel
MRP MonitoringandReportingProgram
MS4 MunicipalSeparateStormSewerSystem
MTBE Methyltertiary‐butylether
ND NotDetected
NOEC NoObservableEffectConcentration
NPDES NationalPollutantDischargeEliminationSystem
NSW Non‐Stormwater
NTR NationalToxicsRule
OceanPlan WaterQualityControlPlanforOceanWatersofCalifornia
ORI OutfallReconnaissanceInventory
PCB PolychlorinatedBiphenyls
PWS PrimaryWatershedSegment
PES Polyester‐reinforcedpolysulfone
QA QualityAssurance
QA/QC QualityAssurance/QualityControl
QPF QuantifiedPrecipitationForecast
RAP ReasonableAssuranceProgram
RegionalWaterBoard CaliforniaRegionalWaterQualityControlBoard,LosAngelesRegion
RL ReportingLimit
RPA ReasonablePotentialAnalysis
RWL ReceivingWaterLimitations
SIPStateImplementationPolicy(PolicyforImplementationofToxicsStandardsforInlandSurfaceWaters,EnclosedBays,andEstuariesofCalifornia)
SMC StormwaterMonitoringCoalition
SMR Self‐MonitoringReports
SQO SedimentQualityObjective
SSC SuspendedSedimentConcentration
StateWaterBoard CaliforniaStateWaterResourcesControlBoard
SVOC Semi‐VolatileOrganicCompound
SWAMP State’sWaterAmbientMonitoringProgram
SWS SecondaryWatershedSegment

vi
TAC TestAcceptabilityCriteria
TIE ToxicityIdentificationEvaluation
TKN TotalKjeldahlNitrogen
TMDL TotalMaximumDailyLoad
TOC TotalOrganicCarbon
TRE ToxicityReductionEvaluation
TSD TechnicalSupportDocument
TSS TotalSuspendedSolid
TST TestofSignificantToxicity
TUc ChronicToxicityUnit
USEPA UnitedStatesEnvironmentalProtectionAgency
USGS U.S.GeologicalSurvey
WDR WasteDischargeRequirements
WET WholeEffluentToxicity
WLA WasteLoadAllocations
WMA WatershedManagementArea
WMG WasteManagementGroup
WMMS WatershedManagementModelingSystem
WMP WatershedManagementProgram
WQBELs WaterQuality‐BasedEffluentLimitations
WQS WaterQualityStandards
% Percent

1
COORDINATED INTEGRATED MONITORING PROGRAM
FOR THE
LOS CERRITOS CHANNEL WATERSHED GROUP
1 IntroductionA Coordinated Integrated Monitoring Program (CIMP) is required to be submitted either separately or as
part of a Watershed Management Plan (WMP). The CIMP is required to integrate requirements of the
current Los Angeles County MS4 Permit, the City of Long Beach MS4 permit and TMDL monitoring
requirements. This plan was developed to address five primary objectives which include:
Assess the chemical, physical, and biological impacts of discharges from the MS4s on
receiving waters.
Assess compliance with receiving water limitations and water quality‐based effluent
limitations (WQBELs) established to implement TMDL wet and dry weather load allocations
Characterize pollutant loads in MS4 discharges.
Identify sources of pollutants in MS4 discharges.
Measure and improve the effectiveness of pollutant controls implemented under the new
MS4 permits.
Figure 1‐1 provides a summary of all jurisdictions that are participating in both the WMP and the CIMP.
The Los Angeles County Flood Control District includes the entire area addressed by the Los Cerritos
Channel WMP and CIMP.
1.1 MonitoringObjectivesThe Permit Monitoring and Reporting Program (MRP) for Los Angeles County1 and the City of Long
Beach2 have equivalent requirements. The Los Cerritos Channel watershed is located in areas covered
by both permits but the requirements differ only in terms of schedules. The City of Long Beach opted to
participate in the WMP and CIMP being developed under the Los Angeles County Permit schedule but
the major elements and primary objectives listed below are identical. The CIMP is required to
incorporate the following elements and address the established objectives under each element:
Receiving Water Monitoring (Wet and Dry Weather) (Part II.E.1 of the MRP)
o Are receiving water limitations being met?
o Are there trends in pollutant concentrations over time or during specified conditions?
1 Order No. R4‐2012‐0175, NPDES Permit No. CAS004001
2 Order No. R4‐2014‐0024, NPDES Permit No. CAS004003

2
Figure 1‐1. Jurisdictions Participating in the WMP and CIMP.

3
o Are designated beneficial uses fully supported as determined by water chemistry,
aquatic toxicity, and bioassessment monitoring?
Stormwater Outfall Monitoring (Part II.E. 2 of the MRP)
o How does the quality of the permittees’ discharges compare to Municipal Action Limits
(MALs)?
o Are the permittees’ discharges in compliance with applicable stormwater WQBELs
derived from TMDL Waste Load Allocations (WLAs)?
o Do the permittees’ discharges cause or contribute to an exceedance of the receiving
water limitations?
Non‐Stormwater Outfall Based Monitoring (Part II.E.3 of the MRP)
o Are the permittees’ discharges in compliance with non‐stormwater WQBELs derived
from TMDL WLAs.
o How does the quality of the permittees’ discharges compare to Non‐Stormwater Action
Levels?
o Do the permittees’ discharges cause or contribute to an exceedance of the receiving
water limitations?
o Do the permittees comply with the requirements of the Illicit Connection and Illegal
Discharge Program?
New Development/Re‐Development Effectiveness Tracking (Part II.E.4 of the MRP)
o Are the conditions established in building permits issued by the Permittees being met?
o Are stormwater volumes associated with the design storm effectively retained on‐site?
Regional Studies
o How do the permittees plan to participate in efforts to characterize the impact of the
MS4 on receiving waters? Include participation in regional studies with the Southern
California Stormwater Monitoring Coalition (SMC) and any special studies specified in
TMDLs.
1.2 MonitoringSitesandApproachThe approach presented in this CIMP incorporates all objectives of the MRP but provides a customized
approach to address the objectives identified in the MRP for Stormwater Outfall Monitoring based upon
the unique characteristics of the LCC watershed. Unlike other WMGs in Los Angeles County, the LCC
watershed does not receive flow from other WMGs. External contributions of contaminants are limited
to atmospheric deposition originating predominantly from major transportation corridors and facilities.
Proposed monitoring sites are shown in Figure 1‐2 along with subwatershed boundaries. The Los
Cerritos Watershed HUC Equivalent map is shown in Figure 1‐3 and land use in the Los Cerritos
Watershed is shown in Figure 1‐4. From EPA TMDL modeling, estimated concentrations of metals in the
Sub‐Basins are shown in Figure 1‐5.
1.2.1 ReceivingWaterReceiving water quality monitoring will be conducted at the historic Los Cerritos Channel site at Stearns
Street (LCC1). Originally, this location was considered a mass emission monitoring site for the City’s
stormwater program since it captures runoff stormwater originating from a large segment of the City.
This site is also the compliance monitoring site for TMDL monitoring. This site is located about 100 feet

4
Figure 1‐2. Locations of Potential Wet Weather Monitoring Sites in the Los Cerritos Channel Watershed.

5
Figure 1‐3. HUC‐12 Equivalent Boundaries, Los Cerritos Watershed.

6
Figure 1‐4. Los Cerritos Watershed Land Uses.

7
Source: EPA 2010. Los Cerritos Channel Metals TMDL.
Figure 1‐5. Estimated Concentrations of Metals from each Sub‐Basin of the Los Cerritos Channel Watershed.

8
downstream of a former U.S. Geological Survey (USGS) gaging station (Figure 1‐2) and effectively marks
the downstream extent of freshwater influences within the Channel. During low tides, freshwater
extends down to the end of the concrete‐lined channel below Atherton St. LCC1 marks the upper extent
of tidal influence for all but the most extreme high tides. The portion of the Los Cerritos Channel listed
as impaired for metals was identified as the 2.1 mile freshwater portion above the tidal prism. EPA
(2010) used data from 10 years of both wet and dry weather monitoring at the LCC1 to establish the
freshwater metals TMDL for the Los Cerritos Channel. This site now has a record of stormwater and dry
weather water quality measurements that extend back for 13 years using consistent methods and, in
most cases, consistent detection limits applicable to current receiving water limitations (RWLs).
1.2.2 PrimaryWatershedSegmentation(PWS)MonitoringStormwater outfall monitoring in the LCC watershed will be addressed by partitioning the watershed
into segments that correspond to those used in the Los Cerritos Metals TMDLs to develop a model for
estimating flow and pollutant loads. This allows the modeling information to be used to assist in
directing sampling efforts to target areas of the watershed believed to contribute greater loads and
verify the accuracy of the model. If the monitoring program identifies a segment of the watershed as
contributing significantly higher pollutants loads than the segments, then further monitoring will be
conducted to further identify and isolate the source. This “forensic” monitoring would further partition
the watershed by monitoring of Secondary Watershed Segmentation (SWS) using more portable
sampling stations.
PWS sampling is intended to assist in determining whether the permittees’ discharges are causing or
contributing to exceedance of receiving water limitations, assess whether the permittees’ discharges are
in compliance with applicable WQBELs derived from TMDL WLAs and with applicable action limits. The
Los Cerritos Channel watershed is highly divided with a number of separate channels contributing flow.
In practice, no clear distinction exists between the end of the storm drain system and the start of
tributaries or receiving waters. Restricting monitoring sites to locations considered to be “outfall” sites
would limit sampling to much smaller catchments that are intended to be representative of land use
throughout the LCC watershed. This monitoring approach was not considered to be an effective
strategy for identification of the major sources of contaminants and would provide limited assistance in
directing effective implementation of control measures in this watershed.
Primary Watershed Segment (PWS) sites (Figure 1‐2) were selected based upon:
LSPC modeling results from the LCC Metals TMDL (U.S. EPA 2010);
land use characteristics within the watershed; and
the ability to isolate major portions of the watershed.
The LSPC model was used to simulate flows and metals concentrations in Los Cerritos Channel during
development of the LCC Metals TMDLs. An updated version of the LSPC serves as the basis for the Los
Angeles County Watershed Management Modeling System (WMMS). The model divided the watershed
into 10 sub‐basins (Figure 1‐2) and developed loading estimates (Figure 1‐5) for each of the sub‐basins.
The LSPC model results provided the primary guidance for selection of appropriate watershed
monitoring sites. Site selection first considered sub‐basins that the model identified as the most

9
significant sources of metals. Potential sites were considered at locations near the downstream edge of
each sub‐basin and where runoff from each sub‐basin could be effectively isolated. Land use
information for within each sub‐basin was then examined to determine dominant land uses within each
segment and assure that all major land uses would be effectively sampled. Lastly, sites were selected to
effectively represent a large proportion of the watershed and yet avoid large disparities in the sizes of
each segment such that pollutant or sediment delivery ratios3 would not vary substantially among
monitoring sites.
Sites selected as PWS sites include SB4, SB10, SB8 and SB9 (Figure 1‐2; Table 1‐2). Each of these sites
isolates significant proportions of their respective sub‐basins (4, 10, 8 and 9). Together, these
monitoring locations allow 68% of the entire watershed to be monitored. Once implemented, pollutant
loading rates for each of the PWS sites can be compared to loads measured at the downstream receiving
water site (LCC1) in order to assess potential discrepancy in load contributions and determine if further
implementation of control measures is warranted
SB4 is located in the Los Cerritos Channel just west of Lakewood Blvd. and adjacent to the Long Beach
Daugherty Airport. This site will effectively sample runoff from sub‐basin 4. LSPC modeling indicated
that this segment may be a significant source of both copper and zinc (Figure 1‐5). Land use in this
segment of the watershed (Table 1‐1) is dominated equally by the Airport (classified as mixed urban in
the model) and industrial land use. This segment represents approximately 13% of the entire LCC
watershed.
SB10 is located in the Palo Verde Channel and will collect runoff from the Sub‐Basin 10. This segment of
the watershed is comprised largely of low‐density residential neighborhoods (Table 1‐1) and represents
19% of the entire LCC watershed. The LSPC model predicted that this portion of the watershed would
produce moderate loads of copper, lead and zinc. This watershed is somewhat unique in its relatively
large size (3403 acres) and having more than 77 percent residential land use (71% low density and 6.3%
high density residential land use). Monitoring of this sub‐basin is considered to be useful in validating
the modeling results and providing improved estimates of trace metal loads from residential areas.
Sub‐basins 8 and 9 are located in northern portion of the watershed (Figure 1‐2) draining portions of
Bellflower, Downey, Lakewood, Long Beach, and Paramount. LSPC modeling indicated that these two
sub‐basins would likely yield some of the highest loads of metals (Figure 1‐5). Initial modeling indicated
that sub‐basin 9 was expected to have higher loads of copper, lead and zinc than most other areas. The
model projected that copper and lead loading would be elevated in sub‐basin 8 but this region was
expected to produce slightly lower levels of zinc. Land uses in both sub‐basins are predominantly
residential with substantial amounts of commercial activities (Table 1‐1). Together, these two sub‐
basins comprise over a third of the LCC watershed. Monitoring sites are located near the bottom of each
of these sub‐basins. SB8 is located in the Clark Channel just north of the Lakewood Civic Center and SB9
is located in the Del Amo Channel near Clark Avenue.
3 The delivery ratio of pollutant loads can be defined as the ratio of the discharged pollutant load delivered to the
point of interest divided by the mass of pollutants generated at the source.

10
Monitoring at these four PWS sites will form the backbone of the program. This program allows for an
adaptive process that enables resources to be focused on confirming modeling results and portions of
the watershed that are significant sources of contaminants and flow. Wet weather monitoring at the
LCC1 receiving water monitoring site and the four PWS sites will be used to evaluate if one or more of
these segments is contributing excessive loads of key pollutants.
Potential Secondary Watershed Segment (SWS) sites for forensic monitoring have been identified within
each of the four sub‐basins (Figure 1‐2). SWS sites are identified by the name of the sub‐basin
monitoring site followed by a hyphen and a sequential number for each added site. For example,
potential SWS sites in sub‐basin 4 are identified as SB4‐1 and SB4‐2.
Where possible, these sites are positioned at locations that further dissect the sub‐basins. In sub‐basin
4, tentative SWS sites effectively divide the sub‐basin into two areas of comparable size. SWS sites
isolate major, but unequal branches of the drainages within both sub‐basins 8 and 9. Sub‐basin 10 has a
more linear configuration that required locating potential SWS sites at two locations along the length of
the sub‐basin. These are sites where further monitoring would be conducted if one of more of the sub‐
basins is identified as having high pollutant loading rates. It is not anticipated that all secondary
sampling locations will require sampling and it is possible that none will require further sampling.
Any sampling initiated at these SWS sites would be conducted with temporary installations designed to
allow for installation within one day. Monitoring at these sites would utilize 24‐hour, time‐based
sampling triggered by flow. Sampling would be conducted concurrently with sampling of the long‐term
sub‐basin watershed sites (PWS sites) and the receiving water monitoring site (LCC1).
SWS sites will utilize time‐based monitoring methods to aid in isolating areas that may be contributing
excessive concentrations of contaminants. If monitoring data indicate that one of the two SWS sites has
elevated concentrations of any contaminant of concern, additional upstream monitoring sites will be
selected based upon the configuration of the upstream storm drains and land use. Monitoring
equipment used for the paired secondary stations would then be relocated upstream in the targeted
segment to better isolate potential sources.
1.2.3 Non‐StormwaterOutfallMonitoringNon‐Stormwater Outfall Based Monitoring will be conducted throughout the major open channels of
the Los Cerritos Channel Watershed. Initially, all pipes exceeding 12 inches in diameter and discharging
either directly into the Los Cerritos Channel receiving water or into any of the open channels will be
identified in the first screening survey. By the end of 2014, the database will be refined to determine
which of the 12‐inch to 36‐inch pipes include discharges from areas with industrial land uses. Discharge
pipes less than 36 inches and determined not to incorporate runoff from industrial land use areas will be
excluded from further surveys. After completing an inventory of the outfalls, two more screening
surveys will be conducted by the end of 2014 to document sites with persistent and significant non‐
stormwater flows. Subsequently, the source ID program will utilize an array of different methods to
assist in determining whether flows are the result of illicit connections/illicit discharges (IC/IDs),
authorized or conditionally exempt non‐stormwater flows, natural flows or unknown. These may

11
include available drainage maps, information on existing dewatering permits or industrial discharges,
and a combination of field tests and limited laboratory testing.
1.2.4 NewDevelopment/Re‐DevelopmentEffectivenessTrackingParticipating agencies have developed mechanisms for tracking information related to new and re‐
development projects that are subject to post‐construction best management practice requirements in
Part VI.D.7 of the MS4 Permit.
1.2.5 RegionalStudiesOn behalf of the participating agencies, the Los Angeles County Flood Control District (LACFCD) will
continue to provide financial and/or monitoring resources to the Southern California SMC Regional
Watershed Monitoring Program, also known as the Regionally Consistent and Integrated Freshwater
Stream Bioassessment Monitoring Program (Bioassessment Program). The Bioassessment Program was
initiated in 2009 and is structured to occur in cycles of five years. Sampling under the first cycle
concluded in 2013. The next five‐year cycle is scheduled to begin in 2015, with additional special study
monitoring scheduled to occur in 2014.
Permittee representatives will also participate in the SMC meetings and assist in development and
implementation of selected and appropriate regional studies designed to improve stormwater
characterization and impact assessment.

12
Table 1‐1. Summary of Land Use Associated with Monitored Segments of the Los Cerritos Channel Watershed.
SUB‐BASINNUMBER/ACREAGELandUse 4 8 9 10 TOTAL1
Agriculture 0.0 37.3 42.4 50.0 130
Commercial 353 507 710 372 1941
Industrial 706 125 500 59.0 1390
HDResidential 40.0 371 491 213 1115
LDResidential 276 1,598 1,783 2,416 6072
MixedUrban 753 13.6 120 142 1029
Open 144 60.4 63.9 152 419
TotalAcres 2,271 2,712 3,710 3,403 12,096
Total Watershed Acres 17,716
SUB‐BASINNUMBER/%LandCover 4 8 9 10 ‐
Agriculture 0.0 1.4 1.1 1.5 0.7
Commercial 15.5 18.7 19.1 10.9 11.0
Industrial 31.1 4.6 13.5 1.7 7.8
HDResidential 1.8 13.7 13.2 6.3 6.3
LDResidential 12.2 58.9 48.1 71.0 34.3
MixedUrban 33.2 0.5 3.2 4.2 5.8
Open 6.3 2.2 1.7 4.5 2.4
Total% 13 15 21 19 68
HD= High Density, LD= Low Density 1Land use composition for all 10 sub‐basins can be accessed in the Los Cerritos Channel Metals TMDLs (EPA 2010)

13
13
Table 1‐2. Monitoring Site Designation and Monitoring Function.
SiteName SiteDescription
DatumNAD83TypeofSite
Receiving Water
TMDL WATERSHED
Latitude (N) Longitude (W) Primary Secondary1
LCC1 Stearns Street 33.79538 118.10361 X X X
SB4 Sub‐basin 4 – Spring St. Drain 33.81306 118.13953 X X
SB8 Sub‐basin 8 – Clark Drain 33.85384 118.13226 X X
SB9 Sub‐basin 9 – Del Amo/Downey 33.84682 118.13370 X X
SB10 Sub‐basin 10 – Palo Verde 33.81044 118.11430 X X
SB4‐1 Northern Sub‐basin1 33.81316 118.14235 X
SB4‐2 Southern Sub‐basin1 33.81288 118.14249 X
SB8‐1 North Clark Channel1 33.86848 118.13355 X
SB8‐2 West Clark Channel1 33.86783 118.13225 X
SB9‐1 West Downey Channel1 33.84908 118.15978 X
SB9‐2 North Downey Channel1 33.85844 118.15046 X
SB10‐1 North Palo Verde Channel1 33.86546 118.11160 X
SB10‐2 Mid Palo Verde Channel 33.83210 118.10836 X 1 These locations are tentative sites and will be further evaluated as part of the adaptive management of the CIMP. Monitoring at secondary
sites will be dependent upon the monitoring results at each of the Primary Watershed Sites.

14
Page Left Intentionally Blank

15
2 Overviewof the Schedule and Sampling Frequencies for eachCIMPElement
The CIMP will be implemented in a phased process (Table 2‐1). Existing monitoring at LCC1 continues to
be conducted, and the dry weather screening of major outfalls has commenced. Implementation of new
monitoring programs and modifications to the existing monitoring program at LCC1 will be implemented
beginning July 1, 2015 or 90 days after the approval of the CIMP, whichever is later.
Receiving Water Quality Monitoring
Monitoring will occur at one Receiving Water Quality Monitoring Site, LCC1, which will also
serve as the LCC Metals TMDL compliance site.
Monitoring will be conducted during two dry weather and four wet weather events per year.
This allows alignment of monitoring the Receiving Water and Stormwater Outfall Monitoring
requirements of the Permit with TMDL Monitoring. Alignment of these monitoring
requirements allows for a more efficient and cost effective program. The Watershed Group will
use wet‐weather monitoring results from the first year to consider requesting a reduction in
frequency to three wet‐weather events in the future. The fourth storm event is only for the
purpose of fulfilling the TMDL requirements. Only copper, lead, zinc, total suspended solids
(TSS), suspended sediment concentration (SSC), and hardness will be analyzed.
Monitoring of the two dry weather flows will start in July 1, 2015 or 90 days after approval of
the CIMP, whichever is later. Wet season monitoring will follow for four storm events during the
2015/16 wet season.
Water quality testing during the critical dry weather flows (July) and during the first significant
storm event of the year will incorporate the entire list of water quality parameters listed in
Table E‐2 of the MRP. Water quality testing during the remaining two wet weather events and
one dry weather event will incorporate all constituents identified in Table 3.2 (See Section 3) for
the Los Cerritos Channel receiving waters.
If Table E‐2 constituents are not detected at the specified Method Detection Limit (MDL) for
their respective test method or if the results are below the lowest applicable water quality
objective, and is not otherwise identified as being 303(d)‐listed or part of an ongoing TMDL, the
analyte will not be further analyzed. In accordance with the minimum requirements established
in the Permit MRP (page E‐16) parameters exceeding the lowest applicable water quality
objective will continue to be analyzed for the remainder of the Order at the receiving water
monitoring station.
The Aquatic Toxicity Testing program will be initiated during the 2015 dry weather season at
LCC1. Aquatic Toxicity Testing will be conducted during one dry weather monitoring event
when critical low flow conditions are expected and during two storm events including the first
major storm of the year.

16
Primary Watershed Segmentation (PWS) Stormwater Monitoring
Due to water conservation in response to drought and greatly reduced dry‐weather discharges,
the drainage area is already in compliance with dry‐weather copper WLA at Stearns Street. The
watershed segment monitoring program is designed to help demonstrate compliance with wet‐
weather WLAs. A phased‐in approach will be employed for monitoring sites.
Two PWS sites, SB4 and SB10, will be installed and ready for monitoring during the 2015/16 wet
season. SB8 and SB9 will be installed and prepared to monitor storm events during the 2016/17
wet season, and will complete the planned array of four PWS sites.
Two portable monitoring units, SBX‐1 and SBX‐2, will be installed in 2017‐2018 to monitor
secondary watershed segments based on results of primary watershed segment monitoring.
When possible, PWS sampling will be conducted concurrently with stormwater monitoring at
LCC1. This will result in three monitored stormwater events for each PWS site as they are
installed and ready for collection of flow‐rated composite samples.
Water quality testing at PWS sites will initially incorporate a list of general and conventional
pollutants, E. coli, nutrients, and metals. A detailed list of analytes to be initially tested at PWS
sites is addressed in Section 3.1.
Additional water quality parameters listed in Table E‐2 of the MRP may be incorporated based
upon results of stormwater monitoring at the receiving water station, LCC1. These constituents
will be added to monitoring requirements at PWS sites once an analyte is detected in
stormwater runoff at LCC1 during two consecutive stormwater monitoring events. Similarly, if
analytes added the PWS monitoring are not detected at PWS sites during two consecutive
stormwater monitoring events, they will be removed from the required analytical list.
Once a minimum of two seasons of wet weather monitoring data (six events) are available from
a PWS site, data will be evaluated to determine if forensic monitoring is necessary to assist in
source tracking and identifying upstream sources of key pollutants. Forensic monitoring would
be conducted by further dividing the watershed with Secondary Watershed Segmentation (SWS)
sites. Potential SWS sites have been identified for each of the four PWS sites but these sites will
only be used if water quality constituents measured at the PWS sites are sufficiently elevated to
warrant implementation of forensic monitoring.
Sampling at SWS sites would be performed with temporary, mobile stormwater sampling
stations used to take time‐based composite samples and would focus on the specific analytes of
concern as well as any appropriate ancillary analytes. Source tracking would be triggered if
running averages measured at a PWS site exceeds Municipal Action Limits (MALs; Attachment G
of the MRP) by more than 20% any analytes that have limits and that are required to be sampled
at the PWS sites. Similarly, forensic sampling would also be conducted if the running average
pollutant loading rates for Category 1 or 2 pollutants are found to exceed those measured at
LCC1 (the Los Cerritos Channel receiving water/TMDL monitoring site) by more than 25%.

17
Non‐Stormwater Outfall Monitoring Program
Three initial surveys will be completed. The first will focus upon verification of outfalls as
identified based upon available City and County GIS records, providing baseline photographic
records, assessing flow, recording observations, and field water quality measurements. An
inventory of outfalls above 12 inches in diameter will be created. The second and third
screening surveys will expand field water quality testing to assist in the identification and
classification of the discharge.
Information from the three initial surveys will be used to determine which outfalls have
significant discharges and classify these outfalls for further investigation. Information from the
three surveys such as flow rates of the discharge, flow rates in the channel, the nature of the
channel‐earthen or concrete, and land uses in the drainage area will be used collectively to
determine significance.
Outfalls with significant flow will be classified for further investigation. Flow measurements,
observations, field water quality tests and limited laboratory tests may be used to classify the
remaining outfalls as either Suspect Discharges, Potential Discharges or Unlikely discharges of
concern. Clean outfalls with no evidence of discharges or odors during the initial surveys will be
classified as Unlikely sources of non‐stormwater discharges and will not require further
investigation.
Outfalls considered having the highest risk for illicit discharges or illegal flows will be classified as
Suspect Discharges. This will require multiple lines of evidence indicative of potential illicit
discharges or persistent high flows that represent significant receiving waters contributions.
Outfalls considered to be Suspect Discharges will be further classified and ranked for further
investigations designed to identify the sources of these discharges and to determine whether
discharges are illicit, exempt, conditionally exempt, conditionally exempt but non‐essential
flows or unknown.
Suspect outfalls determined to have exempt or conditionally exempt discharges will be
identified in annual reports along with the measures taken to identify the sources.
Suspect outfalls identified with conditionally exempt but non‐essential flows or flows from
unknown sources will be first be subject to review to determine if suitable control measures can
be implemented to eliminate the discharges.
If discharges cannot be eliminated, they will be subjected to a periodic monitoring to document
that sufficient measures are taken to control potential discharges of pollutants in the discharge.
Source investigations for discharges from outfalls classified as suspect will be ongoing in order to
meet the requirement that investigations are conducted for no less than 25% of the outfalls in
the inventory by December 2015 and 100% of the outfalls in the inventory by December 2017.
Outfalls classified as Potential Discharges will be reassessed during the permit.
Outfalls with obvious illicit discharges will be immediately classified as such and investigated
immediately.

18
Table 2‐1. Schedule for Implementation of Monitoring Activities in the Los Cerritos Channel Watershed7.
Task Dry 2014
Dry 2015
Wet 2015‐16
Dry 2016
Wet 2016‐17
Dry 2017
Wet 2017‐18
Dry 2018
Receiving Water/TMDL LCC1 Stearns St. Chemistry1
Aquatic Toxicity
Note 6
2 1
4 2
2 1
4 2
2 1
4 2
2 1
Primary Watershed Segments SB10 SB4 SB8 SB9
3 3
3 3 3 3
3 3 3 3
Secondary Watershed Segments2
SBX‐1 SBX‐2
3 3
Non‐Stormwater Outfall
Inventory & Screen3
Source ID4
Monitoring5
3
Ongoing
Ongoing 2
Ongoing2
Ongoing2
1. Table E‐2 chemical analyses will be performed once during the first wet weather event and once during the first critical dry weather monitoring event. Constituents that exceed MDLs and
available water quality objectives will continue to be monitored along with all constituents included as Category 1, 2 or 3 water body/pollutant classifications for the subject water body.
Wet and dry weather chemical constituents will be separately assessed for purposes of continued monitoring. All constituents classified as category 1, 2, and 3 water body/pollutant in the
water body will continue to be monitored during the permit cycle unless the constituents (primarily category 3 constituents) are shown to not be present at levels of concern on a
consistent basis.
2. Initial locations of Secondary Watershed Segmentation (SWS) sites have been selected for each Primary Watershed Segment (PWS). Implementation of monitoring at SWS site will be
dependent upon results of monitoring at PWS sites (e.g. exceedance of action limits).
3. Initial Inventory and Screening will be completed in three surveys before the end of 2014. One re‐assessment of the Non‐Stormwater Outfall Monitoring Program will be conducted prior to December 2017.
4. Investigations designed to track and classify discharges will start during the 2015 dry season. Source tracking and classification work depend upon the number of sites categorized as Suspect outfalls with evidence of significant flow.
5. Monitoring will be implemented if significant dry weather flows are identified at discharge points that are cannot be identified, are non‐essential exempt flows, or identified as illicit flows that are not yet controlled. These sites will be initially monitored twice a year in conjunction with dry weather monitoring of the receiving water site.
6. Monitoring at LCC1 will continue to be conducted in accordance with the existing permit until the CIMP is approved. 7. The fourth storm event is only for the purpose of fulfilling the TMDL requirements. Only metals, TSS, SSC, and hardness will be analyzed.

19
3 Chemical/PhysicalParametersSection 2 of the WMP provides a detailed analysis of water quality priorities within the Los Cerritos
Channel Watershed. Water quality priorities were established in accordance with Section C.5.a.ii of the
Permit. The three Permit categories are defined as:
Category 1 (Highest Priority): Water body‐pollutant combinations for which water quality‐based
effluent limitations and/or receiving water limitations are established in Part VI.E and
Attachments L through R of the Order.
Category 2 (High Priority): Pollutants for which data indicate water quality impairment in the
receiving water according to the State’s Water Quality Control Policy for Developing California’s
Clean Water Act Section 303(d) List (State Listing Policy) and for which MS4 discharges may be
causing or contributing to the impairment.
Category 3 (Medium Priority): Pollutants for which there are insufficient data to indicate water
quality impairment in the receiving water according to the State’s Listing Policy, but which
exceed applicable receiving water limitations contained in this Order and for which MS4
discharges may be causing or contributing to the exceedance.
These Permit categories were intended to be specific to water bodies within the watershed but, in the
case of the Los Cerritos Channel, data are limited to a single point in the watershed. Table 3‐1
summarizes pollutants within each category.
Table 3‐1. Waterbody‐Pollutant Categories for the Los Cerritos Channel Watershed.
Category Constituents
1 copper, lead, zinc, DDT, chlordane, PCBs, PAHs
2 ammonia, bis(2)ethylhexylphthalate, E. coli, pH
3 MBAS, enterococcus
The primary constituents of concern in the watershed are copper, lead and zinc which are part of the
Los Cerritos Channel Metals TMDLs. Chlordane, DDTs, PCBs and PAHs are incorporated due to a 303(d)
listing for chlordane in sediments downstream in the tidal portion of the channel and the Harbor Toxics
TMDL for which the Los Cerritos Channel is considered part of the nearshore watershed4. Permittees in
4 Asrecognizedbythe footnote inAttachmentK‐4of thePermit, theCitiesofBellflower,Cerritos,Downey,Lakewood, Long Beach, Paramount, Signal Hill, and the LACFCD have entered into an Amended ConsentDecreewiththeUnitedStatesandtheStateofCalifornia,includingtheRegionalBoard,pursuanttowhichtheRegional Board has released the aforementioned entities from responsibility for toxic pollutants in theDominguezChannelandtheGreaterLosAngelesandLongBeachHarbors.Accordingly,noinferenceshouldbedrawnfromthesubmissionofthisCIMPorfromanyactionorimplementationtakenpursuanttoitthattheaforementionedentitiesareobligatedtoimplementtheDominguezChannelandGreaterLosAngelesandLongBeachHarborWatersToxicPollutantsTMDL,includingthisCIMPoranyoftheTMDL’sotherobligationsorplans,orthattheaforementionedentitieshavewaivedanyrightsundertheAmendedConsentDecree.

20
the nearshore watershed are separately contributing to monitoring requirements in the Harbor waters
and the Los Angeles River Estuary. Therefore DDTs, PCBs and PAHs are not currently incorporated into
the sampling requirements for the ME and PWS monitoring sites. Two other constituents, ammonia and
pH, are 303(d) listed due to dry weather flows where extremely shallow flows cause a daily cycle of pH
and result in calculated ammonia water quality criteria to be exceeded despite extremely low
concentrations. Additional listings exist for minor exceedances of methylene blue active substances
(MBAS) criteria and exceedance of coliform and enterococcus bacteria. Enterococcus bacteria are
limited to LCC1 since this site discharges to an estuarine environment.
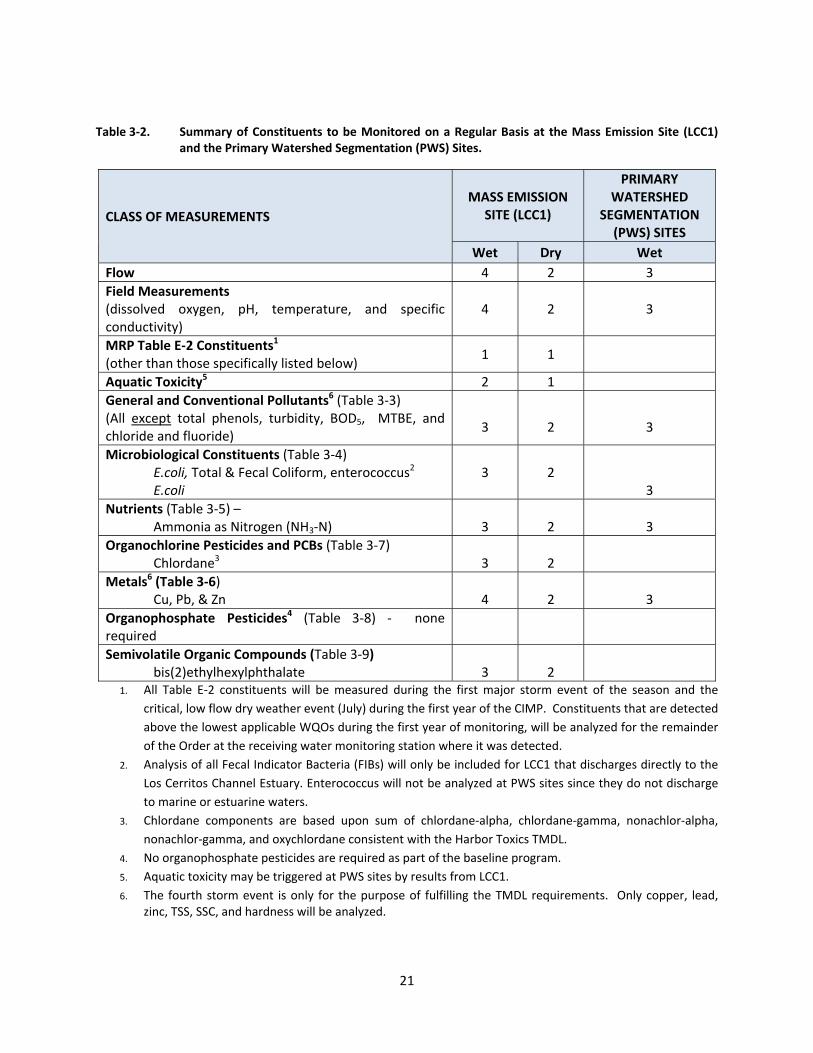
Table 3‐2 summarizes the constituents that will be monitoring at the ME and PWS sites. These
constituents will serve as the core of the monitoring program. In addition, sections VI.C.1.e and VI.D.1.d
of the MRP require that a comprehensive list of constituents is screened once during the first major
storm event of the year and once during a period of critical low flow. Results of this analytical screening
process will determine which constituents need to be analyzed at the mass emission site for the
remainder of the five‐year cycle of the permit.
If a parameter is not detected above the Method Detection Limit (MDL) for its respective test method or
the result is below the lowest applicable water quality objective, and is not otherwise identified as a
basic monitoring requirement, a TMDL analyte or a 303(d) listing, it need not be further analyzed. If a
parameter is detected exceeding the lowest applicable water quality objective during either the wet or
dry weather screening then the parameter shall be analyzed for the remainder of the Order (2017) at
the receiving water monitoring station where it was detected during the respective conditions (wet or
dry).
Analytical tests will be reconsidered at least once during each permit cycle in order to assess the
appropriateness of maintaining the analyte or suite of analyses in the testing requirements. Water
quality criteria, analytical methods, analytical results consistently near detection limits, updated
information with respect to sources or many other additional factors may contribute to factors may
warrant reconsideration of the analyte. If an analyte listed in Table E‐2 (Attachment E of the Permit) is
not detected at levels of concern during two consecutive monitoring events representing the same
seasonal conditions, the Watershed Group will submit a request to the Regional Board to remove the
analyte from future sampling. This does not include constituents which are basic monitoring
requirements. In order to avoid bias due to seasonal build‐up/wash off, this evaluation would be limited
to the comparisons of the first major storm of the season rather than data consecutive events from the
same season.
Constituents requiring screening are listed in Table E‐2 of the Monitoring and Reporting Program. These
constituents are further broken out by major analytical groups in Table 3‐3 through Table 3‐9 below.
21
Table 3‐2. Summary of Constituents to be Monitored on a Regular Basis at the Mass Emission Site (LCC1) and the Primary Watershed Segmentation (PWS) Sites.
CLASS OF MEASUREMENTS
MASS EMISSION SITE (LCC1)
PRIMARY WATERSHED
SEGMENTATION (PWS) SITES
Wet Dry Wet
Flow 4 2 3
Field Measurements (dissolved oxygen, pH, temperature, and specific conductivity)
4 2 3
MRP Table E‐2 Constituents1 (other than those specifically listed below)
1 1
Aquatic Toxicity5 2 1
General and Conventional Pollutants6 (Table 3‐3) (All except total phenols, turbidity, BOD5, MTBE, and chloride and fluoride)
3
2
3
Microbiological Constituents (Table 3‐4) E.coli, Total & Fecal Coliform, enterococcus2 E.coli
3
2
3
Nutrients (Table 3‐5) – Ammonia as Nitrogen (NH3‐N)
3
2
3
Organochlorine Pesticides and PCBs (Table 3‐7) Chlordane3
3
2
Metals6 (Table 3‐6) Cu, Pb, & Zn
4
2
3
Organophosphate Pesticides4 (Table 3‐8) ‐ none required
Semivolatile Organic Compounds (Table 3‐9) bis(2)ethylhexylphthalate
3
2
1. All Table E‐2 constituents will be measured during the first major storm event of the season and the
critical, low flow dry weather event (July) during the first year of the CIMP. Constituents that are detected
above the lowest applicable WQOs during the first year of monitoring, will be analyzed for the remainder
of the Order at the receiving water monitoring station where it was detected.
2. Analysis of all Fecal Indicator Bacteria (FIBs) will only be included for LCC1 that discharges directly to the
Los Cerritos Channel Estuary. Enterococcus will not be analyzed at PWS sites since they do not discharge
to marine or estuarine waters.
3. Chlordane components are based upon sum of chlordane‐alpha, chlordane‐gamma, nonachlor‐alpha,
nonachlor‐gamma, and oxychlordane consistent with the Harbor Toxics TMDL.
4. No organophosphate pesticides are required as part of the baseline program.
5. Aquatic toxicity may be triggered at PWS sites by results from LCC1.
6. The fourth storm event is only for the purpose of fulfilling the TMDL requirements. Only copper, lead, zinc, TSS, SSC, and hardness will be analyzed.

22
Analytical requirements for the program are broken out by analytical test requirements since many are
associated with an analytical test suite. This is most evident with the semivolatile organic compounds
analyzed by EPA Method 625. Although this section identifies recommended methods for each analyte,
many of the target constituents can be addressed by alternative methods. Use of alternative analytical
methods may be preferable in cases where a larger suite of target analytes can be tested and still enable
meeting minimum levels (MLs) established for each analyte. Selection of analytical methods is intended
to be performance‐based to allow laboratories flexibility to utilize methods that meet or exceed MLs
listed in the MRP. As an example, the following tables (Table 3‐7 and Table 3‐8) list separate EPA
methods for organochlorine pesticides and aroclors, organophosphate pesticides and semivolatile
organic compounds. Some laboratories choose to use EPA Method 625 for all of these test
requirements. This approach is acceptable as long as the method meets the MLs listed in Table E‐2 of
the MRP and meet data quality objectives consistent with the State’s Surface Water Ambient
Monitoring Program (SWAMP), but other laboratories will use separate test protocol for
organophosphate pesticides.
The critical dry weather event is defined as the period when historical in‐stream flow records are the
lowest or during the historically driest month. Point measurements of dry weather flows taken in Los
Cerritos Channel between 2000 and 2014 have been relatively uniform between May and September of
each year, but base flows have decreased to approximately 0.5 cfs in recent years. Rainfall during the
summer dry season is minimal and only briefly impacts flows in the channel. As a result, it is expected
that critical dry weather flow testing could be performed anytime between May and September.
Nevertheless, regional data suggest that rainfall and flows in major watersheds (Los Angeles River and
San Gabriel River watersheds) are least in July. As such, critical low flow monitoring will be conducted in
July.
A more accurate assessment of critical dry weather flow conditions will be completed and available by
the end of the 2014 dry season. Flumes equipped with stilling wells, pressure sensors and data loggers
will be constructed and installed throughout the watershed for a period of 6‐8 weeks. The work is part
of a State‐funded Proposition 84 study5 intended to provide detailed, continuous records of water level,
flow and temperature at each site for the duration of the deployment. Four of the flumes will be
located at sites selected as PWS sites for this CIMP. These data will be used to determine if flow
diminishes over the course of a few weeks or exhibits diurnal fluctuations as expected. Concurrent
water samples will also be collected over three 24‐hour time periods to analyze trace metals (especially
copper, lead, and zinc) and nutrient loading. If differences are noted, forensic work will be conducted to
identify and mitigate the source of the discharges. Although this work is not part of the CIMP, the
results of this program will be utilized to refine the “critical dry weather flow period” and to help
provide guidance with respect to segments most likely to contribute higher loads of metals during dry
weather conditions.
5 Gateway Water Management Authority Agreement No. 12‐423‐550. Los Cerritos Channel Watershed
Segmentation and Low Impact Development (LID) Project

23
3.1 GeneralandConventionalPollutantsMost of the general and conventional pollutants listed in Table 3‐3 will continue to be analyzed as part
of the base monitoring requirements for both receiving water and PWS/SWS sampling. These
constituents are common contaminants in stormwater from urban environments. Some, such as
turbidity, are redundant and best used as surrogates under special studies. Turbidity is often used as a
surrogate for suspended solids but requires calibration to the source material. Turbidity measurements
are recognized to lack comparability due to differences in equipment as well as the differences between
static and dynamic measurements (Anderson 2005 ‐ USGS National Field Manual for Collection of Water
Quality Data, Chapter 6.7). Total suspended solids (TSS) and suspended sediment concentrations (SSC)
directly examine particles associated with water samples and do not suffer from the problems
associated with measuring turbidity. An integral part of the pollutant reduction strategy involves the
reduction of discharged solids from the MS4, therefore both TSS and SSC will be monitored. Since SSC
sampling protocols are not met by the automatic stormwater samplers designed to measure pollutants,
SSC analysis will be done on a subsample of the composite sample. Rigorous subsampling protocols will
be utilized in order to assure representative samples that can be related directly to the chemical results.
The SSC sample analyses will add information to the current TSS analyses being run.
Other pollutants in this group have been tested in samples from LCC1 since 2000 and have not been
detected. As an example, total phenols have never exceeded the ML of 0.1 mg/L in this watershed.
MTBE and cyanide were analyzed during the first three years of the City of Long Beach Stormwater
Monitoring Program. MTBE has only detected in 1 out of 11 samples and cyanide was never detected.
Although perchlorate has not been analyzed in stormwater in the LCC watershed, industrial activities
likely to result in perchlorate discharges do not exist in the watershed. Perchlorate will be screened at
the receiving water site (LCC1) during the initial surveys but this contaminant is not expected to require
continued analysis at any monitoring site.
In summary, sufficient evidence exists to eliminate total recoverable phenolic compounds, cyanide,
turbidity and MTBE from further analysis. Perchlorate will be incorporated in the initial screening since
it has not been tested but it is not expected that continued testing will be required. Most other
constituents included in this list are common contaminants in stormwater runoff and will continue to be
analyzed. Analysis of chloride and fluoride may be analyzed as needed to assist in differentiating
potable water and groundwater sources during source tracking programs for the non‐stormwater outfall
monitoring program but will not be included in monitoring conducted for wet/dry weather receiving
water monitoring or for monitoring of the PWS/SWS monitoring sites.

24
Table 3‐3. Conventional Constituents, Analytical Methods and Quantitation Limits.
CONSTITUENTS Target Reporting Limits
CONVENTIONAL POLLUTANTS METHOD mg/L
Oil and Grease EPA1664 5 Total Petroleum Hydrocarbon EPA 418.1 5 Total Suspended Solids EPA 160.2 1
Suspended Sediment Concentration ASTM D3977‐97 (Method C)
0.5
Total Dissolved Solids EPA 160.1 1 Volatile Suspended Solids EPA 160.4 1 Total Organic Carbon EPA 415.1 1 Biochemical Oxygen Demand SM 5210B EPA 405.1 3 Chemical Oxygen Demand EPA 410.1 4 Alkalinity EPA 310.1 5 Specific Conductance EPA 120.1 1 umho Total Hardness EPA 130.2 1 MBAS EPA 425.1 0.02 Chloride EPA300.0 2 Fluoride EPA300.0 0.1 Perchlorate EPA314.0 4 ug/L
Field Measurements METHOD mg/L
pH‐field instrumentation EPA 150.1 0 – 14 Temperature‐field In‐situ N/A Dissolved Oxygen‐ field 1 In‐situ Sensitivity to 5 mg/L
1Dissolved Oxygen will only be measured during dry weather surveys.
3.2 MicrobiologicalConstituentsAll four microbiological constituents used as fecal indicator bacteria (FIB) will continue to be monitored
at the LCC1 Receiving Water monitoring site. Bacteria used as fecal indicators in marine waters will
continue to be analyzed during wet and dry weather surveys due to being situated just above the Los
Cerritos Channel Estuary. Only E. coli will be monitored at the four primary watershed segment sites
since these are each located in freshwater portion of the watershed. Table 3‐4 provides both upper and
lower quantification limits for each FIB which was established to assure that quantifiable results are
obtained. Upper quantitation limits are provided to assure that FIBs are quantified.

25
Table 3‐4. Microbiological Constituents, Analytical Methods and Quantitation Limits.
BACTERIA1 Method Lower Limits MPN/100ml
Upper Limits MPN/100ml
Total coliform (marine waters) SM 9221B <20 >2,400,000
Fecal coliform (marine waters) SM 9221E <20 >2,400,000
Enterococcus (marine waters) SM 9230B/C <20 >2,400,000
E. coli (fresh waters) SM 9221E/ Colilert‐QT <10 >2,400,000 1Microbiological constituents will vary based upon sampling point. Total and fecal coliform and
enterococcus will be measured only in marine waters or at locations where either the discharge point or
receiving water body will impact marine waters. E. coli will be analyzed at sites within the freshwater
portion of the watershed.
3.3 NutrientsNutrients (Table 3‐5) are also considered as part of the base requirements for the monitoring program.
These will be analyzed as part of the Table E‐2 screening requirements during the first major storm
event of the year and a critical dry weather sampling event at the receiving water site (LCC1). Nutrients
have not been identified as exceeding any applicable RWL to date and are therefore not scheduled to be
sampled as part of the ongoing program unless required based upon the initial screening. The current
monitoring plan calls for separate analysis of nitrate‐N and nitrite‐N. Concentrations of nitrite‐N have
typically been low. If data indicates that concentrations of nitrite‐N remain minimal, these analytes will
be combined into one analytical procedure that quantifies both nitrate‐N and nitrite‐N at the same time.
Table 3‐5. Nutrients, analytical methods, and quantitation limits
CONSTITUENT METHOD REPORTING LIMIT (mg/L)
Total Kjeldahl Nitrogen (TKN)1 EPA 351.1 0.50
Nitrate as Nitrogen (NO3‐N)1,2 EPA 300.0 0.10
Nitrite as Nitrogen (NO2‐N)1,2 EPA 300.0 0.05
Total Nitrogen1 calculation NA
Ammonia as Nitrogen (NH3‐N) EPA 350.1 0.10
Total Phosphorus SM 4500‐P E or F 0.1
Dissolved Phosphorus SM 4500‐P E or F 0.1 1. Total Nitrogen is the sum of TKN, nitrate, and nitrite.
2. Nitrate –N and Nitrite‐N may be analyzed together using EPA 300
26
3.4 TotalandDissolvedTraceMetalsA total of 16 trace metals are listed in Table E‐2 of the MRP. Analytical methods and reporting limits for
these elements are summarized in Table 3‐6. Most metals will be analyzed by EPA Method 200.8 using
ICP‐MS to provide appropriate detection limits. Hexavalent chromium and mercury both require
alternative methods. Neither hexavalent chromium nor mercury is commonly analyzed as part of
stormwater programs. Hexavalent chromium has been analyzed at LACFCD’s mass emission monitoring
sites in both the Los Angeles River (S10) and the San Gabriel River (S14) for the past eight to ten years
and has not been detected. Mercury has been detected at some mass emission monitoring sites but
detections are not common at any. Analytical methods and detection limits used for the monitoring
have been consistent with those required in Table E‐2 of the MRP.
Measurement of mercury is generally not considered to be appropriate in flow‐weighted composite
samples taken with autosamplers due to its volatility. This becomes more of an issue when sampling is
conducted near the limits of a peristaltic pump. Automatic stormwater samplers are not suitable for
sampling stormwater at low detection limits (0.5 to 5 nanograms/liter). Grab samples will be taken for
analysis of mercury in order to augment composite samples, which will be analyzed by EPA method
245.1. These grab samples will be analyzed by Method 1631E since this method is less subject to
interferences and will be collected at the same time that monitoring crews pull other grab samples
required by the monitoring program. Additional QAQC will be employed to support the extremely low
detection limits required by the program.

27
Table 3‐6. Metals Analytical Methods, and Quantitation Limits.
METALS (Dissolved & Total) METHOD Reporting Limit ug/L
Aluminum EPA200.8 100 Antimony EPA200.8 0.5 Arsenic EPA200.8 0.5 Beryllium EPA200.8 0.5 Cadmium EPA200.8 0.25 Chromium (total) EPA200.8 0.5 Chromium (Hexavalent) EPA218.6 5 Copper EPA200.8 0.5 Iron EPA200.8 25 Lead Mercury
EPA200.8 EPA245.1
0.5 0.2
Mercury (Low level) EPA1631E 0.0005 Nickel EPA200.8 1 Selenium EPA200.8 1 Silver EPA200.8 0.25 Thallium EPA200.8 0.5 Zinc EPA200.8 1
3.5 OrganochlorinePesticidesandPCBsAlthough organochlorine pesticides (OC pesticides) and PCBs are not commonly present in stormwater
sampled at LCC1, they have periodically been detected at low concentrations. The analytical methods
and detection limits for these compounds are summarized in Table 3‐7. These compounds are specified
in Table E‐2 of the MRP. The MRP suggests that detection of any of these analytes in excess of the ML
and/or applicable criteria will require continuation of the analysis through the period of the permit.
Since this could be attributable to analytical issues, we have recommended more frequent reevaluation
(refer to Section 3).
Since the OC pesticides are part of an analytical suite, detection of one compound would necessitate
continuation of the entire suite. However, this would not require continuation of analysis of PCBs
analyses if they are not detected in the early storm event and critical dry weather monitoring event.
Monitoring for PCBs will be reported as the summation of aroclors and a minimum of 50 congeners,
using EPA Method 8270 without the use of High Resolution Mass Spectrometry for routine monitoring.

28
Table 3‐7. Chlorinated Pesticides and PCB Analytical Methods, and Quantitation Limits
CHLORINATED PESTICIDES METHOD Reporting Limit µg/L
Aldrin EPA 608, 8081A 0.005 alpha‐BHC EPA 608, 8081A 0.01 beta‐BHC EPA 608, 8081A 0.005 delta‐BHC EPA 608, 8081A 0.005 gamma‐BHC (lindane) EPA 608, 8081A 0.02 alpha‐chlordane EPA 608, 8081A 0.1 gamma‐chlordane EPA 608, 8081A 0.1 Nonachlor‐alpha EPA 608, 8081A 0.1 Nonachlor‐gamma EPA 608, 8081A 0.1 Oxychlordane EPA 608, 8081A 0.1 4,4'‐DDD EPA 608, 8081A 0.05 4,4'‐DDE EPA 608, 8081A 0.05 4,4'‐DDT EPA 608, 8081A 0.01 Dieldrin EPA 608, 8081A 0.01 alpha‐Endosulfan EPA 608, 8081A 0.02 beta‐Endosulfan EPA 608, 8081A 0.01 Endosulfan sulfate EPA 608, 8081A 0.05 Endrin EPA 608, 8081A 0.01 Endrin aldehyde EPA 608, 8081A 0.01 Heptachlor EPA 608, 8081A 0.01 Heptachlor Epoxide EPA 608, 8081A 0.01 Toxaphene EPA 608, 8081A 0.5
POLYCHLORINATED BIPHENYLS1
PCB 5 PCB 8 PCB 15 PCB 18 PCB 27 PCB 28
EPA Method 8270 EPA Method 8270 EPA Method 8270 EPA Method 8270 EPA Method 8270 EPA Method 8270
0.005 0.005 0.005 0.005 0.005 0.005
PCB 29 PCB 31 PCB 33 PCB 44 PCB 49 PCB 52 PCB 56 PCB 60 PCB 66 PCB 70 PCB 74 PCB 87 PCB 95
EPA Method 8270 EPA Method 8270 EPA Method 8270 EPA Method 8270 EPA Method 8270 EPA Method 8270 EPA Method 8270 EPA Method 8270 EPA Method 8270 EPA Method 8270 EPA Method 8270 EPA Method 8270 EPA Method 8270
0.005 0.005 0.005 0.005 0.005 0.005 0.005 0.005 0.005 0.005 0.005 0.005 0.005

29
PCB 97 PCB 99 PCB 101 PCB 105 PCB 110 PCB 114 PCB 118 PCB 128 PCB 137 PCB 138 PCB 141 PCB 149 PCB 151 PCB 153 PCB 156 PCB 157 PCB 158 PCB 170 PCB 174 PCB 177 PCB 180
EPA Method 8270 EPA Method 8270 EPA Method 8270 EPA Method 8270 EPA Method 8270 EPA Method 8270 EPA Method 8270 EPA Method 8270 EPA Method 8270 EPA Method 8270 EPA Method 8270 EPA Method 8270 EPA Method 8270 EPA Method 8270 EPA Method 8270 EPA Method 8270 EPA Method 8270 EPA Method 8270 EPA Method 8270 EPA Method 8270 EPA Method 8270
0.005 0.005 0.005 0.005 0.005 0.005 0.005 0.005 0.005 0.005 0.005 0.005 0.005 0.005 0.005 0.005 0.005 0.005 0.005 0.005 0.005
PCB 183 EPA Method 8270 0.005
PCB 187 EPA Method 8270 0.005
PCB 189 EPA Method 8270 0.005
PCB 194 EPA Method 8270 0.005
PCB 195 EPA Method 8270 0.005
PCB 200 EPA Method 8270 0.005
PCB 201 EPA Method 8270 0.005
PCB 203 EPA Method 8270 0.005
PCB 206 EPA Method 8270 0.005
PCB 209 EPA Method 8270 0.005
Aroclor‐1248 EPA 608,EPA 8082 0.5 Aroclor‐1254 EPA 608,EPA 8082 0.5 Aroclor‐1260 EPA 608,EPA 8082 0.5
1. Monitoring for PCBs will be reported as the summation of aroclors and a
minimum of at least 50 congeners. List of aroclors and congeners were obtained
from Table C8 in the State’s Surface Water Ambient Monitoring Program’s
Quality Assurance Program Plan.
3.6 OrganophosphatePesticidesandHerbicidesOrganophosphate pesticides, triamine pesticides and herbicides list in Table E‐2 of the MRP are
summarized in Table 3‐8. Due to the fact that diazinon and chlorpyrifos are no longer available for
residential use, these constituents are now rarely detected. When detected, concentrations rarely
exceed available ambient water quality criteria for protection of aquatic life. Malathion, however,

30
remains a common constituent in stormwater runoff but this pesticide is not as toxic as other
organophosphate pesticides.
Two compounds in this list, atrazine and simazine, are not organophosphate pesticides but can be
analyzed by EPA Method 8141a. Both are triazine herbicides which are used for control of broadleaf
weeds. Based upon historical data, herbicides such as these and the three additional separately listed
compounds are unlikely to require continued analysis after completion of initial screening of Table E‐2
constituents. Alternative analytical methods may be considered and used as long as the established
reporting limits can be met.
Table 3‐8. Organophosphate Pesticides and Herbicides Analytical Methods, and Quantitation Limits
ORGANOPHOSPHATE PESTICIDES METHOD Reporting Limit µg/L
Atrazine EPA507, 8141A 1 Chlorpyrifos EPA8141A 0.05 Cyanazine EPA8141A 1 Diazinon EPA8141A 0.01 Malathion EPA8141A 1 Prometryn EPA8141A 1 Simazine EPA8141A 1
HERBICIDES
Glyphosate EPA547 5 2,4‐D EPA515.3 0.02 2,4,5‐TP‐SILVEX EPA515.3 0.2
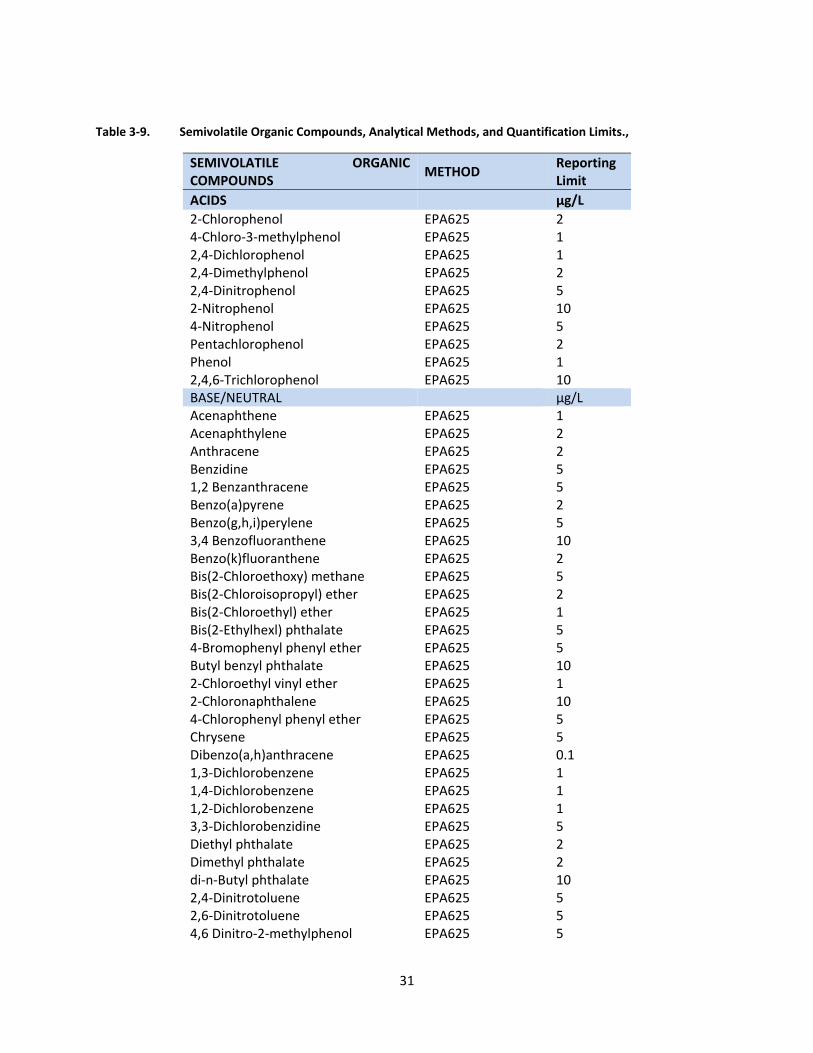
3.7 SemivolatileOrganicCompounds(Acid,Base/Neutral)Semivolatile organic compounds (SVOCs) from Table E‐2 of the MRP are listed in Table 3‐9 below. Acids
consist mostly of phenolic compounds which are uncommon in stormwater samples. Base/neutrals
include polynuclear aromatic hydrocarbons (PAHs) and phthalates. SVOCa were only measured during
the first two years of the City of Long Beach Stormwater Monitoring Program. Very few analytes were
detected and those that were detected were typically less than 10 times the reporting limit. Phthalates
were among the most common SVOCs detected and are 303(d) listed based upon measurements taken
over ten years ago. Phthalates have been historically a common laboratory contaminant due to the
significant use of plastic in laboratories but they are also a common environmental contaminant for the
same reason.
31
Table 3‐9. Semivolatile Organic Compounds, Analytical Methods, and Quantification Limits.,
SEMIVOLATILE ORGANIC COMPOUNDS
METHOD Reporting Limit
ACIDS µg/L
2‐Chlorophenol EPA625 2 4‐Chloro‐3‐methylphenol EPA625 1 2,4‐Dichlorophenol EPA625 1 2,4‐Dimethylphenol EPA625 2 2,4‐Dinitrophenol EPA625 5 2‐Nitrophenol EPA625 10 4‐Nitrophenol EPA625 5 Pentachlorophenol EPA625 2 Phenol EPA625 1 2,4,6‐Trichlorophenol EPA625 10 BASE/NEUTRAL µg/L Acenaphthene EPA625 1 Acenaphthylene EPA625 2 Anthracene EPA625 2 Benzidine EPA625 5 1,2 Benzanthracene EPA625 5 Benzo(a)pyrene EPA625 2 Benzo(g,h,i)perylene EPA625 5 3,4 Benzofluoranthene EPA625 10 Benzo(k)fluoranthene EPA625 2 Bis(2‐Chloroethoxy) methane EPA625 5 Bis(2‐Chloroisopropyl) ether EPA625 2 Bis(2‐Chloroethyl) ether EPA625 1 Bis(2‐Ethylhexl) phthalate EPA625 5 4‐Bromophenyl phenyl ether EPA625 5 Butyl benzyl phthalate EPA625 10 2‐Chloroethyl vinyl ether EPA625 1 2‐Chloronaphthalene EPA625 10 4‐Chlorophenyl phenyl ether EPA625 5 Chrysene EPA625 5 Dibenzo(a,h)anthracene EPA625 0.1 1,3‐Dichlorobenzene EPA625 1 1,4‐Dichlorobenzene EPA625 1 1,2‐Dichlorobenzene EPA625 1 3,3‐Dichlorobenzidine EPA625 5 Diethyl phthalate EPA625 2 Dimethyl phthalate EPA625 2 di‐n‐Butyl phthalate EPA625 10 2,4‐Dinitrotoluene EPA625 5 2,6‐Dinitrotoluene EPA625 5 4,6 Dinitro‐2‐methylphenol EPA625 5

32
SEMIVOLATILE ORGANIC COMPOUNDS
METHOD Reporting Limit
1,2‐Diphenylhydrazine EPA625 1 di‐n‐Octyl phthalate EPA625 10 Fluoranthene EPA625 0.05 Fluorene EPA625 0.1 Hexachlorobenzene EPA625 1 Hexachlorobutadiene EPA625 1 Hexachloro‐cyclopentadiene EPA625 5 Hexachloroethane EPA625 1 Indeno(1,2,3‐cd)pyrene EPA625 0.05 Isophorone EPA625 1 Naphthalene EPA625 0.2 Nitrobenzene EPA625 1 N‐Nitroso‐dimethyl amine EPA625 5 N‐Nitroso‐diphenyl amine EPA625 1 N‐Nitroso‐di‐n‐propyl amine EPA625 5 Phenanthrene EPA625 0.05 Pyrene EPA625 0.05 1,2,4‐Trichlorobenzene EPA625 1

33
4 AquaticToxicityTestingandToxicityIdentificationEvaluationsAquatic toxicity testing supports the identification of best management practices (BMPs) to address
sources of toxicity in urban runoff. Monitoring begins in the receiving water and the information gained
is used to identify constituents for monitoring at outfalls to support the identification of pollutants that
need to be addressed in the WMP. The sub‐sections below describe the detailed process for conducting
aquatic toxicity monitoring, evaluating results, and the technical and logistical rationale. Control
measures and management actions to address confirmed toxicity caused by urban runoff are addressed
by the WMP, either via currently identified management actions or those that are identified via adaptive
management of the WMP.
4.1 SensitiveSpeciesSelectionThe Permit MRP (page E‐32) states that sensitivity screening to select the most sensitive test species
should be conducted unless “a sensitive test species has already been determined, or if there is prior
knowledge of potential toxicant(s) and a test species is sensitive to such toxicant(s), then monitoring
shall be conducted using only that test species.” Previous relevant studies conducted in the watershed
should be considered. Such studies may have been completed via previous MS4 sampling, wastewater
NPDES sampling, or special studies conducted within the watershed.
As described in the MRP (page E‐31), if samples are collected in receiving waters with salinity less than 1
part per thousand (ppt), or from outfalls discharging to receiving waters with salinity less than 1 ppt,
toxicity tests should be conducted on the most sensitive test species in accordance with species and
short‐term test methods in Short‐term Methods for Estimating the Chronic Toxicity of Effluents and
Receiving Waters to Freshwater Organisms (EPA/821/R‐02/013, 2002; Table IA, 40 CFR Part 136).
Salinities of both dry and wet weather discharges from the Los Cerritos Channel are considered to meet
the freshwater criterion. During extreme high tides, salinity at the LCC1 receiving water monitoring site
can exceed 1 ppt but dry weather sampling is always scheduled to avoid these extremes. The freshwater
test species identified in the MRP are:
A static renewal toxicity test with the fathead minnow, Pimephales promelas (Larval Survival and
Growth Test Method 1000.04).
A static renewal toxicity test with the daphnid, Ceriodaphnia dubia (Survival and Reproduction
Test Method 1002.05).
A static renewal toxicity test with the green alga, Selenastrum capricornutum (also named
Raphidocelis subcapitata) (Growth Test Method 1003.0).
The three test species were evaluated to determine if either a sensitive test species had already been
determined, or if there is prior knowledge of potential toxicant(s) and a test species is sensitive to such
toxicant(s). In reviewing the available data in the Los Angeles River, Los Cerritos Channel, and the San
Gabriel River watersheds, organophosphate pesticides and/or metals have been identified as
problematic and are generally considered the primary aquatic life toxicants of concern found in urban
runoff. Pyrethroid pesticides are known to be present in urban runoff and potentially contribute to
toxicity in these waters. Tests specific to pyrethroid pesticides are simply less common. Given the

34
knowledge of the presence of these potential toxicants in the watershed, the sensitivities of each of the
three species were considered to evaluate which is the most sensitive to the potential toxicants in the
watersheds.
Ceriodaphnia dubia has been reported as a sensitive test species for historical and current use pesticides
and metals, and studies indicate that it is more sensitive to the toxicants of concern than P. promelas or
S. capricornutum. In its aquatic life copper criteria document, the USEPA reports greater sensitivity of C.
dubia to copper (species mean acute value of 5.93 µg/L) compared to Pimephales promelas (species
mean acute value of 69.93 µg/L; EPA, 2007). C. dubia’s relatively higher sensitive to metals is common
across multiple metals. Researchers at the University of California, Davis also reviewed available species
sensitivity values in developing pesticide criteria for the Central Valley Regional Water Quality Control
Board. The UC Davis researchers reported higher sensitivity of C. dubia to diazinon and bifenthrin
(species mean acute value of 0.34 µg/l and 0.105 µg/L) compared to P. promelas (species mean acute
value of 7804 µg/L and 0.405 µg/L; Palumbo et al., 2010a, b). Additionally, a study of the City of
Stockton urban stormwater runoff found acute and chronic toxicity to C. dubia, with no toxicity to S.
capricornutum or P. promelas (Lee and Lee, 2001). The toxicity was attributed to organophosphate
pesticides, indicating a higher sensitivity of C. dubia compared to S. capricornutum or P. promelas. P.
promelas is generally less sensitive to metals and pesticides but has been found to be more sensitive to
ammonia than C. dubia. However, as ammonia is not typically a constituent of concern for urban runoff
and ammonia is not consistently observed above the toxic thresholds in the watershed, P. promelas is
not considered a particularly sensitive species for evaluating the impacts of urban runoff in receiving
waters in the watershed.
Selenastrum capricornutum is a species that is sensitive to herbicides; however, while sometimes
present in urban runoff, measured concentrations are typically very low. Herbicides have not been
identified as a potential toxicant in the watershed. S. capricornutum is also not considered the most
sensitive species as it is not sensitive to either pyrethroids or organophosphate pesticides and is not as
sensitive to metals as C. dubia. The S. capricornutum growth test can also be affected by high
concentrations of suspended and dissolved solids, color and pH extremes, which can interfere with the
determination of sample toxicity. As a result, it is common to manipulate the sample by centrifugation
and filtration to remove solids in order to conduct the test. This process may affect the toxicity of the
sample. In a study of urban highway stormwater runoff (Kayhanian et. al, 2008), the green alga response
to the stormwater samples was more variable than both the C. dubia and the P. promelas and in some
cases the alga growth was considered to be potentially enhanced due to the presence of stimulatory
nutrients.
As C. dubia is identified as the most sensitive to known potential toxicant(s) typically found in receiving
waters and urban runoff in the freshwater potions of the watershed and has demonstrated toxicity in
programs within the watershed (CWH and ABC Laboratories, 2013), C. dubia is selected as the most
sensitive species. The species also has the advantage of being easily maintained in in‐house mass
cultures. The simplicity of the test, the ease of interpreting results, and the smaller volume necessary to
run the test, make the test a valuable screening tool. The ease of sample collection and higher

35
sensitivity will support assessing the presence of ambient receiving water toxicity or long term effects of
toxic stormwater over time. As such, toxicity testing will be conducted using C. dubia.
An alternative species of water fleas, Daphnia magna, may be used if the water being tested has
elevated hardness. C. dubia test organisms are typically cultured in moderately hard waters (80‐100
mg/L CaCO3) and can have increased sensitivity to elevated water hardness greater than 400 mg/L
CaCO3), which is beyond their typical habitat range. Because of this, Daphnia magna may be
substituted in instances where hardness in site waters exceeds 400 mg/L (CaCO3). Daphnia magna is
more tolerant to high hardness levels and is a suitable substitution for C. dubia in these instances
(Cowgill and Milazzo, 1990).
4.2 TestingPeriodThe following describes the testing periods to assess toxicity in samples collected in the LCC WMP area
during dry and wet weather conditions. Short‐term chronic tests will be used to assess both survival and
reproductive/growth endpoints for C. dubia for both wet and dry weather sampling efforts. Although
wet weather conditions in the region generally persist for less than the chronic testing periods (7 days),
the C. dubia chronic test will be used for wet weather toxicity testing in accordance with Short‐term
Methods for Estimating the Chronic Toxicity of Effluents and Receiving Waters to Freshwater Organisms
(EPA, 2002a). Utilization of standard chronic tests on wet weather samples are not expected to generate
results representative of the typical conditions found in the receiving water intended to be simulated by
toxicity testing.
4.3 Toxicity Endpoint Assessment and Toxicity Identification EvaluationTriggers
Per the MRP, toxicity test endpoints will be analyzed, using the Test of Significant Toxicity (TST) t‐test
approach specified by the USEPA (USEPA, 2010). The Permit specifies that the chronic in‐stream waste
concentration (IWC) is set at 100% receiving water for receiving water samples and 100% effluent for
outfall samples. Using the TST approach, a t‐value is calculated for a test result and compared with a
critical t‐value from USEPA’s TST Implementation Document (USEPA, 2010). Follow‐up triggers are
generally based on the Permit specified statistical assessment as described below.
For chronic C. dubia toxicity testing, if a ≥50% reduction in survival or reproduction is observed between
the sample and laboratory control that is statistically significant, a toxicity identification evaluation (TIE)
will be performed.
TIE procedures will be initiated as soon as possible after the toxicity trigger threshold is observed to
reduce the potential for loss of toxicity due to extended sample storage. If the cause of toxicity is readily
apparent or is caused by pathogen related mortality or epibiont interference with the test, the result will
be rejected, if necessary, a modified testing procedure will be developed for future testing.
In cases where significant endpoint toxicity effects greater than 50% are observed in the original sample,
but the follow‐up TIE positive control “signal” is found to not be statistically significant, the cause of
toxicity will be considered non‐persistent. No immediate follow‐up testing is required on the sample.

36
However, future test results will be evaluated to determine if implementation of concurrent TIE
treatments are needed to provide an opportunity to identify the cause of toxicity.
4.4 ToxicityIdentificationEvaluationApproachThe results of toxicity testing will be used to trigger further investigations to determine the cause of
observed laboratory toxicity. The primary purpose of conducting TIEs is to support the identification of
management actions that will result in the removal of pollutants causing toxicity in receiving waters.
Successful TIEs will direct monitoring at outfall sampling sites to inform management actions. As such,
the goal of conducting TIEs is to identify pollutant(s) that should be sampled during outfall monitoring so
that management actions can be identified to address the pollutant(s).
The TIE approach as described in USEPA’s 1991 Methods for Aquatic Toxicity Identification is divided
into three phases although some elements of the first two phases are often combined. Each of the
three phases is briefly summarized below:
Phase I utilizes methods to characterize the physical/chemical nature of the constituents,
which cause toxicity. Such characteristics as solubility, volatility and filterability are
determined without specifically identifying the toxicants. Phase I results are intended as a
first step in specifically identifying the toxicants but the data generated can also be used to
develop treatment methods to remove toxicity without specific identification of the
toxicants.
Phase II utilizes methods to specifically identify toxicants.
Phase III utilizes methods to confirm the suspected toxicants.
A Phase I TIE will be conducted on samples that exceed a TIE trigger described in Section 4.4. Water
quality data will be reviewed to future support evaluation of potential toxicants. A range of sample
manipulations may be conducted as part of the TIE process. The most common manipulations are
described in Table 4‐1. Information from previous chemical testing and/or TIE efforts will be used to
determine which of these (or other) sample manipulations are most likely to provide useful information
for identification of primary toxicants. TIE methods will generally adhere to USEPA procedures
documented in conducting TIEs (USEPA, 1991, 1992, 1993a‐b).

37
Table 4‐1. Phase I and II Toxicity Identification Evaluation Sample Manipulations
TIESampleManipulation ExpectedResponsepHAdjustment(pH7and8.5) AlterstoxicityinpHsensitivecompounds(i.e.,ammoniaandsome
tracemetals)Filtrationorcentrifugation* RemovesparticulatesandassociatedtoxicantsEthylenediamine‐TetraaceticAcid(EDTA)orCationExchangeColumn*
Chelatestracemetals,particularlydivalentcationicmetals
Sodiumthiosulfate(STS)addition Reducestoxicantsattributabletooxidants(i.e.,chlorine)andsometracemetals
PiperonylButoxide(PBO)* Reducestoxicityfromorganophosphatepesticidessuchasdiazinon,chlorpyrifosandmalathion,andenhancespyrethroidtoxicity
Carboxylesteraseaddition(1) HydrolyzespyrethroidsTemperatureadjustments(2) PyrethroidsbecomemoretoxicwhentesttemperaturesaredecreasedSolidPhaseExtraction(SPE)withC18column*
Removesnon‐polarorganics(includingpesticides)andsomerelativelynon‐polarmetalchelates
SequentialSolventExtractionofC18column
FurtherresolutionofSPE‐extractedcompoundsforchemicalanalyses
NoManipulation* Baselinetestforcomparingtherelativeeffectivenessofothermanipulations
* Denotes treatments that will be conducted during the initiation of toxicity monitoring, but may be revised as the program
is implemented. These treatments were recommended for initial stormwater testing in Appendix E (Toxicity Testing Tool for Stormwater Discharges) of the State Water Resources Control Board’s June 2012 Public Review Draft “Policy for Toxicity Assessment and Control”.
1 Carboxylesterase addition has been used in recent studies to help identify pyrethroid‐associated toxicity (Wheelock et al.,
2004; Weston and Amweg, 2007). However, this treatment is experimental in nature and should be used along with other
pyrethroid‐targeted TIE treatments (e.g., PBO addition).
2 Temperature adjustments are another recent manipulation used to evaluate pyrethroid‐associated toxicity. Lower
temperatures increase the lethality of pyrethroid pesticides. (Harwood, You and Lydy, 2009)
The Watershed Group will identify the cause(s) of toxicity using a selection of treatments in Table 4‐1
and, if possible, using the results of water column chemistry analyses. After any initial assessments of
the cause of toxicity, the information may be used during future events to modify the targeted
treatments to more closely target the expected toxicant or class of toxicants. Moreover, if the toxicant
or toxicant class is not initially identified, toxicity monitoring during subsequent events will confirm if
the toxicant is persistent or a short‐term episodic occurrence.
As the primary goals of conducting TIEs is to identify pollutants for incorporation into outfall monitoring,
narrowing the list of toxicants following Phase I TIEs via Phase II/III TIEs is not necessary if the toxicant
class determined during the Phase I TIE is sufficient for 1) identifying additional pollutants for outfall
monitoring and/or 2) identifying control measures. Thus, if the specific pollutant(s) or classes of
pollutants (e.g., metals that are analyzed via EPA Method 200.8) are identified then sufficient
information is available to incorporate the additional pollutants into outfall monitoring and to start
implementation of control measures to target the additional pollutants.
Phase II TIEs may be utilized to identify specific constituents causing toxicity in a given sample if the
results of Phase I TIE testing and a review of available chemistry data fails to provide information

38
necessary to identify constituents that warrant additional monitoring activities or management actions
to identify likely sources of the toxicants and lead to elimination of the sources of these contaminants.
Phase III TIEs will be conducted following any Phase II TIEs.
For the purposes of determining whether a TIE is inconclusive, TIEs will be considered inconclusive if:
The toxicity is persistent (i.e., observed in the baseline), and
The cause of toxicity cannot be attributed to a class of constituents (e.g., insecticides, metals, etc.) that can be targeted for monitoring.
If (1) a combination of causes that act in a synergistic or additive manner are identified; (2) the toxicity
can be removed with a treatment or via a combination of the TIE treatments; or (3) the analysis of water
quality data collected during the same event identify the pollutant or analytical class of pollutants, the
result of a TIE is considered conclusive.
Note that the MRP (page E‐33) allows a TIE Prioritization Metric (as described in Appendix E of the
Stormwater Monitoring Coalition’s Model Monitoring Program) for use in ranking sites for TIEs.
However, as the extent to which TIEs will be conducted is unknown, prioritization cannot be conducted
at this time. However, prioritization may be utilized in the future based on the results of toxicity
monitoring and an approach to prioritization will be developed through the CIMP adaptive management
process and will be described in future versions of the CIMP.
4.5 FollowUponToxicityTestingResultsOur suggested approach is that If the results of two TIEs on separate receiving samples collected during
the same conditions (i.e., wet or dry weather) are inconclusive, a toxicity test conducted during the
same conditions (i.e., wet or dry weather), using the same test species, will be conducted at applicable
upstream outfalls as soon as feasible (i.e., the next monitoring event that is at least 45 days following
the toxicity laboratory’s report transmitting the results of an inconclusive TIE). The same TIE evaluation
triggers and TIE approach presented in Section 4.3 and 4.4, respectively will be followed based on the
results of the outfall sample.
The MRP (page E‐33) indicates the following actions should be taken when a toxicant or class of
toxicants is identified through a TIE:
1. Group Members shall analyze for the toxicant(s) during the next scheduled sampling event in
the discharge from the outfall(s) upstream of the receiving water location.
2. If the toxicant is present in the discharge from the outfall at levels above the applicable
receiving water limitation, a toxicity reduction evaluation (TRE) will be performed for that
toxicant.
The list of constituents monitored at outfalls identified in the CIMP will be modified based on the results
of the TIEs. Similarly, upon completion of a successful dry weather TIE, additional constituents identified
in the TIE will be added to monitoring requirements at outfalls with significant non‐stormwater flows.
Monitoring for those constituents will occur as soon as feasible following the completion of a successful

39
TIE (i.e., the next monitoring event that is at least 45 days following the toxicity laboratory’s report
transmitting the results of a successful TIE).
The requirements of the TREs will be met as part of the adaptive management process in the WMPs
rather than the CIMP. The identification and implementation of control measures to address the causes
of toxicity are tied to management of the stormwater program, not the CIMP. It is expected that the
requirements of TREs will only be conducted for toxicants that are not already addressed by an existing
Permit requirement (i.e., TMDLs) or existing or planned management actions.
The Water Boards’ TMDL Roundtable is currently evaluating options to streamline and consistently
respond to urban‐use pesticide impairment listings throughout the State including a statewide urban‐
use pesticide TMDL modeled after the San Francisco Bay Area Urban Creeks Pesticides TMDL. In
Addition to toxicity testing, statewide efforts will be monitored to study these pesticides being discussed
by the California Stormwater Quality Association (CASQA) Pesticides sub‐committee and other Regional
Water Boards. The toxicity approach is subject to modifications based on discussions with the Regional
Board.
4.6 SummaryofAquaticToxicityMonitoringThe approach to conducting aquatic toxicity monitoring as described in the previous sections is
summarized in detail in Figure 4.1. The intent of the approach is to identify the cause of toxicity
observed in receiving water to the extent possible with the toxicity testing tools available, thereby
directing outfall monitoring for the pollutants causing toxicity with the ultimate goal of supporting the
development and implementation of management actions.

40
Figure 4.1. Detailed Aquatic Toxicity Assessment Process.

41
5 ReceivingWaterQualityMonitoring(WetandDryWeather)Receiving water quality monitoring will primarily be conducted with automated stormwater monitoring
equipment detailed in Appendix A. Water samples for bacteria, oil and grease, petroleum
hydrocarbons, low level mercury, and volatile organic compounds must be collected separately as grab
samples. Appendix A also discussed manual collection of water samples when required. This section
addresses both the equipment and protocol used for collection of flow‐weighted and time‐weighted
composite samples. The monitoring site LCC1 as shown in Figure 1‐2 will serve as the Receiving Water
and TMDL compliance monitoring location for the Los Cerritos Channel. The monitoring equipment
provides continuous records of rainfall at this site as well as flow during storm events. This site monitors
and records all flows exceeding 18 cfs. Flow estimates are based upon a rating curve established for a
former gaging station located approximately 100 feet upstream.
During dry weather monitoring, manual flow measurements are required to obtain instantaneous
estimates of flow rates. Measurements are taken at a position where flow is relative uniform over a
distance of 10 to 20 feet. Measurements are taken to determine to average width of the flowing water
and the depth of water at the center of the flow. Water velocities are recorded by the time required for
particles to travel a measured distance along the channel. The velocity of water flow is multiplied by the
cross‐sectional area of the channel to estimate flow. Since the channel approximates a triangular form,
the cross‐sectional area of the flowing water is calculated as ½ of the depth at the center of the channel
multiplied by the width of flowing water. Dry weather flows have averaged approximately 0.5 cfs during
the past five years.
5.1 SamplingFrequencyandMobilizationRequirementsMonitoring of receiving water quality will be performed four times a year during the wet season and two
times a year during dry weather conditions. Screening for Table E‐2 constituents listed in the MRP will
be conducted during the first significant storm of the year and during a critically dry weather period.
Large sampling volumes are required to incorporate all analytical tests and associated QA/QC needed
for Table E‐2 constituents, bioassay tests and to provide sufficient volumes should TIEs be required. Due
to these requirements, mobilization criteria for the initial wet weather events will differ from
subsequent events.
Mobilization of field crews will typically start when there is both a 70% probability of rainfall within 24
hours of the arrival of a predicted storm event and Quantitative Precipitation Forecasts (QPFs) indicate
that a minimum of 0.25 inches will occur within a 24‐hour time period. Due to the importance of the
first storm event of the year, crews will be mobilized to prepare the site (or sites) for monitoring 24
hours in advance of any events with at least a 50% probability of rainfall and QPFs of at least 0.20 inches
within a 24‐hour time period. If weather forecasts for the first storm of the season indicate
development of a condition known as a “cut‐off low”6, partial field teams may initially be deployed to
6 A closed upper‐level low which has become completely displaced (cut off) from basic westerly current, and
moves independently of that current. Cutoff lows may remain nearly stationary for days, or on occasion may move
westward opposite to the prevailing flow aloft (i.e., retrogression).

42
prepare stations since such conditions create highly unpredictable situations that have the potential to
suddenly move onshore with higher than expected rainfall. Full mobilization will require an upgrade in
the local forecast to a predicted rainfall of at least 0.25 inches with a minimum probability of 70% within
12 hours of the event. For the purposes of this CIMP, weather forecasts and Quantitative Precipitation
Forecasts (QPFs) provided by the Los Angeles/Oxnard National Weather Service and the California
Nevada River Forecast Center will be used to assess whether mobilization criteria are met.
Once the screening phase has been completed for Table E‐2 constituents, storm events will be
considered suitable for monitoring given a minimum of 72 hours (3 days) with cumulative rainfall of less
than 0.1 inches of rainfall within the watershed. Evaluation of antecedent rainfall conditions will initially
be based upon Los Angeles County ALERT (Automatic Local Evaluation in Real Time) stations and rain
gauges within or near the Los Cerritos Channel Watershed and rainfall measured at LCC1. The rain
gauge located at Signal Hill City Hall (#335) will serve as the primary site for evaluation of antecedent
conditions. The rain gauge installed at LCC1 will serve as the secondary site if the primary site is
inoperable or unavailable. As the Primary Watershed Segmentation (PWS) sites come on line, these
sites will also be used to evaluate antecedent conditions. Assessment of antecedent conditions will be
based upon average rainfall measured at sites located within the watershed boundaries and that are
known to be fully operable. Due to anticipated reductions in required stormwater volumes, monitoring
of subsequent storm events will be based upon weather forecasts predicting rainfall of 0.25 inches at
probability of at least 70% within 24 hours of the predicted event. Once crews are mobilized for a storm
event, rainfall must exceed a minimum of 0.25 inches and provide sufficient rainfall to project
objectives. One of the three storm events to be sampled at the LCC1 Receiving Water Monitoring Site is
only intended to address the requirements of the metals TMDL. At this site, a minimum rainfall event of
0.15 to 0.25 inches would be expected fulfill sampling requirements for the TMDL constituents and
provide a representative flow‐composite sample due to the fact that the watershed is highly impervious.
Two monitoring events are required during dry weather conditions. There has been no indication that
seasonal trends exist with respect to dry weather flows in the Los Cerritos Channel Watershed but data
from the ongoing Proposition 84 study will provide information to evaluate if seasonality in flow exists in
different areas of the watershed. Based upon existing information, dry weather monitoring at the LCC1
Receiving Water Monitoring Site will be conducted once in late spring/early summer (May to June) and
again towards the end of the dry season in September/October. This will be consistent with historical
dry weather sampling conducted under the City of Long Beach NPDES Permit. During the dry season,
the only restriction on sampling will be that total rainfall over the 72 hour time period preceding the
sampling event does not exceed 0.1 inches. In practice, rainfall is very rare during the summer months.
With the exception of unusual periods when hurricanes developing off of Baja California cause some
precipitation to spin north, rainfall events are very infrequent. When practical, dry weather monitoring
will be conducted during periods with less than 0.1 inches of rain occur over the previous week.
5.2 SamplingConstituentsWith minor exceptions, chemical analyses are scheduled to be conducted for all analytes listed in Table
3‐3 through Table 3‐9 during the first significant rainfall of the season and again during a period of
critical low flow. Chemical constituents not detected in excess of their respective Method Detection

43
Limits (MDLs) or that do not exceed available water quality standards will be considered for removal
during subsequent surveys. Adjustments to the list of analytical tests will be assessed separately for wet
and dry weather sampling requirements. Since the initial screening event may be followed too quickly
for the data to be received and fully evaluated, the field team must be prepared to collect water
samples for the testing the full set of Table E‐2 constituents during the second sampling event.
Most of the general and conventional pollutants listed in Table 3‐3 will continue to be analyzed as part
of the base monitoring requirements for continued monitoring for both receiving waters and for the
metals TMDL. The only pollutants considered for elimination will be cyanide, total phenols, perchlorate,
and MTBE. Analysis of chloride and fluoride will continue to be used to assist in the interpretation of
potential potable water sources during in association with the non‐stormwater screening program. In
addition, microbiological constituents (Table 3‐4), nutrients (Table 3‐5), chlordane compounds listed in
Table 3‐7 and TMDL metals (Table 3‐6) will continue to be part of the ongoing monitoring at LLC1.
As noted in the previous section, it has been determined that adequate data exist to determine which of
the three freshwater species are considered to be most sensitive during both storm events and dry
weather periods. Available literature and local data indicate that the most sensitive bioassay test
species is Ceriodaphnia dubia. The prior section on Aquatic Toxicity Testing and TIEs goes into detail as
to species selection and the overall approach recommended for measuring toxicity in the receiving
waters and strategies to eliminate any sources of toxicity. During wet weather conditions, bioassay tests
will be performed based upon exposure to 100 percent test waters over a 48‐hour time period since this
time exposure is deemed to be more consistent with the duration of typical storm events. Since
exposure times during the dry season are much longer, dry weather testing will utilize 7‐day chronic
toxicity tests that assess both survival and reproductive endpoints for C. dubia. Chronic testing will also
be conducted on 100 percent undiluted samples. Table 5‐1 provides sample volumes necessary for
toxicity tests (both wet and dry weather) as well as minimum volumes necessary to fulfill Phase I TIE
testing if necessary. As detailed in the previous section, the sublethal endpoints will be assessed using
EPA’s TST procedure to determine if there is a statistically significant 50% difference between sample
controls and the test waters and ultimately determine if further testing should be is necessary.

44
Table 5‐1. Toxicity Test Volume Requirements for Aquatic Toxicity Testing as part of the Los Cerritos Channel Coordinated Integrated Monitoring Program.
Test Organism Toxicity Test Type Test Concentration
Volume Required for Initial Screen (L)
Minimum Volume Required for TIE (L)1
Freshwater Tests for Samples with Salinity < 1.0 ppt
Daphnid Water Flea (Ceriodaphnia dubia)
48‐Hour Acute Survival 7‐day Chronic Survival and Reproduction
100% only 1.5 10
Sample Receipt Water Quality
‐‐ ‐‐ 1.0 ‐‐
Total volume required per event for samples with salinity < 1.0 ppt
2.5 a
1 Minimum volume for the TIE is for Phase 1 characterization testing only. The additional volume collected for potential TIE testing can be held in refrigeration (4°C in the dark, no head space) and shipped to the laboratory at a later date if needed.
Note: The NPDES permit targets a 36‐hr holding time for initiation of testing but allows a maximum holding time of 72‐hr if necessary.

45
6 PrimaryWatershedSegmentation(PWS)Sites
6.1 SamplingFrequencyandMobilizationRequirementsThe sampling frequency and mobilization requirements for the PWS sites will be consistent with
monitoring conducted at the LCC1. A total of three storm events will be monitored at each PWS site
once they are installed. Monitoring will be concurrent with LCC1 monitoring in order to allow for
comparison of pollutant loading rates associated with each segment relative to ultimate pollutant loads
measured at the LCC1 site.
6.2 PWSSamplingConstituentsConstituents monitored at each PWS site will include all TMDL constituents as well as general and
conventional constituents necessary to assist in evaluation of the data (Table 6‐1). Constituents
included in the MAL list and monitored at the outfall sites will be included in an annual MAL Assessment
Report reported as part of the Annual Report. The MAL Assessment Report will summarize the
monitoring data in comparison to the applicable MALs, and identify those subwatersheds where the
running average concentrations of these constituents exceed the MALs by twenty percent or more.
Table 6‐1. Constituents Monitored at Primary Watershed Segment (PWS) Sites.
CONSTITUENTS TARGET REPORTING LIMITS
CONVENTIONAL POLLUTANTS METHOD mg/L
Total Suspended Solids EPA 160.2 1 Total Dissolved Solids EPA 160.1 1 Volatile Suspended Solids EPA 160.4 1 Total Organic Carbon EPA 415.1 1 Chemical Oxygen Demand EPA 410.1 4 Alkalinity EPA 310.1 5 Specific Conductance EPA 120.1 1 Total Hardness EPA 130.2 1 MBAS EPA 425.1 0.02 Chloride EPA300.0 2 Fluoride EPA300.0 0.1
METALS (Dissolved & Total) METHOD ug/L
Copper EPA200.8 0.5 Lead EPA200.8 0.5 Zinc EPA200.8 1

46
Page Left Intentionally Blank

47
7 SecondaryWatershedSegmentation(SWS)Sites(WetWeather)Secondary Watershed Segmentation (SWS) sites will be monitored with portable equipment that will be
used to assist in tracking sources of constituents found to be elevated at one of the Primary Watershed
Segmentation sites. The portable monitoring stations will consist of a battery powered autosamplers
triggered by sensors installed in the channel to detect the start of flow. Once triggered, the samplers
will take time‐weighted samples for a 24‐hour period. The autosamplers will be set to take 200 mL
samples every 15 minutes while is present in the channel. All sample composite bottles and materials
contacting the water will be identical to those used for each of the “permanent” or fixed monitoring
sites.
SWS sites are expected to be deployed upstream of PWS sites where specific contaminants are found to
be elevated. Tentative locations (Figure 1‐2) have been established at sites in each subwatershed
should PWS monitoring data indicate that forensic monitoring is necessary to further isolate areas
contributing excessive pollutant loads. The selected sites further segment the subwatersheds into two
areas and are designed to be monitored concurrently with the SWS site. Pre‐selection of candidate SWS
sites was intended to facilitate implementation of forensic monitoring by clearly identifying the next
step if conditions are met that trigger further testing.
SWS monitoring will be triggered if the running average of any MAL constituent is exceeded by 20
percent or if the running average of MAL or TMDL constituents at a PWS site exceeds the running
average at other PWS sites by more than 20 percent. SWS sites would focus on monitoring the specific
constituent of concern and any additional data necessary to help interpret the results. For example, if
the constituent of concern is a trace metal, monitoring at SWS sites would include both TSS and
hardness.

48
Page Left Intentionally Blank

49
8 Non‐Stormwater(NSW)OutfallMonitoringDetailed objectives of the screening and monitoring process (Section IX.A, page E‐23 of the MRP) include
the following:
1. Develop criteria or other means to ensure that all outfalls with significant non‐stormwater
discharges are identified and assessed during the term of this Order.
2. For outfalls determined to have significant non‐stormwater flow, determine whether flows
are the result of illicit connections/illicit discharges (IC/IDs), authorized or conditionally exempt
non‐stormwater flows, natural flows, or from unknown sources.
3. Refer information related to identified IC/IDs to the IC/ID Elimination Program (Part VI.D.10
of the Order) for appropriate action.
4. Based on existing screening or monitoring data or other institutional knowledge, assess the
impact of non‐stormwater discharges (other than identified IC/IDs) on the receiving water.
5. Prioritize monitoring of outfalls considering the potential threat to the receiving water and
applicable TMDL compliance schedules.
6. Conduct monitoring or assess existing monitoring data to determine the impact of non‐
stormwater discharges on the receiving water.
7. Conduct monitoring or other investigations to identify the source of pollutants in non‐
stormwater discharges.
8. Use results of the screening process to evaluate the conditionally exempt non‐stormwater
discharges identified in Parts III.A.2 and III.A.3 of the Order and take appropriate actions
pursuant to Part III.A.4.d of the Order for those discharges that have been found to be a source
of pollutants. Any future reclassification will occur per the conditions in Parts III.A.2 or III.A.6 of
the Order.
9. Maximize the use of Permittee resources by integrating the screening and monitoring
process into existing or planned CIMP efforts.
Ultimately, the NSW program is intended to establish a process for identifying outfalls that serve as
potential sources of contaminants. Sites where initial screening indicates the potential for discharges of
a magnitude considered to have the potential to cause or contribute to exceedances of receiving water
limitations will require further efforts to classify the discharges and determine appropriate actions, if
any.
In cases where flow or other factors show evidence of potential discharges of concern, the program will
take further action to determine if the flows are illicit, exempt, conditionally exempt, conditionally
exempt but non‐essential, or if the source(s) of the discharge cannot be identified (unknown). Illicit
discharges require immediate action and, if they cannot be eliminated, monitoring will be implemented

50
until such time that the illicit discharge can be eliminated. Discharges classified as conditionally exempt
but non‐essential or unknown also require ongoing monitoring.
The following sections summarize the elements of the program and processes to ultimately eliminate
major sources of non‐stormwater discharges.
8.1 Non‐StormwaterOutfallScreeningandMonitoringProgramThe NSW Outfall Screening and Monitoring Program will consist of a screening phase designed to
initially classify outfalls into one of three categories. Three screening surveys will be conducted starting
in the summer of 2014 to identify outfalls or other discharges that are considered to be significant and
persistent sources of non‐stormwater flow to either the open channels or receiving waters.
The initial survey will focus on completing an inventory of all outfalls (refer to Appendix E) to receiving
waters. Outfalls greater than 12‐inches in diameter (or equivalent) will be photographed and
documented. All minor outfalls7 (outfalls less than 36‐inches in diameter or equivalent) without
evidence of the presence of industrial activities will be maintained in the database but will be
considered as not requiring any further action.
If while in the process of conducting any of the site inspections, the inspection team encounters a
transitory discharge, such as a liquid or oil spill, the problem will be immediately referred to the
appropriate local jurisdiction for clean‐up or response. If it is not readily apparent which jurisdictional
authority has responsibility; the discharge will be reported to the WMG technical committee chair.
Information from all three screening surveys will be consolidated to assist in the identification and
ranking of outfalls considered to have significant NSW discharges. Multiple lines of evidence will be
considered when assessing the significance of a discharge. Data from the field screening program such
as flow measurements, general observations and in‐situ water quality information will be given primary
consideration but land uses within the drainage area will also be considered.
A combination of field observations, flow measurements and field water quality measurements
collected during the screening surveys will be used to classify outfalls into one of the following three
categories that will determine further actions (Figure 8‐1):
1. Suspect Discharge – Outfalls with persistent high flows during at least two out of three visits
and with high severity on one or more physical indicators (odors, oil deposits, etc.). Outfalls in
this category require prioritization and further investigation.
7 Minor municipal separate storm sewer outfall (or ‘‘minor outfall’’) means a municipal separate storm sewer
outfall that discharges from a single pipe with an inside diameter of less than 36 inches or its equivalent (discharge
from a single conveyance other than circular pipe which is associated with a drainage area of less than 50 acres); or
for MS4s that receive stormwater from lands zoned for industrial activity (based on comprehensive zoning plans or
the equivalent), an outfall that discharges from a single pipe with an inside diameter of less than 12 inches or from
its equivalent (discharge from other than a circular pipe associated with a drainage area of 2 acres or less)

51
2. Potential Discharge ‐ Flowing or non‐flowing outfalls with presence of two or more physical
indicators. Outfalls in this category are considered to be low priority but will be continue to be
monitored periodically to determine if the sites are subject to less frequent, discharges or
determine if actions can be taken to reduce or eliminate the factors that lead to the site being
considered a potential source of contaminants.
3. Unlikely Discharge ‐ Non‐flowing outfalls with no physical indicators of an illicit discharge.
Outfalls within this classification would be not be subject to any further screening.
Initial screening activities will emphasize use of field water quality instrumentation and/or simple field
test kits to assist in classifying discharges. Collection of water samples for limited laboratory testing may
be incorporated into the program as requirements for more complex, accurate and scientifically
supportable data become necessary to characterize NSW discharges and provide scientifically
supportable data to track the source of these discharges. The Center for Watershed Protection (CWP)
and Pitt (2004) provide an evaluation of twelve analytes for assistance in determining the source of NSW
discharges (Table 8‐2). Three of the analytes can be measured with in‐situ instrumentation. Others can
be analyzed relatively inexpensively by use of field test kits or can be analyzed in an ELAP‐certified
laboratory. In addition, three to five of the listed tests are often considered sufficient to screen for illicit
discharges. Ammonia, MBAS, fluoride (assuming tap water is fluorinated), and potassium are
considered to confidently differentiate between sewage, wash water, tap water and industrial wastes.
Incorporation of in‐situ measurement of temperature, pH, TDS/salinity, turbidity and dissolved oxygen
can further assist in characterizing and tracking the source(s) of an NSW discharge.
8.1.1 IdentificationofOutfallswithSignificantNon‐StormwaterDischargesExisting monitoring data or institutional knowledge (Objective 4) are not available to allow identification
of outfalls with significant NSW discharges. The screening program is necessary to collect information
necessary to identify outfalls with potentially significant NSW discharges. The outfall screening includes
collection of information necessary to provide an accurate inventory of the major outfalls, assess flow
from each outfall and in the receiving waters, determine the general characteristics of the receiving
waters (e.g. is flow present, does the flow from the outfall represent a large proportion of the flow, is it
an earthen or lined channel), and record general observations indicative of possible illicit discharges.
The initial screening survey(s) will also be used to refine the inventory information required in Section
8.1.2.

52
Table 8‐1. Outline of the NSW Outfall Screening and Monitoring Program.
Element Description Timing of Completion
1. Outfall Screening Because data required to implement the NSW Outfall Program are not available, the Permittees will implement a screening process to determine which outfalls exhibit significant NSW discharges and those that do not require further investigation. Data will be recorded on Outfall Reconnaissance Investigation (ORI) forms and in the associated database.
The Outfall Screening process is currently being implemented. Identification of obvious illicit discharges will be immediately addressed. Otherwise, the Outfall Screening process will be completed prior to starting source investigations.
2. Identification of outfalls with significant NSW discharge (Part IX.C of the MRP)
Data from the Outfall Screening process will be used to categorize MS4 outfalls on the basis of discharge flow rates, field water quality and physical observations.
Concurrent with Outfall Screening December 28, 2014 with Annual CIMP Report
3. Inventory of Outfalls with NSW discharge (Part IX.D of the MRP)
Develop an inventory of all major MS4 outfalls, identify outfalls with known NSW discharges and identify outfalls with no flow requiring no further assessment.
Concurrent with Outfall Screening December 28, 2014 with Annual CIMP Report
4. Prioritized source investigation (Part IX.E of the MRP)
Use the data collected during the Outfall Screening process to further prioritize outfalls for source investigations.
Prioritization for Source Investigation will be occur after completion of Outfall Screening
5. Identify sources of significant NSW discharges (Part IX.F of the MRP)
For outfalls exhibiting significant NSW discharges, Permittees will perform source investigations per the established prioritization.
Complete source investigations for 25% of the outfalls with significant NSW discharges by December 28, 2015 and 100% by December 28, 2017
6. Monitoring NSW discharges exceeding criteria (Part IX.G of the MRP)
Monitor outfalls determined to convey significant NSW discharges comprised of either unknown or conditionally exempt non‐essential discharges, or illicit discharges that cannot be abated.
Monitoring will commence within 90 days of completing the source investigations

53
Figure 8‐1. Flow Diagram of NSW Outfall Program after Classifying Outfalls during Initial Screening.

54
Table 8‐2. Potential Indicator Parameters for Identification of Sources of NSW Discharges.
Indicator Parameters
Ammonia E. coli
Boron Fluoride
Chlorine Hardness
Color pH ‐ Field
Conductivity‐Field Potassium
Detergents – Surfactants (MBAS or fluorescence) Turbidity Based upon CWP and Pitt 2004. Illicit Discharge Detection and Elimination A Guidance Manual for Program Development and
Technical Assessments
The outfall screening process has already been initiated in order to meet the established schedule for
completion of 25% of the source identification work. Once the screening process is completed
Permittees are required to identify MS4 outfalls with “significant” NSW discharges. The MRP (Section
IX.C.1) indicates that significant NSW discharges may be determined based upon one or more of the
following characteristics:
a. Discharges from major outfalls subject to dry weather TMDLs.
b. Discharges for which existing monitoring data exceeds Non‐Stormwater Action Levels (NALs)
identified in Attachment G of the Order.
c. Non‐stormwater discharges that have caused or have the potential to cause overtopping of
downstream diversions.
d. Discharges exceeding a proposed threshold discharge rate as determined by the Permittee.
Most of these characteristics are either unlikely to differentiate significant NSW discharges or the
information will not be available when the screening process is completed. Multiple lines of evidence
derived from flow measurements, observations and in‐situ water quality information recorded on the
Outfall Reconnaissance Investigation (ORI) forms used during the screening process will be used to
determine “significant” NSW discharges and appropriately rank sites for source investigations. The
relative magnitude of the discharges, persistence of the flow, visual and physical characteristics
recorded at each site, and land uses associated with the drainage may also be considered.
Characteristics of the receiving waters (flow, channel characteristics –hard or soft‐bottom, etc.) at the
discharge location will also be considered when determining the relative significance of NSW discharges.
The most important consideration is whether the discharge has the potential to cause or contribute to
exceedance of receiving water quality limitations. Factors that provide the best insight with respect to
these impacts will receive the greatest weight when establishing the list of “significant” NSW discharges.

55
8.1.2 InventoryofMS4OutfallswithNon‐StormwaterDischargesPart VII.A of the MRP requires that the CIMP plan(s) include a map(s) and/or database of the MS4 that
includes the elements listed in Table 8‐3. Most required elements are complete and included with this
CIMP. Elements requiring further development include the Effective Impervious Area, information on
the length of open channels and underground pipes equal to or greater than 18 inches, and the drainage
areas associated with each outfall. Sub‐basins used for the WMMS model are currently associated with
each outfall within that sub‐basin. If an outfall is identified as a significant source of NSW discharges,
drainage areas for each targeted outfall will be refined and updated in the database. Additional
information such as documenting presence of significant NSW discharges, links to a database
documenting water quality measurements at sites with significant NSW discharges will be updated
annually and submitted with the CIMP annual report.
As a component of the inventory and screening process, Permittees are required to document the
physical attributes of MS4 outfalls determined to have significant non‐stormwater discharges. Table 8‐4
summarizes the minimum physical attributes required to be recorded and linked to the outfall database.
These data will be maintained using the Outfall Reconnaissance Inventory (ORI) field form and
associated database (Appendix C) developed by CWP and Pitt (2004). Data entry can be accomplished
by completing the ORI form while conducting the screening survey. Current forms are shown in the
Appendix D but may be modified as the parameters and database are modified to provide different
information more relevant to the NSW program.

56
Table 8‐3. Basic Database and Mapping Information for the Watershed.
Database Element Status
Complete Schedule
1. Surface water bodies within the Permittee(s) jurisdiction X
2. Sub‐watershed (HUC 12) boundaries X
3. Land use overlay X
4. Effective Impervious Area (EIA) overlay (if available) Will
provide if available
5. Jurisdictional boundaries X
6. The location and length of all open channel and underground pipes 18 inches in diameter or greater (with the exception of catch basin connector pipes)
X1
7. The location of all dry weather diversions X
8. The location of all major MS4 outfalls within the Permittee’s jurisdictional boundary. Each major outfall shall be assigned an alphanumeric identifier, which must be noted on the map
X2
9. Notation of outfalls with significant non‐stormwater discharges (to be updated annually)
X ongoing
10. Storm drain outfall catchment areas for each major outfall within the Permittee(s) jurisdiction
X3 ongoing
11. Each mapped MS4 outfall shall be linked to a database containing descriptive and monitoring data associated with the outfall. The data shall include:4
a. Ownership X
b. Coordinates X
c. Physical description X
d. Photographs of the outfall, where possible to provide baseline information to track operation and maintenance needs over time
X
e. Determination of whether the outfall conveys significant non‐stormwater discharges
ongoing
f. Stormwater and non‐stormwater monitoring data ongoing 1. Locations are identified but the length of all open channel and underground pipes are not fully documented.
2. Attributes in the shapefile contain a Unique ID for all outfalls greater than 12” in diameter.
3. Catchments for each outfall are included as the area of the sub‐basins associated with each outfall. Several outfalls may
drain these sub‐basins. Data will be developed as needed to resolve the drainage areas specific to each outfall.
4. Efforts are ongoing to define ownership and maintenance responsibility. As data become available, information
regarding the conveyance of NSW and associated water quality data will be added to the database. Information will be
updated based upon the three screening surveys.

57
Table 8‐4. Minimum Physical Attributes Recorded during the Outfall Screening Process.
Database Element
a. Date and time of last visual observation or inspection
b. Outfall alpha‐numeric identifier
c. Description of outfall structure including size (e.g., diameter and shape)
d. Description of receiving water at the point of discharge (e.g., natural, soft‐bottom with armored sides, trapezoidal, concrete channel)
e. Latitude/longitude coordinates
f. Nearest street address
g. Parking, access, and safety considerations
h. Photographs of outfall condition
i. Photographs of significant non‐stormwater discharge (or indicators of discharge) unless safety considerations preclude obtaining photographs
j. Estimation of discharge rate
k. All diversions either upstream or downstream of the outfall
l. Observations regarding discharge characteristics such as turbidity, odor, color, presence of debris, floatables, or characteristics that could aid in pollutant source identification
m. Observations regarding the receiving water such as flow, channel type, hard/soft bottom (added minimum attribute.)
8.1.3 PrioritizedSourceIdentificationAfter completion of the initial reconnaissance survey and the two additional screening surveys, sites will
be ranked based upon both initial flow observations from the reconnaissance inventory and the
classifications assigned during each of the screening surveys. Source investigations will be scheduled to
be conducted at sites categorized as Potential Illicit discharges.
The MRP (IX.E.1) states that prioritization of source investigations should be based upon the following
items in order of importance.
a. Outfalls discharging directly to receiving waters with WQBELs or receiving water limitations
in the TMDL provisions for which final compliance deadlines have passed.
b. All major outfalls and other outfalls that discharge to a receiving water subject to a TMDL
shall be prioritized according to TMDL compliance schedules.
c. Outfalls for which monitoring data exist and indicate recurring exceedances of one or more
of the Action Levels identified in Attachment G of this Order.
d. All other major outfalls identified to have significant non‐stormwater discharges.

58
Additional information from the screening process will be used to refine priorities. Sites with evidence
of higher, more frequent flow, presence of odors or stains will be assigned higher priorities for source
investigations.
8.1.4 IdentifySource(s)ofSignificantNon‐StormwaterDischargesThe screening and source identification component of the program is intended to identify the source or
sources of contaminants contributing to an NSW discharge. The prioritized list of major outfalls with
significant NSW discharges will be used to direct investigations starting with outfalls deemed to present
the greatest risk to the receiving water body.
The Order requires the WMG to develop a source identification schedule based on the prioritized list of
outfalls exhibiting significant NSW discharges. Source investigations will be conducted for no less than
25% of the outfalls in the inventory by December 2015 and 100% of the outfalls in the inventory by
December 2017.
Part IX.A.2 of the MRP requires Permittees to classify the source investigation results into one of four
endpoints: illicit connections/illicit discharges (IC/IDs), authorized or conditionally exempt non‐
stormwater flows, natural flows, or from unknown sources. If source investigations indicate the source
is illicit or unknown, the Permittee will document actions to eliminate the discharge and implement
monitoring if the discharge cannot be eliminated.
If the source of a discharge is found to be attributable to natural flows or authorized conditionally
exempt NSW discharge, the Permittee must identify the basis for the determination (natural flows) and
identify the NPDES permitted discharger. If the source is found to be a conditionally exempt but non‐
essential discharge, monitoring is required to determine whether the discharge should remain
conditionally exempt or be prohibited.
Source investigations will be conducted using a variety of different approaches depending upon the
initial screening results, land use within the area drained by the discharge point, and the availability of
drainage maps. Any additional water quality sampling will emphasize analysis of simple indicators, most
of which can be either taken to a laboratory or analyzed in the field using field test kits. Such testing
would only be conducted as needed to differentiate major sources of flows or to assist in assessing
mixed sources rather than detailed characterization of the discharge. Investigations may include:
Tracking of dry weather flows from the location where they are first observed in an upstream
direction along the conveyance system.
Collection of additional water samples for analysis of NWS indicators for assistance in
differentiating major categories of discharges such as tap water, groundwater, wash waters and
industrial wastewaters.
Compiling and reviewing available resources including past monitoring and investigation data,
land use/MS4 maps, aerial photography, existing NPDES discharge permits and property
ownership information.

59
If source tracking efforts indicate that the discharge originates from a jurisdiction upstream of the
boundaries of the LCC WMP, the appropriate jurisdiction and the Regional Board will be notified in
writing of the discharge within 30 days of the determination. All existing information regarding
documentation and characterization of the data, contribution determination efforts, and efforts taken
to identify its source will be included.
Investigations will be concluded if authorized, natural, or essential conditionally exempt flows are found
to be the source of the discharge. If the discharge is determined to be due to non‐essential
conditionally exempt, illicit, or unknown discharges, further investigations will be considered to assess
whether the discharge can be eliminated. Alternatively, if the discharges are either non‐essential
conditionally exempt or of an unknown source, additional investigations may be conducted to
demonstrate that it is not causing or contributing to receiving water impairments.
8.1.5 MonitorNon‐StormwaterDischargesExceedingCriteriaAs required in the MRP (Part II.3.3), outfalls with significant NSW discharges that remain unaddressed
after source identification will be monitored. The objectives of the non‐stormwater outfall based
monitoring program include the following:
a. Determine whether a Permittee’s discharge is in compliance with applicable NSW WQBELs
derived from TMDL WLAs;
b. Determine whether a Permittee’s discharge exceeds NSW action levels, as described in
Attachment G of the Order;
c. Determine whether a Permittee’s discharge contributes to or causes an exceedance of receiving
water limitations; and
d. Assist a Permittee in identifying illicit discharges as described in Part VI.D.10 of the Order.
After completion of source investigations, outfalls found to convey NSW discharges that could not be
abated and were identified as illicit, conditionally exempt but non‐essential or unknown will be
monitored. Monitoring will be initiated within 90 days of completing the source investigations or as
soon as the first scheduled dry weather survey. Conducting NSW monitoring at the same time as
receiving water dry weather monitoring will be more cost effective and allow evaluation of whether the
NSW discharges are causing or contributing to any observed exceedances of water quality objectives in
the receiving water.
Monitoring of NSW discharges is expected to undergo substantial changes from year to year as the
result of ongoing actions taken to control or eliminate these discharges. As NSW discharges are
addressed, monitoring of the discharges will no longer be required. In addition, if monitoring
demonstrates that discharges do not exceed any WQBELs, non‐stormwater action levels, or water
quality standards for pollutants identified on the 303(d) list after the first year, monitoring of the
pollutants meeting all receiving water limitations will be no longer be necessary. Due to potential
frequent adjustments in the number and location of outfalls requiring monitoring and pollutants

60
requiring monitoring, the annual CIMP report is expected to communicate adjustments in the number
and locations of monitored discharges, pollutants being monitored and justifications for any
adjustments.
8.1.5.1 MonitoringParametersandFrequencyThe MRP (Section IX.G.1) specifies the minimum parameters for monitoring of NSW discharges.
Determination of monitoring parameters at each site requires consideration of a number of factors
applicable to each site. Monitoring parameters will include:
a. Flow;
b. Pollutants assigned a WQBEL or receiving water limitation to implement TMDL Provisions for the
respective receiving water, as identified in Attachments L ‐ R of the Order;
c. Other pollutants identified on the CWA section 303(d) List for the receiving water or downstream
receiving waters;
d. Pollutants identified in a TIE conducted in response to observed aquatic toxicity during dry
weather at the nearest downstream receiving water monitoring station (LCC1) during the last
sample event or, where the TIE conducted on the receiving water sample was inconclusive,
aquatic toxicity (if the discharge exhibits aquatic toxicity, then a TIE shall be conducted); and
e. Other parameters in Table E‐2 identified as exceeding the lowest applicable water quality
objective at LCC1 (the nearest downstream receiving water station) per Part VI.D.1.d.
The MRP (Part IX.G.2‐4) specifies the following monitoring frequency for NSW outfall monitoring:
For outfalls subject to a dry weather TMDL, the monitoring frequency shall be per the approved
TMDL monitoring plan or as otherwise specified in the TMDL or as specified in an approved
CIMP.
For outfalls not subject to dry weather TMDLs, approximately quarterly for first year.
Monitoring can be eliminated or reduced to twice per year, beginning in the second year of
monitoring if pollutant concentrations measured during the first year do not exceed WQBELs,
MALs or water quality standards for pollutants identified on the 303(d) List.
While a monitoring frequency of four times per year is specified in the Permit, it is inconsistent with the
dry weather receiving water monitoring requirements. The receiving water monitoring requires two dry
weather monitoring events per year. Additionally, during the term of the current Permit, outfalls are
required to be screened at least once and those with significant NSW discharges will be subject to a
source investigation. As a result, the LCC WMG recommends that NSW outfall monitoring events be
conducted twice per year. The NSW outfall monitoring events will be coordinated with the dry weather
receiving water monitoring events to provide better opportunities to determine if the NSW discharges
are causing or contributing to any observed exceedances of water quality objectives in the receiving
water.

61
Any monitoring required will be performed using grab samples (refer to Appendix A for field sampling
procedures) rather than automated samplers. Bacteria, which are expected to be the limiting factor at
many sites during dry weather, require collection by grab methods and delivery to the laboratory within
6 hours. Based upon the much reduced variability experienced in measurements of dry weather flows
associated with ongoing monitoring programs, measured concentrations of other analytes are not
expected to vary significantly over a 24‐hour period.

62
Page Left Intentionally Blank
63
9 NewDevelopment/Re‐DevelopmentEffectivenessTrackingEach of the cities in the watershed will maintain an electronic database to track qualifying new
development and re‐development projects that are subject to the Planning and Land Development
Programs of Part VI.D.7 of Order No. R4 2012‐ 0175 and Part VII.J of Order No. R4 2014‐0024. The
electronic databases contain the information listed in Table 9‐1 that includes details about the project
and the design of onsite and offsite best management practices, as well as descriptions of the required
information.
To promote consistency across the watershed and facilitate future planning and research within the
watershed, all of the cities within the watershed are subscribing to MS4Front, a web‐based software
system designed to streamline record keeping for MS4 permits and assists with annual reporting. The
cities concluded that although it is a sophisticated management tool, it is flexible and relatively easy to
use. The existing tracking programs will be converted to MS4Front.

64
Table 9‐1. Information Required in the New Development/Re‐Development Tracking Database.
RequiredInformation Description
General
Site
Inform
ation
ProjectNameandDeveloperNameBrief name of project and developer information (e.g. name,address,andphonenumber).
ProjectLocationandMapCoordinatesandmapoftheprojectlocation.Themapshouldbelinked to theGIS storm‐drainmap required inpartVII.Aof thePermit.
Documentationofissuanceofrequirementstothedeveloper
Date that the project developer was issued the Permitrequirementsfortheproject(e.g.conditionsofapproval).
DateofCertificateofOccupancy DatethattheCertificateofOccupancywasissued.
On‐siteBMPSizingInform
ation
85th percentile storm event (inches per 24hours)
85th percentile storm depth for the project location calculatedusing the Analysis of 85th Percentile 24‐hour Rainfall DepthsWithintheCountyofLosAngeles.
95th percentile storm event (inches per 24hours)
95th percentile storm depth for the project location calculatedusing the Analysis of 85th Percentile 24‐hour Rainfall DepthsWithin the County of Los Angeles. Only applies if the projectdrains directly to a natural drainage system8and is subject tohydromodificationcontrolmeasures.
Projectdesignstorm(inchesper24hours)ThedesignstormforeachBMPascalculatedusingtheAnalysisof85thPercentile24‐hourRainfallDepthsWithin theCountyofLosAngeles.
Projectsdesignvolume(gallonsorMGD)Thedesignstormvolume(designstormmultipliedby tributaryareaandrunoffcoefficient)foreachBMP.
Percentofdesignstormvolumetoberetainedonsite
The percentage of the design volume which on‐site BMPs willretain.
Other design criteria required to meethydromodification requirements for projectsthatdirectlydraintonaturalwaterbodies
Information relevant to determine if the project meetshydromodificationrequirementsasdescribed inthePermite.g.,peak flow and velocity in natural water body, peak flow fromproject area inmitigated and unmitigated condition, etc.). Onlyappliesiftheprojectdrainsdirectlytoanaturaldrainagesystem.
One ‐year, one‐hour storm intensity asdepictedonthemostrecentlyissuedisohyetalmap published by the Los Angeles CountyHydrologistforflow‐throughBMPs
If flow‐through BMPs (e.g., sand filters,media filters) forwaterquality are used at the project, provide the one‐year, one‐hourstormintensityattheprojectsitefromthemostrecentisohyetalmapissuedbyLACounty.
Off‐siteBMPInformation
Location and maps of off‐site mitigation,groundwaterreplenishment,orretrofitsites
If any off‐site mitigation is used, provide locations and mapslinked to theGIS storm‐drainmap required inpartVII.Aof thePermit.
Design volume for water quality mitigationtreatmentBMPs
The calculated design volume, If water quality mitigation isrequired.
Percent of design storm volume to beinfiltrated at an off‐site mitigation orgroundwaterreplenishmentprojectsite
Thepercentageofthedesignvolumewhichoff‐sitemitigationorgroundwaterreplenishmentwillretain.
Percentofdesignstormvolumetoberetainedor treated with biofiltration at an off‐siteretrofitproject
Thepercentageof thedesignvolumewhichoff‐sitebiofiltrationwillretainortreat.
8 A natural drainage system is defined as a drainage system that has not been improved (e.g., channelized or
armored). The clearing or dredging of a natural drainage system does not cause the system to be classified as an
improved drainage system.

65
10 ReportingReportingwillnormallyconsistofAnnualCIMPReportsandsemi‐annualdatareports.DischargeAssessmentPlanswillonlybesubmitted ifTIEsare foundtoproduce inconsistentresultsduringtwoconsecutivetests.Theseincludethefollowingreports:
Annual CIMP Reports
Annual CIMP monitoring reports are required to be submitted to the Regional Water BoardExecutiveOfficer byDecember 15th of each year in the form of three compact disks (CDs). Thereporting periodwill cover July 1 through June 30. The annual reporting process is intended tomeetthefollowingobjectives.
SummaryinformationallowingtheRegionalBoardtoassess:
a. EachPermittee’sparticipationinoneormoreWatershedManagementPrograms.b. The impact of each Permittee(s) stormwater and non‐stormwater discharges on thereceivingwater.
c. EachPermittee’scompliancewithreceivingwaterlimitations,numericwaterquality‐basedeffluentlimitations,andnon‐stormwateractionlevels.
d. TheeffectivenessofeachPermittee(s)controlmeasuresinreducingdischargesofpollutantsfromtheMS4toreceivingwaters.
e. Whether the quality of MS4 discharges and the health of receiving waters is improving,staying the same,ordeclining as a resultwatershedmanagementprogramefforts, and/orTMDLimplementationmeasures,orotherMinimumControlMeasures.
f. Whether changes inwaterquality canbeattributed topollutant controls imposedonnewdevelopment,re‐development,orretrofitprojects.
DataSubmittals
AnalyticaldatareportsarerequiredtobesubmittedtotheRegionalBoardonasemi‐annualbasisin accordance with the Southern California Municipal Storm Water Monitoring Coalition’sStandardizedDataTransferFormats. Thesereportsarerequiredtobesubjecttoverificationandvalidationpriortosubmittal.TheyaretocovermonitoringperiodsofJuly1throughDecember31for themid‐year report and January 1‐ June 30 for the end of year report. These data reportsshouldsummarize:
Exceedances of applicableWQBELs, receivingwater limitations, or any available interimactionlevelsorotheraquatictoxicitythresholds.
Basicinformationregardingsamplingdates,locations,orotherpertinentdocumentation.

66
Page Left Intentionally Blank

67
11 ReferencesAmerican Public Health Association. 1992. Standard Methods for the Examination of Water and
Wastewater, 18th ed. American Public Health Association, Washington DC.
American Public Health Association. 1995. Standard Methods for the Examination of Water and
Wastewater, 19th ed. American Public Health Association, Washington DC.
Bonin, Jennifer L. and Timothy P. Wilson (2006). Organic Compounds, Trace Elements, Suspended
Sediment, and Field Characteristics at the Heads‐of‐Tide of the Raritan, Passaic, Hackensack,
Rahway, and Elizabeth Rivers, New Jersey, 2000‐03,Prepared in cooperation with the New
Jersey Department of Environmental Protection. Data Series 123. U.S. Geological Survey.
Center for Watershed Protection and R. Pitt. 2004. Illicit Discharge Detection and Elimination A
Guidance Manual for Program Development and Technical Assessments. Center for Watershed
Protection and University of Alabama. EPA Agreement X‐82907801‐0 Brown, E., D. Caraco
Clark, S. E., C. Y. S. Siu, et al. 2009. "Peristaltic Pump Autosamplers for Solids Measurement in
Stormwater Runoff." Water Environment Research 81: 192‐200.
Council for Watershed Health (CWH) and ABC Laboratories, Inc., 2013. 2011 San Gabriel River Regional
Monitoring Program, 2011 Annual Report.
Cowgill, U.M. and D.P. Milazzo. 1990. The sensitivity of two cladocerans to water quality variables,
salinity and hardness. Arch. Hydrobiol. 120:185–196.
Gilbreath, A. N., Pearce, S. P. and McKee, L. J. (2012). Monitoring and Results for El Cerrito Rain
Gardens. Contribution No. 683. San Francisco Estuary Institute, Richmond, California.
Gilinsky, Ellen (2009). TMDL Guidance Memo No. 09‐2001. Guidance for monitoring of point sources for
TMDL development using low‐level PCB method 1668. Commonwealth of Virginia Department
of Environmental Quality, Water Division.
Harwood, A.D, J. You, and M.J. Lydy. 2009. Temperature as a toxicity identification evaluation tool for
pyrethroid insecticides: toxicokinetic confirmation. Environmental Toxicology and
Chemistry 28(5):1051‐1058
Horowitz, A.J. 1995. The use of suspended sediment and associated trace elements in Water quality
studies: Wallingford, Oxfordshire, IAHS Press, IAHS Special Publication no. 4, 58 p.
Kayhanian, M., C. Stransky, S. Bay, S. Lau, M.K. Stenstrom. 2008. Toxicity of urban highway runoff with
respect to storm duration. Science of the Total Environment 389:109‐128.
Lalor, M. 1994. Assessment of Non‐Stormwater Discharges to Storm Drainage Systems in Residential and
Commercial Land Use Areas. Ph.D. Thesis. Vanderbilt University Department of Environmental
and Water Resources Engineering. Nashville, TN.

68
Lee, G. F. and A. Jones‐Lee. “Review of the City of Stockton Urban Stormwater Runoff Aquatic Life
Toxicity Studies Conducted by the CVRWQCB, DeltaKeeper and the University of California,
Davis, Aquatic Toxicology Laboratory between 1994 and 2000,” Report to the Central Valley
Regional Water Quality Control Board, G. Fred Lee & Associates, El Macero, CA, October (2001).
Levin, M.A., J.R. Fischer and V.J. Cabelli. 1975. Membrane Filtration Technique for Enumeration of
Enterococci in Marine Waters. Applied Microbiology 30: 66‐71.
Los Angeles Regional Water Quality Control Board, Los Angeles (LARWQCB). 2012 Waste Discharge
Requirements for Municipal Separate Storm Sewer System Discharges within the Coastal
Watersheds of Los Angeles County except those discharges originating from the City of Long
Beach. Order No. R4‐2012‐0175, NPDES Permit No. CAS004001
Los Angeles Regional Water Quality Control Board, Los Angeles (LARWQCB). 2014 Waste Discharge
Requirements for Municipal Separate Storm Sewer System Discharges from the City of Long
Beach. Order No. R4‐2014‐0024, NPDES Permit No. CAS004003
Mahler, B.J., P.C. Van Metre, J.T. Wilson, A.L Guilfoyle and M.W. Sunvison 2006. Concentrations, loads,
and yields of particle‐associated contaminants in urban creeks, Austin, Texas, 1999–2004: U.S.
Geological Survey Scientific Investigations Report 2006–5262, 107 p.
McCarty, Harry B., J. Schofield, K. Miller, R. N. Brent, P. Van Hoof, and B. Eadie. 2004. Results of the Lake
Michigan Mass Balance Study:Polychlorinated Biphenyls and trans‐Nonachlor Data Report.
Prepared for US EPA Great Lakes National Program, EPA 905 R‐01‐011.
Messer, J.W. and A.P. Dufour. 1997. Method 1600: Membrane Filter Test Method for Enterococci in
Water. US EPA Office of Water, Washington, DC. EPA‐821‐R‐97_004.
Messer, J.W. and A.P. Dufour. 1998. A Rapid, Specific Membrane Filtration Procedure for Enumeration
of Enterococci in Recreational Water. Appl. Environ. Microbiol. 64: 678‐680.
Palumbo, A., Fojut, T., Brander, S., and Tjerdeema, R. 2010b. Water Quality Criteria Report for
Bifenthrin. Prepared for the Central Valley Regional Water Quality Control Board by the
Department of Environmental Toxicology, University of California, Davis. March.
Palumbo, A., Fojut, T., TenBrook, P. and Tjerdeema, R. 2010a. Water Quality Criteria Report for Diazinon.
Prepared for the Central Valley Regional Water Quality Control Board by the Department of
Environmental Toxicology, University of California, Davis. March.
Pitt, R. et al. 1993. A User’s Guide for the Assessment of Non‐Stormwater Dischargers Into Separate
Storm Drainage Systems. EPA/600‐R‐92‐238. Risk Reduction Engineering Laboratory, USEPA.
Cincinnati, OH.
Rantz, S.E and others. 1982. Measurement and Computation of Streamflow: Volume 1. Measurement
of Stage and Discharge. Geological Survey Water‐Supply Paper 2175.

69
State of California’s Surface Water Ambient Monitoring Program September 1, 2008
http://www.waterboards.ca.gov/water_issues/programs/swamp/docs/qapp/qaprp082209.pdf
State Water Resources Control Board (SWRCB). 2012. Policy of Toxicity Assessment and Control. Public
Review Draft, June 2012.
2012Stenstrom, Michael K., I.H. (Mel) Suffet and Victor Vasquez. 2009. Final Data Evaluation Report,
Field Studies for the Development of Total Maximum Daily Loads for Organochlorine Pesticides
and Polychlorinated Biphenyls in Three Los Angeles Count Lakes. Institute of the Environment,
UCLA. Report to Los Angeles Regional Water Quality Control Board, March 15, 2009.
Texas Commission on Environmental Quality (TCEQ). 2012. Surface Water Quality Monitoring
Procedures, Volume 1: Physical and Chemical Monitoring Method. RG415
U.S. Geological Survey (1997) Protocols for Cleaning a Teflon Cone Splitter to Produce Contaminant‐Free
Subsamples for Subsequent Determinations of Trace Elements: OFFICE OF WATER QUALITY
TECHNICAL MEMORANDUM 97.03 http://water.usgs.gov/admin/memo/QW/qw97.03.html
U.S. Geological Survey (1998) Change in Nitric Acid Preservative for Trace Element Samples: OFFICE OF
WATER QUALITY TECHNICAL MEMORANDUM 98.06:
http://water.usgs.gov/admin/memo/QW/qw98.06.html
United States Environmental Protection Agency (EPA). 1991. Methods for Aquatic Toxicity Identification
Evaluations: Phase I. Toxicity Characterization Procedures. 2nd Edition. EPA‐600‐6‐91‐003.
National Effluent Toxicity Assessment Center, Duluth, MN.
United States Environmental Protection Agency (EPA). 1992. Toxicity Identification Evaluation:
Characterization of Chronically Toxic Effluents, Phase I. EPA/600/6‐91/005F. May 1992. National
Effluent Toxicity Assessment Center, Duluth, MN.
United States Environmental Protection Agency (EPA). 1993a. Methods for Aquatic Toxicity
Identification Evaluations‐ Phase II Toxicity Identification Procedures for Samples Exhibiting
Acute and Chronic Toxicity. EPA‐600‐R‐92‐080. National Effluent Toxicity Assessment Center,
Duluth, MN.
United States Environmental Protection Agency (EPA). 1993b. Methods for Aquatic Toxicity
Identification Evaluations‐ Phase III Toxicity Confirmation Procedures for Samples Exhibiting
Acute and Chronic Toxicity. EPA‐600‐R‐92‐081. National Effluent Toxicity Assessment Center,
Duluth, MN.
United States Environmental Protection Agency (EPA). 1996. The Metals Translator: Guidance for
Calculating a Total Recoverable Permit Limit from a Dissolved Criterion. EPA823‐B‐96‐007, June
1996

70
United States Environmental Protection Agency (EPA). 1996. Guidance on the Documentation and
Evaluation of Trace Metals Data Collected for Clean Water Act Compliance Monitoring ‐ Draft.
Office of Water, Office of Science and Technology, E. A. D. (4303), M. S. SW and D. Washington.
United States Environmental Protection Agency (EPA). 1996. "Method 1669 Sampling Ambient Water for
Trace Metals at EPA Water Quality Criteria Levels."
United States Environmental Protection Agency (EPA). 2002a United States Environmental Protection
Agency (EPA). 2002a. Short‐term Methods for Estimating the Chronic Toxicity of Effluents and
Receiving Waters to Freshwater Organisms. Fourth Edition. October. EPA‐821‐R‐02‐013.
United States Environmental Protection Agency (EPA). 2007. Aquatic Life Ambient Freshwater Quality
Criteria – Copper. February. EPA‐822‐R‐07‐001.
United States Environmental Protection Agency (EPA). 2010. National Pollutant Discharge Elimination
System Test of Significant Toxicity Technical Document. EPA/833‐R‐10‐004, U.S. Environmental
Protection Agency, Office of Environmental Management, Washington,
United States Environmental Protection Agency (EPA). 2010. Los Cerritos Channel Total Daily Maximum
Loads for Metals. 17 March 2010.
United States Geological Services (USGS) 2011. National Field Manual for the collection of Water‐
Quality Data. (TWRI Book 9), Chauncey Anderson 2005. Chapter 6.7.
http://water.usgs.gov/owq/FieldManual/Chapter6/6.7_contents.html
Walkowiak, D. K., Ed. (2008). Isco Open Channel Flow Measurement Handbook.
Weston, D.P. and E.L. Amweg. 2007. Whole sediment toxicity identification evaluation tools for
pyrethroid insecticides: II. Esterase addition. Environmental Toxicology and Chemistry 26:2397‐
2404.
Wheelock, C., Miller, J., Miller, M., Gee, S., Shan, G. and Hammock, B. 2004. Development of Toxicity
Identification Evaluation (TIE) procedures for pyrethroid detection using esterase activity.
Environmental Toxicology and Chemistry 23:2699‐2708.
Wilson, Timothy P. 2006. Results of Cross‐Channel Monitoring During the Lower Passaic River
Environmental Dredging Pilot Program on the Lower Passaic River, December 1 to 12, 2005.
USGS Report, West Trenton, New Jersey
Recommended