University of Southern Queensland
Faculty of Engineering and Surveying
Local and post-local buckling of steel tubes in thin-
walled circular concrete-filled steel tubular
columns
A dissertation submitted by
Mr Craig Louis Walker
In fulfilment of the requirements of
Courses ENG4111 and ENG4112 Research Project
Towards the degree of
Bachelor of Engineering (Civil)
Submitted: November 2006
II
Abstract
The local and post-local buckling behaviour of steel tubes in thin-walled circular
concrete-filled steel tubular columns under axial load is presented. Geometric and
material nonlinear finite element analysis is conducted on steel tubes under
uniform edge compression to determine critical local and post-local buckling
strengths.
The local and post-local buckling of steel tubes reduces the ultimate loads of thin-
walled circular CFST columns under axial compression. Limited experimental
research on CFST columns has been conducted. The effects of local and post-
local buckling on the behaviour of thin-walled circular CFST columns have not
been adequately researched.
Three-dimensional finite element models are developed using the finite element
technique. Initial geometric imperfections, residual stresses, material yielding and
strain hardening are considered in the analysis. Based on the results obtained from
the nonlinear finite element analysis, a set of design formulas is proposed for
determining the critical local buckling loads and ultimate strengths of steel tubes
in thin-walled circular CFST columns. The proposed design formulas are verified
by comparisons with existing experimental results.

III
University of Southern Queensland
Faculty of Engineering and Surveying
Limitations of Use
The Council of the University of Southern Queensland, its Faculty of Engineering
and Surveying, and the staff of the University of Southern Queensland, do not
accept any responsibility for the truth, accuracy or completeness of material
contained within or associated with this dissertation.
Persons using all or any part of this material do so at their own risk, and not at the
risk of the Council of the University of Southern Queensland, its Faculty of
Engineering and Surveying or the staff of the University of Southern Queensland.
This dissertation reports an educational exercise and has no purpose or validity
beyond this exercise. The sole purpose of the course pair entitled "Research
Project" is to contribute to the overall education within the student’s chosen
degree program. This document, the associated hardware, software, drawings, and
other material set out in the associated appendices should not be used for any
other purpose: if they are so used, it is entirely at the risk of the user.
Professor R Smith
Dean
Faculty of Engineering and Surveying
ENG4111 & ENG4112 Research Project

IV
Certification
I certify that the ideas, designs and experimental work, results, analyses and
conclusions set out in this dissertation are entirely my own effort, except where
otherwise indicated and acknowledged.
I further certify that the work is original and has not been previously submitted for
assessment in any other course, except where specifically stated.
Craig Walker
Student Number: Q11211742
Signature
Date

V
Acknowledgements
The author would like to express sincere gratitude to his supervisor Dr. Qing
Quan Liang for his guidance and support throughout this project.
The research involved a significant amount finite element modelling for which the
author was unfamiliar. Dr. Liang did not hesitate in providing advice and
guidance throughout this dissertation whenever it was required and the author
thanks him for his patience.
The author also wishes to thank his family and friends for their kind assistance
and support throughout the course of this project.
Mr Craig Walker
November, 2006.

VI
TABLE OF CONTENTS
Abstract ...................................................................................................................II
Limitations of Use..................................................................................................III
Certification........................................................................................................... IV
Acknowledgements.................................................................................................V
List of Figures .........................................................................................................X
List of Tables........................................................................................................XII
Nomenclature ......................................................................................................XIII
Chapter 1 INTRODUCTION......................................................................... 1
1.1 Background ............................................................................................. 1
1.2 Application of CFST Columns ............................................................... 2
1.3 Project Aims and Objectives................................................................... 4
1.4 Structure of Dissertation .........................................................................5
1.5 Summary ................................................................................................. 7
Chapter 2 LITERATURE REVIEW ............................................................. 8
2.1 Introduction............................................................................................. 8
2.2 Theoretical Studies.................................................................................. 9
2.2.1 Finite Element Analysis Studies ..................................................... 9
2.2.2 Analytical Studies ......................................................................... 14
2.3 Experimental Studies ............................................................................ 17
2.3.1 Circular CFST Columns................................................................ 17

TABLE OF CONTENTS
VII
2.3.2 Square CFST Columns.................................................................. 21
2.4 Design Codes ........................................................................................ 25
2.4.1 European Committee for Standardisation (Eurocode 4) ............... 26
2.4.2 American Concrete Institute (ACI 318)........................................ 27
2.4.3 Chinese Code (DL/T5085-1999) .................................................. 27
2.5 Summary ............................................................................................... 28
Chapter 3 FINITE ELEMENT ANALYSIS............................................... 29
3.1 Introduction........................................................................................... 29
3.2 Finite Element Model............................................................................ 30
3.2.1 Specifications of Standard Model ................................................. 30
3.2.2 Standard Model Procedure............................................................ 31
3.3 Sensitivity Analysis............................................................................... 34
3.4 Minimum Buckling Coefficient ............................................................ 35
3.5 Initial Imperfections.............................................................................. 36
3.5.1 Geometric Imperfections............................................................... 36
3.5.2 Residual Stresses........................................................................... 38
3.6 Material Stress-Strain Curve................................................................. 39
3.7 Von Mises Yield Criterion.................................................................... 41
3.8 Summary ............................................................................................... 42
Chapter 4 DESIGN METHODOLOGY ..................................................... 43
4.1 Introduction........................................................................................... 43
4.2 Finite Element Analysis ........................................................................ 44
TABLE OF CONTENTS
VIII
4.2.1 Critical Local Buckling Strength .................................................. 44
4.2.2 Post-Local Buckling Reserve Strength ......................................... 46
4.3 Design Formulas ...................................................................................48
4.3.1 Effective Strength Formula........................................................... 48
4.3.2 Ultimate Strength Formula............................................................ 49
4.4 Summary ............................................................................................... 49
Chapter 5 RESULTS AND DISCUSSION ................................................. 50
5.1 Introduction........................................................................................... 50
5.2 Initial Analysis ...................................................................................... 51
5.2.1 Sensitivity Analysis....................................................................... 51
5.2.2 Minimum Buckling Coefficient .................................................... 53
5.3 Effects of Geometric Imperfections...................................................... 54
5.3.1 Load-Deflection Curves ................................................................ 55
5.3.2 Critical Buckling Coefficient ........................................................ 57
5.3.3 Post-Local Buckling Reserve of Strength ..................................... 58
5.4 Effects of Slenderness ratio................................................................... 59
5.4.1 Load-Deflection Curves ................................................................ 60
5.4.2 Load-Edge Shortening Curves ...................................................... 62
5.4.3 Critical Buckling Coefficient ........................................................ 63
5.4.4 Post-Local Buckling Reserve of Strength ..................................... 65
5.5 Effects of Height-to-Diameter Ratios ................................................... 66
5.5.1 Load-Deflection Curves ................................................................ 66
5.5.2 Critical Buckling Coefficient ........................................................ 68
TABLE OF CONTENTS
IX
5.5.3 Post-Local Buckling Reserve of Strength ..................................... 70
5.6 Effective Strength Formula................................................................... 71
5.6.1 Proposed Effective Strength Formula ........................................... 71
5.6.2 Verification of Effective Strength Formula .................................. 72
5.7 Ultimate Strength Formula.................................................................... 74
5.7.1 Proposed Ultimate Strength Formula............................................ 74
5.7.2 Verification of Ultimate Strength Formula ................................... 74
5.8 Summary ............................................................................................... 77
Chapter 6 CONCLUSIONS AND RECOMMENDATIONS....................78
6.1 Summary ............................................................................................... 78
6.2 Achievement of Aims and Objectives .................................................. 78
6.3 Conclusions........................................................................................... 81
6.4 Recommendations................................................................................. 82
Appendix A .......................................................................................................... 83
References ............................................................................................................ 85

X
List of Figures
Figure 1.1: Cross section of CFST column............................................................. 3
Figure 3.1: Finite element model subjected to axial edge pressure. ..................... 33
Figure 3.2: Finite element model with a mesh size of 12x12 mm. ....................... 35
Figure 3.3: Finite element model subjected to lateral face pressure. .................... 37
Figure 3.4: Material stress-strain curve of steel tubes with residual stresses........ 39
Figure 3.5: Stress-strain curve based on the Ramberg-Osgood model. ................ 40
Figure 4.1: Contour plot of displacement (DX axis)............................................. 45
Figure 4.2: Contour plot of stress distribution (YY axis). .................................... 47
Figure 5.1: Load-deflection curves for sensitivity analysis. ................................ 52
Figure 5.2: Buckling coefficient verses half wavelength..................................... 53
Figure 5.3: Load-deflection curves for tubes with different geometric
imperfections......................................................................................................... 55
Figure 5.4: Transverse deflection verses w/σa curves for tubes with different
geometric imperfections........................................................................................ 57
Figure 5.5: Load-deflection curves for tubes with different slenderness ratios.... 60
Figure 5.6: Load-edge shortening curves for tubes with different slenderness
ratios...................................................................................................................... 62
Figure 5.7: Transverse deflection verses w/σa curves for tubes with different
slenderness ratios. ................................................................................................. 64
Figure 5.8: Load-deflection curves for tubes with different h/D ratios. ............... 67
LIST OF FIGURES
XI
Figure 5.9: Transverse deflection verses w/σa curves for tubes with different h/D
ratios...................................................................................................................... 69
Figure 5.10: Comparison of critical buckling strengths obtained from FEA and
proposed formula. ................................................................................................. 72
Figure 5.11: Comparison of effective strength formula and experimental data. .. 73
Figure 5.12: Comparison of ultimate strengths attained from FEA and proposed
formula. ................................................................................................................. 75
Figure 5.13: Comparison of ultimate strength formula and experimental data. ... 76
XII
List of Tables
Table 5.1: Ultimate stress for sensitivity analysis................................................. 52
Table 5.2: Ultimate stresses for tubes with different geometric imperfections. ... 56
Table 5.3: Critical buckling loads for tubes with different geometric
imperfections......................................................................................................... 58
Table 5.4: Post-local buckling reserve strengths for tubes with different geometric
imperfections......................................................................................................... 59
Table 5.5: Ultimate stresses for tubes with different slenderness ratios. .............. 61
Table 5.6: Ultimate edge shortening for tubes with different slenderness effects.63
Table 5.7: Critical buckling loads for tubes with different slenderness ratios...... 64
Table 5.8: Post-local buckling reserve strengths for tubes with different
slenderness ratios. ................................................................................................. 65
Table 5.9: Ultimate stress for different h/D ratios. ............................................... 68
Table 5.10: Critical buckling loads for tubes with different h/D ratios ................ 69
Table 5.11: Post-local buckling reserve strengths for tubes with different h/D
ratios...................................................................................................................... 70
Table 5.12: Results of experimental research conducted by O’Shea and Bridge
(1997). ................................................................................................................... 73

XIII
Nomenclature
B = width of steel plate
D = diameter of steel tube
E = elastic modulus of steel
syf = yield strength for steel
uf = failure stress
yf = yield stress
)2.(oyf = yield proof stress
h = height of steel tube
2'J = Second invariant of the deviatoric stress tensor
k = local buckling coefficient
( )kK = material parameter, function of the hardening parameter
L = length
n = knee factor (25)
ν = Poisson’s ratio of steel
t = thickness of steel tube
w
= lateral deflection at the tube centre
δ = geometrical imperfection
eλ = modified cross-section slenderness limit
ε = uniaxial strain
σ = uniaxial stress
NOMENCLATURE
XIV
/0σ = elastic buckling stress
7.0σ = stress corresponding to E0.7
332211 ,, σσσ = principal stresses
aσ
= maximum edge stress
cσ
= critical elastic buckling stress of tubes with imperfections
pσ
= post-local buckling reserve of strength of a steel tube
uσ
= ultimate stress of steel tube
vmσ
= von Mises stress
1
Chapter 1 INTRODUCTION
1.1 Background
Concrete-filled steel tubular (CFST) columns are used as primary axial load
carrying members in many structural applications including high-rise buildings,
bridges, piles and offshore structures. The structural properties of CFST columns
include high strength, high ductility and high energy absorption capacity. The
load carrying capacity and behaviour in compression, bending and shear are all
superior to reinforced concrete (Zhong & Goode 2001).
Currently, there is no comprehensive design standard that can be used for the
design of thin-walled CFST columns. Extensive research has been conducted on
steel-concrete composite columns in which structural steel is encased in concrete.
However, minimal research has been directed at thin-walled circular CFST
columns (O’Shea & Bridge 2000). Therefore, extensive research is required on
the local and post-local buckling behaviour of thin-walled circular CFST columns
and that is the topic of this dissertation.

Chapter 1 INTRODUCTION
2
Thin-walled CFST columns are those which are designed to take account of the
beneficial effect of the concrete restraint against local buckling of the steel tube.
The concrete core effectively prevents the steel tube from inward local buckling
resulting in a higher buckling mode (Bridge et al. 1995). The local buckling
restraint provided by the concrete core therefore leads to an increase in the local
buckling strength of the steel tube. Furthermore, the local buckling restraint
combined with the confinement of the concrete core by the steel tube leads to an
increase in the ultimate strength of the CFST column.
The reduction of the steel tube thickness in thin-walled CFST columns has the
potential to significantly reduce construction costs. However, thin-wall CFST
columns are susceptible to the local instability problem of thin-walled steel plates
under compression and in-plane bending. The local buckling of steel tubes with
geometric imperfections and residual stresses results in a reduction in the strength
and ductility of members (Liang et al. 2006).
1.2 Application of CFST Columns
The use of CFST columns in contemporary construction is increasing throughout
the world (Uy 2000). Thin-walled CFST columns have been used in many
Australian high-rise buildings including Casselden Place and the Commonwealth
Centre in Melbourne, the Riverside and Myer Centres in Adelaide and Market
Plaza in Sydney (Watson & O’Brien 1990).

Chapter 1 INTRODUCTION
3
CFST columns are constructed using circular hollow steel sections filled with
either normal or high strength concrete. In a CFST column the concrete is fully
encased by the steel tube. A typical cross section is illustrated in Figure 1. The
concrete core has the advantages of high compressive strength and stiffness while
the steel tube has the advantages of high strength and ductility. CFST columns
combine steel and concrete, resulting in a member that has the beneficial qualities
of both materials.
Figure 1.1: Cross section of CFST column.
Thin-walled CFST columns offer an economical solution for members subjected
to primary axial loads due to the current increasing price of steel and the
advantages offered during the construction process. The steel tube provides the
necessary formwork and has the ability to support construction loads prior to
Chapter 1 INTRODUCTION
4
placement of the concrete allowing for rapid construction. Furthermore, the
increased compressive strength of CFST columns allows for smaller cross-
sections resulting in lower material costs and an increase in lettable floor area and
floor space flexibility.
1.3 Project Aims and Objectives
This project aims to investigate the local and post-local buckling behaviour of
thin-walled circular CFST columns using the finite element method. The
objectives of this project in accordance with the specification, as included in
Appendix A, are as follows:
1. Research existing information relating to local and post-local buckling of
concrete-filled thin-walled steel tubular columns.
2. Study the nonlinear finite element analysis method and develop three-
dimensional finite element models for the nonlinear analysis of concrete-
filled thin-walled steel tubular columns.
3. Conduct geometric and material nonlinear finite element analysis on steel
tubes under uniform/non-uniform edge compression to determine critical
load and post-local buckling strengths. Initial geometric imperfections,
residual stresses, material yielding and strain hardening will be considered
in the analysis.

Chapter 1 INTRODUCTION
5
4. Furthermore, investigate the effects of stress gradients and tube width-to-
thickness ratios on the load-deflection curves and the post-local buckling
strengths.
5. Based on the results obtained, propose a set of design formulas for
determining the critical local buckling loads and ultimate strengths of
concrete-filled thin-walled steel tubular columns.
6. Verify the proposed design formulas by comparison with existing
experimental results and those developed by other researchers.
1.4 Structure of Dissertation
The investigation of the local and post-local buckling of steel tubes in thin-walled
circular CFST columns involved reviews of related literature, nonlinear finite
element modelling and analysis of results. This section outlines the structure of
the dissertation.
Chapter 2 discusses the main findings of the literature review that was conducted
on the local and post-local buckling behaviour of CFST columns. It includes both
theoretical and experimental studies. A review and comparison of current design
codes is also included.
Chapter 1 INTRODUCTION
6
Chapter 3 outlines the methodology used to analyse the local and post-local
buckling of steel tubes in circular CFST columns. This includes the method used
to propose the effective strength and ultimate strength formulas.
Chapter 4 provides a technical explanation of the finite element analysis phase,
including the procedure undertaken to create the finite element model and conduct
the analysis. An outline of the loading conditions, material properties, and model
dimensions is also discussed.
Chapter 5 presents and discusses the results obtained throughout the analysis
phase. The effects of geometric imperfections, slenderness rations, and height-to-
diameter ratios on the local and post-local buckling behaviour of steel tubes in
CFST columns were investigated. Effective strength and ultimate strength
formulas were also proposed and verified.
Chapter 6 contains the final conclusion on the project analysis and results. This
chapter also concludes on the aims and objectives of the project and provides
recommendations for further study.
Chapter 1 INTRODUCTION
7
1.5 Summary
This dissertation aims to investigate the local and post-local buckling behaviour of
thin-walled circular CFST columns using the finite element method. Effective
strength and ultimate strength formulas for the design of steel tubes in CFST
columns are also proposed. This investigation is necessary due to the lack of
research directed at thin-walled circular CFST columns in the past and the
increasing use of these members in contemporary construction.

8
Chapter 2 LITERATURE REVIEW
2.1 Introduction
This chapter will discuss published research that has investigated the behaviour of
CFST columns. Extensive research has been conducted on steel-concrete
composite columns in which structural steel is encased in concrete. However,
CFST columns have received relatively little attention in comparison
(Shanmugam & Lakshmi 2001).
Substantial effort has been aimed at developing a better understanding of the
behaviour of CFST columns over the last 40 years (O’Shea and Bridge 2000). In
this chapter, a review of the research conducted on CFST columns is presented
with an emphasis on theoretical and experimental studies. A review and
comparison of current design codes is also included. Furthermore, the review
includes research work that has investigated the effects of various loading
conditions, diameter-to-thickness ratios (D/t), length-to-diameter ratios (L/D),
geometric imperfections and residual stresses on the local and post-local buckling
Chapter 2 LITERERATURE REVIEW
9
characteristics, ultimate strengths, ductility and degree of confinement of CFST
columns.
2.2 Theoretical Studies
2.2.1 Finite Element Analysis Studies
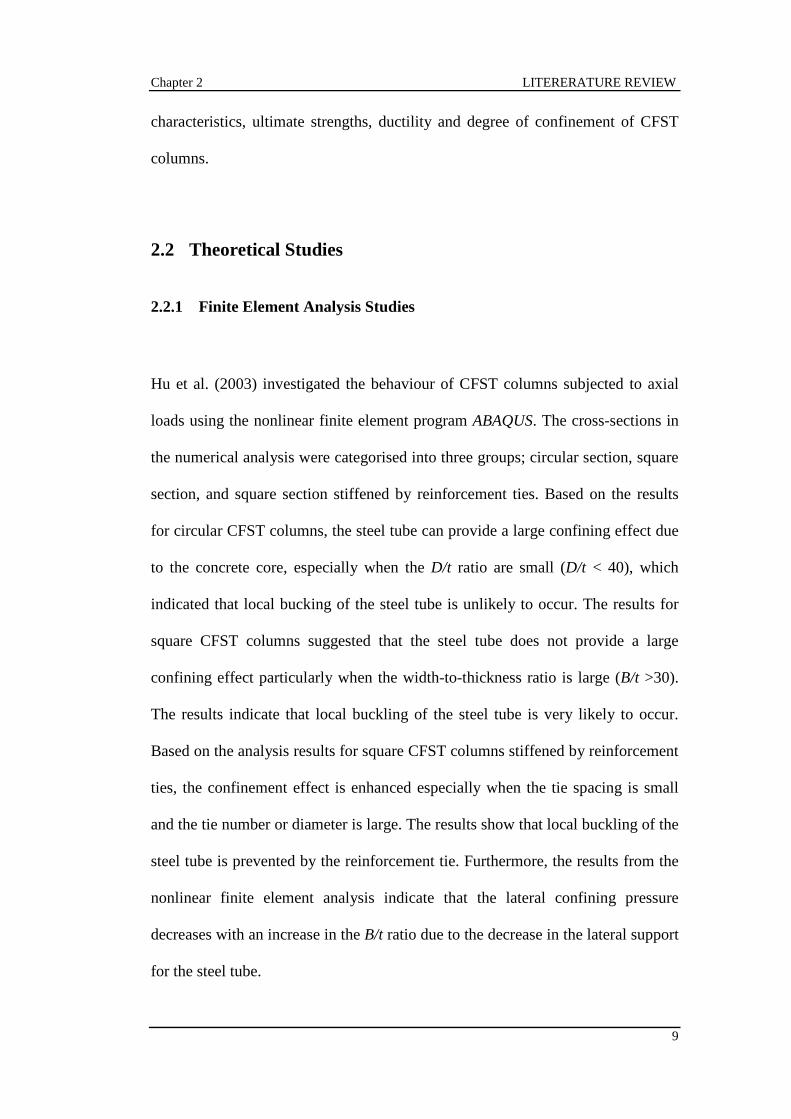
Hu et al. (2003) investigated the behaviour of CFST columns subjected to axial
loads using the nonlinear finite element program ABAQUS. The cross-sections in
the numerical analysis were categorised into three groups; circular section, square
section, and square section stiffened by reinforcement ties. Based on the results
for circular CFST columns, the steel tube can provide a large confining effect due
to the concrete core, especially when the D/t ratio are small (D/t < 40), which
indicated that local bucking of the steel tube is unlikely to occur. The results for
square CFST columns suggested that the steel tube does not provide a large
confining effect particularly when the width-to-thickness ratio is large (B/t >30).
The results indicate that local buckling of the steel tube is very likely to occur.
Based on the analysis results for square CFST columns stiffened by reinforcement
ties, the confinement effect is enhanced especially when the tie spacing is small
and the tie number or diameter is large. The results show that local buckling of the
steel tube is prevented by the reinforcement tie. Furthermore, the results from the
nonlinear finite element analysis indicate that the lateral confining pressure
decreases with an increase in the B/t ratio due to the decrease in the lateral support
for the steel tube.

Chapter 2 LITERERATURE REVIEW
10
Johansson and Gylitoft (41 2002) conducted an experimental and analytical study
on the behaviour of CFST columns subjected to axial loading. The experiments
included loading of the steel tube only, loading of the concrete only, simultaneous
loading of the concrete and steel, and loading of hollow steel tubes. Test
specimens had a L/D ratio of 4 and a D/t ratio of 33. Concrete strengths used in
the test specimens achieved a mean compressive strength of 65 MPa. Nonlinear
finite element models were created using ABAQUS and verified with the
experimental results. The models were used to examine how the behaviour of the
column was influenced by the bond strength between the steel tube and concrete
core, and by the confinement effect offered by the steel tube. It was suggested by
Johansson and Gylitoft (2002) that the following conclusions be drawn for the
results. The load resistance of the short stub columns was determined by yielding
of the steel tube. All of the columns sustained large displacements with almost
completely maintained load resistance. The type of buckling mode at failure was
greatly influenced by the method used to apply the load to the column section.
Whether the load was applied to the entire section or only to the concrete section,
the stability of the column was lost by a combination of local buckling and
crushing. A pattern of inward and outward local buckles developed for hollow
steel tubes, while ring buckles developed outwards only for the CFST column
with the load applied to the steel. The bond strength had no influence on the
behaviour when the steel and concrete sections were loaded simultaneously.
However, it was noted that for columns with the load applied only to the concrete
core, the bond strength highly affected the confinement effects and therefore the
Chapter 2 LITERERATURE REVIEW
11
behaviour and ultimate strength of the CFST column. The degree of confinement
effect is most pronounced for columns with no bond strength between the steel
tube and concrete core when the load is applied to the concrete only. The stiffness
was also influenced by the changed bond strength for this loading condition.
Increased bond strength resulted in a greater contribution from the steel tube,
meaning the stiffness increased. However, changing the bond strength had no
effect for the columns with the load applied to the entire section or only to the
steel section. Johansson and Gylitoft (2002) suggested that even though the
efficiency of the steel tube in confining the concrete core is greater when the load
is applied only to the concrete section, it seems unreliable to trust the natural bond
strength to get full composite action. Therefore, it is recommended by Johansson
and Gylitoft (2002) that the load be applied to the entire section.
Liang and Uy (2000) studied the post-local buckling behaviour of steel plates in
thin-walled CFST welded box columns using the finite element method. The
effects of various geometric imperfections, residual stresses and B/t ratios on the
post-local buckling characteristic were investigated. A new method was
developed for evaluating the initial local buckling loads and post-local buckling
reserve strength of steel plates with imperfections based on the load-transverse
deflection relations associated with the theoretical analysis. The accuracy of the
design models were verified by a classical solution and experimental results. The
results indicated that the theoretical predictions for the ultimate strength of steel
plates and CFST box columns using the proposed design models agree very well
with the experimental data. Therefore, Liang and Uy (2000) propose that the
Chapter 2 LITERERATURE REVIEW
12
effective width formulas be used in the ultimate strength calculation of short thin-
walled CFST box columns subjected to an axial load.
Liang et al. (2006a) performed geometric and material non-linear analysis, using
the finite element analysis method, to investigate the critical local and post-local
buckling strengths of steel plates in thin-walled CFST beam-columns under
compression and in-plane bending. Clamped square plates with various B/t ratios,
geometric imperfections and residual stresses were studied. Material yielding and
strain hardening were also taken into account. The numerical results obtained by
Liang et al. (2006a) indicated that increasing the B/t ratio of a steel plate under a
predefined stress gradient reduces its lateral stiffness, critical local buckling stress
and ultimate strength. The results also showed that the lateral stiffness, critical
local buckling stress and ultimate strength under edge compression decreases with
an increase in the stress gradient coefficient. Based on the results, a set of design
formulas were developed for determining the critical local buckling and ultimate
strength design of steel plates in CFST beam-columns. Additionally, effective
width formulas were developed for the ultimate strength design of clamped steel
plates under non-uniform compression. The proposed design formulas can be used
directly in the design of CFST beam-columns and adopted in the advanced
analysis to account for local buckling effects (Liang et al. 2006a).
Liang et al. (2006b) used the nonlinear fiber element analysis method to
investigate the ultimate strength and behaviour of short thin-walled CFST box
columns with local buckling effects. The confinement effect on the ductility of the
Chapter 2 LITERERATURE REVIEW
13
encased concrete in CFST columns is included in the analysis. Effective width
formulas proposed for steel plates in CFST box columns with geometric
imperfections and residual stresses were incorporated in the fiber element analysis
to account for local buckling. The effects of B/t ratios and compressive concrete
strengths on the ultimate load and ductility of CFST box columns were
investigated. Comparisons with existing experimental results indicated that the
proposed fiber element analysis program predicted well the ultimate strengths and
behaviour of CFST box columns with local buckling effects. Based on the results,
increasing the B/t ratio reduces the ultimate strength, axial stiffness, section
performance and ductility. Furthermore, increasing the compressive concrete
strength increases the ultimate strength and axial stiffness of the CFST box
column but reduces the section performance and ductility (Liang et al. 2006b).
The procedure proposed by Liang et al. (2006b) for simulating the progressive
local and post-local buckling of steel plates can be adopted in the nonlinear fiber
element analysis of CFST columns under axial bending and biaxial bending. The
fiber element program can also be used directly in design for predicting the
ultimate strength and ductility of CFST box columns.
Liang et al. (2004) investigated the local and post-local buckling strength of steel
plates in double skinned composite (DSC) panels under biaxial compression and
in-plane shear by using the finite element method. Critical local buckling
interaction relationships were shown for steel plates with various boundary
conditions that included the shear stiffness effects of stud shear connectors. A
geometric and material nonlinear analysis was used to study the post-local
Chapter 2 LITERERATURE REVIEW
14
buckling interaction strength of steel plates. The strength interaction curves were
generated using the proportional load incremental method in the nonlinear
analysis for square plates with various B/t ratios. The finite element models
developed incorporated initial imperfections of steel plates, material yielding, and
nonlinear shear-slip behaviour of stud connectors. The results obtained by Liang
et al. (2004) indicated that the ultimate strength of stocky plates is governed by
the shear capacity of stud shear connectors or local buckling of steel plates.
Furthermore, based on the results, slender steel plates can attain their full post-
local buckling reserve of strength without the premature fracture of stud shear
connectors. Design models for critical buckling and ultimate strength interactions
were developed for determining the maximum stud spacing and ultimate strength
in DSC panels. The maximum stud spacing predicted ensures that the critical local
buckling of steel plates between stud shear connectors is prevented before the
yielding of steel plates. The proposed design models can be used for the design of
DSC panels with similar design situations.
2.2.2 Analytical Studies
Bradford et al. (2002) investigated the issue of local and post-local buckling of
circular steel tubes with ridged infill, with the emphasis being on the strength of
CFST sections used as composite columns. By using a Rayleigh-Ritz based
method, a closed form solution for the local buckling stress of a thin-walled CFST
column was derived, see Equation (1), and it was demonstrated that the elastic
local buckling stress is 3 times that of its unfilled counterpart. The von Karman
Chapter 2 LITERERATURE REVIEW
15
model of effective widths was interpreted in an effective width framework to
determine the post-local buckling strength of a CFST column. The model showed
that there is no post-local buckling reserve of strength, and that the critical
buckling stress governs the strength of slender cross-sections. The use of this
approach resulted in a prescriptive equation for the cross-section buckling strength
of slender column; see Equations (2), (3) and (4).
)/(
1
1
22/0 tDv
E
−=σ (1)
)/)(/( syye fftD=λ (2)
When 125≤eλ yu ff = (3)
When 125>eλ )]/)(//[(125 syyyu fftDff = (4)
The cross-section modified slenderness limit of 125, proposed by Bradford et al.
(2002), is greater than the value of 100 proposed for hollow circular steel tubes.
On the basis of this model, the cross-section is considered to be fully effective
when 125≤eλ and slender when 125>eλ . It should be noted that the calibration
technique adopted by Bradford et al. (2002) lacked reliable test data.
Lakshmi and Shanmugan (2002) used a semi-analytical method to investigate the
inelastic and ultimate load behaviour of CFST columns subjected to uniaxial or
Chapter 2 LITERERATURE REVIEW
16
biaxial loading in order to determine the ultimate strength of square, rectangular,
and circular cross-sections. Moment-curvature-thrust relationships were generated
for column cross-sections by an iterative process. Non-linear equilibrium
equations resulting from geometric and material nonlinearities were solved by an
incremental-iterative numerical scheme based on the Generalised Displacement
Control method. The approach eliminated the limitation of the conventional
analysis in which a deflected shape or pattern is assumed. However, the effects of
local buckling of steel tube, residual stresses, strain hardening of steel, shear strain
and tensile strength of concrete are neglected. The accuracy of the model was
proven by comparison with existing experimental results. The results indicate that
the moment capacity of columns decreases with an increase in applied axial load.
Furthermore, columns loaded eccentrically displayed a significant decrease in
moment capacity with an increase in eccentricity. Based on the results, the
proposed analytical model could predict accurately the strength of CFST square,
rectangular, and circular columns for a variety of column slenderness ratios.
Therefore, Lakshmi and Shanmugan (2002) proposed that the method be used for
direct analysis of short and slender composite columns subjected to uniaxial or
biaxial bending.
Shanmugam and Lakshmi (2002) investigated the effect of local buckling on the
axial compressive strength of thin-walled CFST box columns. A nonlinear
analysis technique was used to formulate an incremental equilibrium equation
based on the updated Lagrangian notation. The Generalised Displacement Control
method was then applied to solve the equilibrium equation. The analytical method
Chapter 2 LITERERATURE REVIEW
17
was extended in the study to thin-walled CFST columns. The model was
calibrated using available experiment data and it was shown to be fairly accurate
at predicting the behaviour and ultimate loads of thin-walled CFST box columns.
However, the results from the analytical model appear to be conservative when
compared with the experimental results. The results indicated that CFST box
columns have greater strength than hollow steel box columns. Furthermore, the
effect of local-bucking was found to be significant in thin-walled CFST columns.
2.3 Experimental Studies
2.3.1 Circular CFST Columns
O’Shea and Bridge (1997) conducted a comprehensive series of tests to examine
the behaviour of short thin-wall circular steel tubes with or without internal
restraint. The tubes had a D/t ratio ranging from 55-200 and a L/D ratio of 3.5.
The experiments included bare steel loaded both axially and at small
eccentricities, and axially loaded steel tubes with an internal restraint medium.
The material properties were measured, including residual stresses and geometric
imperfections. The test strengths were compared to strength models in design
standards and design recommendations were proposed. The results indicated that
local buckling significantly decreases the strength of circular thin-walled bare
steel tubes and that concrete infill for circular steel tubes has little effect on the
local buckling strength of steel tubes in axial compression. It was therefore
suggested by O’Shea and Bridge (1997) that the strength of steel tubes in CFST

Chapter 2 LITERERATURE REVIEW
18
columns be determined by using the design rules in current steel codes for bare
steel tubes. However, it was noted by O’Shea and Bridge (1997) that concrete
infill can improve the local buckling strength of rectangular and square steel
tubes. The results also suggested that the provisions of current steel codes, which
include the effects of local buckling on the section strength, are conservative for
thin-walled bare steel tubes with small eccentric loads. This was especially
evident when a linear interaction between the axial capacity and moment capacity
was used.
O’Shea and Bridge (2000) performed a series of tests to study the behaviour of
thin-wall circular CFST columns. The loading conditions included axial loading
of the steel tube and simultaneous loading of the concrete and steel tube both
axially and at small eccentricities. The test specimens had a L/D ratio of 3.5 and a
D/t ratio ranging from 60 to 220. The internal concrete had nominal unconfined
cylinder strengths of 50, 80, and 120 MPa. The results indicated that local
buckling significantly affects the strength of unfilled steel tubes. Although the
buckling strength of square steel tubes can be improved by providing internal
lateral restraint, this was not observed in the circular test tubes examined by
O’Shea and Bridge (2000). Instead, the predominantly outward buckling mode
remained unaffected by the concrete core. The bond between the steel tube and
the concrete core was found to be critical in determining the formation of a local
buckle. O’Shea and Bridge (2000) state that local buckling of the steel tube will
not occur for axially loaded thin-walled steel tubes if there is sufficient bond
between the steel tube and concrete core. Furthermore, the degree of confinement
Chapter 2 LITERERATURE REVIEW
19
offered by a thin-walled circular steel tube was dependent on the loading
condition. The largest concrete confinement occurs with only the concrete core
loaded axially and the steel tube used as pure circumferential restraint.
Conservative design methods were developed that estimate the strength of thin-
walled circular CFST columns subjected to different loading conditions. The
design methods were calibrated and validated using previous test results on
circular CFST columns and compared to Eurocode 4 (CEN 1992). The simplified
methods used in Eurocode 4 (CEN 1992) can give very unconservative estimates
if used outside their calibration range. Therefore, it was recommended by O’Shea
and Bridge (2000) that Eurocode 4 (CEN 1992) only be used for the design of
thin-walled steel tubes filled with very high strength concrete.
Giakoumelis and Lam (2004) investigated the behaviour of circular CFST
columns subjected to axially compression with various concrete strengths. The
effects of tube thickness, bond strength between the steel tube and concrete, and
confinement of the concrete were studied. Test specimens had an L/D ratio of 3.5
and D/t ratios ranging from 22.9 to 20.5. The concrete infill had nominal
unconfined cylinder strengths of 30, 60, and 100 MPa. The results show that the
peak load was achieved with small displacement for high strength CFST columns
and with large displacement for normal strength CFST columns. Based on the
results, the effect of the bond between the steel tube and the concrete core
becomes more critical as the concrete strength increases. For normal strength
concrete, the reduction in the axial capacity of the column due to bonding was
negligible. The results were compared with values estimated by Eurocode 4,
Chapter 2 LITERERATURE REVIEW
20
Australian Standards, and American Codes. When the experimental results of
Giakoumelis and Lam (2004) were compared to Eurocode 4, 17% was the largest
variation between the experimental and calculated values for the axial capacity.
The predicted axial strengths using AS4100 and ACI318 were 35% lower than the
experimental results. Giakoumelis and Lam (2004) suggested that Eurocode 4 be
used for the design of CFST columns with both normal and high strength
concrete.
Fam et al. (2004) conducted experimental tests to investigate the behaviour of
circular CFST beam-columns subjected to concentric axial compression loading
and combined axial compression and lateral cyclic loading. The effects of
different bond and end conditions on the strength and ductility of short CFST
beam-columns were studied. Test specimens had a L/D ratio of 3 and a D/t ratio of
49. The concrete infill had an unconfined cylinder strength of 60 MPa. Both
bonded and unbonded specimens were tested, including the application of the
axial load to the CFST section and to the concrete core only. The results indicate
that the bond and end loading conditions of a CFST beam-column do not
significantly affect its flexural strength. However, the axially strengths of the
unbonded columns were slightly greater than those of the bonded specimens due
to the confinement effect. While the stiffness of the unbonded columns was
slightly lower due to the absence of contribution of the steel tube in the axial
direction. The behaviour of CFST columns under combined constant axial
compression and lateral cyclic loads was very ductile. Bonded CFST columns
exhibited better ductile behaviour than unbonded sections. Fam et al. (2004)
Chapter 2 LITERERATURE REVIEW
21
stated that current design standards significantly underestimate the maximum
axial capacity of short CFST columns, including the flexural strength of CFST
beam-columns subjected to axial compression and bending. Furthermore, an
analytical model capable of predicting the flexural and axial load strength of
CFST columns was presented.
2.3.2 Square CFST Columns
Uy (1998) conducted an extensive set of experiments on the local and post-local
buckling of CFST box columns. The B/t ratios ranged from 40 to 100 and the
concrete infill had nominal unconfined cylinder strengths ranging from 32 to 50
MPa. A semi-analytical finite strip method that included the beneficial effect of
concrete was augmented to incorporate the true stress-strain behaviour and
residual compressive and tensile stresses produced by welding. The model was
then calibrated with the experiments conducted. The slenderness limits derived
from the analysis were compared with Australian and British standards to
illustrate the advantages obtained from a rational local buckling analysis. The
effect of geometric imperfections was not included in the analysis, although the
experimental results suggested they influenced the behaviour. A post-local
buckling model based on the effective width principle was then established to
determine the strength of CFST box columns. Uy (1998) suggested use of the
AS4100 method, based on the effective width principle, for determining the post-
local buckling behaviour of a column under pure compression for use in an
ultimate strength analysis. However, Uy (1998) suggested that the results obtained
Chapter 2 LITERERATURE REVIEW
22
provided further confirmation of the conservatism for design using the AS 4100
model.
Uy (2000) performed an extensive set of experiments to examine the effect of
plate slenderness limits on the behaviour of short columns under the combined
actions of axial compression and bending moment. The majority of test specimens
had an L/D ratio of 3 and a D/t ratio between 40 and 100. Concrete strengths used
in the test specimens achieved mean compressive strengths between 32 to 50
MPa. The results suggested that local buckling is significant in thin-walled CFST
columns. Furthermore, the results indicated that the use of mean concrete
compressive strength for maximum compressive concrete strength was found to
be valid when the plate slenderness was compact. Uy (2000) noted that this may
be due to the good quality of concrete caused by the retention moisture. It was
further suggested that since the columns were not subjected to long term loads the
value of the full compressive strength may have been appropriate. However, Uy
(2000) then suggested that since researchers have found both final creep and
shrinkage to be lower in CFST columns, the use of the mean compressive strength
may have been suitable. A numerical model developed elsewhere is augmented
and calibrated with these results. A simple model for the determination of the
strength-interaction diagram was also verified against both the test results and the
numerical model. The model, based on the rigid plastic method of analysis, is
present in international design codes but does not account for the effects of local
buckling. These effects were found to be significant with large plate slenderness
values, particularly for members subjected to large axial load, and should be

Chapter 2 LITERERATURE REVIEW
23
included in the modified rigid plastic analysis. Therefore, some suggested
modifications were proposed to allow for the inclusion of thin-walled columns in
design.
Uy (2001) investigated the local and post-local buckling behaviour of welded box
sections. An extensive set of experiments was conducted on both hollow and
CFST box sections. The B/t ratios ranged from 120 to 180. The tests for the
hollow sections are significantly greater than the yield slenderness limits
designated in international design codes. The nominal concrete strength was 20
MPa. However, the material properties of the concrete were unimportant as the
concrete was merely used a restraint against local buckling and the concrete itself
was not loaded. The residual stresses were measured and were very influential in
the local buckling of the steel sections in the elastic range. Initial imperfections
were not measured in the specimens as it was felt that they would be highly
variable. The local buckling stresses were determined from the load-strain curves
by noting changes in the stiffness. The results illustrated the potential increase in
both the initial local buckling load and ultimate load, which can be derived from
the inclusion of the concrete infill. A numerical model based on the finite strip
method was used to determine the initial local buckling stress incorporating
residual stresses. The model was shown to compare well with the experimental
results. Furthermore, an effective width model developed elsewhere and presented
in existing international design codes was augmented and calibrated with the test
results. This method was found to be useful in determining the axial compressive
strength of welded box sections (Uy 2001).

Chapter 2 LITERERATURE REVIEW
24
Bridge and O’Shea (1995) conducted a preliminary set of experiments to
determine the effects of local buckling on the axial load behaviour of square thin-
walled steel tubes with concrete infill. The steel was not bonded to the concrete
infill which only provided restraint to inward local buckling. The B/t ratios ranged
from 37.4 to 130.7 and the L/B ratio was 3.45. The nominal concrete strength was
20 MPa. The results indicated that the local buckling strength and ultimate
strength of square steel tubes can be improved by providing unbonded concrete
infill, especially for steel tubes with slender plate elements. Furthermore, the axial
stress-strain behaviour of the steel plates restrained by concrete infill was
established for square tubes. Bridge and O’Shea (1995) suggested that by using
the strain compatibility in conjunction with the axial stress-strain behaviour of the
concrete, the axial load behaviour of tubes with concrete bonded to the steel and
loaded compositely could therefore be determined. The experimental strengths
were compared with the design standard AS4100 (1990). The experimental results
suggested that the approach used by AS4100 is conservative for tubes with and
without restraint. Additionally, it is suggested that the enhancement in strength
due to confinement of the concrete core in square CFST columns can be taken
into account by using an appropriate elastic buckling coefficient in AS4100.
Bridge and O’Shea (1998) conducted a comprehensive set of tests to examine the
behaviour of short thin-walled steel tubes subjected to axial load. Two series of
test were preformed. In series 1, the effect of changing the buckling mode by
forcing the formation of outward buckling was examined for a wide range of B/t

Chapter 2 LITERERATURE REVIEW
25
ratios. In series 2, the influence of specimen length on the formation of local
buckling was examined by using thin-walled steel tubes with and without internal
restraint. The B/t ratios ranged from 37.3 to 130.7 and the L/B ratios ranged from
0.77 to 2.91. The nominal concrete strength was 20 MPa. The material properties,
residual stresses and geometric imperfections were measured. The results
indicated that the buckling mode was essentially the same for the range of L/B
ratios and therefore the specimen length had little effect on the formation of local
buckling. Furthermore, the results showed that the local buckling strength and
ultimate strength of square steel tubes can be improved by providing internal
lateral restraint, especially for thin-walled steel tubes. Importantly, Bridge and
O’Shea (1998) stated that a buckling coefficient of 9.99 is appropriate when using
the design provisions in AS 4100 for the design of square thin-walled CFST
columns. The tests strengths were compared with strength models in design
standards and recommendations for improved design were also made.
2.4 Design Codes
Currently there is no comprehensive design standard that can be utilised for the
design of thin-walled CFST columns. Compact limits for most international
design codes limit the slenderness values to less than 40 (Uy 2000). However,
some guidance for the design of CFST columns is provided by the European
Committee for Standardisation, the American Concrete Institute, and the Chinese
Code. The design codes are based on several different theories, which can produce
different results, and the assistance provided in terms of application varies
Chapter 2 LITERERATURE REVIEW
26
significantly. A number of design standards take local buckling into account
through the use of an effective diameter or an effective area method (O’Shea &
Bridge 2000).
2.4.1 European Committee for Standardisation (Eurocode 4)
Eurocode 4 is the most recently completed international standard in composite
construction (Giakoumelis and Lam 2004). The code is based on the rigid plastic
method of analysis which assumes fully crushed concrete and fully yielded steel.
The approach allows the full mean compressive strength of the cylinder to be
utilised. The code uses a column curve, similar to most modern steel design codes,
to determine the influence of slenderness in CFST columns. Local buckling is
ignored by limiting the plate slenderness to within compact plate limits
(Shanmugam & Lakshmi 2002). The enhancement of the concrete due to
confinement is included for some specific cases and it is the only code that
separately treats the effects of long-term loading. Furthermore, Eurocode 4 uses
limit state concepts to achieve the aims of serviceability and safety by applying
partial safety factors to load and material properties. The code is appropriate for
the design of thick-walled steel tubes filled with normal strength concrete (O’Shea
& Bridge 2000).

Chapter 2 LITERERATURE REVIEW
27
2.4.2 American Concrete Institute (ACI 318)
The code ACI318 uses the traditional reinforced concrete approach, with a
minimum load eccentricity used to determine the column strength under nominal
axial load. The American Standard excludes the influence of concrete
confinement by the steel tube and accounts for column slenderness by a minimum
load eccentricity. The limiting thickness of the tube to prevent local buckling is
based on achieving yield stress in a hollow steel tube subjected to monotonic axial
loading, which is not a necessary requirement for a CFST column (Giakoumelis
and Lam 2004). The code ACI 318 is appropriate for the design of thick-walled
steel tubes filled with normal strength concrete. The code ACI318 is different in
concept to the Eurocode 4 (O’Shea & Bridge 2000). However, the Australian
Standard (AS3600) uses a similar approach to the code ACI318.
2.4.3 Chinese Code (DL/T5085-1999)
The code DL/T5085-1999 is based on the unified theory that considers the CFST
member as a composite member, as apposed to the separate components. The
properties of CFST columns depend on the properties of the steel and concrete,
and their dimensions. The composite indices and geometric properties are then
used directly to obtain the ultimate strength. The Chinese code differs from both
the Eurocode 4 and the code ACI318. The code also includes for shear and
torsion, in addition to bending and axial load. Design by the code DL/T5085-1999
Chapter 2 LITERERATURE REVIEW
28
and Eurocode 4 give similar results for a column subjected to a high axial load
and a small moment (Zhong & Goode 2001).
2.5 Summary
Considerable progress over the last 40 years has been made in the investigation of
CFST columns. Fundamental knowledge on composite construction systems, such
as ultimate strength, has already been obtained by the research conducted thus far
(Shanmugam & Lakshmi 2001). However, intensive research is required,
particularly for circular CFST members, on the interaction between the steel tube
and concrete core, the effect of concrete restraining local buckling of steel plate
elements, and the effect of concrete confinement.
While much of the current available research draws similar conclusions on the
behaviour of CFST columns, there are a number of conflicting views being
documented. The evidence of this is additional proof that further research is
required into the behaviour of CFST columns. Currently there is no
comprehensive design standard that can be used for the design of thin-walled
circular CFST columns and further investigation is required before a new design
standard can be introduced.
Methods of analysis, similar to some of those mentioned in this chapter, will be
utilised in this dissertation to investigate the local and post-local buckling of steel
tubes in thin-walled circular CFST columns.
29
Chapter 3 FINITE ELEMENT ANALYSIS
3.1 Introduction
This chapter will outline the technical details and development of the finite
models used in this investigation. Three dimensional finite element models,
created using the finite element code STRAND7 (2002), were used in this
investigation to examine the critical local and post-local buckling of steel tubes in
thin-walled circular CFST columns. A comprehensive set of design models was
created for this investigation based on a standard model.
Geometric and material nonlinear analysis of the steel tubes with initial
imperfections was undertaken. The initial imperfections of steel tubes consisted of
geometrical imperfections and residual stresses. A lateral pressure was applied to
the surface of the tube to induce the initial out-of-plane deflections in the finite
element model. The material stress-strain curve of steel tubes with residual
stresses was modelled by using the Ramberg-Osgood formula.

Chapter 3 FINITE ELEMENT ANALYSIS
30
To treat the material plasticity of steel tubes, the von Mises yield criterion was
adopted and integrated through the thickness of the plate. The mesh used in the
analysis was found to provide an acceptable degree of accuracy based on a
sensitivity analysis. The finite element analysis method was used to determine the
minimum elastic local buckling coefficient of clamped steel tubes in CFST
columns. Furthermore, two possible failure modes for the steel tube were
identified; outward local buckling and yield failure.
3.2 Finite Element Model
3.2.1 Specifications of Standard Model
The finite element code STRAND7 (2002) was used to develop the models
required to examine the critical local and post-local buckling of steel tubes in thin-
walled circular CFST columns.
An eight-node quadratic plate element, based on the Mindlin plate theory, was
employed in all analyses to describe the buckling displacements and stress
distributions of the tubes. The buckling displacements were required to examine
the local buckling behaviour of the steel tubes and the stress distributions were
used to investigate the development of post-local buckling.
An approximate 24x24 mm mesh was used in all analyses and was found to
provide an acceptable degree of accuracy based on a sensitivity analysis. The
Chapter 3 FINITE ELEMENT ANALYSIS
31
material properties of the models included a, Young’s modulus of 200 GPa,
Poisson’s ratio was 0.3 and yield strength of 300 MPa. The three dimensional
nonlinear finite element models had a diameter of 500 mm and the diameter-to-
thickness ratios ranged from 50 to 200. One edge of the circular tube was assumed
to be clamped owing to the inward buckling restraint provided by the concrete
core. The other edge of the circular tube was assumed to be fixed. All nodes
within the tube had 6 degrees of freedom.
3.2.2 Standard Model Procedure
The procedure outlined below was followed in STRAND7 (2002) to create a
standard model.
Create Nodes:
1. Select: Tools / Points and Lines / Ellipse (i.e.1/4 circle)
2. Unclick the Create Beams Box, Steps = 8
3. P2 (Y direction) = 250, P3 (X direction) = 250 (i.e. diameter = 500)
4. Select: Edit / Select / All / Tools / Copy / by Increment
5. Increments (Z) = 25, Repeat = 1
6. Select nodes 1, 3, 5, 7, and 9 / Tools / Copy / by Increment
7. Increments (Z) = 12.5, Repeat = 1
Chapter 3 FINITE ELEMENT ANALYSIS
32
Create Elements:
1. Select: Create / Element
2. Type = Quad 8, create elements by joining nodes
3. Select: Edit / Select / by Group / select plate / Tools / Copy / by Increment
4. Increments (Z) = 25, Repeat = variable (assigns length)
5. Select: Edit / Select / by Group / Tools / Mirror
6. YZ Plane (N2) select node 9, ZY Plane (N3) select node 1
7. Select: Edit / Select / by Group / Tools / Subdivide
8. All Elements (A) = 4, Targets (Plate) = Quad8
Assign Restraints and Loading Conditions:
1. Select all nodes around the bottom of the tube
2. Select: Attributes / Nodes / Restraint / Fix
3. Select all nodes around the top of the tube
4. Select: Attributes / Nodes / Restraint / Z sym
5. Select: Attributes / Plate / Edge Pressure (i.e. compressive load)
6. Value = 300 (i.e. yield strength of steel)
7. Select all edges around the top of the plate
8. Select: Global / Load and Freedom Cases / New Case / Load Case 2
9. Select: Edit / Select / by Group
10. Select: Attributes / Plate / Face Pressure / Normal (i.e. lateral pressure)
11. Value = variable
Chapter 3 FINITE ELEMENT ANALYSIS
33
Assign Material Properties:
1. Select: Property / Plate
2. Modulus = 200,000
3. Poisson’s Ratio = 0.3
4. Select: Geometry / Membrane Thickness = variable
5. Select: Tables / Stress vs Strain / Ramberg-Osgood
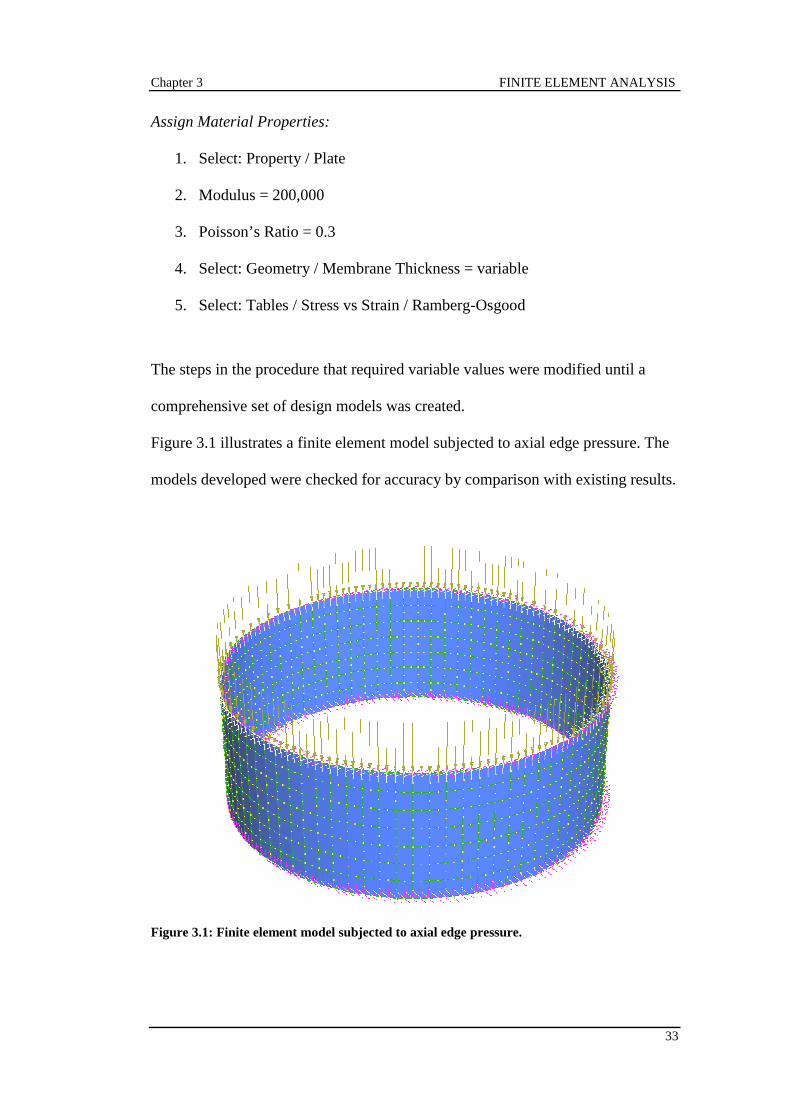
The steps in the procedure that required variable values were modified until a
comprehensive set of design models was created.
Figure 3.1 illustrates a finite element model subjected to axial edge pressure. The
models developed were checked for accuracy by comparison with existing results.
Figure 3.1: Finite element model subjected to axial edge pressure.
Chapter 3 FINITE ELEMENT ANALYSIS
34
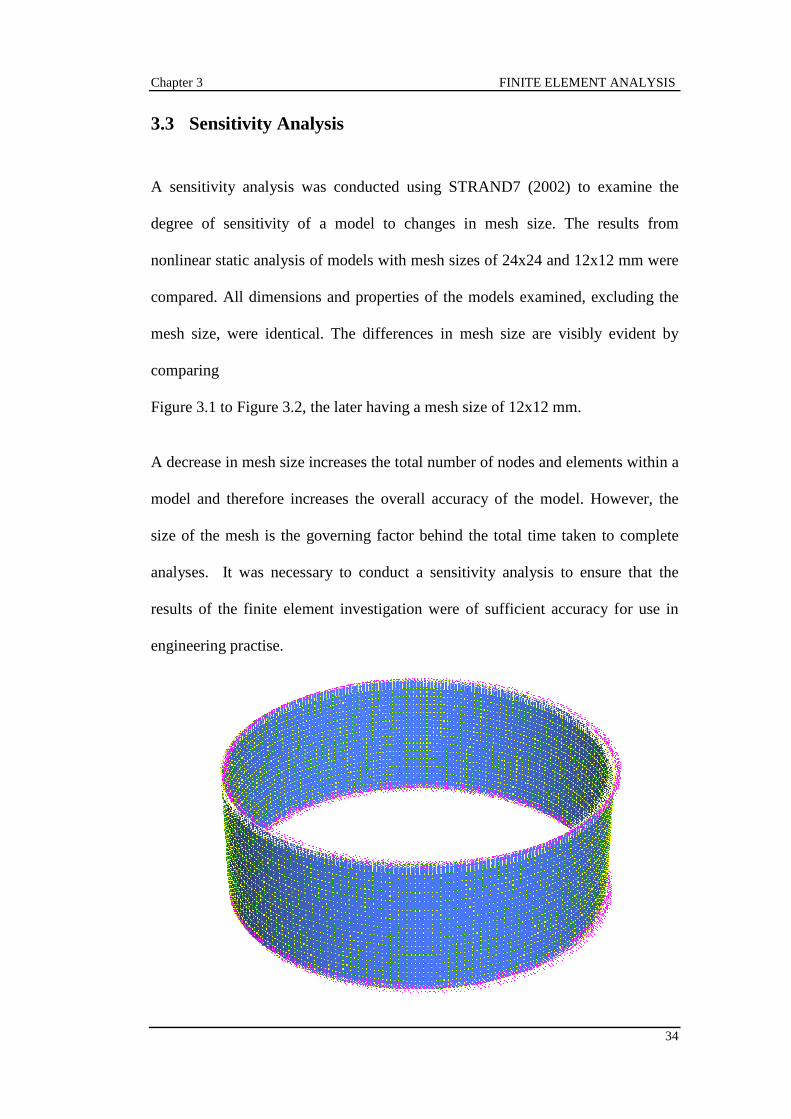
3.3 Sensitivity Analysis
A sensitivity analysis was conducted using STRAND7 (2002) to examine the
degree of sensitivity of a model to changes in mesh size. The results from
nonlinear static analysis of models with mesh sizes of 24x24 and 12x12 mm were
compared. All dimensions and properties of the models examined, excluding the
mesh size, were identical. The differences in mesh size are visibly evident by
comparing
Figure 3.1 to Figure 3.2, the later having a mesh size of 12x12 mm.
A decrease in mesh size increases the total number of nodes and elements within a
model and therefore increases the overall accuracy of the model. However, the
size of the mesh is the governing factor behind the total time taken to complete
analyses. It was necessary to conduct a sensitivity analysis to ensure that the
results of the finite element investigation were of sufficient accuracy for use in
engineering practise.
Chapter 3 FINITE ELEMENT ANALYSIS
35
Figure 3.2: Finite element model with a mesh size of 12x12 mm.
3.4 Minimum Buckling Coefficient
The finite element analysis method, based on the bifurcation buckling theory, was
used to determine the minimum elastic local buckling coefficient (k ) of clamped
steel tubes in CFST columns. The coefficient is dependent on the aspect ratio of
the tube and on the boundary condition at its edge.
By using a Rayleigh-Ritz based method, Bradford et al. (2002) derived a closed
form solution for the elastic buckling stress of circular hollow sections, see
Equation (5). The value of the local buckling coefficient is absent from Equation
(5) because it has already been assigned a value. Application of the formula is
restricted by the slenderness ratio of the column.
( )
−=
d
tE2/0
13
2
νσ (5)
The buckling coefficient, in the present study, was determined by conducting
linear buckling analyses on tubes with various half-wavelengths (h/D). The linear
buckling solver calculated the buckling coefficient and corresponding mode
shapes for the steel tubes under the specified loading conditions. The minimum
coefficients corresponding to mode shapes with a pattern of outward ring
buckling, representative of the restraint offered by the concrete core, were
Chapter 3 FINITE ELEMENT ANALYSIS
36
recorded. When the aspect ratio h/D was equal to unity, the analysis produced a
minimum buckling coefficient for the steel tubes.
The linear buckling analyses is based on the assumptions that there exists a
bifurcation point where the primary and secondary loading paths intersect, and
before this point is reached, all element stresses change proportionally with the
elastic local buckling coefficient (STRAND7 2002).
3.5 Initial Imperfections
The initial imperfections of steel tubes consist of geometric imperfections and
residual stresses, which are usually induced during processes of fabrication,
transport, construction, and welding. Depending on their magnitude, initial
imperfections have the potential to considerably reduce the strength and stiffness
of steel tubes.
3.5.1 Geometric Imperfections
The effect of geometric imperfections on the local and post-local buckling of steel
tubes in CFST columns was investigated using nonlinear finite element analysis.
The STRAND7 (2002) nonlinear static solver uses an algorithm based on a
modified Newton-Raphson method to predict the nonlinear behaviour of
structures. A lateral pressure was applied to the surface of the tube to induce
initial out-of-plane deflections in the finite element model.

Chapter 3 FINITE ELEMENT ANALYSIS
37
Figure 3.3 illustrates a finite element model subjected to lateral face pressure. The
magnitude of the lateral pressure was determined by undertaking nonlinear
analysis of the model under trial loading. The model was subjected to only lateral
pressure, no axial load. The lateral pressure that caused the maximum deflection
at the centre of the tube equal to the specified deflection was recorded. A range of
deflections from 0.05 to 0.25 mm were specified.
Figure 3.3: Finite element model subjected to lateral face pressure.

Chapter 3 FINITE ELEMENT ANALYSIS
38
Previous research on CFST box columns by Liang and Uy (2000) specified the
initial geometric imperfection as a linear function of the plate thickness. However,
initial analysis of the standard model indicated that this method would not be
suitable for use in the present study.
3.5.2 Residual Stresses
It was intended that the effect of residual stresses on the local and post-local
buckling of steel tubes in CFST columns be investigated using the nonlinear finite
element analysis method.
In previous research conducted by Liang and Uy (2000), the residual stresses in
CFST box columns were treated by prestressing. A specified pre-load was
combined with the applied edge stresses in the analysis. The results of the
investigation indicated that residual stresses have a considerable effect on the
stress–strain curve of a welded steel plate.
However, the incorporation of residual stresses into the modelling of circular steel
tubes was deemed an issue too complex to address in the present study. This was
largely due to the lack of existing finite element based research on circular CFST
columns incorporating residual stresses.
Chapter 3 FINITE ELEMENT ANALYSIS
39
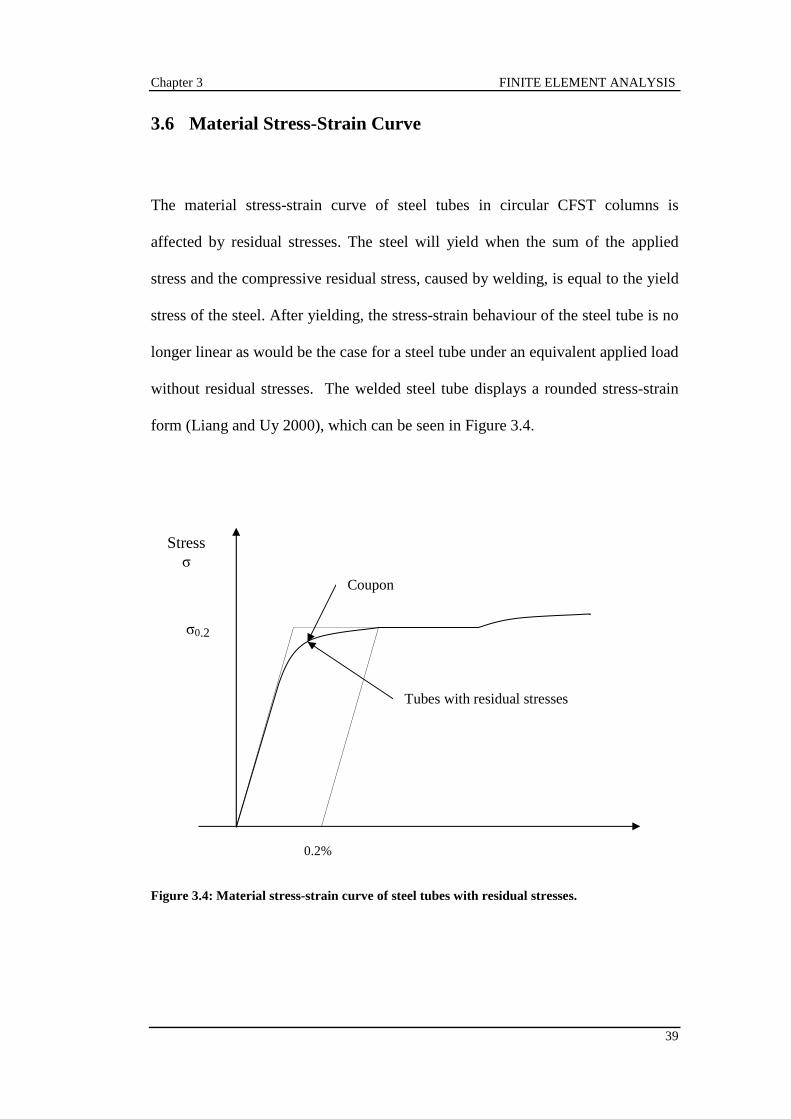
3.6 Material Stress-Strain Curve
The material stress-strain curve of steel tubes in circular CFST columns is
affected by residual stresses. The steel will yield when the sum of the applied
stress and the compressive residual stress, caused by welding, is equal to the yield
stress of the steel. After yielding, the stress-strain behaviour of the steel tube is no
longer linear as would be the case for a steel tube under an equivalent applied load
without residual stresses. The welded steel tube displays a rounded stress-strain
form (Liang and Uy 2000), which can be seen in Figure 3.4.
Figure 3.4: Material stress-strain curve of steel tubes with residual stresses.
Tubes with residual stresses
Coupon
Stress σ
σ0.2
0.2%
Chapter 3 FINITE ELEMENT ANALYSIS
40
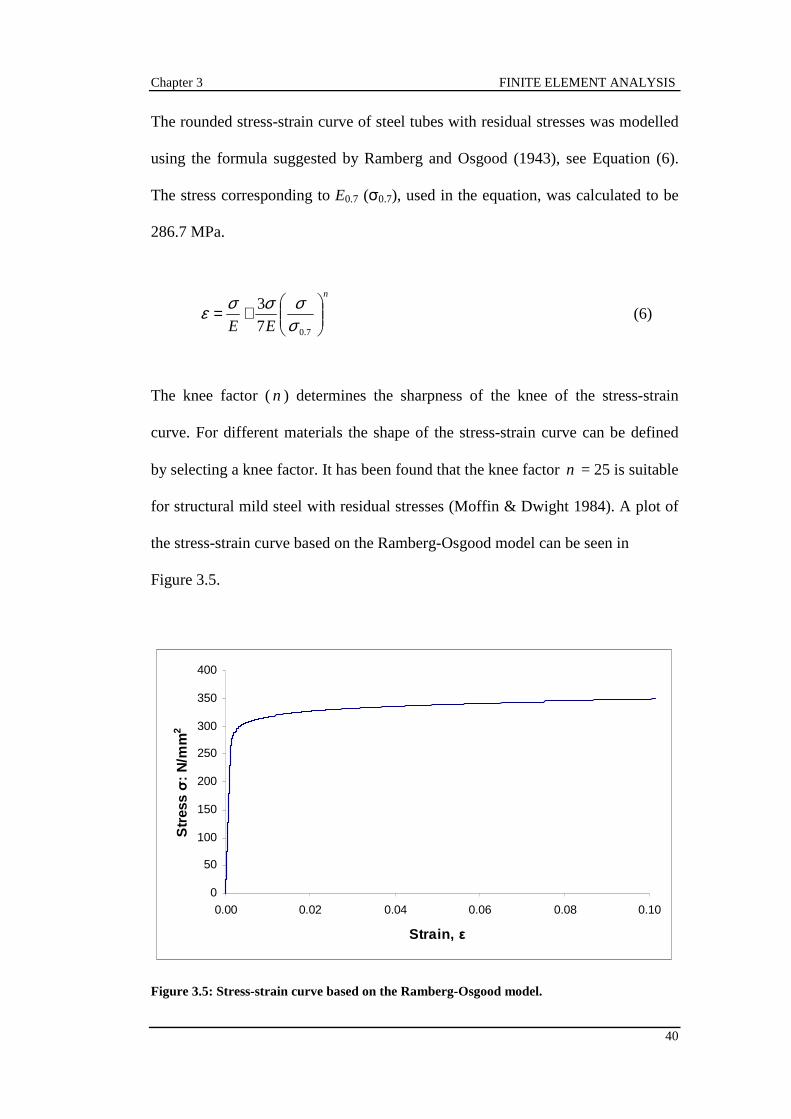
The rounded stress-strain curve of steel tubes with residual stresses was modelled
using the formula suggested by Ramberg and Osgood (1943), see Equation (6).
The stress corresponding to E0.7 (σ0.7), used in the equation, was calculated to be
286.7 MPa.
n
EE
+=
7.07
3
σσσσε (6)
The knee factor (n ) determines the sharpness of the knee of the stress-strain
curve. For different materials the shape of the stress-strain curve can be defined
by selecting a knee factor. It has been found that the knee factor n = 25 is suitable
for structural mild steel with residual stresses (Moffin & Dwight 1984). A plot of
the stress-strain curve based on the Ramberg-Osgood model can be seen in
Figure 3.5.
0
50
100
150
200
250
300
350
400
0.00 0.02 0.04 0.06 0.08 0.10
Strain, ε
Str
ess σ
: N
/mm
2
Figure 3.5: Stress-strain curve based on the Ramberg-Osgood model.
Chapter 3 FINITE ELEMENT ANALYSIS
41
3.7 Von Mises Yield Criterion
To treat the material plasticity of steel tubes, the von Mises yield criterion was
adopted and integrated through the thickness of the plate which was divided into
10 layers. As explained in STRAND7 (2002), the criterion states that yielding will
commence when the second invariant of the deviatoric stress tensor ( )2'J reaches
the material parameter( )kK , see Equation (7). The material parameter ( )kK is a
function of the hardening parameterk .
( ) ( )kKJ =2
1
2' (7)
Based on the yield criteria, the von Mises stress is defined by Equation (8).
( ) ( ) ( )( )21133
23322
222112
1 σσσσσσσ −+−+−=vm (8)
Where 332211 ,, σσσ are principal stresses such that 112233 σσσ ⟨⟨ .
Chapter 3 FINITE ELEMENT ANALYSIS
42
3.8 Summary
The finite element code STRAND7 (2002) was used to develop three dimensional
finite element models for investigating the critical local and post-local buckling of
steel tubes in thin-walled circular CFST columns. The models developed were
checked for accuracy by comparison with existing results.
Geometric and material nonlinear analysis of the steel tubes with initial
imperfections was undertaken and the material stress-strain curve of steel tubes
with residual stresses was modelled by using the Ramberg-Osgood formula. The
von Mises yield criterion was adopted to treat the material plasticity of steel tubes.
A sensitivity analysis was also conducted to ensure the accuracy of the finite
element results. Furthermore, the finite element analysis method was used to
determine the minimum elastic local buckling coefficient (k ).
43
Chapter 4 DESIGN METHODOLOGY
4.1 Introduction
This chapter will discuss the methodology used to investigate the behaviour of
CFST columns. A study of the nonlinear finite element analysis method was
conducted in order to develop three dimensional finite element models for the
geometric and material nonlinear analysis of steel tubes. The finite element
analysis method was used to study the critical local buckling loads and post-local
buckling reserve strengths of steel tubes in CFST columns.
Based on the results obtained, effective strength and ultimate strength formulas
for the design of steel tubes in thin-walled circular CFST columns were developed
using analytical methods. Furthermore, existing literature relating to the buckling
behaviour steel tubes in circular CFST columns was researched with the aim of
verifying the proposed formulas.

Chapter 4 DESIGN METHODOLOGY
44
4.2 Finite Element Analysis
4.2.1 Critical Local Buckling Strength
The local buckling of steel tubes in CFST columns, subjected to axial
compression, occurs when the applied load reaches the critical buckling load. It is
important to understand the behaviour of local buckling in CFST columns because
buckling of the steel tube can cause a reduction in the ultimate strength and
stiffness of the member.
The finite element analysis method was used to study the critical local buckling
strengths of steel tubes in thin-walled circular CFST columns subjected to
uniform edge compression. The analysis was aimed at determining the influence
of slenderness ratios and initial geometric imperfections on the local and post-
local buckling strength of steel tubes in circular CFST columns.
No bifurcation point can be observed on the load-transverse deflection curves of
steel tubes due to the presence of initial imperfections. This leads to difficulty in
determining the initial local buckling loads of tubes with imperfections (Liang and
Uy 2000). The method used for evaluating the critical local buckling loads of
tubes with geometric imperfections was developed by Liang and Uy (2000) and is
based on the load-transverse deflection relations associated with the theoretical
analysis. The inflection point represents the maximum rate of the increment of
transverse deflection with the load. The inflection point can be found by plotting
the non-dimensional central transverse deflection verses the ratio of the deflection

Chapter 4 DESIGN METHODOLOGY
45
to the applied load w/σa. The minimum value of w/σa determined from the plot
represents the inflection point where the local buckling occurs at the
corresponding loading level (Liang and Uy 2000).
The transverse deflection verses w/σa curves were determined from the results of
the finite element analysis. A contour plot of the displacement (DX axis) for a
standard model with a displacement scale of 10% is shown in Figure 4.1. The
results show a pattern of outward ring buckling commonly associated with steel
tubes in CFST columns.
Figure 4.1: Contour plot of displacement (DX axis).
It was noted by Liang and Uy (2000) that for tubes with a low slenderness value,
the inflection point might indicate yielding or plastic buckling because the sudden
changes of the configuration of plastic deformations with loads that are only
related to the yielding and plastic local buckling.

Chapter 4 DESIGN METHODOLOGY
46
Theoretical studies indicate that the elastic local buckling stress for steel tubes in
CFST columns is 3 times that of hollow steel tubes (Bridge et al. 1995).
However, the available experimental data on the local buckling behaviour of steel
tubes in CFST columns is inconclusive.
4.2.2 Post-Local Buckling Reserve Strength
After initial local bucking, thin-walled steel sections are still capable of carrying
increased loads without failure. This behaviour of thin-walled steel sections is
referred to as post-local buckling.
The development of the post-local buckling of steel plates is associated with the
stress redistribution within the buckled plate under axial compression. The stress
is redistributed towards the stiffer edges of the plates or plate assemblies and
away from the more flexible regions of the plate (Bridge et al. 1995). However,
this physical concept is more difficult to rationalise for axis-symmetrical circular
tubes.
The stress distributions across the buckled section of tubes with geometric
imperfections were obtained from the finite element analysis. A contour plot of
the stress distribution (YY axis) for a standard model with a displacement scale of
10% is shown in Figure 4.2. The results suggest a stress redistributed towards the
stiffer clamped edges of the tube.

Chapter 4 DESIGN METHODOLOGY
47
Figure 4.2: Contour plot of stress distribution (YY axis).
The finite element analysis method was used to study the post-local buckling
reserve strengths of steel tubes in CFST columns. The post-local buckling reserve
strength equates to the difference in the ultimate strength and the critical local
buckling strength, see Equation (9).
cup σσσ −= (9)
Available experiment research suggests that there is no post-local buckling
reserve of strength in circular CFST columns, and therefore the critical buckling
stress governs the strength of slender cross-sections. This suggestion was
examined in the present study for circular steel tubes with geometric
imperfections using the finite element analysis method.
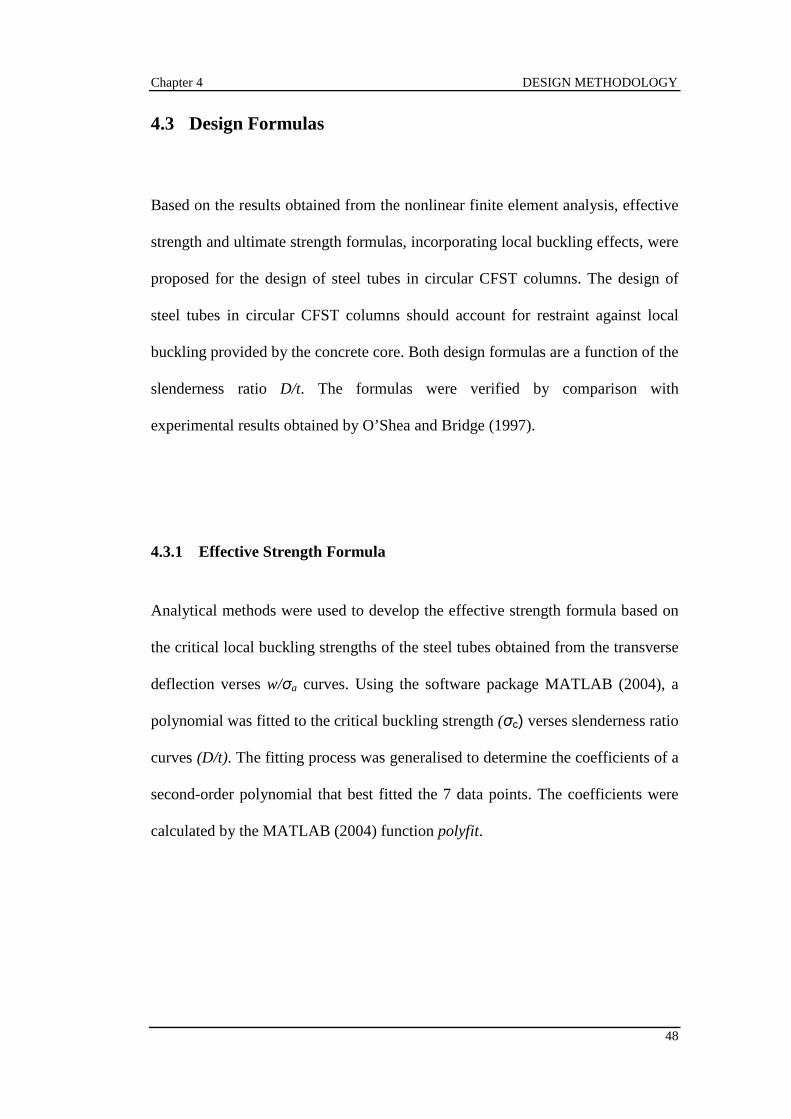
Chapter 4 DESIGN METHODOLOGY
48
4.3 Design Formulas
Based on the results obtained from the nonlinear finite element analysis, effective
strength and ultimate strength formulas, incorporating local buckling effects, were
proposed for the design of steel tubes in circular CFST columns. The design of
steel tubes in circular CFST columns should account for restraint against local
buckling provided by the concrete core. Both design formulas are a function of the
slenderness ratio D/t. The formulas were verified by comparison with
experimental results obtained by O’Shea and Bridge (1997).
4.3.1 Effective Strength Formula
Analytical methods were used to develop the effective strength formula based on
the critical local buckling strengths of the steel tubes obtained from the transverse
deflection verses w/σa curves. Using the software package MATLAB (2004), a
polynomial was fitted to the critical buckling strength (σc) verses slenderness ratio
curves (D/t). The fitting process was generalised to determine the coefficients of a
second-order polynomial that best fitted the 7 data points. The coefficients were
calculated by the MATLAB (2004) function polyfit.
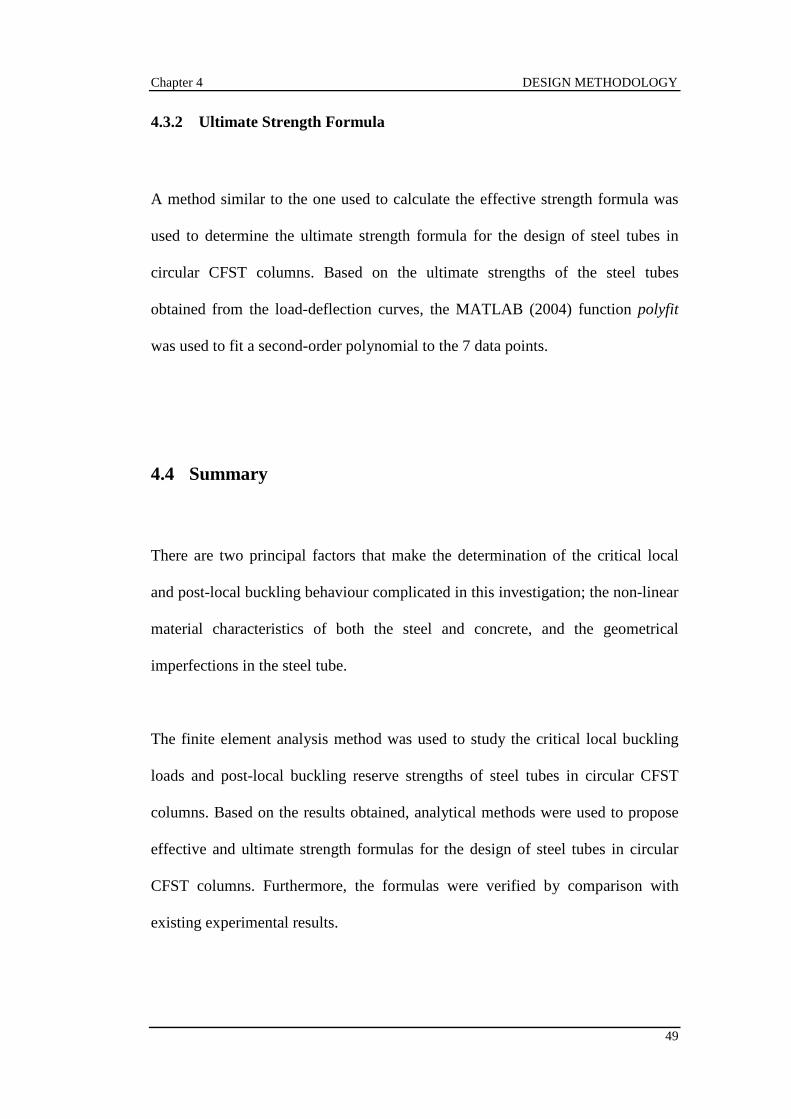
Chapter 4 DESIGN METHODOLOGY
49
4.3.2 Ultimate Strength Formula
A method similar to the one used to calculate the effective strength formula was
used to determine the ultimate strength formula for the design of steel tubes in
circular CFST columns. Based on the ultimate strengths of the steel tubes
obtained from the load-deflection curves, the MATLAB (2004) function polyfit
was used to fit a second-order polynomial to the 7 data points.
4.4 Summary
There are two principal factors that make the determination of the critical local
and post-local buckling behaviour complicated in this investigation; the non-linear
material characteristics of both the steel and concrete, and the geometrical
imperfections in the steel tube.
The finite element analysis method was used to study the critical local buckling
loads and post-local buckling reserve strengths of steel tubes in circular CFST
columns. Based on the results obtained, analytical methods were used to propose
effective and ultimate strength formulas for the design of steel tubes in circular
CFST columns. Furthermore, the formulas were verified by comparison with
existing experimental results.
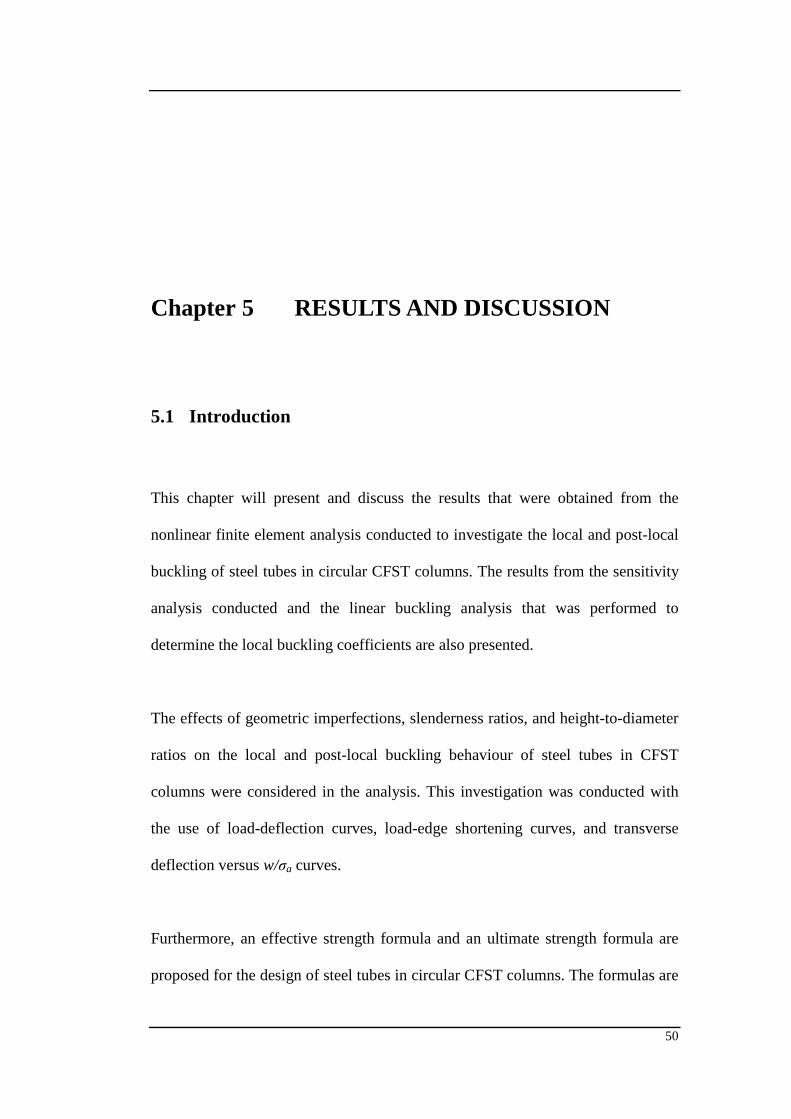
50
Chapter 5 RESULTS AND DISCUSSION
5.1 Introduction
This chapter will present and discuss the results that were obtained from the
nonlinear finite element analysis conducted to investigate the local and post-local
buckling of steel tubes in circular CFST columns. The results from the sensitivity
analysis conducted and the linear buckling analysis that was performed to
determine the local buckling coefficients are also presented.
The effects of geometric imperfections, slenderness ratios, and height-to-diameter
ratios on the local and post-local buckling behaviour of steel tubes in CFST
columns were considered in the analysis. This investigation was conducted with
the use of load-deflection curves, load-edge shortening curves, and transverse
deflection versus w/σa curves.
Furthermore, an effective strength formula and an ultimate strength formula are
proposed for the design of steel tubes in circular CFST columns. The formulas are
Chapter 5 RESULTS AND DISCUSSION
51
compared with the results of the finite element analysis and existing experimental
data. Throughout the analysis process every attempt was made to ensure the
accuracy of the results by comparison with existing studies.
5.2 Initial Analysis
5.2.1 Sensitivity Analysis
A sensitivity analysis was conducted to examine the degree of sensitivity of a
model to changes in mesh size. The results from nonlinear static analysis of
models with mesh sizes of 24x24 and 12x12 mm were compared. The steel tubes
had a h/D ratio of 0.35 and the D/t ratios were 50 and 200. An axial pressure of
300 MPa and a geometric imperfection of 0.15 mm were applied to all models.
All dimensions, properties, and loading conditions of the models, excluding the
mesh size, were identical. Figure 5.1 presents a comparison of the load-deflection
curves attained from the analysis results.

Chapter 5 RESULTS AND DISCUSSION
52
0.0
0.1
0.2
0.3
0.4
0.5
0.6
0.7
0.8
0.9
0 0.2 0.4 0.6 0.8 1 1.2 1.4
Lateral deflection at tube centre w
Lo
ad σ
a/f y
D/t = 50 (12x12 mesh)
D/t = 50 (24x24 mesh)
D/t = 200 (12x12 mesh)
D/t = 200 (24x24 mesh)
Figure 5.1: Load-deflection curves for sensitivity analysis.
The results in Figure 5.1 indicate that there is very minimal difference between
the load-deflection behaviour of models with different mesh sizes. A comparison
of the ultimate strengths of the steel tubes with different mesh sizes is presented in
Table 5.1.
Table 5.1: Ultimate stress for sensitivity analysis.
D/t Ratio 12x12 σu (MPa) 24x24 σu (MPa) σu/σu (%)
50 219.90 217.90 0.91
200 241.83 240.00 0.76
Table 5.1 shows that the ultimate stress of a steel tube is only slightly affected by
the size of its mesh. The results in Table 5.1 indicate that a steel tube with a D/t
ratio of 200 and a mesh size of 24x24 mm has an ultimate stress of 240 MPa.
When the mesh size is decreased, the ultimate stress is only 0.76% higher.
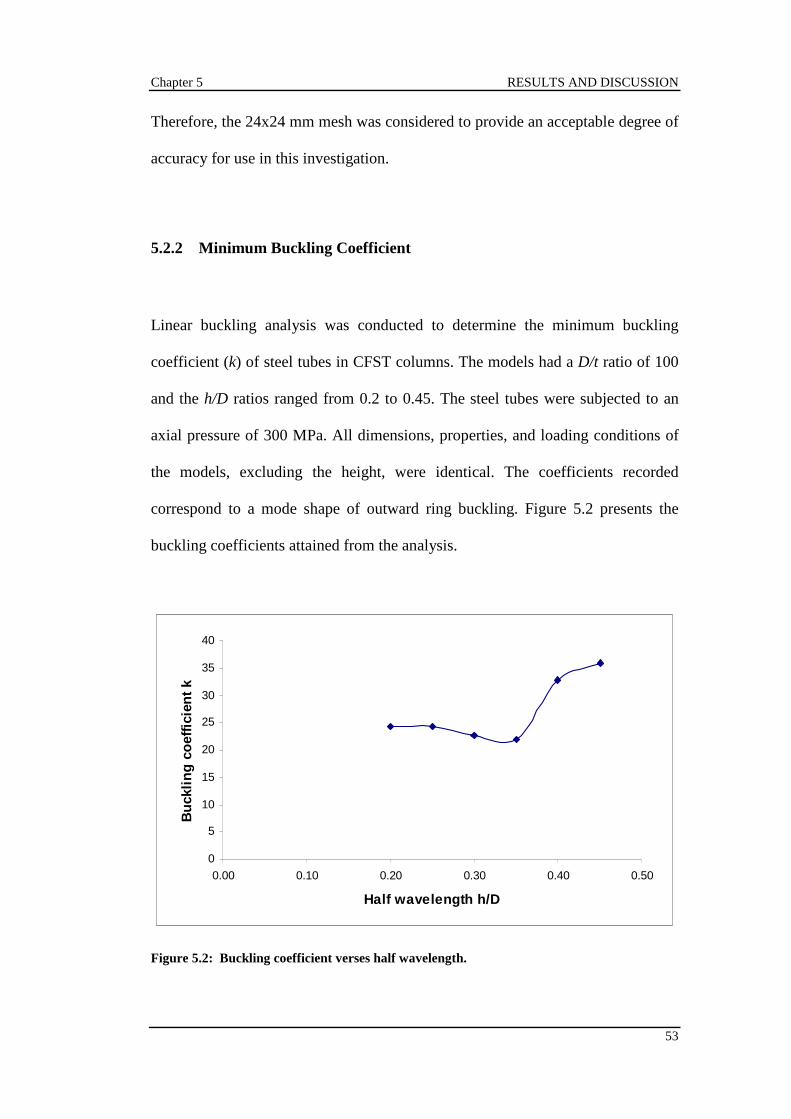
Chapter 5 RESULTS AND DISCUSSION
53
Therefore, the 24x24 mm mesh was considered to provide an acceptable degree of
accuracy for use in this investigation.
5.2.2 Minimum Buckling Coefficient
Linear buckling analysis was conducted to determine the minimum buckling
coefficient (k) of steel tubes in CFST columns. The models had a D/t ratio of 100
and the h/D ratios ranged from 0.2 to 0.45. The steel tubes were subjected to an
axial pressure of 300 MPa. All dimensions, properties, and loading conditions of
the models, excluding the height, were identical. The coefficients recorded
correspond to a mode shape of outward ring buckling. Figure 5.2 presents the
buckling coefficients attained from the analysis.
0
5
10
15
20
25
30
35
40
0.00 0.10 0.20 0.30 0.40 0.50
Half wavelength h/D
Bu
ckli
ng
co
effi
cien
t k
Figure 5.2: Buckling coefficient verses half wavelength.

Chapter 5 RESULTS AND DISCUSSION
54
Figure 5.2 indicates the analysis produced a minimum buckling coefficient of
21.85 for steel tubes in circular CFST columns when the aspect ratio h/D was
equal to unity. Whereas, a study by Liang and Uy (1998) produced a minimum
buckling coefficient of 9.81 for steel plates in CFST box columns. The minimum
coefficient corresponded to a h/D ratio of 0.35. Based on the result obtained, the
standard models used in further analysis have a diameter of 500 mm and a height
of 175 mm.
5.3 Effects of Geometric Imperfections
The effect of geometric imperfections (δ) on the local and post-local buckling
behaviour of steel tubes in CFST columns was investigated with the use of
nonlinear static analysis. The results from the analysis were used to determine
load-deflection curves and transverse deflection versus w/σa curves. The ultimate
stresses and critical local buckling loads obtained from these curves were used to
determine the post-local buckling reserve strengths for steel tubes in CFST
columns. An axial pressure of 300 MPa and geometric imperfections ranging from
0.05 to 0.25mm were applied to the steel tubes. The models had a h/D ratio of
0.35 and a D/t ratio of 175. All dimensions, properties, and loading conditions of
the models, excluding the geometric imperfection, were identical

Chapter 5 RESULTS AND DISCUSSION
55
5.3.1 Load-Deflection Curves
The load-deflection curves attained from the results of the nonlinear static
analysis were used to investigate the effects of geometric imperfections on the
local buckling behaviour of steel tubes in CFST columns. A comparison of the
load-deflection curves for steel tubes with various geometric imperfections is
presented in Figure 5.3.
0.0
0.1
0.2
0.3
0.4
0.5
0.6
0.7
0.8
0.9
1.0
0 0.2 0.4 0.6 0.8 1 1.2 1.4
Lateral deflection at tube centre (w )
Lo
ad σ
a/f y
δ = 0.05
δ = 0.10
δ = 0.15
δ = 0.20
δ = 0.25
Figure 5.3: Load-deflection curves for tubes with different geometric imperfections.
It can be seen from Figure 5.3 that the tubes considered in the analysis could not
attain their yield strength because of the geometrical imperfections applied. Figure
5.3 also shows that for steel tubes with larger geometric imperfections the critical
local buckling strength is lower than that of steel tubes with smaller geometric
imperfections. For a geometric imperfection of 0.05, Figure 5.3 shows that for a
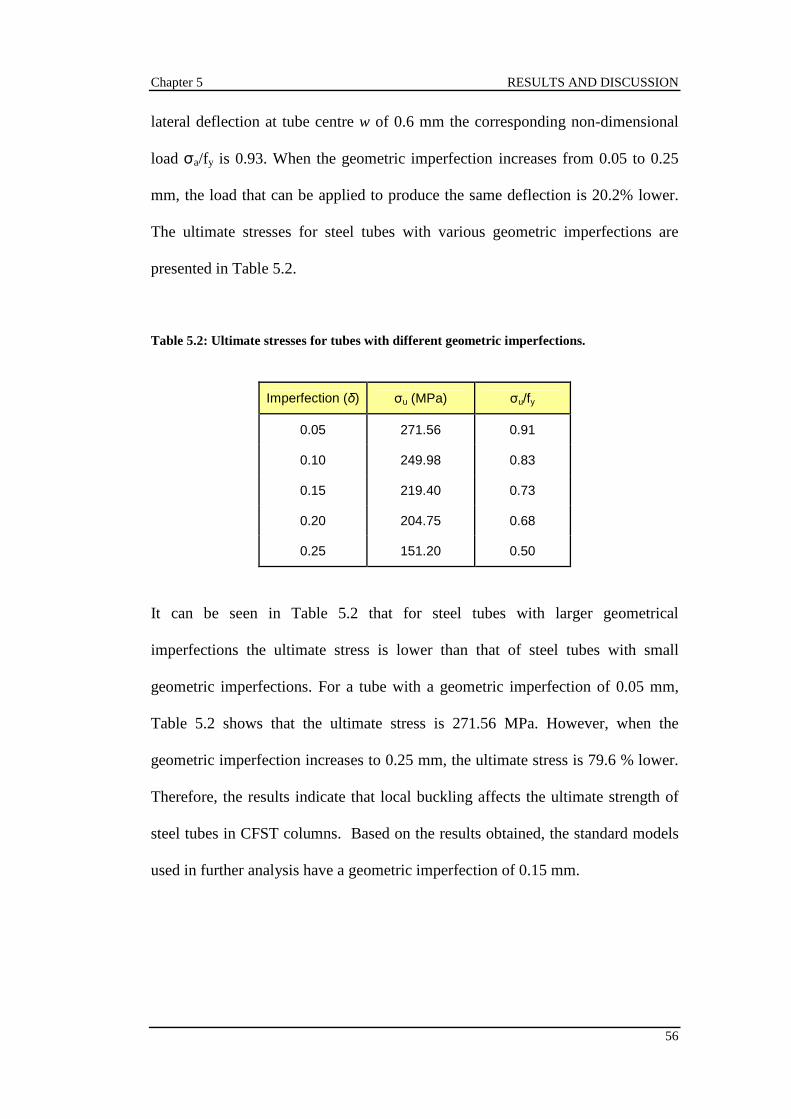
Chapter 5 RESULTS AND DISCUSSION
56
lateral deflection at tube centre w of 0.6 mm the corresponding non-dimensional
load σa/fy is 0.93. When the geometric imperfection increases from 0.05 to 0.25
mm, the load that can be applied to produce the same deflection is 20.2% lower.
The ultimate stresses for steel tubes with various geometric imperfections are
presented in Table 5.2.
Table 5.2: Ultimate stresses for tubes with different geometric imperfections.
Imperfection (δ) σu (MPa) σu/fy
0.05 271.56 0.91
0.10 249.98 0.83
0.15 219.40 0.73
0.20 204.75 0.68
0.25 151.20 0.50
It can be seen in Table 5.2 that for steel tubes with larger geometrical
imperfections the ultimate stress is lower than that of steel tubes with small
geometric imperfections. For a tube with a geometric imperfection of 0.05 mm,
Table 5.2 shows that the ultimate stress is 271.56 MPa. However, when the
geometric imperfection increases to 0.25 mm, the ultimate stress is 79.6 % lower.
Therefore, the results indicate that local buckling affects the ultimate strength of
steel tubes in CFST columns. Based on the results obtained, the standard models
used in further analysis have a geometric imperfection of 0.15 mm.

Chapter 5 RESULTS AND DISCUSSION
57
5.3.2 Critical Buckling Coefficient
The transverse deflection verses w/σa curves attained from the load-deflection
curves were used to determine the effects of geometric imperfections on the
critical local buckling loads of steel tubes in CFST columns. A comparison of the
transverse deflection verses w/σa curves for steel tubes with various geometric
imperfections is presented in Figure 5.4.
0.000
0.005
0.010
0.015
0.020
0.025
0.030
0 0.05 0.1 0.15 0.2 0.25 0.3 0.35
Central transverse deflection w/t
w/σ
a
δ = 0.05
δ = 0.10
δ = 0.15
δ = 0.20
δ = 0.25
Figure 5.4: Transverse deflection verses w/σa curves for tubes with different geometric
imperfections.
The results in Figure 5.4 indicate that for steel tubes with larger geometric
imperfections the critical buckling loads are lower than that of steel tubes with
higher geometric imperfections. Table 5.3 summarises the critical buckling loads
of steel tubes with a range of geometric imperfections.
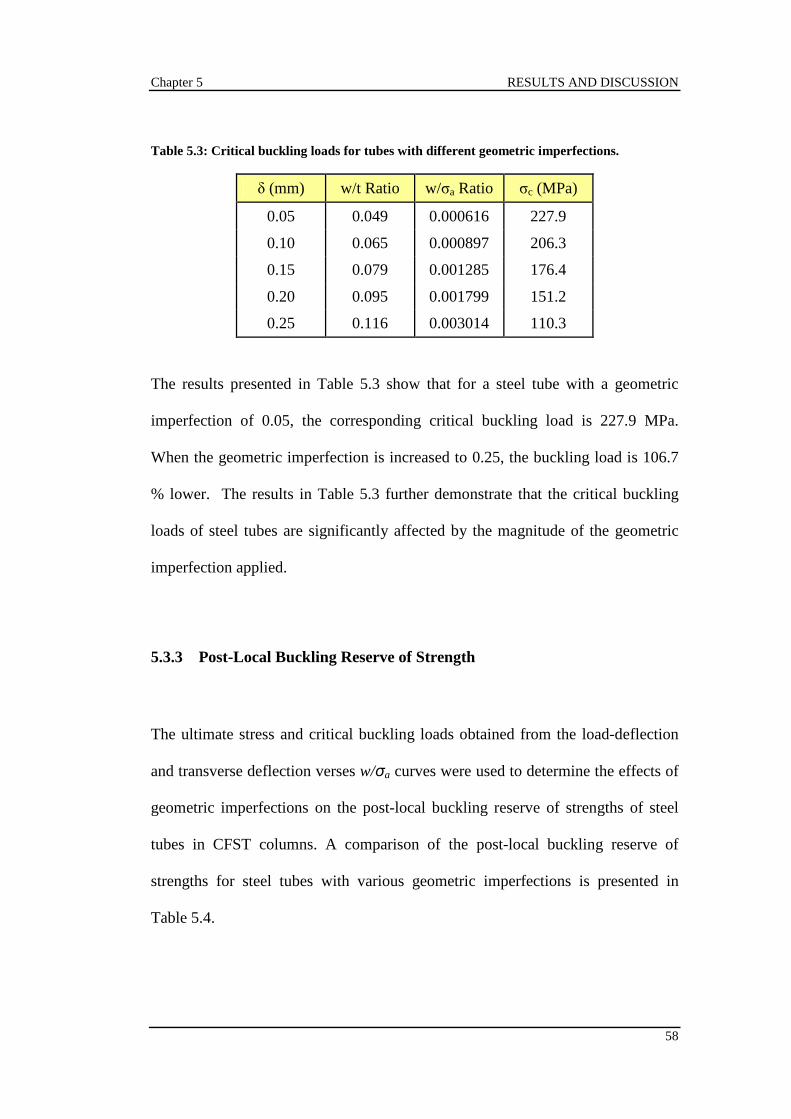
Chapter 5 RESULTS AND DISCUSSION
58
Table 5.3: Critical buckling loads for tubes with different geometric imperfections.
δ (mm) w/t Ratio w/σa Ratio σc (MPa)
0.05 0.049 0.000616 227.9
0.10 0.065 0.000897 206.3
0.15 0.079 0.001285 176.4
0.20 0.095 0.001799 151.2
0.25 0.116 0.003014 110.3
The results presented in Table 5.3 show that for a steel tube with a geometric
imperfection of 0.05, the corresponding critical buckling load is 227.9 MPa.
When the geometric imperfection is increased to 0.25, the buckling load is 106.7
% lower. The results in Table 5.3 further demonstrate that the critical buckling
loads of steel tubes are significantly affected by the magnitude of the geometric
imperfection applied.
5.3.3 Post-Local Buckling Reserve of Strength
The ultimate stress and critical buckling loads obtained from the load-deflection
and transverse deflection verses w/σa curves were used to determine the effects of
geometric imperfections on the post-local buckling reserve of strengths of steel
tubes in CFST columns. A comparison of the post-local buckling reserve of
strengths for steel tubes with various geometric imperfections is presented in
Table 5.4.
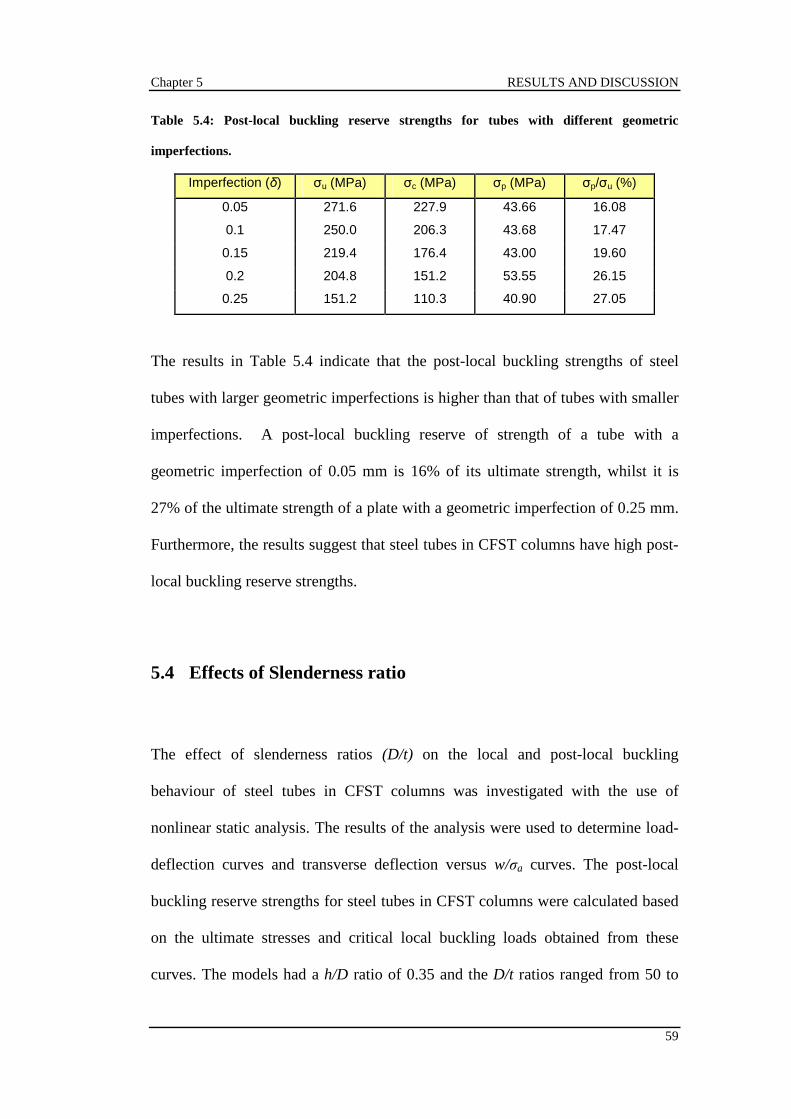
Chapter 5 RESULTS AND DISCUSSION
59
Table 5.4: Post-local buckling reserve strengths for tubes with different geometric
imperfections.
Imperfection (δ) σu (MPa) σc (MPa) σp (MPa) σp/σu (%)
0.05 271.6 227.9 43.66 16.08
0.1 250.0 206.3 43.68 17.47
0.15 219.4 176.4 43.00 19.60
0.2 204.8 151.2 53.55 26.15
0.25 151.2 110.3 40.90 27.05
The results in Table 5.4 indicate that the post-local buckling strengths of steel
tubes with larger geometric imperfections is higher than that of tubes with smaller
imperfections. A post-local buckling reserve of strength of a tube with a
geometric imperfection of 0.05 mm is 16% of its ultimate strength, whilst it is
27% of the ultimate strength of a plate with a geometric imperfection of 0.25 mm.
Furthermore, the results suggest that steel tubes in CFST columns have high post-
local buckling reserve strengths.
5.4 Effects of Slenderness ratio
The effect of slenderness ratios (D/t) on the local and post-local buckling
behaviour of steel tubes in CFST columns was investigated with the use of
nonlinear static analysis. The results of the analysis were used to determine load-
deflection curves and transverse deflection versus w/σa curves. The post-local
buckling reserve strengths for steel tubes in CFST columns were calculated based
on the ultimate stresses and critical local buckling loads obtained from these
curves. The models had a h/D ratio of 0.35 and the D/t ratios ranged from 50 to

Chapter 5 RESULTS AND DISCUSSION
60
200. An axial pressure of 300 MPa and a geometric imperfection of 0.15 mm were
applied to the steel tubes. All dimensions, properties, and loading conditions of
the models, excluding the D/t ratio, were identical.
5.4.1 Load-Deflection Curves
To investigate the effects of slenderness ratios on the local buckling behaviour of
steel tubes in CFST columns, load-deflection curves were calculated from the
results of the nonlinear static analysis. A comparison of the load-deflection curves
for steel tubes with different slenderness ratios is presented in Figure 5.5.
0.0
0.1
0.2
0.3
0.4
0.5
0.6
0.7
0.8
0.9
0 0.2 0.4 0.6 0.8 1 1.2 1.4 1.6
Lateral deflection at tube centre (w)
Load
σa/f
y
D/t = 50
D/t = 75
D/t = 100
D/t = 125
D/t = 150
D/t = 175
D/t = 200
Figure 5.5: Load-deflection curves for tubes with different slenderness ratios.

Chapter 5 RESULTS AND DISCUSSION
61
Figure 5.5 shows that the tubes considered in the analysis could not attain their
yield strength because of the geometrical imperfections applied. Figure 5.5 also
shows that for steel tubes with larger slenderness ratios the critical local buckling
strength is slightly lower than that of steel tubes with smaller slenderness ratios.
For a slenderness ratio of 50, Figure 5.5 shows that for a lateral deflection at tube
centre w of 0.6 mm the corresponding non-dimensional load σa/fy is 0.77. When
the slenderness ratio increases from 50 to 200 mm, the load that can be applied to
produce the same deflection is 6.6% lower. The ultimate stress for steel tubes with
various slenderness ratios is presented in Table 5.5.
Table 5.5: Ultimate stresses for tubes with different slenderness ratios.
D/t Ratio σu (MPa) σu/fy
50 241.83 0.81
75 235.46 0.78
100 229.13 0.76
125 224.71 0.75
150 221.40 0.74
175 219.40 0.73
200 219.90 0.73
Table 5.5 indicates that the ultimate stress for smaller D/t ratios is higher than that
of larger D/t ratios. The ultimate strength of a steel tube with a D/t ratio of 200 is
73.3% of its yield strength, whilst it is 81% of the ultimate strength for a steel tube
with a D/t ratio of 50. Therefore, the results indicate that local buckling affects the
ultimate strength of steel tubes in CFST columns.
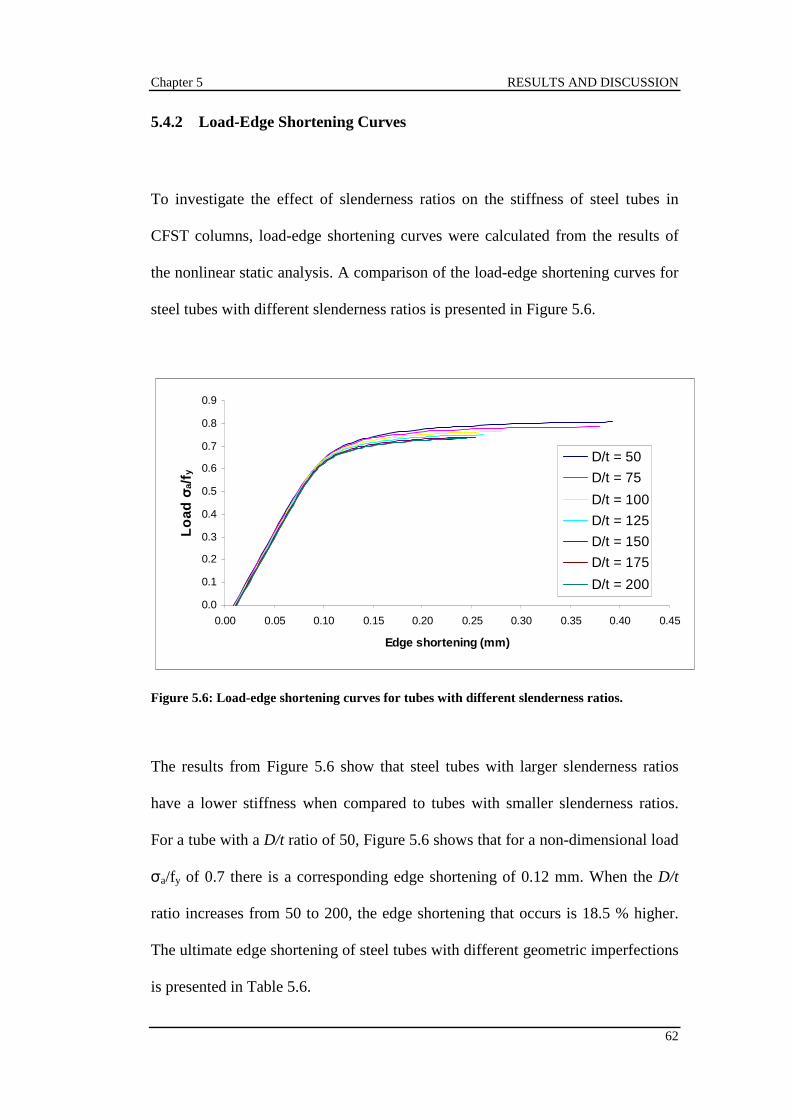
Chapter 5 RESULTS AND DISCUSSION
62
5.4.2 Load-Edge Shortening Curves
To investigate the effect of slenderness ratios on the stiffness of steel tubes in
CFST columns, load-edge shortening curves were calculated from the results of
the nonlinear static analysis. A comparison of the load-edge shortening curves for
steel tubes with different slenderness ratios is presented in Figure 5.6.
0.0
0.1
0.2
0.3
0.4
0.5
0.6
0.7
0.8
0.9
0.00 0.05 0.10 0.15 0.20 0.25 0.30 0.35 0.40 0.45
Edge shortening (mm)
Lo
ad σ
a/f y
D/t = 50
D/t = 75
D/t = 100
D/t = 125
D/t = 150
D/t = 175
D/t = 200
Figure 5.6: Load-edge shortening curves for tubes with different slenderness ratios.
The results from Figure 5.6 show that steel tubes with larger slenderness ratios
have a lower stiffness when compared to tubes with smaller slenderness ratios.
For a tube with a D/t ratio of 50, Figure 5.6 shows that for a non-dimensional load
σa/fy of 0.7 there is a corresponding edge shortening of 0.12 mm. When the D/t
ratio increases from 50 to 200, the edge shortening that occurs is 18.5 % higher.
The ultimate edge shortening of steel tubes with different geometric imperfections
is presented in Table 5.6.
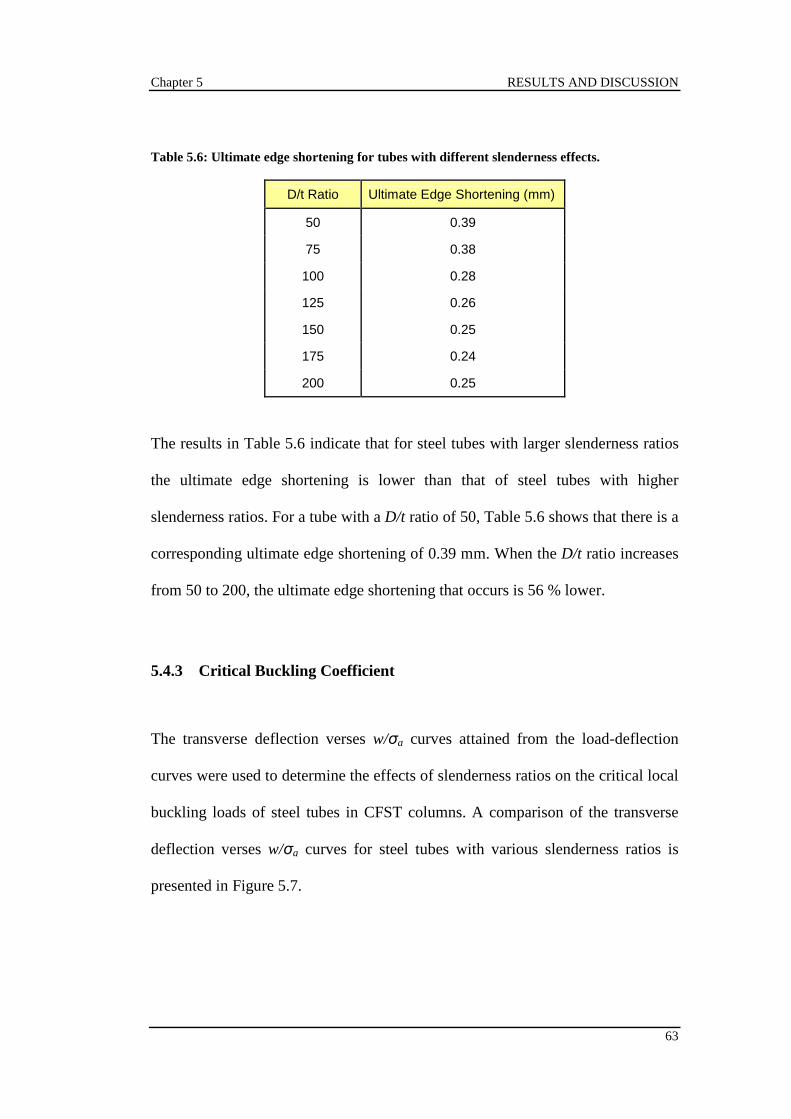
Chapter 5 RESULTS AND DISCUSSION
63
Table 5.6: Ultimate edge shortening for tubes with different slenderness effects.
D/t Ratio Ultimate Edge Shortening (mm)
50 0.39
75 0.38
100 0.28
125 0.26
150 0.25
175 0.24
200 0.25
The results in Table 5.6 indicate that for steel tubes with larger slenderness ratios
the ultimate edge shortening is lower than that of steel tubes with higher
slenderness ratios. For a tube with a D/t ratio of 50, Table 5.6 shows that there is a
corresponding ultimate edge shortening of 0.39 mm. When the D/t ratio increases
from 50 to 200, the ultimate edge shortening that occurs is 56 % lower.
5.4.3 Critical Buckling Coefficient
The transverse deflection verses w/σa curves attained from the load-deflection
curves were used to determine the effects of slenderness ratios on the critical local
buckling loads of steel tubes in CFST columns. A comparison of the transverse
deflection verses w/σa curves for steel tubes with various slenderness ratios is
presented in Figure 5.7.
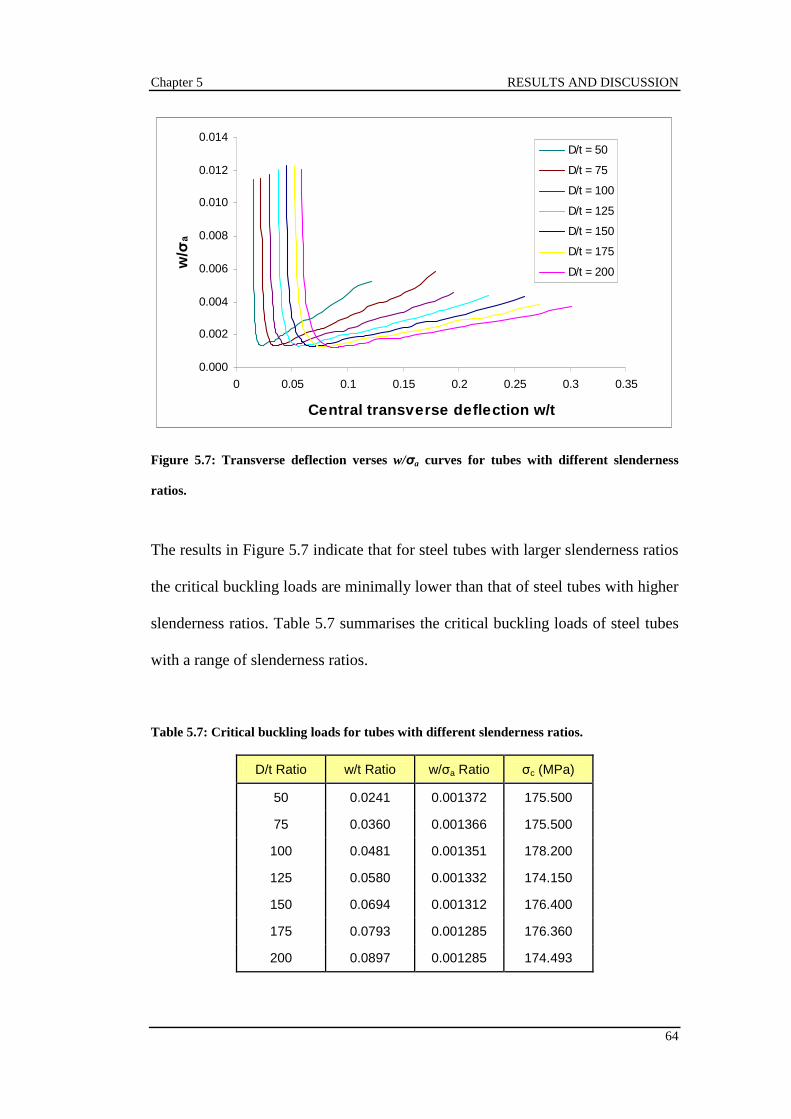
Chapter 5 RESULTS AND DISCUSSION
64
0.000
0.002
0.004
0.006
0.008
0.010
0.012
0.014
0 0.05 0.1 0.15 0.2 0.25 0.3 0.35
Central transverse deflection w/t
w/σ
a
D/t = 50
D/t = 75
D/t = 100
D/t = 125
D/t = 150
D/t = 175
D/t = 200
Figure 5.7: Transverse deflection verses w/σa curves for tubes with different slenderness
ratios.
The results in Figure 5.7 indicate that for steel tubes with larger slenderness ratios
the critical buckling loads are minimally lower than that of steel tubes with higher
slenderness ratios. Table 5.7 summarises the critical buckling loads of steel tubes
with a range of slenderness ratios.
Table 5.7: Critical buckling loads for tubes with different slenderness ratios.
D/t Ratio w/t Ratio w/σa Ratio σc (MPa)
50 0.0241 0.001372 175.500
75 0.0360 0.001366 175.500
100 0.0481 0.001351 178.200
125 0.0580 0.001332 174.150
150 0.0694 0.001312 176.400
175 0.0793 0.001285 176.360
200 0.0897 0.001285 174.493

Chapter 5 RESULTS AND DISCUSSION
65
The results from Table 5.7 show that for a steel tube with a slenderness ratio of
50, the corresponding critical buckling load is 175.5 MPa. When the slenderness
ratio is increased to 200, the buckling load is only 0.6% lower. The results in
Table 5.7 indicate that the critical buckling loads are only minimally affected, if
not at all, by the slenderness ratio of steel tubes in circular CFST columns.
5.4.4 Post-Local Buckling Reserve of Strength
The ultimate stress and critical buckling loads obtained from the load-deflection
and transverse deflection verses w/σa curves were used to determine the effects of
slenderness ratios on the post-local buckling reserve of strengths of steel tubes in
CFST columns. A comparison of the post-local buckling reserve of strengths for
steel tubes with various slenderness ratios is presented in Table 5.8.
Table 5.8: Post-local buckling reserve strengths for tubes with different slenderness ratios.
D/t Ratio σu (MPa) σc (MPa) σp (MPa) σp/σu (%)
50 241.8 175.5 66.33 37.79
75 235.5 175.5 59.96 34.17
100 229.1 178.2 50.93 28.58
125 224.7 174.2 50.51 29.00
150 221.4 176.4 45.00 25.51
175 219.4 179.6 39.80 22.16
200 219.9 174.5 45.40 26.02
The results in Table 5.8 indicate that the post-local buckling strengths of steel
tubes with larger slenderness ratios are lower than that of tubes with smaller
slenderness ratios. A post-local buckling reserve of strength of a tube with a
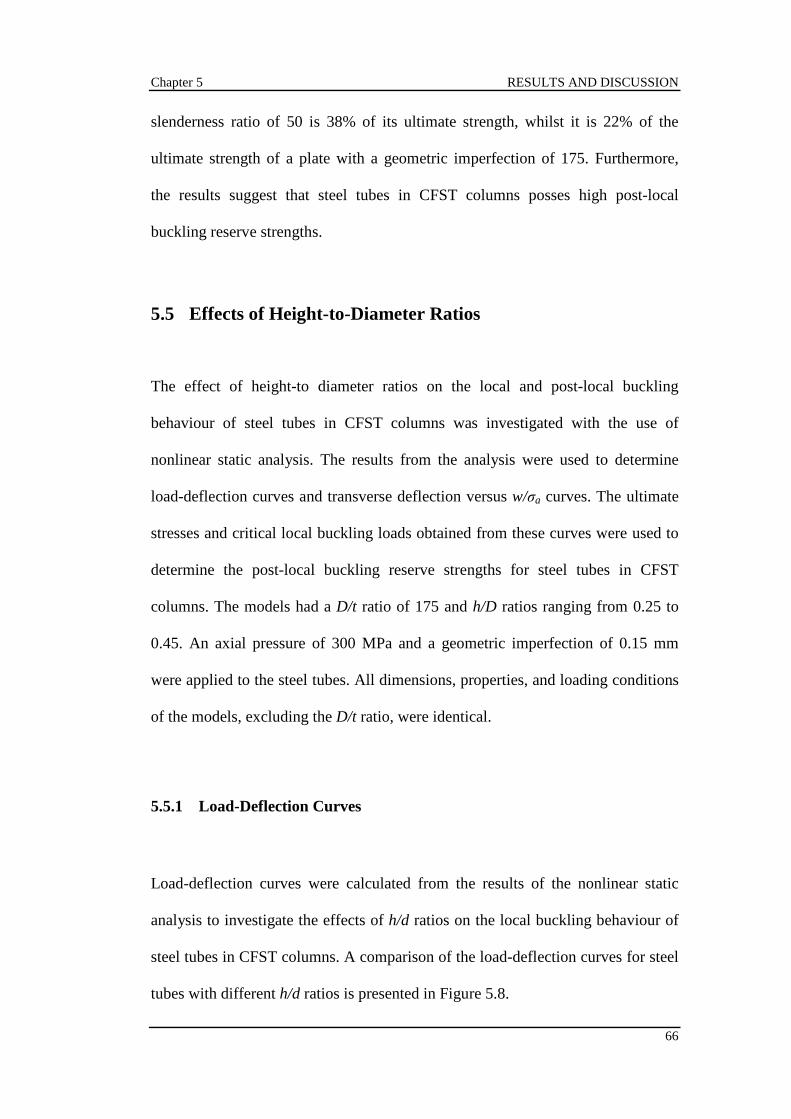
Chapter 5 RESULTS AND DISCUSSION
66
slenderness ratio of 50 is 38% of its ultimate strength, whilst it is 22% of the
ultimate strength of a plate with a geometric imperfection of 175. Furthermore,
the results suggest that steel tubes in CFST columns posses high post-local
buckling reserve strengths.
5.5 Effects of Height-to-Diameter Ratios
The effect of height-to diameter ratios on the local and post-local buckling
behaviour of steel tubes in CFST columns was investigated with the use of
nonlinear static analysis. The results from the analysis were used to determine
load-deflection curves and transverse deflection versus w/σa curves. The ultimate
stresses and critical local buckling loads obtained from these curves were used to
determine the post-local buckling reserve strengths for steel tubes in CFST
columns. The models had a D/t ratio of 175 and h/D ratios ranging from 0.25 to
0.45. An axial pressure of 300 MPa and a geometric imperfection of 0.15 mm
were applied to the steel tubes. All dimensions, properties, and loading conditions
of the models, excluding the D/t ratio, were identical.
5.5.1 Load-Deflection Curves
Load-deflection curves were calculated from the results of the nonlinear static
analysis to investigate the effects of h/d ratios on the local buckling behaviour of
steel tubes in CFST columns. A comparison of the load-deflection curves for steel
tubes with different h/d ratios is presented in Figure 5.8.

Chapter 5 RESULTS AND DISCUSSION
67
0.0
0.1
0.2
0.3
0.4
0.5
0.6
0.7
0.8
0 0.1 0.2 0.3 0.4 0.5 0.6 0.7 0.8 0.9
Lateral deflection at tube centre (w)
Lo
ad σ
a/f y
h/D = 0.25
h/D = 0.30
h/D = 0.35
h/D = 0.40
h/D = 0.45
Figure 5.8: Load-deflection curves for tubes with different h/D ratios.
It can be seen from Figure 5.8 that the tubes considered in the analysis could not
attain their yield strength because of the geometrical imperfections applied. The
results in Figure 5.8 also show that for steel tubes with smaller h/d ratios the
critical local buckling strength is slightly lower than that of steel tubes with larger
h/d ratios. For a tube with a h/D ratio of 0.25, Figure 5.8 shows that for a lateral
deflection at tube centre w of 0.3 mm the corresponding non-dimensional load
σa/fy is 0.66. When the h/D ratio increases from 0.25 to 0.45, the load that can be
applied to produce the same deflection is 3.8 % higher. Table 5.9 presents the
ultimate stresses for the steel tubes obtained from the results.

Chapter 5 RESULTS AND DISCUSSION
68
Table 5.9: Ultimate stress for different h/D ratios.
h/D Ratio σc (MPa) σc/fy (%)
0.25 218.40 0.73
0.30 218.90 0.73
0.35 219.40 0.73
0.40 221.90 0.74
0.45 221.40 0.74
Figure 5.9 shows that the ultimate stress for smaller h/D ratios is minimally lower
than that of larger h/D ratios. The ultimate strength of a steel tube with a D/t ratio
of 200 is 74% of its yield strength, whilst it is 73% of the ultimate strength for a
steel tube with a D/t ratio of 50. The results presented in Table 5.9 further suggest
that the h/D ratio has little to no effect on the ultimate strength of steel tubes in
CFST columns.
5.5.2 Critical Buckling Coefficient
The transverse deflection verses w/σa curves attained from the load-deflection
curves were used to determine the effects of h/D ratios on the critical local
buckling loads of steel tubes in CFST columns. A comparison of the transverse
deflection verses w/σa curves for steel tubes with various is h/D ratios are
presented in Figure 5.9.
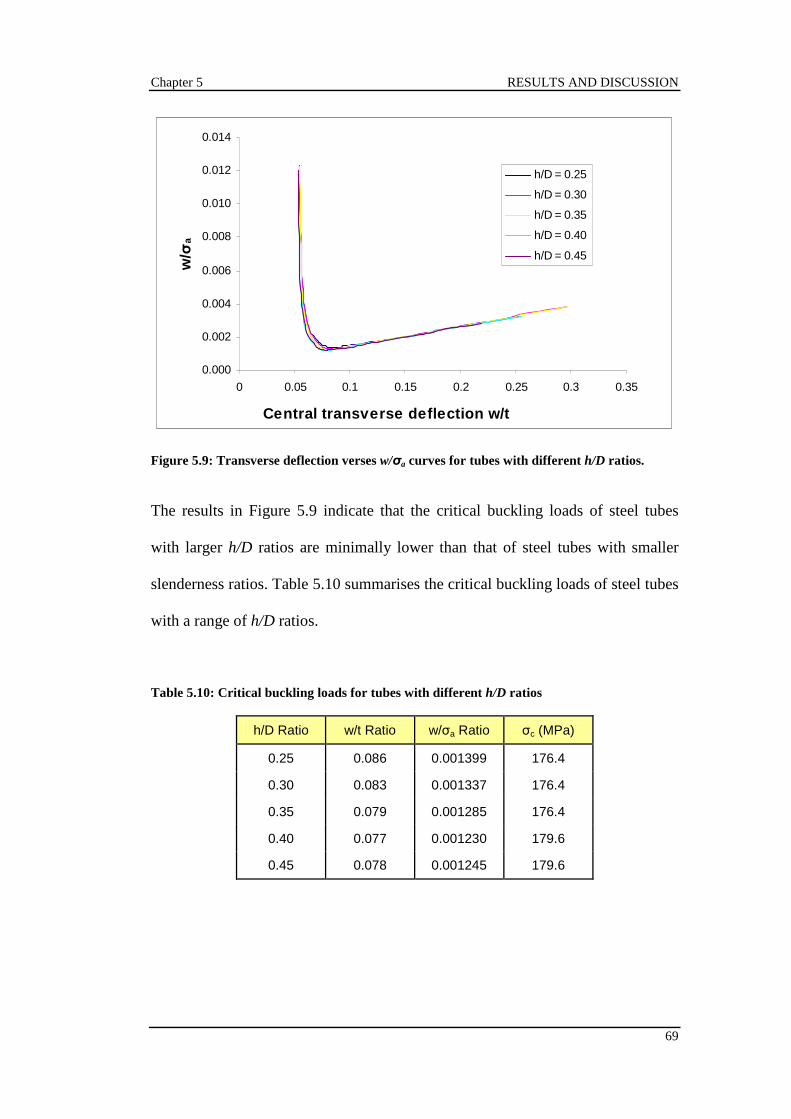
Chapter 5 RESULTS AND DISCUSSION
69
0.000
0.002
0.004
0.006
0.008
0.010
0.012
0.014
0 0.05 0.1 0.15 0.2 0.25 0.3 0.35
Central transverse deflection w/t
w/σ
a h/D = 0.25
h/D = 0.30
h/D = 0.35
h/D = 0.40
h/D = 0.45
Figure 5.9: Transverse deflection verses w/σa curves for tubes with different h/D ratios.
The results in Figure 5.9 indicate that the critical buckling loads of steel tubes
with larger h/D ratios are minimally lower than that of steel tubes with smaller
slenderness ratios. Table 5.10 summarises the critical buckling loads of steel tubes
with a range of h/D ratios.
Table 5.10: Critical buckling loads for tubes with different h/D ratios
h/D Ratio w/t Ratio w/σa Ratio σc (MPa)
0.25 0.086 0.001399 176.4
0.30 0.083 0.001337 176.4
0.35 0.079 0.001285 176.4
0.40 0.077 0.001230 179.6
0.45 0.078 0.001245 179.6
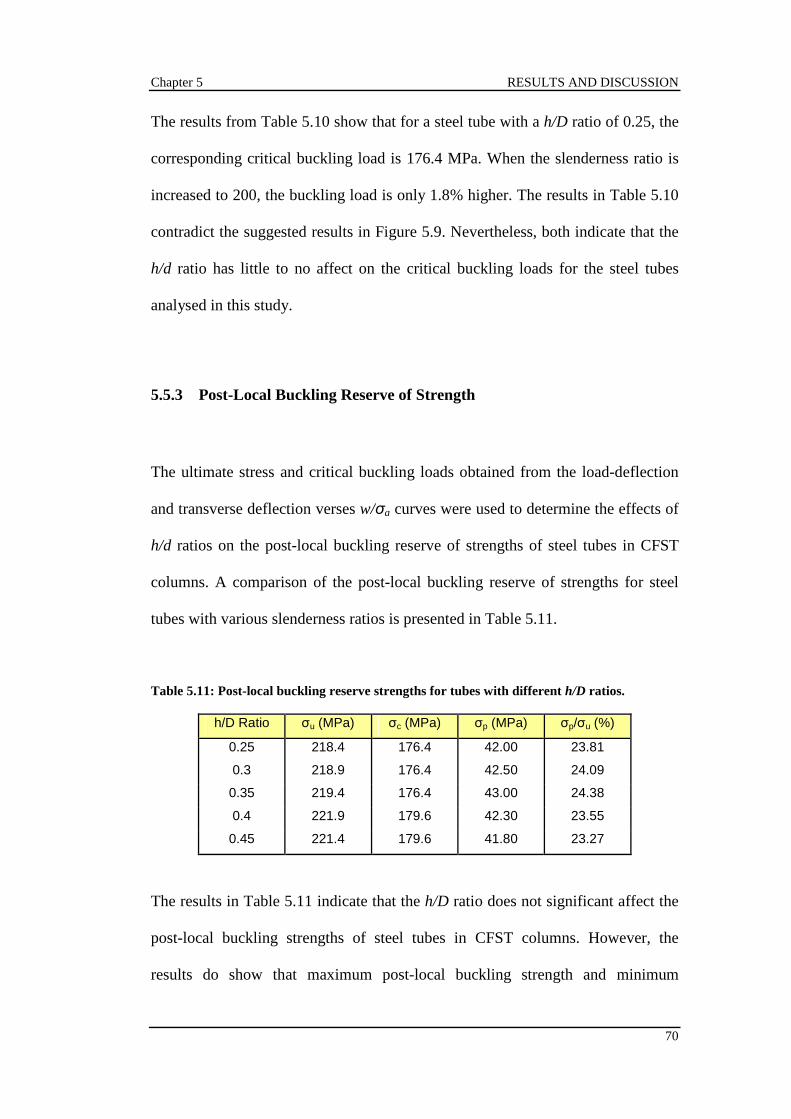
Chapter 5 RESULTS AND DISCUSSION
70
The results from Table 5.10 show that for a steel tube with a h/D ratio of 0.25, the
corresponding critical buckling load is 176.4 MPa. When the slenderness ratio is
increased to 200, the buckling load is only 1.8% higher. The results in Table 5.10
contradict the suggested results in Figure 5.9. Nevertheless, both indicate that the
h/d ratio has little to no affect on the critical buckling loads for the steel tubes
analysed in this study.
5.5.3 Post-Local Buckling Reserve of Strength
The ultimate stress and critical buckling loads obtained from the load-deflection
and transverse deflection verses w/σa curves were used to determine the effects of
h/d ratios on the post-local buckling reserve of strengths of steel tubes in CFST
columns. A comparison of the post-local buckling reserve of strengths for steel
tubes with various slenderness ratios is presented in Table 5.11.
Table 5.11: Post-local buckling reserve strengths for tubes with different h/D ratios.
h/D Ratio σu (MPa) σc (MPa) σp (MPa) σp/σu (%)
0.25 218.4 176.4 42.00 23.81
0.3 218.9 176.4 42.50 24.09
0.35 219.4 176.4 43.00 24.38
0.4 221.9 179.6 42.30 23.55
0.45 221.4 179.6 41.80 23.27
The results in Table 5.11 indicate that the h/D ratio does not significant affect the
post-local buckling strengths of steel tubes in CFST columns. However, the
results do show that maximum post-local buckling strength and minimum

Chapter 5 RESULTS AND DISCUSSION
71
buckling coefficient both correspond to a h/D ratio of 0.35. Furthermore, the
results suggest that steel tubes in CFST columns have high post-local buckling
reserve strengths.
5.6 Effective Strength Formula
5.6.1 Proposed Effective Strength Formula
The effective strength formula for the design of steel tubes in CFST columns is
based on the results of the critical buckling strengths of steel tubes with geometric
imperfections. Using the software package MATLAB (2004), a polynomial was
fitted to the plot of the critical local buckling strengths of the steel tubes with
geometric imperfections. The proposed effective strength formula can be seen in
equation (10).
58.05.17.6 472
+
+
−= −− et
De
t
D
f y
cσ (10)
The proposed formula is a function of the slenderness ratio. However in this
study, the finite element results suggested that the slenderness ratio had a minimal
to no effect on the critical local buckling strength of steel tubes in circular CFST
columns.
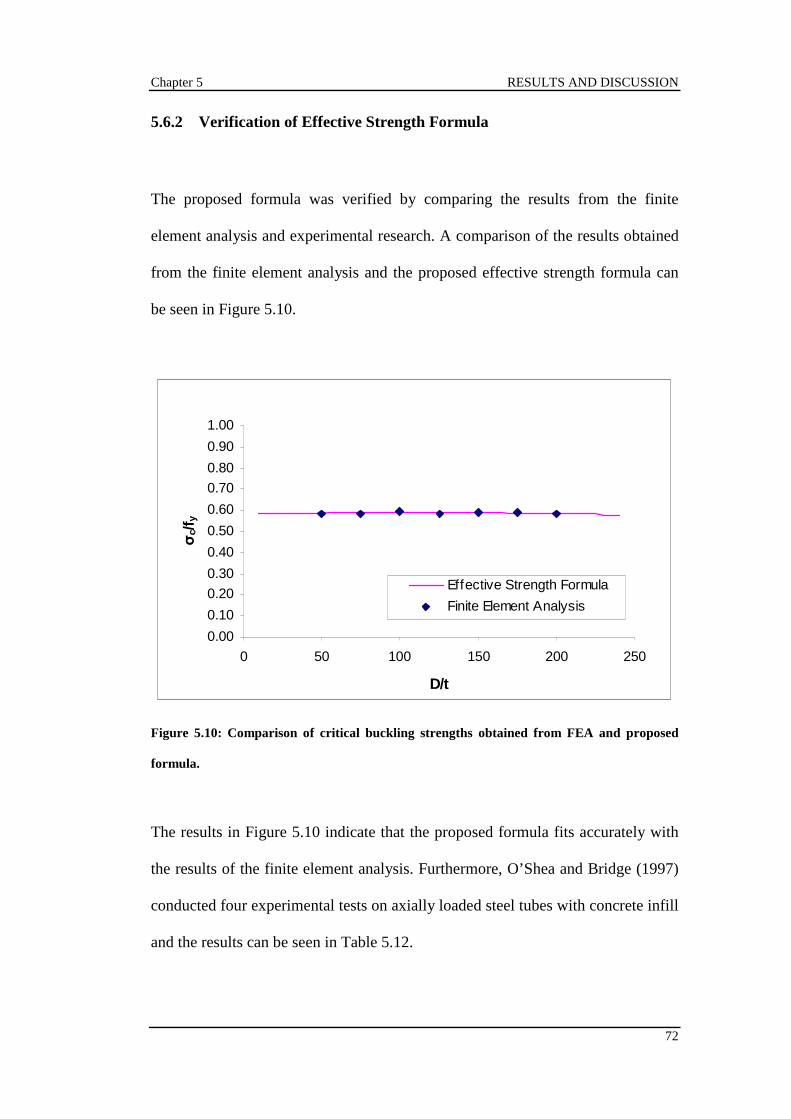
Chapter 5 RESULTS AND DISCUSSION
72
5.6.2 Verification of Effective Strength Formula
The proposed formula was verified by comparing the results from the finite
element analysis and experimental research. A comparison of the results obtained
from the finite element analysis and the proposed effective strength formula can
be seen in Figure 5.10.
0.00
0.10
0.20
0.30
0.40
0.50
0.60
0.70
0.80
0.90
1.00
0 50 100 150 200 250
D/t
σc/f
y
Effective Strength Formula
Finite Element Analysis
Figure 5.10: Comparison of critical buckling strengths obtained from FEA and proposed
formula.
The results in Figure 5.10 indicate that the proposed formula fits accurately with
the results of the finite element analysis. Furthermore, O’Shea and Bridge (1997)
conducted four experimental tests on axially loaded steel tubes with concrete infill
and the results can be seen in Table 5.12.
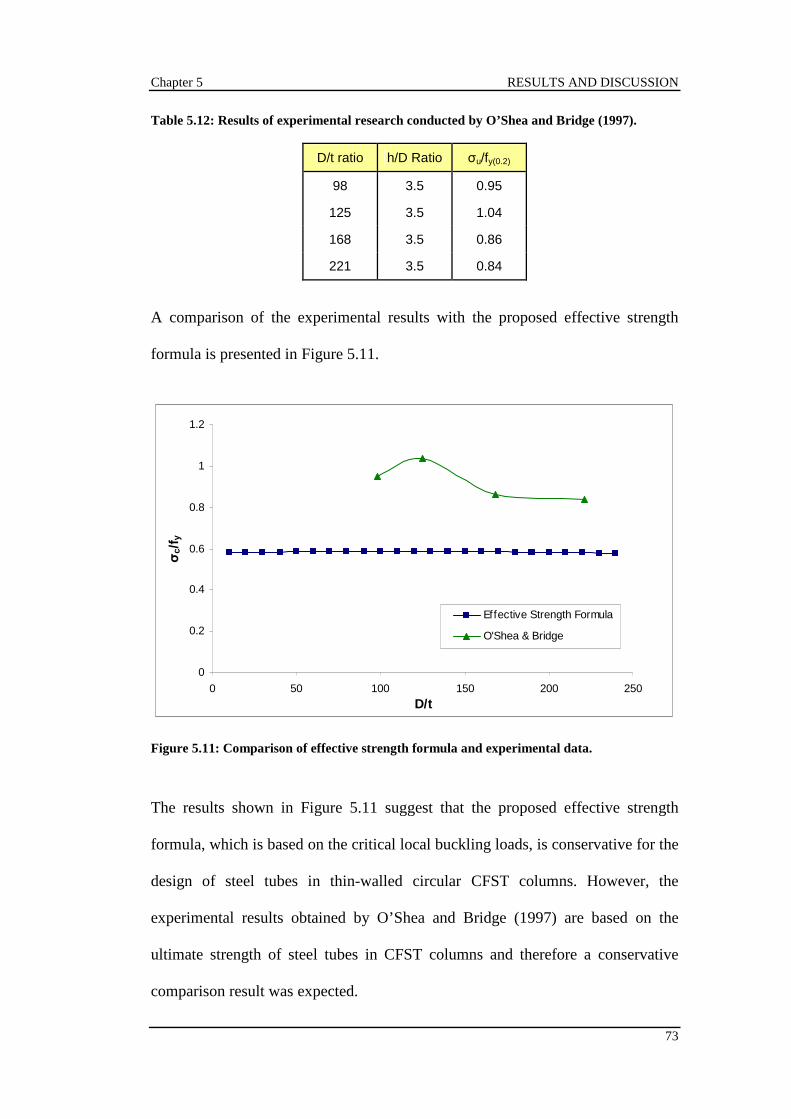
Chapter 5 RESULTS AND DISCUSSION
73
Table 5.12: Results of experimental research conducted by O’Shea and Bridge (1997).
D/t ratio h/D Ratio σu/fy(0.2)
98 3.5 0.95
125 3.5 1.04
168 3.5 0.86
221 3.5 0.84
A comparison of the experimental results with the proposed effective strength
formula is presented in Figure 5.11.
0
0.2
0.4
0.6
0.8
1
1.2
0 50 100 150 200 250
D/t
σc/
f y
Effective Strength Formula
O'Shea & Bridge
Figure 5.11: Comparison of effective strength formula and experimental data.
The results shown in Figure 5.11 suggest that the proposed effective strength
formula, which is based on the critical local buckling loads, is conservative for the
design of steel tubes in thin-walled circular CFST columns. However, the
experimental results obtained by O’Shea and Bridge (1997) are based on the
ultimate strength of steel tubes in CFST columns and therefore a conservative
comparison result was expected.
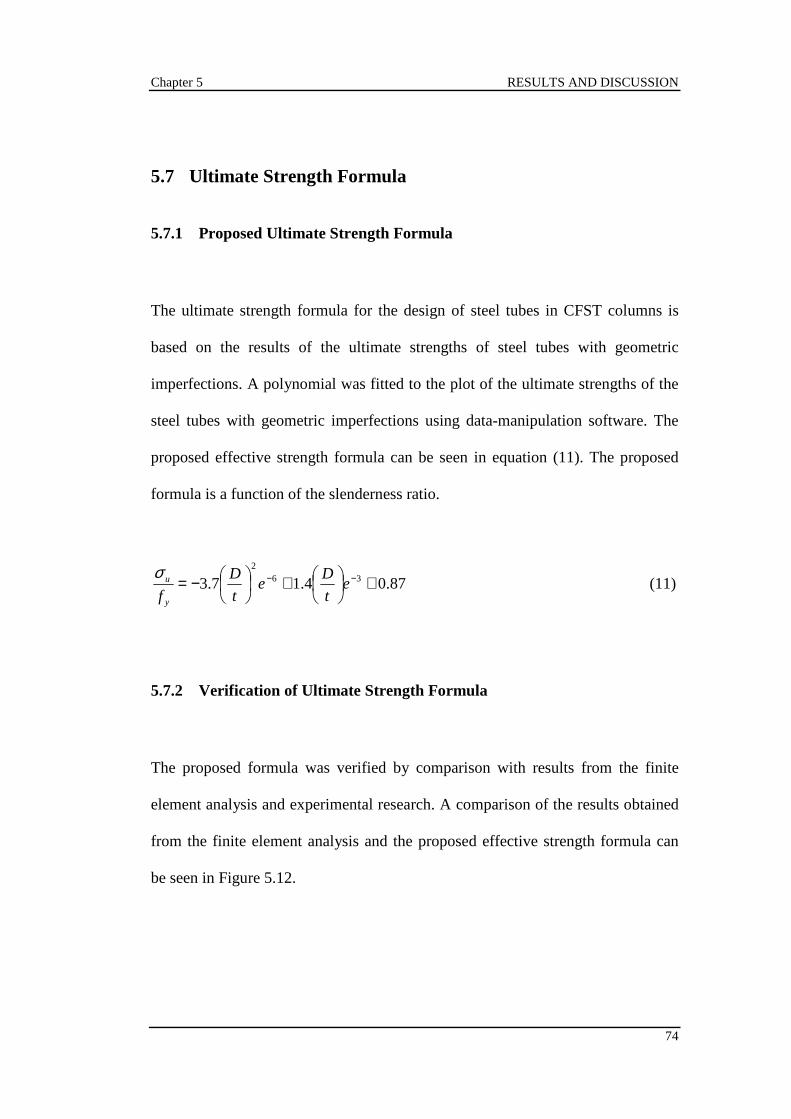
Chapter 5 RESULTS AND DISCUSSION
74
5.7 Ultimate Strength Formula
5.7.1 Proposed Ultimate Strength Formula
The ultimate strength formula for the design of steel tubes in CFST columns is
based on the results of the ultimate strengths of steel tubes with geometric
imperfections. A polynomial was fitted to the plot of the ultimate strengths of the
steel tubes with geometric imperfections using data-manipulation software. The
proposed effective strength formula can be seen in equation (11). The proposed
formula is a function of the slenderness ratio.
87.04.17.3 362
+
+
−= −− et
De
t
D
f y
uσ (11)
5.7.2 Verification of Ultimate Strength Formula
The proposed formula was verified by comparison with results from the finite
element analysis and experimental research. A comparison of the results obtained
from the finite element analysis and the proposed effective strength formula can
be seen in Figure 5.12.
Chapter 5 RESULTS AND DISCUSSION
75
0.0
0.1
0.2
0.3
0.4
0.5
0.6
0.7
0.8
0.9
1.0
0 50 100 150 200 250D/t
σc/f
y
Ultimate Strength Formula
Finite Element Analysis
Figure 5.12: Comparison of ultimate strengths attained from FEA and proposed formula.
The results in Figure 5.12 indicate that the proposed formula fits precisely with
the results of the finite element analysis. Once again, the experimental
investigation conducted by O’Shea and Bridge (1997) is used to verify the
ultimate strength formulas for the design of steel tubes in CFST columns. A
comparison of the experiment results with the proposed ultimate strength formula
is presented in Figure 5.13.

Chapter 5 RESULTS AND DISCUSSION
76
0
0.2
0.4
0.6
0.8
1
1.2
0 50 100 150 200 250
D/t
σc/
f y
Ultimate Strength Formula
O'Shea & Bridge
Figure 5.13: Comparison of ultimate strength formula and experimental data.
When comparing both sets of results, ignoring the experimental h/d ratio of 125, it
can be seen from Figure 5.13 that for tubes with larger D/t ratios the ultimate
stress is lower than that of steel tubes with small D/t ratios for both the formula
and the experimental results. Looking at the experimental result for a thin-walled
tube with a h/D ratio of 175, Figure 5.13 shows that the non-dimensional load σu/fy
is approximately 0.86 MPa. Furthermore, when using the formula the non-
dimensional load σu/fy 17.6% lower. This suggests that the ultimate strength
formula, which is based on the ultimate strengths, is slightly conservative for the
design of steel tubes in thin-walled circular CFST columns.
Chapter 5 RESULTS AND DISCUSSION
77
5.8 Summary
This chapter presented and discussed the results that were obtained from the
nonlinear finite element analysis that investigated the local and post-local
buckling of steel tubes in circular CFST columns. The effect of geometric
imperfections, slenderness ratios, and height-to-diameter ratios were examined.
Based on the results, it was determined that the magnitude of the geometric
imperfection, applied to the steel tube, has the most significant effect on the local
and post-local buckling behaviour of steel tubes in CFST columns. In addition, the
results suggest that both the slenderness ratio and height-to-diameter ratio have
minimal effect on the local buckling behaviour of steel tubes. However, it was
established that steel tubes in CFST columns have high post-local buckling
reserve strengths.
Furthermore, an effective strength formula and an ultimate strength formula were
proposed for the design of steel tubes in circular CFST columns. Both formulas
compared accurately with the finite element analysis. When compared to available
experimental data they appear to produce conservative results for both critical and
ultimate load. However, while there is a suggestion that there was some
correlation between the experimental results and the formulas, further data is
required to assess the accuracy of both formulas before any suggestion of design
application.

78
Chapter 6 CONCLUSIONS AND
RECOMMENDATIONS
6.1 Summary
An investigation into the local and post-local buckling behaviour of steel tubes in
circular CFST columns using the finite element method is presented. The effects
of geometric imperfection, slenderness ratios, and height-to-diameter ratios on the
critical buckling loads and ultimate strengths of steel tubes in CFST columns were
considered. Effective and ultimate strength formulas for the design of steel tubes
in CFST columns are also proposed.
6.2 Achievement of Aims and Objectives
This project aimed to investigate the local and post-local buckling behaviour of
thin-walled circular CFST columns using the finite element method. The major

Chapter 6 CONCLUSION AND RECCOMENDATIONS
79
objectives of this project accompanied with the outcomes of these aims are listed
below:
1. Research existing information relating to local and post-local buckling of CFST
columns.
The results of an extensive literature review are presented in Chapter 2. However,
much of the research conducted is not aimed at local and post-local buckling of
circular CFST columns columns.
2. Study the nonlinear finite element analysis method and develop three-
dimensional finite element models for the nonlinear analysis of concrete-filled
thin-walled steel tubular columns.
A study was completed of the finite element analysis method and Chapter 3
contains an outline the technical details and development of the finite element
models used in this investigation.
3. Conduct geometric and material nonlinear finite element analysis on steel tubes
under uniform/non-uniform edge compression to determine critical load and post-
local buckling strengths. Initial geometric imperfections, residual stresses,
material yielding and strain hardening will be considered in the analysis.
Geometric and material nonlinear finite element analysis on steel tubes under
uniform edge compression was conducted and the critical load and post-local
buckling strengths are discussed in Chapter 5. The analysis considers geometric
Chapter 6 CONCLUSION AND RECCOMENDATIONS
80
imperfections, material yielding and strain hardening. Non-uniform edge
compression and residual stresses were not considered.
4. Furthermore, investigate the effects of stress gradients and tube width-to-
thickness ratios on the load-deflection curves and the post-local buckling
strengths.
The effects of slenderness ratios were investigated and the load-deflection curves
and post-local buckling strengths are discussed in chapter 5. The effects of stress
gradients were not considered in the analysis.
5. Based on the results obtained; propose a set of design formulas for determining
the critical local buckling loads and ultimate strengths of concrete-filled thin-
walled steel tubular columns.
An effective strength formula for determining the critical buckling loads is
proposed in Chapter 5. An ultimate strength formula for the design of thin-walled
CFST columns was not proposed. However, an additional formula for
determining the ultimate strength of steel tubes in CFST columns was developed.
6. Verify the proposed design formulas by comparison with existing experimental
results and those developed by other researchers.
The proposed design formulas were verified by comparison with existing
experimental results and are discussed in Chapters 5.62 and 5.72.
Chapter 6 CONCLUSION AND RECCOMENDATIONS
81
6.3 Conclusions
The results of the local and post-local buckling investigation indicated that the
ultimate strength and stiffness of CFST columns is significantly affected by local
buckling of the steel tube. It can also been seen from this investigation that steel
tubes in CFST columns have high post-local buckling reserves of strength
Furthermore, the local and post-local buckling behaviour of steel tubes in CFST
columns is significantly affected by the magnitude of the geometric imperfection
implied. Initial imperfections affect the ultimate load, critical buckling load, and
the post local buckling reserve of strength. Based on the results of this study, the
slenderness ratio had a minimal effect on the critical buckling load of steel tubes
in CFST columns. However, the ultimate load and post-local buckling reserve of
strength for steel tubes in CFST columns was influenced by the slenderness ratio.
The effective strength formula proposed appears to be conservative when
compared to the experimental results. However, the results are for ultimate
strengths and it could be suggested that they are less than complete. The ultimate
strength formula proposed attains similar result to the experiment data for
slenderness ratios greater >150. However, while there is a suggestion that there
was some correlation between the experimental results and the formulas, further
data is required to assess the accuracy of both formulas before any suggestion of
design application.

Chapter 6 CONCLUSION AND RECCOMENDATIONS
82
6.4 Recommendations
It is strongly recommend that further experimental and finite element based
research be conducted on the critical buckling and ultimate strengths of circular
CFST columns under various loading conditions. Currently, the information and
data available is limited. A comprehensive understanding of the behaviour of
circular CFST columns will not be achieved until this problem is rectified.
Other areas other research may also include:
• Concrete confinement.
• Interaction between the steel and concrete.
• Effect of eccentric loading conditions
• Fire resistance capacity
• The use of stiffeners in circular CFST columns

83
Appendix A
Project Specification
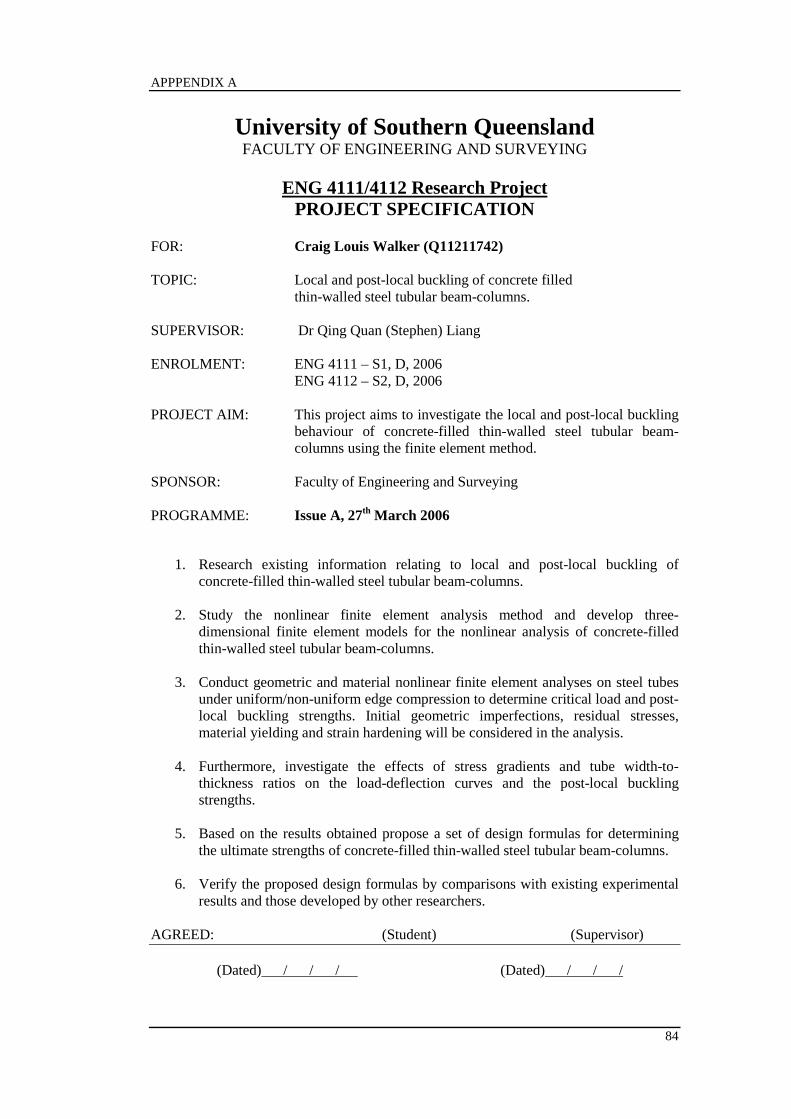
APPPENDIX A
84
University of Southern Queensland FACULTY OF ENGINEERING AND SURVEYING
ENG 4111/4112 Research Project
PROJECT SPECIFICATION FOR: Craig Louis Walker (Q11211742) TOPIC: Local and post-local buckling of concrete filled thin-walled steel tubular beam-columns. SUPERVISOR: Dr Qing Quan (Stephen) Liang ENROLMENT: ENG 4111 – S1, D, 2006 ENG 4112 – S2, D, 2006 PROJECT AIM: This project aims to investigate the local and post-local buckling
behaviour of concrete-filled thin-walled steel tubular beam-columns using the finite element method.
SPONSOR: Faculty of Engineering and Surveying PROGRAMME: Issue A, 27th March 2006
1. Research existing information relating to local and post-local buckling of concrete-filled thin-walled steel tubular beam-columns.
2. Study the nonlinear finite element analysis method and develop three-
dimensional finite element models for the nonlinear analysis of concrete-filled thin-walled steel tubular beam-columns.
3. Conduct geometric and material nonlinear finite element analyses on steel tubes
under uniform/non-uniform edge compression to determine critical load and post-local buckling strengths. Initial geometric imperfections, residual stresses, material yielding and strain hardening will be considered in the analysis.
4. Furthermore, investigate the effects of stress gradients and tube width-to-
thickness ratios on the load-deflection curves and the post-local buckling strengths.
5. Based on the results obtained propose a set of design formulas for determining
the ultimate strengths of concrete-filled thin-walled steel tubular beam-columns. 6. Verify the proposed design formulas by comparisons with existing experimental
results and those developed by other researchers. AGREED: (Student) (Supervisor) (Dated) / / / (Dated) / / /
85
References
Bradford, MA, Loh, HY & Uy, B, 2001, ’Slenderness limits for CHS sections’,
In: Ninth International Symposium on Tubular Structures, Düsseldorf, pp.
377-81.
Bradford, MA, Loh, HY & Uy, B, 2002, ‘Slenderness limits for circular steel
tubes’, Journal of Constructional Steel Research, vol. 58, pp. 243-52.
Bridge, RQ, O’Shea, MD, Gardner, P, Grigson, R & Tyrell, J, 1995, ‘Local
buckling of square thin-walled steel tubes with concrete infill’, In:
Proceedings of the international conference on structural stability and
design, pp. 307-14.
Bridge, RQ & O’Shea, MD, 1998, ‘Behaviour of thin-walled steel box sections
with or without internal restraint’, Journal of Structural Engineering,
ASCE, vol. 47, no. 1-2, pp. 73-91.
Fam, A, Qie, FS & Rizkalla, S, 2004, ‘Concrete-filled steel tubes subjected to
axial compression and lateral cyclic loads’, Journal of Structural
Engineering, ASCE, vol. 130, no. 4, pp. 631-40.
Giakoumelis, G & Lam, D, 2004, ‘Axial capacity of circular concrete-filled tube
columns’, Journal of Constructional Steel Research, vol. 60, pp. 1049-68.
Hu, HT, Huang, CS, Wu, MH & Wu, YM, 2003, ‘Nonlinear Analysis of Axially
Loaded Concrete-Filled Tube Columns with Confinement Effect’, Journal
of Structural Engineering, ASCE, vol. 129, no. 10 pp. 1322-9.

REFERENCES
86
Johansson, M & Gylitoft, K, 2002, ‘Mechanical behaviour of circular steel-
composite stub columns’, Journal of Structural Engineering, ASCE, vol.
128, no. 8, pp. 1073-81.
Lakshmi, B & Shanmugan, NE, 2002, ‘Nonlinear Analysis of In-Filled Steel-
Concrete Composite Columns’, Journal of Structural Engineering, ASCE,
vol. 128, no. 7, pp. 922-33.
Liang, QQ & Uy, B, 1998, ‘Parametric study on the structural behaviour of steel
plates in concrete-filled thin-waled box columns’, Advances in structural
engineering, vol. 2, no. 1, pp. 57-71.
Liang, QQ & Uy, B, 2000, ‘Theoretical study on the post-local buckling of steel
plates in concrete-filled box columns’, Computers and Structures, vol. 75,
pp. 479-90.
Liang, QQ, Uy, B, Wright, HD & Bradford, MA, 2003, ‘Local and post-local
buckling of double skin composite panels’, Proceedings of the Institute of
Civil Engineers: Structures and Buildings, vol. 156, no. 2, pp. 111-9.
Liang, QQ, Uy, B & Liew, RJY, ‘Local buckling of steel plates in concrete-filled
thin-walled steel tubular beam-columns’, Journal of Constructional Steel
Research, accepted 26 May 2006a.
Liang, QQ, Uy, B & Liew, JYR, 2006b, ‘Nonlinear analysis of concrete-filled
thin-walled steel box columns with local buckling effects’, Journal of
Constructional Steel Research, vol. 62, pp. 581-91.
MATLAB, 2006, The MathWorks, Sydney (Australia).

REFERENCES
87
Moffin, DS & Dwight, JB, 1984, ‘Buckling of aluminium plates in compression’,
In: Behaviour of thin-walled structures, Amsterdam: Elsevier Science, p.
399-427.
O’Shea, MD & Bridge, RQ, 1997, ‘Local buckling of thin-walled circular steel
sections with or without internal restraint’, Res. Rep. R740, Dept. Civ.
Engrg., University of Sydney, Sydney, Australia.
Ramberg, W & Osgood, WR, 1983, ‘Description of stress-strain curves by three
parameters’, NACA technical note, no. 902, pp. 1943.
Shanmugam, NE & Lakshmi, B, 2001, ‘State of the art report on steel-concrete
composite columns’, Journal of Constructional Steel Research, vol. 57,
pp. 1041-80.
Shanmugam, NE & Lakshmi, B, 2000, ‘An analytical model for thin-walled steel
box columns with concrete infill’, Engineering Structures, vol. 24, pp.
825-38.
STRAND7, 2002, G+D computing, Sydney (Australia).
Uy, B 1998, ’Local and post-local buckling of concrete filled steel welded box
columns’, Journal of Constructional Steel Research, vol 47, pp. 47-52.
Uy, B, 2000, ’Strength of concrete-filled steel box columns incorporating local
buckling’, Journal of Structural Engineering, ASCE, vol. 126, no. 3, pp.
341-52.
Uy, B, 2001, ‘Local and post-local buckling of fabricated steel and composite
cross sections’, Journal of Structural Engineering, ASCE, vol. 127, no. 6,
pp.666-77.
REFERENCES
88
Watson, KB & O’Brien, LJ, 1990, ‘Tubular composite columns and their
development in Australia’, Proceedings of the Structural Engineering
Conference, The Institute of Engineers, Adelaide, Australia, pp. 186-90.
Zhong, ST & Goode, CD, 2001, ‘Composite construction for columns in high-rise
buildings in China’, Structures and Buildings, vol. 146, no. 4, pp. 333-40.
Recommended