LinkedIn’s Technology Trends & Compensation StudyMay, 2009

Table of contents
• Overview• Last year’s coolest product launches• Most exciting IT technologies• Vendor perceptions
• Product-specific findings 1) PC 2) Storage Hardware 3) Server Hardware 4) IT service provider 5) Networking Software
• Impact of economy on IT budgets• Importance of products to company success• Satisfaction and performance ratings of key vendors
• Compensation variances by • Company size • Industry• Region• Highest level of education• Field of study• # of years after graduation date• Most mentioned titles • Company size vs. level of purchase decision influence

Overview
Methodology• LinkedIn's Technology Trends & Compensation Study provides the perspectives of
influencers on important IT issues as well as the perspectives of IT decision makers worldwide regarding key IT products, vendors, trends, and compensation benchmarks
Respondent profile• Of the 10941 total survey respondents, 17% are SMB, 20% mid-market and 63%
enterprise companies. The respondents are 67% IT professionals, 7% IT consultants, 13% developers, 6% business decision makers1 and 8% information workers2
• Top represented industries are IT products and services (15%), healthcare (10%), finance/insurance/real estate (8%) and manufacturing/production (7%)
Survey was conducted on 4/22/09 - 5/31/2009 in US only
For more information regarding the content of this survey, please email LinkedIn at [email protected]
1Business professional with significant influence over IT purchases2Not an IT professional or have significant influence over IT purchases, but use a PC at work or school

0
20
40
60
80
100%
Primary role
BDM
ITconsultant
iworker
IT Proinformal
Developer
IT Proformal
Employmentstatus
Other
Self-employedFull-time
Industry
Other
BankingEducation
Telecom.
Mfg
Healthcare
Computer
Decisionmaking
Decisionmaker
Implementer
Companysize
SMB
Mid-m
arket
Enterprise
Highest levelof education
Other
PhDMaster
MS
MBA
Bachelor
State
Other
MNFLNJPAVAOHMA
IL
NY
TX
CA
Metro area
Other
AtlantaMinneapolisDallasLA
ChicagoBoston
Washington DC
SanFrancisco
New York
Field ofstudy*
Other
Business mgmtEE
Business
IS &tech.
ComputerSci.
Finance/Insurance/Real Estate
% of respondents
Overview of respondent profile
*For highest level of educationNote: IT Pro-formal: IT professional working in an IT dept; IT Pro-informal: Perform an IT function, but work outside of a formalized IT dept; Developer: Create software apps, write computer code, develop or design websites or complex systems at work; BDM: Business professional with significant influence over IT purchases; IT Consultant: Consult companies on what technology to purchase and deploy

iPhone, 3G, virtual technologies perceived as most exciting launches; Apple, Microsoft, VMWare and Google as top vendors
Q. In your mind, what was the most exciting new technology product launch last year? Please enter the vendor and product it launched.
PRODUCT
VENDOR

0 10 20 30 40 50%
None of the above
Memrister
Live Mesh
USB 3.0
Google's Chrome
Mashup
Cloud computing or SaaS
Quad-Core Computing
Green IT
Unified communications
Social networking within your company
Mobile Computing
Web-oriented architectures for enterp. sol.
Business Intelligence tools
Virtualization
0
20
40
60
80
100%
Emerging technologies
Cloud computingor SaaS
MobileComputing
Virtualization
BusinessIntelligence tools
Green IT
Other
Web-orientedarchitecture
Mashup
Social networking
% of respondents
Q. Of the following emerging technologies which one excited you the most?
Q. And which of these technologies have been adopted or will be adopted by your company in 2009?
% of respondents
Virtualization, indicated as the most exciting emerging technology, has been or will be adopted by ~50% companies

Q. Compared to other vendors what is the one thing you like the most about the following vendors? [Quotes represent most mentioned strengths ]
CISCO HP
IBM MICROSOFT
Support is mentioned as one of the top strengths for all 4 vendors: Cisco, HP, IBM, Microsoft
“Cisco products have proven to be extremely reliable”“Support, with every product you can just call with any
issues”“Once it is set up, it is up and running for almost
forever with minimum maintenance”“Their response time on any service call no matter
the importance and in depth knowledge of their engineers”
“They have excellent support”“They develop quality products that really meet the
needs”“Consistently solid hardware. Always on the edge
with the latest processors and form factors”“Dependability and support. They have the
answers when I need them and on-site service is superb”
“The products, while expensive, are dependable and the support is top of the line”
“Solid product quality”“Open communication and willingness to work
with customers”“Service and support. They take ownership of
the problem”
“Very responsive to our needs / requests and willing to go the extra mile to ensure our
satisfaction”“Compatibility. I like when things work together
easily”“It the most universally used product for
integration”“Support structure and ease of implementation”
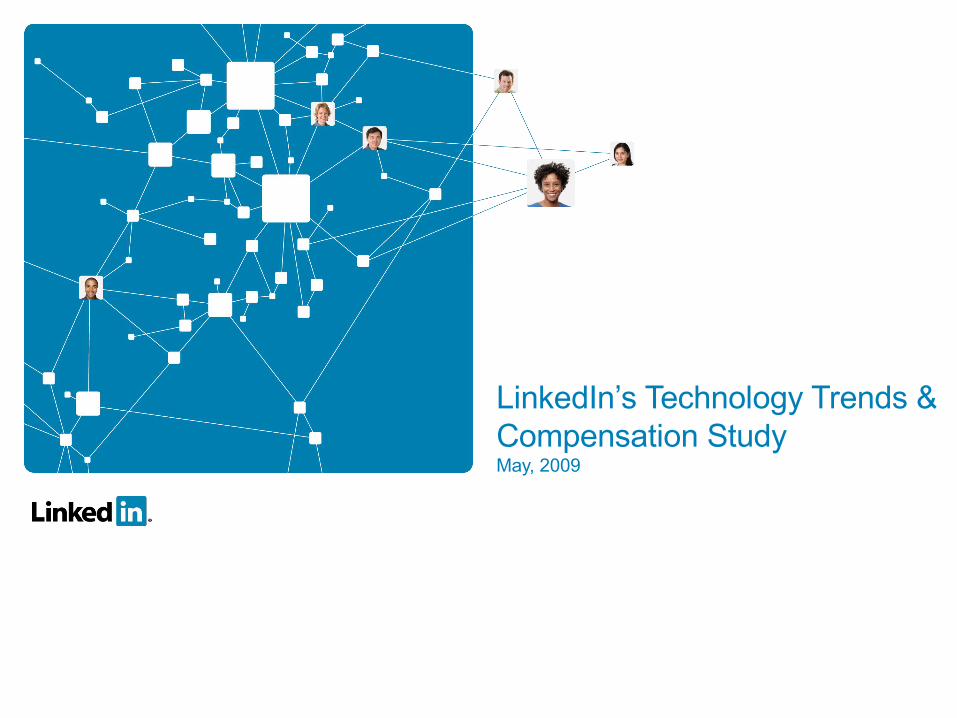
Storage/server hardware and networking software technologies are dealing with economic downturn relatively better
Cisco
Cisco
HP
EMC
Apple
Cisco
Dell
Dell
Dell
Dell
HP Networking Software
Dell IT Service Provider
Dell Server Hardware
Dell Storage Hardware
Dell PC
Impact of downturn on budgets
Degree of importance to company success
Vendors with Top Ratings
Product quality
Service/ Support
Value
No impact/importance
High impact/importance

Q. How has the economic downturn impacted the overall budget for PCs? [by company size]
0
20
40
60
80
100%
SMB
Don't know
Neutral 3%to -3%
Downslightly4-15%
Downsignificantly
16%+
Mid-market Enterprise
Up significantly 16%+Up slightly 4-15%
% of respondents
0
20
40
60
80
100%
SMB
Significantpriority
Missioncritical
Priority
Less important
Mid-market Enterprise
Not important
% of respondents
Q. How important is PC to your companies’ continued overall success? [by company size]
PC Budgetary Trends: Economic downturn has significant negative impact on PC budget; >50% of companies rate PCs as mission critical
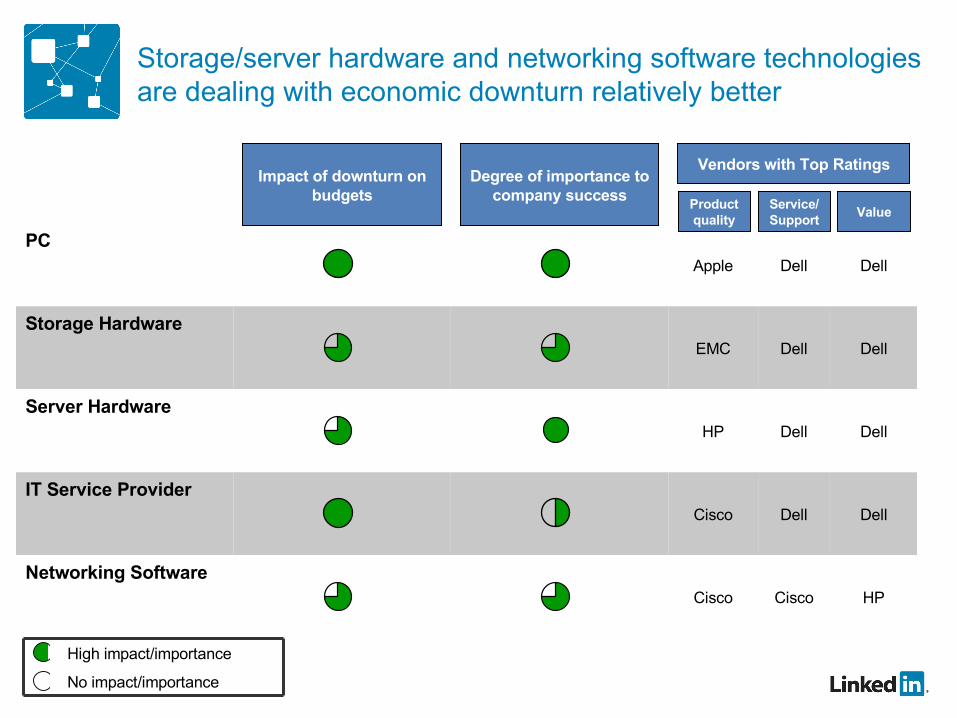
Q. On a scale from 1 to 5 what is your overall satisfaction with the following vendors for PCs?
Q. Please indicate on a scale of 1 to 9 where 1:’Very poor’, 9: ‘Outstanding’, how you would rate the performance of the
vendors on the following for PCs.
PC Vendor Perception: 86% satisfied with Dell PCs; Apple rating highest in quality while Dell is the leader in service/support and value
83%25%58%Apple
29%
42%
35%
36%
% somewhat satisfied
51%
74%
74%
86%
Total
22%
31%
39%
50%
%
very satisfied
Toshiba
HP
Lenovo
Dell
6.35.76.5Toshiba
7.0 / 9.07.0 / 9.07.4 / 9.0Averages
6.76.87.3Lenovo
7.06.67.1HP
7.57.47.5Dell
6.77.38.1Apple
ValueService and
support
Product quality
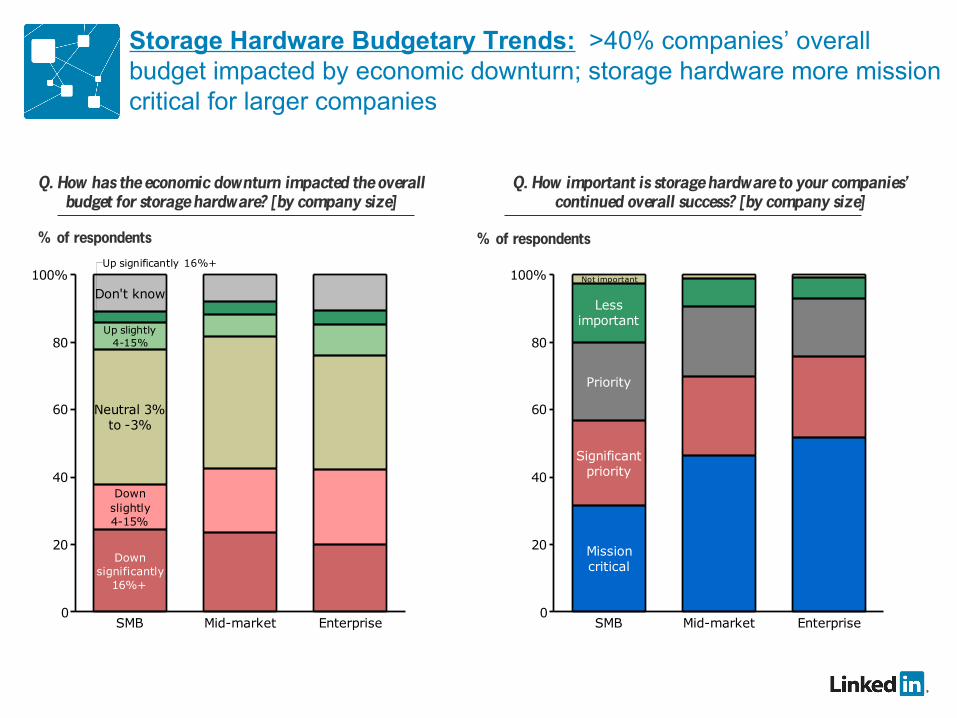
Q. How has the economic downturn impacted the overall budget for storage hardware? [by company size]
0
20
40
60
80
100%
SMB
Don't know
Up slightly4-15%
Neutral 3%to -3%
Downslightly4-15%
Downsignificantly
16%+
Mid-market Enterprise
Up significantly 16%+
0
20
40
60
80
100%
SMB
Significantpriority
Missioncritical
Priority
Not important
Lessimportant
Mid-market Enterprise
Q. How important is storage hardware to your companies’ continued overall success? [by company size]
Storage Hardware Budgetary Trends: >40% companies’ overall budget impacted by economic downturn; storage hardware more mission critical for larger companies
% of respondents % of respondents

Q. On a scale from 1 to 5 what is your overall satisfaction with the following vendors for storage hardware?
Q. Please indicate on a scale of 1 to 9 where 1:’Very poor’, 9: ‘Outstanding’, how you would rate the performance of the vendors
on the following for storage hardware.
Storage Hardware Vendor Perception: 83% satisfied with Dell solutions; EMC rating highest in quality while Dell is the leader in service/support and value
77%36%41%EMC
32%
31%
38%
36%
% somewhat satisfied
63%
66%
77%
83%
Total
31%
34%
38%
47%
%
very satisfied
Sun
IBM
HP
Dell
6.76.87.2Sun
7.0 / 9.07.2 / 9.07.5 / 9.0Averages
6.67.07.3IBM
7.37.27.6HP
6.57.27.8EMC
7.57.67.6Dell
ValueService and
support
Product quality
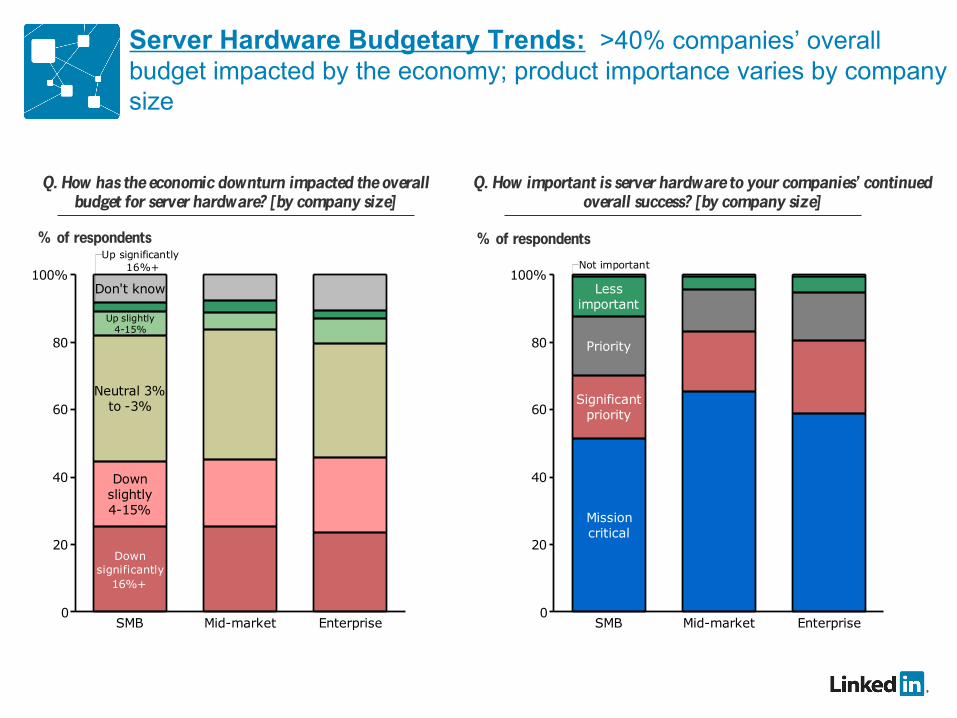
Q. How has the economic downturn impacted the overall budget for server hardware? [by company size]
0
20
40
60
80
100%
SMB
Don't know
Up slightly4-15%
Neutral 3%to -3%
Downslightly4-15%
Downsignificantly
16%+
Mid-market Enterprise
Up significantly16%+
0
20
40
60
80
100%
SMB
Lessimportant
Priority
Significantpriority
Missioncritical
Mid-market Enterprise
Not important
Q. How important is server hardware to your companies’ continued overall success? [by company size]
Server Hardware Budgetary Trends: >40% companies’ overall budget impacted by the economy; product importance varies by company size
% of respondents % of respondents

Q. On a scale from 1 to 5 what is your overall satisfaction with the following vendors for server hardware?
Q. Please indicate on a scale of 1 to 9 where 1:’Very poor’, 9: ‘Outstanding’, how you would rate the performance of the vendors
on the following for server hardware.
Server Hardware Vendor Perception: Dell has highest overall satisfaction rating as the leader in service/support and value while HP rating highest in quality
86%34%52%HP
33%
34%
33%
% somewhat satisfied
75%
77%
91%
Total
42%
43%
58%
%
very satisfied
Sun
IBM
Dell
7.3 / 9.07.3 / 9.07.7 / 9.0Averages
6.77.07.5Sun
6.97.27.4IBM
7.57.47.9HP
7.77.67.8Dell
ValueService and
support
Product quality

Q. How has the economic downturn impacted the overall budget for IT service providers? [by company size]
0
20
40
60
80
100%
SMB
Don't know
Up slightly4-15%
Neutral 3%to -3%
Downslightly4-15%
Downsignificantly
16%+
Mid-market Enterprise
Up significantly16%+
0
20
40
60
80
100%
SMB
Not important
Lessimportant
Priority
Significantpriority
Missioncritical
Mid-market Enterprise
Q. How important are IT service providers to your companies’ continued overall success? [by company size]
IT Service Provider Budgetary Trends: Economic downturn has higher impact on budget of IT service providers for larger companies; IT service providers viewed as less mission critical than other products
% of respondents % of respondents
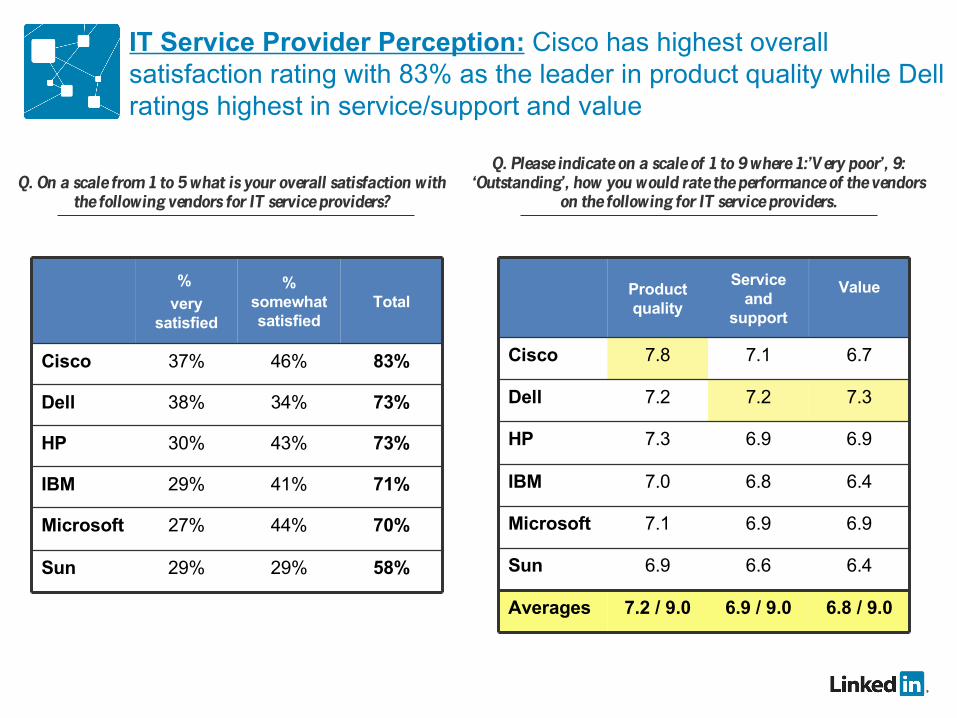
Q. On a scale from 1 to 5 what is your overall satisfaction with the following vendors for IT service providers?
Q. Please indicate on a scale of 1 to 9 where 1:’Very poor’, 9: ‘Outstanding’, how you would rate the performance of the vendors
on the following for IT service providers.
IT Service Provider Perception: Cisco has highest overall satisfaction rating with 83% as the leader in product quality while Dell ratings highest in service/support and value
70%44%27%Microsoft
73%34%38%Dell
29%
41%
43%
46%
% somewhat satisfied
58%
71%
73%
83%
Total
29%
29%
30%
37%
%
very satisfied
Sun
IBM
HP
Cisco
6.46.87.0IBM
6.46.66.9Sun
6.8 / 9.06.9 / 9.07.2 / 9.0Averages
6.96.97.1Microsoft
6.96.97.3HP
7.37.27.2Dell
6.77.17.8Cisco
ValueService and
support
Product quality

Q. How has the economic downturn impacted the overall budget for networking software? [by company size]
0
20
40
60
80
100%
SMB
Don't know
Up slightly4-15%
Neutral 3%to -3%
Downslightly4-15%
Downsignificantly
16%+
Mid-market Enterprise
Up significantly16%+
0
20
40
60
80
100%
SMB
Significantpriority
Missioncritical
Priority
Not important
Lessimportant
Mid-market Enterprise
Q. How important is networking software to your companies’ continued overall success? [by company size]
Networking Software Budgetary Trends: Economic downturn has significant negative impact on budget across all company sizes; networking software has higher importance for larger companies
% of respondents % of respondents
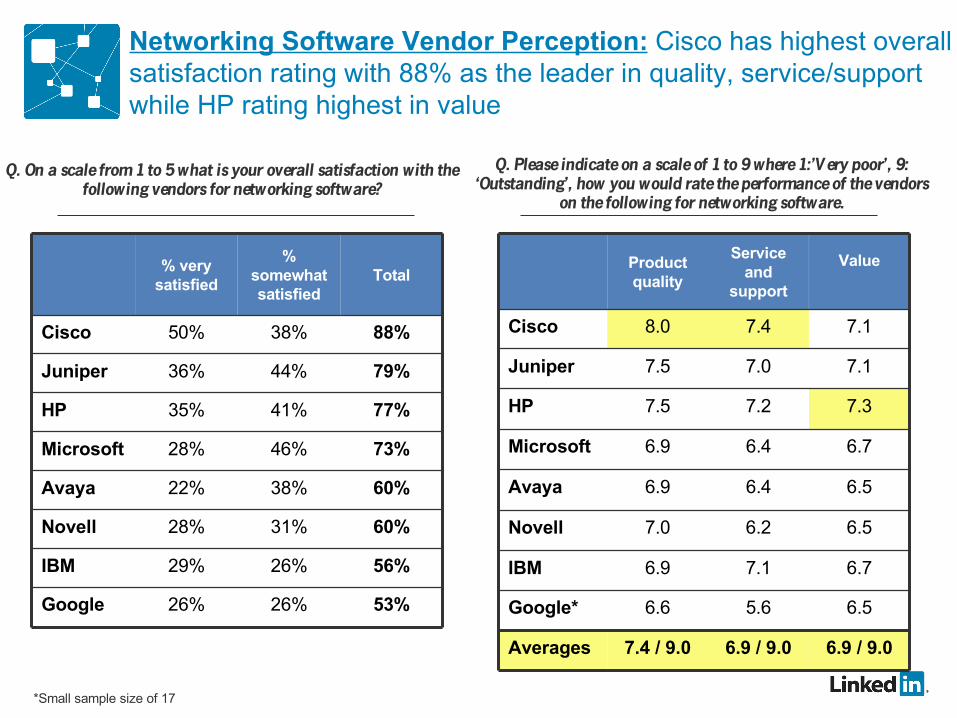
Q. On a scale from 1 to 5 what is your overall satisfaction with the following vendors for networking software?
Q. Please indicate on a scale of 1 to 9 where 1:’Very poor’, 9: ‘Outstanding’, how you would rate the performance of the vendors
on the following for networking software.
Networking Software Vendor Perception: Cisco has highest overall satisfaction rating with 88% as the leader in quality, service/support while HP rating highest in value
60%38%22%Avaya
73%46%28%Microsoft
77%41%35%HP
79%44%36%Juniper
26%
26%
31%
38%
% somewhat satisfied
53%
56%
60%
88%
Total
26%
29%
28%
50%
% very satisfied
IBM
Novell
Cisco
6.56.46.9Avaya
6.76.46.9Microsoft
7.37.27.5HP
6.55.66.6Google*
6.9 / 9.06.9 / 9.07.4 / 9.0Averages
6.77.16.9IBM
6.56.27.0Novell
7.17.07.5Juniper
7.17.48.0Cisco
ValueService and
support
Product quality
*Small sample size of 17

0
10
20
30
40%
<$40K $40K-$60K
$60K-$90K
$90K-$120K
$120K-$150K
$150K-$250K
$250K+
Q. What was your BASE annual compensation in 2009?
% of respondents
~70% IT respondents are compensated in the range of $60K-$120K in ’09
Q. What was your TOTAL annual compensation in 2009?
% of respondents
0
10
20
30
40%
<$40K $40K-$60K
$60K-$90K
$90K-$120K
$120K-$150K
$150K-$250K
$250K+
Average $89,000
Average $99,000
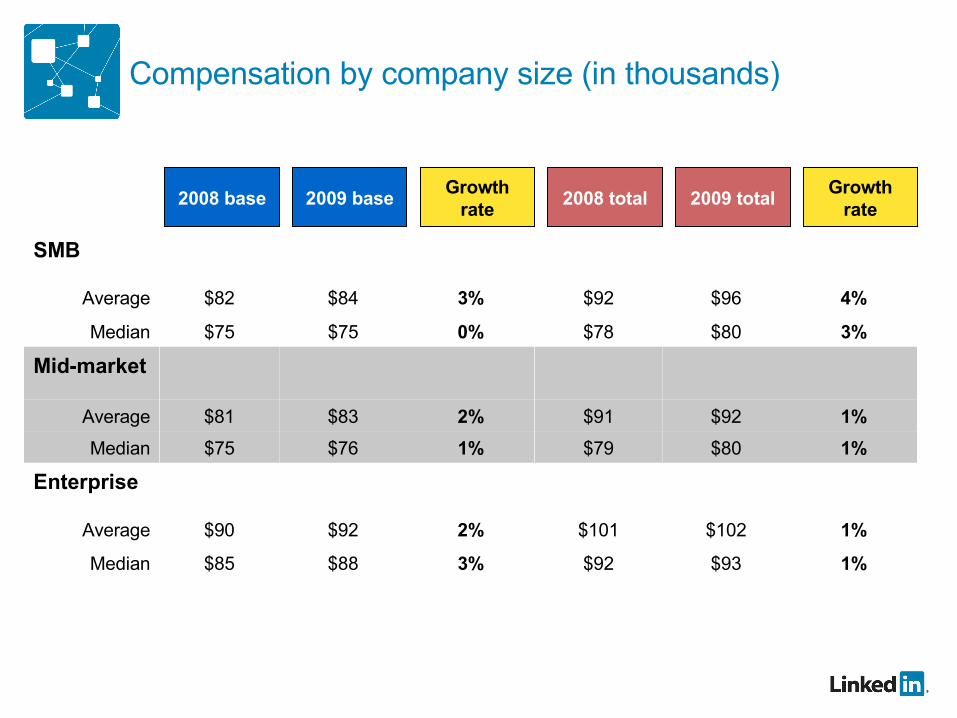
Compensation by company size (in thousands)
Enterprise
1%$102$1012%$92$90Average
Mid-market
1%$92$912%$83$81Average
4%$96$923%$84$82Average
SMB
1%
1%
3%
$93$923%$88$85Median
$80$791%$76$75Median
$80$780%$75$75Median
2008 base 2009 baseGrowth
rate2008 total 2009 total
Growth rate
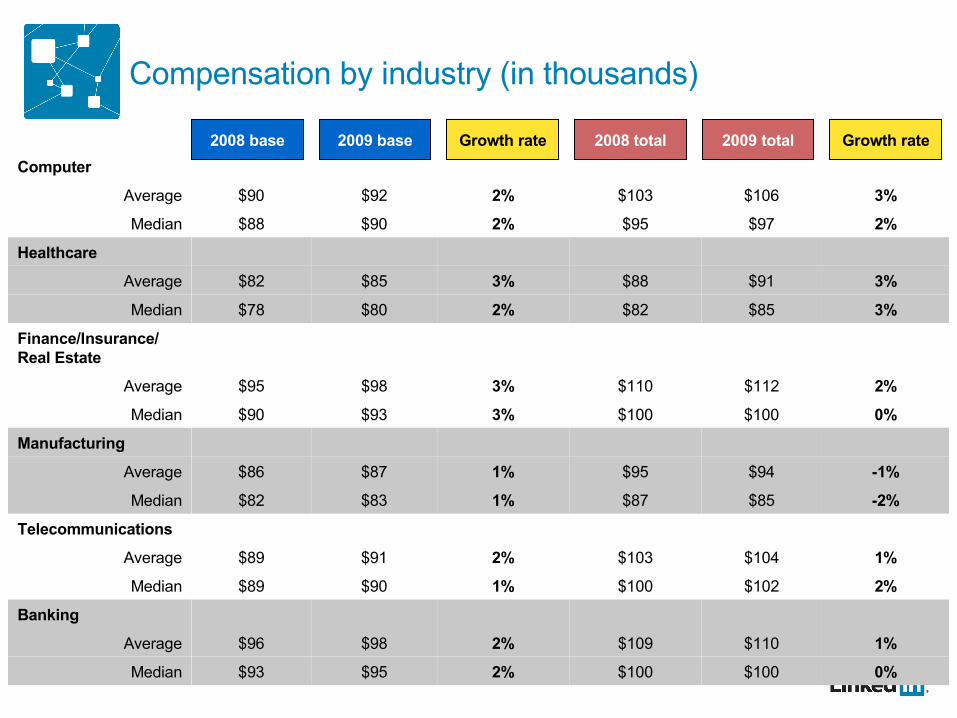
Compensation by industry (in thousands)
1%$110$1092%$98$96Average
Banking
1%$104$1032%$91$89Average
Telecommunications
-2%$85$871%$83$82Median
2%$102$1001%$90$89Median
-1%$94$951%$87$86Average
0%$100$1002%$95$93Median
Healthcare
2%$97$952%$90$88Median
3%$106$1032%$92$90Average
Computer
0%$100$1003%$93$90Median
2%$112$1103%$98$95Average
Finance/Insurance/ Real Estate
3%$85$822%$80$78Median
3%
Manufacturing
$91$883%$85$82Average
2008 base 2009 base Growth rate 2008 total 2009 total Growth rate

Compensation by metro area (in thousands)
Chicago
0%$94$94-1%$86$87Median
-1%$104$1052%$93$91Average
Boston
4%$105$101 3%$100 $97 Median
4%$116 $111 3%$106 $102 Average
Washington DC
2%$110$1082%$102$100Median
3%$121$1172%$106$104Average
San Francisco
0%$110$1102%$102$100Median
3%$123$1203%$108$104Average
2%$108$1063%$97$94Average
LA
4%$100$961%$91$90Median
2%$111$1092%$98$96Average
1%$96$952%$92$90Median
New York
2008 base 2009 base Growth rate 2008 total 2009 total Growth rate
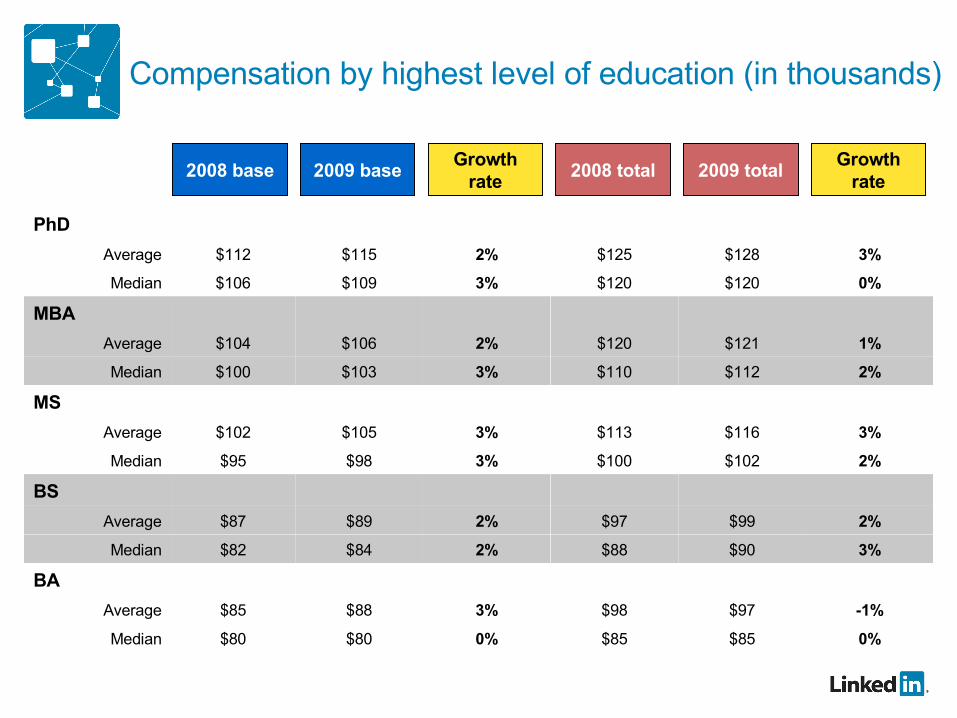
Compensation by highest level of education (in thousands)
2%$102$1003%$98$95Median
3%$116$1133%$105$102Average
MS
2%$112$1103%$103$100Median
1%$121$1202%$106$104Average
MBA
BA
-1%$97$983%$88$85Average
2%$99$972%$89$87Average
BS
0%$120$1203%$109$106Median
3%$128$1252%$115$112Average
0%
3%
$85$850%$80$80Median
$90$882%$84$82Median
PhD
2008 base 2009 baseGrowth
rate2008 total 2009 total
Growth rate

Compensation by field of study of highest education level (in thousands)
1%$92$910%$85$85Median
0%$103$1032%$91$89Average
Business
2%$83$814%$78$75Median
2%$91$892%$83$81Average
Information Sci. & Technology
Business mgmt & Admin.
3%$107$1033%$97$94Average
2%$108$1062%$96$94Average
Electrical Engineering
2%$93$913%$90$87Median
3%$104$1013%$93$91Average
1%
-2%
$96$950%$88$88Median
$95$970%$95$95Median
Computer Sci.
2008 base 2009 baseGrowth
rate2008 total 2009 total
Growth rate
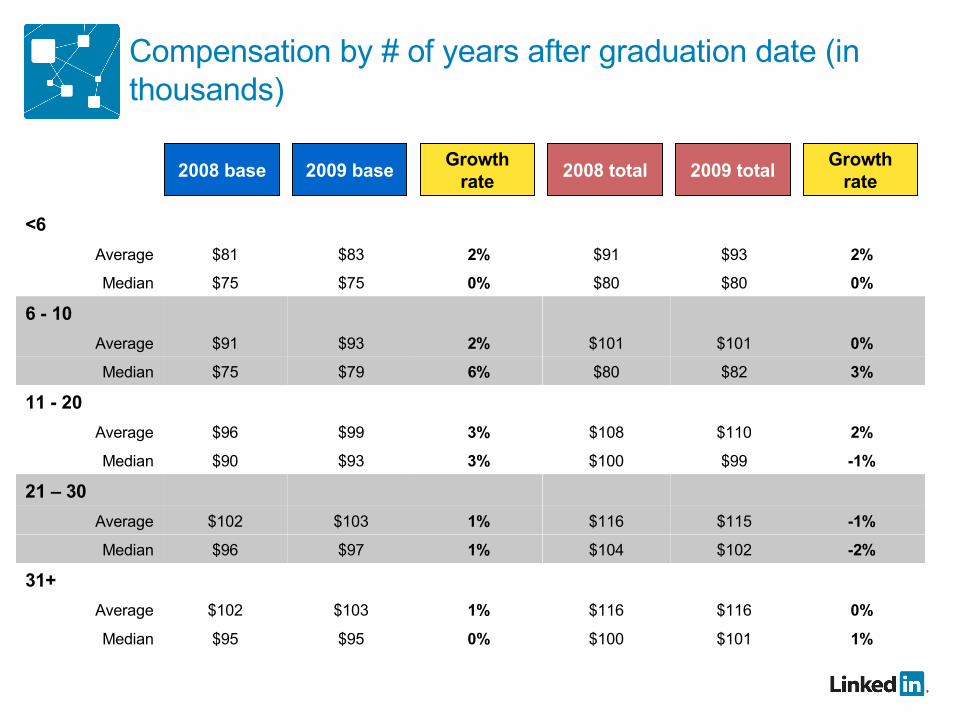
Compensation by # of years after graduation date (in thousands)
-1%$99$1003%$93$90Median
2%$110$1083%$99$96Average
11 - 20
3%$82$806%$79$75Median
0%$101$1012%$93$91Average
6 - 10
31+
0%$116$1161%$103$102Average
-1%$115$1161%$103$102Average
21 – 30
0%$80$800%$75$75Median
2%$93$912%$83$81Average
1%
-2%
$101$1000%$95$95Median
$102$1041%$97$96Median
<6
2008 base 2009 baseGrowth
rate2008 total 2009 total
Growth rate

Compensation by most mentioned titles (averages in thousands)
1%$112$1111%$102$101System architect
3%$76$743%$71$69System analyst
2%$68$673%$65$63System administrator
0%$104$1033%$95$91Senior system engineer
0%$88$882%$83$81Senior system analyst
2%$87$853%$83$80Senior system administrator
0%$94$941%$89$88Project manager
0%$85$850%$79$78Network engineer
1%$98$962%$90$88Technology manager
3%$168$1633%$138$134Vice president
2%$114$1133%$106$103Technical director
4%$94$914%$84$81System engineer
-3%$119$1233%$109$106Information system director
1%$149$1472%$122$119Director
4%$102$984%$92$88Technology director
2%$97$951%$90$89Technical leader
3%$168$1623%$143$138Chief technology officer
1%$86$862%$80$79Business system analyst
2008 base 2009 base Growth rate 2008 total 2009 total Growth rate
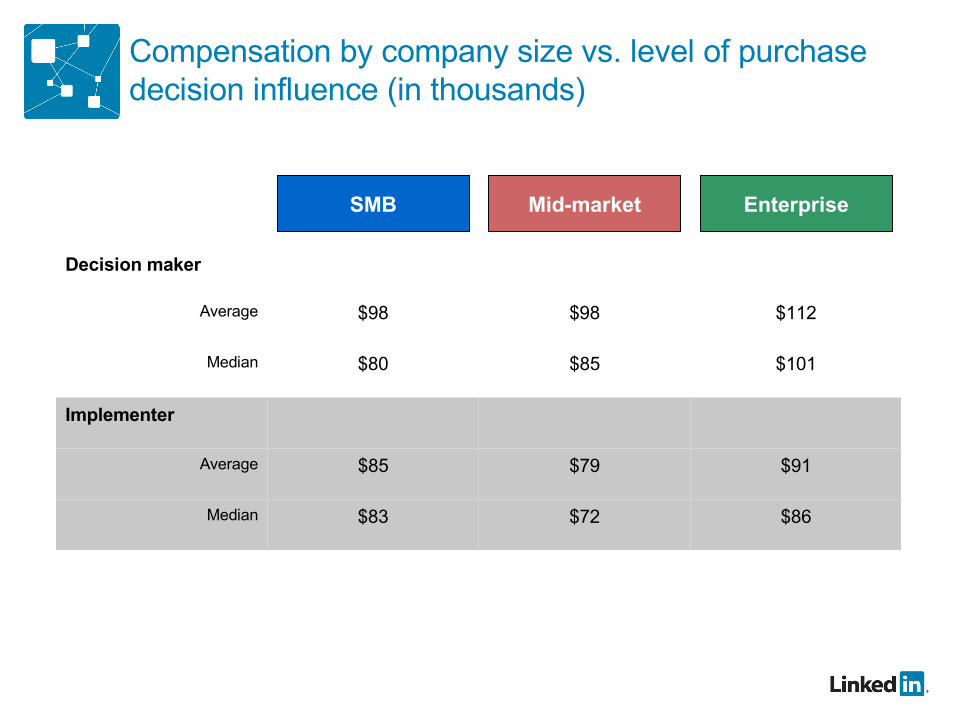
Compensation by company size vs. level of purchase decision influence (in thousands)
Implementer
$101$85$80Median
$112$98$98Average
$91$79$85Average
$86$72$83Median
Decision maker
SMB Mid-market Enterprise
0 20 40 60 80 100%
Microsoft Expression Design or Media
Microsoft Expression Media or Web Media
Oracle/BI
SAP/Business Objects
Google Talk
Yahoo Messenger
Google Docs
Microsoft Live Meeting
Adobe
Microsoft Sharepoint
Microsoft Project
WebEx
Microsoft Outlook
Microsoft Powerpoint
Microsoft Word
Microsoft Excel
% of respondents (n=836)
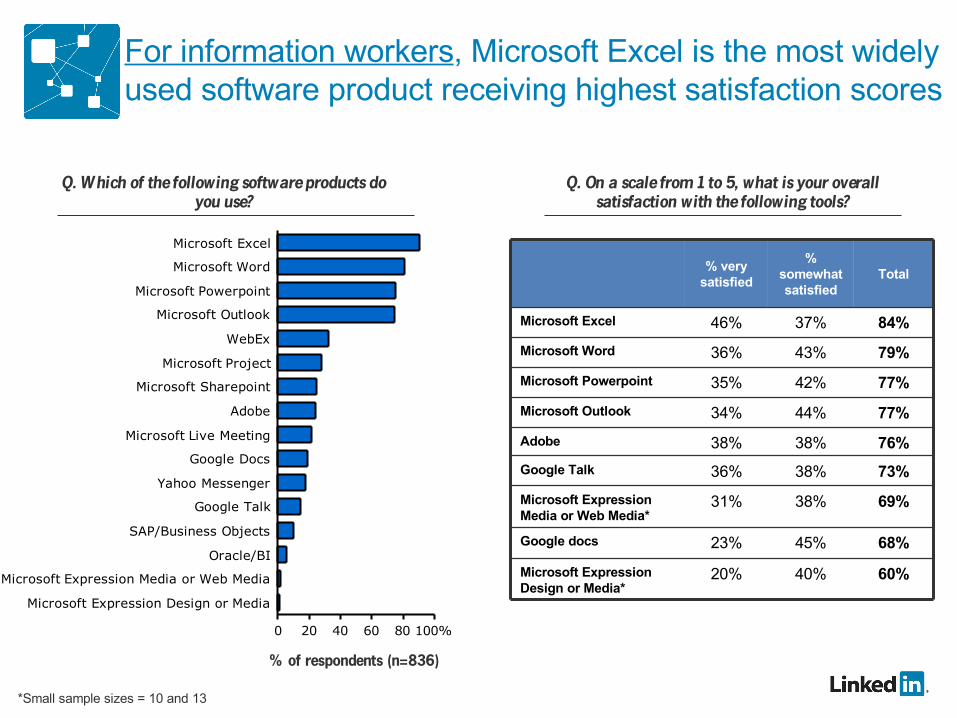
For information workers, Microsoft Excel is the most widely used software product receiving highest satisfaction scores
68%45%23%Google docs
73%38%36%Google Talk
79%43%36%Microsoft Word
77%42%35%Microsoft Powerpoint
77%44%34%Microsoft Outlook
84%37%46%Microsoft Excel
40%
38%
38%
% somewhat satisfied
60%
69%
76%
Total
20%
31%
38%
% very satisfied
Microsoft Expression Design or Media*
Microsoft Expression Media or Web Media*
Adobe
Q. Which of the following software products do you use?
Q. On a scale from 1 to 5, what is your overall satisfaction with the following tools?
*Small sample sizes = 10 and 13
0 20 40 60%
NetBeans
Any version of Visual C++
IBM or IBM Rational
Other Microsoft development tool
Any version of Visual Basic
Apple
Sun
PHP
Any version of Visual C#
Other Java development tools
Eclipse
Oracle
.NET
Any version of Visual Studio
Other Open Source dev. tools
Adobe
Microsoft
% of respondents (n=1353)
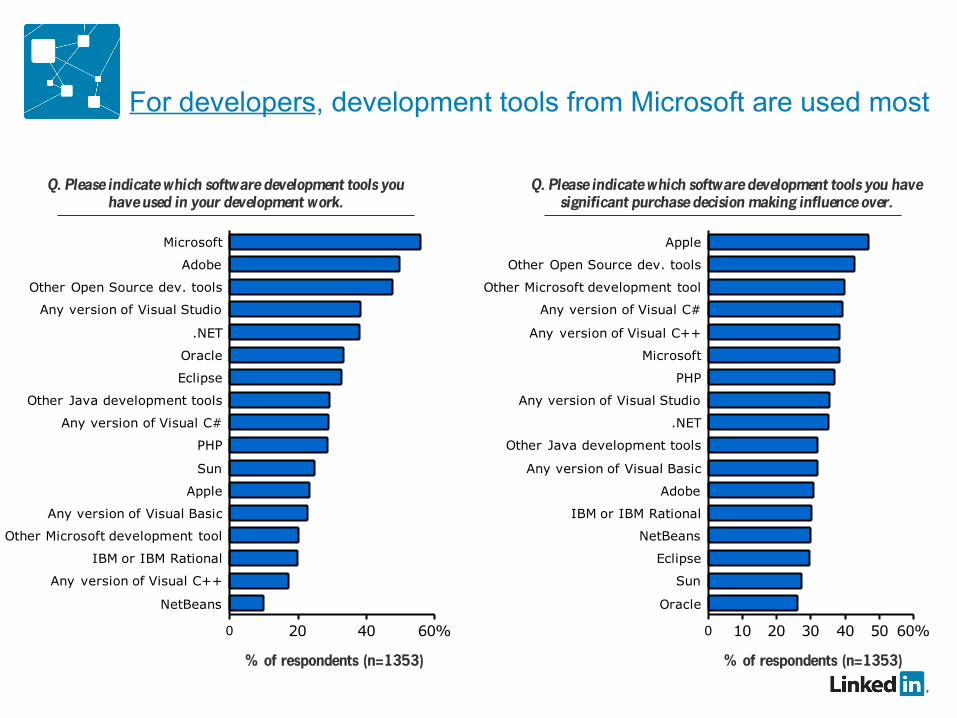
For developers, development tools from Microsoft are used most
Q. Please indicate which software development tools you have used in your development work.
Q. Please indicate which software development tools you have significant purchase decision making influence over.
0 10 20 30 40 50 60%
Oracle
Sun
Eclipse
NetBeans
IBM or IBM Rational
Adobe
Any version of Visual Basic
Other Java development tools
.NET
Any version of Visual Studio
PHP
Microsoft
Any version of Visual C++
Any version of Visual C#
Other Microsoft development tool
Other Open Source dev. tools
Apple
% of respondents (n=1353)
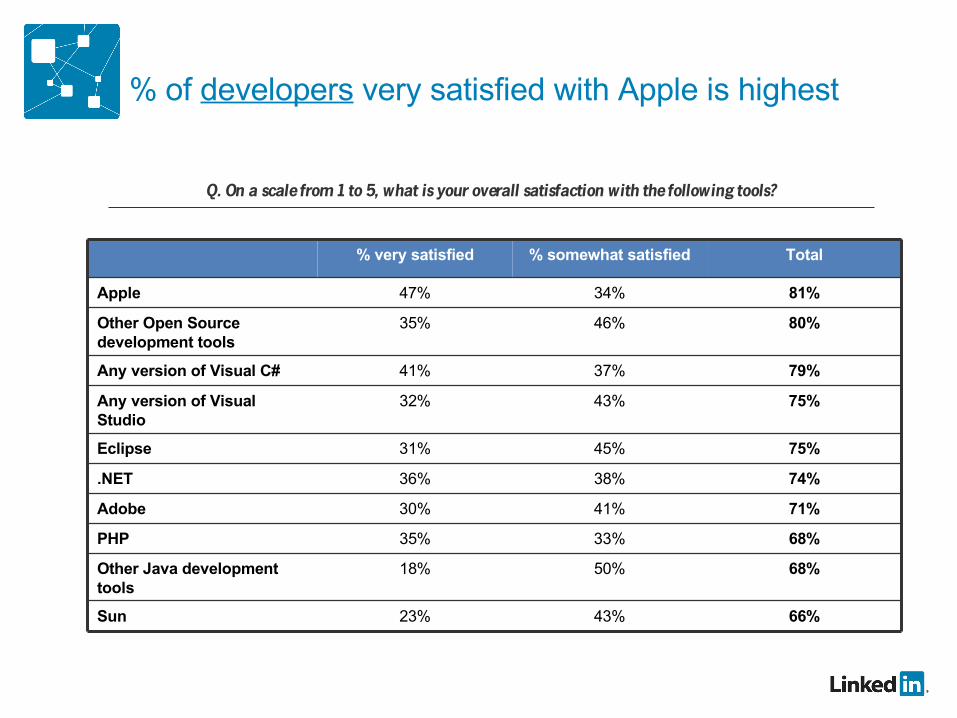
% of developers very satisfied with Apple is highest
68%33%35%PHP
71%41%30%Adobe
79%37%41%Any version of Visual C#
75%43%32%Any version of Visual Studio
75%45%31%Eclipse
80%46%35%Other Open Source development tools
43%
50%
38%
34%
% somewhat satisfied
66%
68%
74%
81%
Total
23%
18%
36%
47%
% very satisfied
Sun
Other Java development tools
.NET
Apple
Q. On a scale from 1 to 5, what is your overall satisfaction with the following tools?
Recommended