Lesson Describing Patterns in Data
Chapter 6
6-7AVocabularylinear association
positive association
negative association
nonlinear association
outlier BIG IDEA Some patterns in numerical data can be seen by using a scatterplot.
Linear AssociationsScatterplots can be used to investigate patterns of association between two quantities. When the data points are close to being linear, the data represent a linear association. The more the data points tend to cluster around the line of best fi t (whether the line of best fi t is drawn or not), the stronger the relationship between the two variables. The graphs below both show a strong linear association. In contrast, the graph at the right shows a weak linear association because the data points do not tend to cluster very close to the line of best fi t.
The two scatterplots below were in Lesson 6-7. The scatterplot below left appeared in Activity 1. In general, as the last 100 years have progressed (increasing values of x), life expectancies tended to increase (increasing values of y). Question 5 asked you to make the scatterplot below right. Notice that in later years (increasing values of x), the world record swimming times decrease (decreasing values of y).
x
y
Life
Exp
ecta
ncy
(yr
)
Year
(1990, 76)
1920193019401950196019701980199020002010
85
80
75
70
65
60
55
0
(1930, 61)
Patterns of association between two variables can be categorized as follows:
There is a positive association when greater values of one variable tend to be associated with greater values of the other variable. The graph of life expectancy above shows a positive association. The line of best fi t has a positive slope.
•
x
y
x
y
x
y
Tim
e to
sw
im 8
00 m
(m
in)
Year1971
1973
1975
1977
1979
9
8.9
8.8
8.7
8.6
8.5
8.4
0x
y
Tim
e to
sw
im 8
00 m
(m
in)
Year1971
1973
1975
1977
1979
9
8.9
8.8
8.7
8.6
8.5
8.4
0
1 Slopes and Lines

Lesson 6-7A
There is a negative association when greater values of one variable tend to be accompanied by lesser values of the other variable. The graph of world swimming records on the previous page shows a negative association. The line of best fi t would have a negative slope.
Sometimes the values of one variable are not associated with values of the other variable. When the data points in a scatterplot show no pattern, there is no association.
Airfares for Roundtrips Originating from Chicago
Ro
un
dtr
ip d
ista
nce
(m
iles)
Airfare ($)100
200300
500400
6000
500
1000
1500
2000
2500
3000
3500
Albuquerque
Indianapolis
Ft. Lauderdale
Phoenix
Vail, CO
Milwaukee
DubuqueKalamazoo
TorontoOmaha
SavannahBirmingham
New YorkTulsa Atlanta
Springfield, IL
Sioux City
Martha’s Vineyard
San Diego Seattle
4000
SMP_SE_C06_L07A_T_004.ai
The scatterplot above shows selected airfares for roundtrips originating from Chicago. There seems to be no pattern between the distance traveled and the airfare. Therefore, there is no association between the variables.
QY1
Nonlinear AssociationsSometimes the data in a scatterplot show a pattern that is not linear. The graph at the right shows a nonlinear association because the relationship between the variables is better modeled by a curve than a line. The graph shows the average processing speed of a computer (measured in megahertz) and the year it was made. You will be analyzing this graph and others similar to it in Lesson 7-4.
•
Source: http://www.farecompare.com/maps/myAirportCategoryMap.html?departure=CHI&category=Domestic&sort=nameSource: http://www.farecompare.com/maps/myAirportCategoryMap.html?departure=CHI&category=Domestic&sort=name
50
0
100
150
200
250
300
350
400
450
1976197819801982198419861988199019921994199619982000
Sp
eed
(M
Hz)
Year
y
x50
0
100
150
200
250
300
350
400
450
1976197819801982198419861988199019921994199619982000
Sp
eed
(M
Hz)
Year
y
x
Source: Microprocessor Quick Reference GuideSource: Microprocessor Quick Reference Guide
QY1
For each scatterplot, tell whether there is a positive association, a negative association, or no association. If there is an association, tell if the association is strong or weak.
a. y
x
b. y
x
c. y
x
Describing Patterns in Data 2

Chapter 6
QY2
OutliersA scatterplot not only provides information about a possible relationship between two variables, but it also can show if there are any data points that appear to fall outside the overall pattern of data. Such a data point is called an outlier. You can use visual inspection to determine an outlier from a scatterplot.
In the scatterplot at the right, the data point located at about (36, 0.20) is an outlier because it has a very high quality rating compared to other brands at a similar price.
QY3
Examplea. Make a scatterplot based on the data below. Graph Production along the
x-axis and graph Consumption along the y-axis.
2009 Daily Oil Production Versus Daily Oil Consumption
Production(millions of barrels)
Consumption(millions of barrels)
Country
4.172 1.809 Iran3.289 2.511 Canada3.001 2.078 Mexico2.798 0.435 United Arab Emirates2.572 2.640 Brazil2.472 0.740 Venezuela2.399 0.687 Iraq0.133 4.363 Japan0.879 2.980 India1.502 1.699 United Kingdom
b. Categorize the association between the variables as positive association, negative association, or no association.
c. If there is an association, is it strong or is it weak? Explain.
y
x
Quality Versus Price forVarious Brands of Ice-cream
Pric
e ($
per
flu
id o
un
ce)
0.200.10
0
0.300.40
0.600.50
0.700.800.901.00
1.201.10
1.301.401.50
Quality Rating10 4020 30 50
y
x
Quality Versus Price forVarious Brands of Ice-cream
Pric
e ($
per
flu
id o
un
ce)
0.200.10
0
0.300.40
0.600.50
0.700.800.901.00
1.201.10
1.301.401.50
Quality Rating10 4020 30 50
GUIDEDGUIDED
QY2
For each scatterplot, tell whether there is a linear association, a nonlinear association, or no association.
a. y
x
b. y
x
c. y
x
QY3
In the graph about ice-cream ratings, the data point (50, 1.40) has much greater x- and y-values than the other data points. Why is it not an outlier?
3 Slopes and Lines

Lesson 6-7A
d. Now graph the following additional data points in your scatterplot.
2009 Daily Oil Production Versus Daily Oil Consumption
Production(millions of barrels)
Consumption(millions of barrels)
Country
9.932 2.85 Russia9.764 2.43 Saudi Arabia9.056 18.69 United States2.383 13.68 European Union
e. Explain how these additional data points affect your answers to Parts b and c.
Solution
a. The scatterplot is shown at the right.
b. Greater values of x tend to be associated with ? values of y, so there is (a) ? association.
c. The data points are ? around the line of best � t, so this is a ? association.
d. Graph the four additional data points on your graph.
e. Describe what has happened to the pattern of data points.
QuestionsCOVERING THE IDEAS
In 1–4, Fill in the Blank 1. When greater values of one variable tend to be associated with
lesser values of the other variable, there is a ? association.
2. When greater values of one variable tend to be associated with greater values of the other variable, there is a ? association.
3. When the data points in a linear association cluster tightly around the line of best fi t, there is a ? association.
4. When there is a positive association, the line of best fi t has a ? slope.
5. Explain why there is no association between the two variables in the graph “Airfares for Roundtrips Originating from Chicago” in the lesson.
6. Refer to the graph of average computer processing speed. a. Find the approximate rate of speed increase from 1976 to 1988. b. Repeat Part a for the years from 1996 to 2000. c. What do your answers from Parts a and b indicate about the
relationship between year and computer clock speed?
2009 Daily Oil Production Versus Daily Oil Consumption
Co
nsu
mp
tio
n (
mill
ion
s o
f b
arre
ls)
Production (millions of barrels)
00 1 2 3 4 5 6 7 8 9 10
4
6
12
16
20
Japan
UK
India
Venezuela
Mexico
Iran
Canada
UAE
Brazil
Iraq
Describing Patterns in Data 4
Chapter 6
7. Refer to the graph you made of oil production versus consumption. Name four outliers and explain why they can be classifi ed as such.
8. For each scatterplot, tell if there is a linear association, a nonlinear association, or no association. If there is a linear association, tell if it is positive or negative, and if it is strong or weak.a.
SMP08ALG_SE_C07_T_0105
y
x
b.
SMP08ALG_SE_C07_T_0103
y
x
c. d.
9. True or False a. The x- and y -values of an outlier’s coordinates are both much
greater than those of the other data points. b. The x- and y -values of an outlier’s coordinates are both much
less than those of the other data points. c. The data point of an outlier does not fi t the overall pattern of the
other data points in the distribution.
APPLYING THE MATHEMATICS
10. Refer to the scatterplot of “Airfares for Roundtrips Originating from Chicago” in the lesson.
a. Which destination provides the most miles for the least airfare? b. Which destination provides the fewest miles for the
greatest airfare?
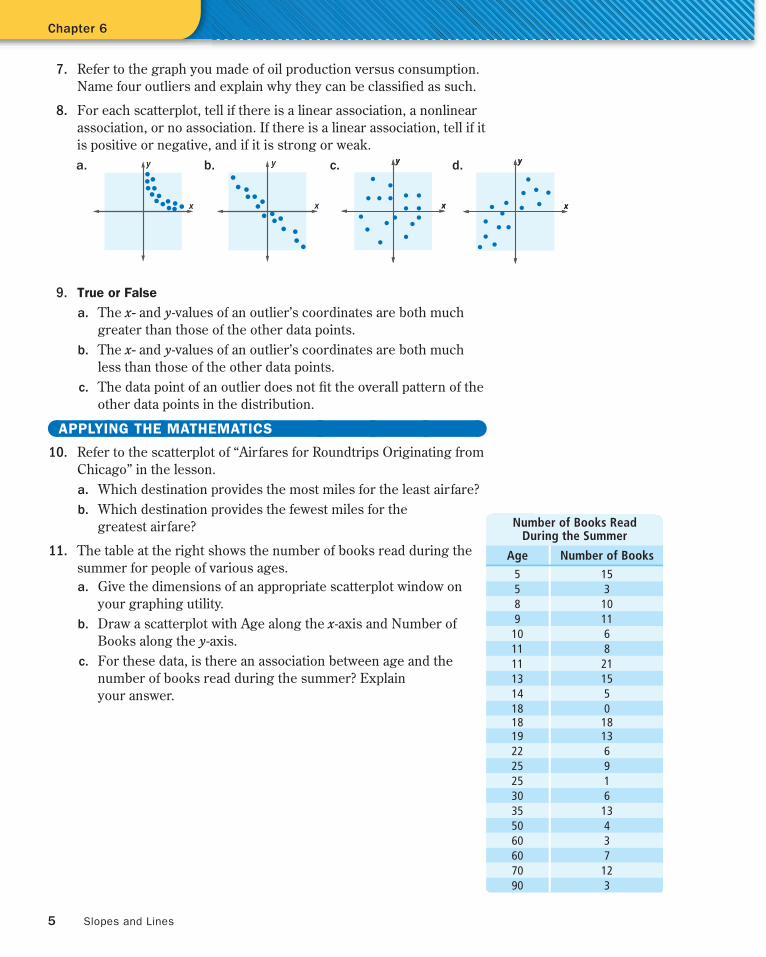
11. The table at the right shows the number of books read during the summer for people of various ages.a. Give the dimensions of an appropriate scatterplot window on
your graphing utility.b. Draw a scatterplot with Age along the x-axis and Number of
Books along the y -axis. c. For these data, is there an association between age and the
number of books read during the summer? Explain your answer.
SMP08ALG_SE_C06_T_0085
y
x
SMP08ALG_SE_C06_T_0085
y
x
SMP08ALG_SE_C06_T_0084
y
x
SMP08ALG_SE_C06_T_0084
y
x
Number of Books Read During the Summer
Age Number of Books5 155 38 109 11
10 611 811 2113 1514 518 018 1819 1322 625 925 130 635 1350 460 360 770 1290 3
5 Slopes and Lines

Lesson 6-7A
12. Use a graphing utility to make a scatterplot based on the Expected Life Span data at the right. Is the association linear, nonlinear, or is there no association?
13. A student was asked to estimate the number of calories in one serving of some of her favorite foods. Then the student was asked to research the actual number of calories in those foods. The results are shown in the table below.
Food Calories
Student Estimate Actual
Apple juice 120 115
Bacon 385 110
Beef, ground 160 230
Blueberry pie 800 380
Cheese pizza 230 290
Chicken, fried drumstick 200 195
Chocolate chip cookie 150 185
Corn fl akes 85 110
Egg, poached 100 75
Kiwi 60 45
Low-fat yogurt 90 145
Margarine 70 100
Marshmallows 20 90
Peach 50 35
Pecan halves 115 720
Potato chips 115 105
Provolone cheese 85 100
Red salmon, baked 195 140
Spinach, raw 75 10
Waffl e, home recipe 130 245
Wheat fl our, sifted 40 420
White bread 145 65
a. Make a scatterplot for the data. Graph “Estimated Calories” along the x-axis; graph “Actual Calories” along the y -axis.
b. Categorize the association between the variables as positive association, negative association, or no association.
c. If there is an association, is it strong or is it weak? Explain.d. Give the approximate ordered pairs of any outliers.
Current Age
Expected Life Span
1 78.410 78.520 78.830 79.340 79.950 80.960 82.570 85.180 89.1
QY ANSWERS
1. a. No association
b. Strong negative association
c. Weak positive association
2. a. Nonlinear association
b. No association
c. Linear association
3. Even though (50, 1.40) is far away from other points, it still follows the overall pattern of the data.
Source: World Almanac and Book of Facts, 2008
Describing Patterns in Data 6
Recommended