Copyright 2009 © CoreMedia
Lead with Leading IndicatorsLead with Leading IndicatorsEstablishing a Culture of Safety Excellence
Oregon Governor's
ver.2.0
gOccupational Safety & Health ConferencePortland | 2009
PURPOSEIntroduce leading indicator concepts that will transition you toward a “zero incidents” safety cultureChallenge you to engage in these new technologies
P.O.P.
Challenge you to engage in these new technologies
slide 2Copyright 2009 © CoreMedia

Copyright 2009 © CoreMedia
TO YOUR ORGANIZATION?WHAT IS IMPORTANT
Lagging IndicatorsInjury statistics that you react to
Safety Performance Indicators
Leading IndicatorsProactive indicators of what you’re doing to eliminate incidents and injuries
slide 4Copyright 2009 © CoreMedia
Copyright 2009 © CoreMedia
IMPORTANTMODELS
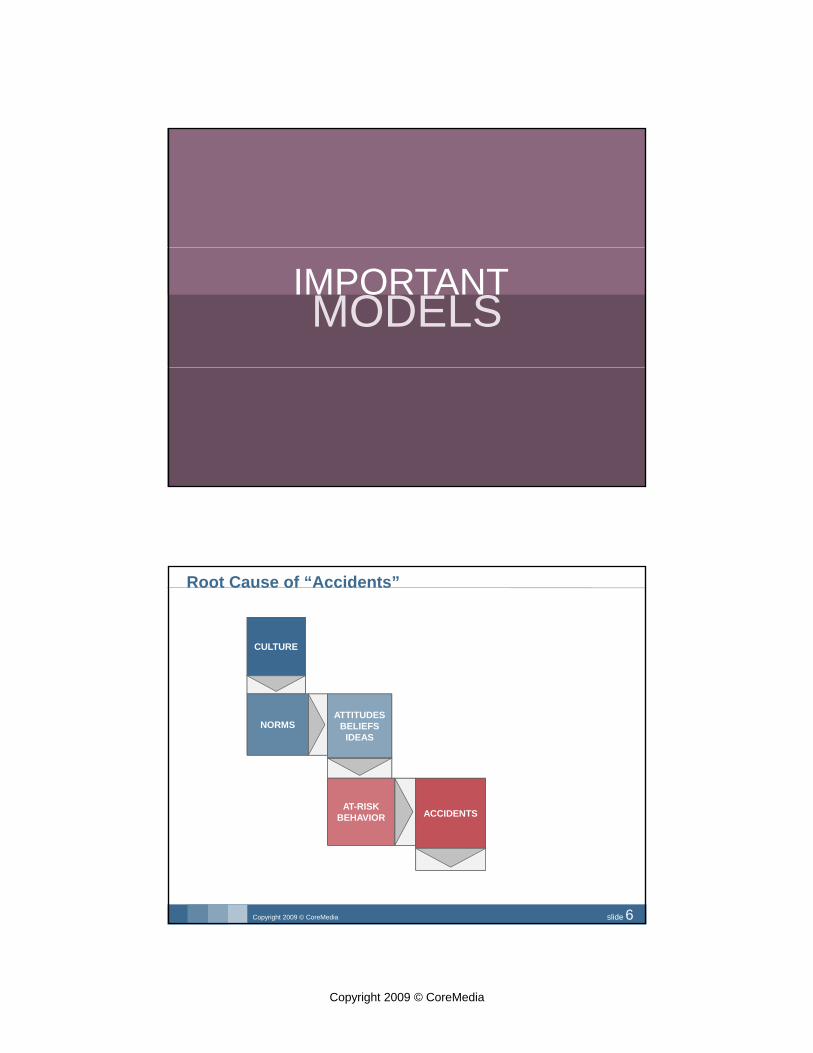
Root Cause of “Accidents”
CULTURECULTURE
NORMSNORMSATTITUDES
BELIEFSIDEAS
ATTITUDESBELIEFS
IDEAS
AT RISKAT RISKAT-RISKBEHAVIOR
AT-RISKBEHAVIOR ACCIDENTSACCIDENTS
slide 6Copyright 2009 © CoreMedia

Copyright 2009 © CoreMedia
Incident Reaction Cycle
Safety incident occurs . . . Management perceives too many or too severe injuries.
Operation goes back to “business as usual.”
Increased safety activities . . . Injuries go down.
slide 7Copyright 2009 © CoreMedia
The Heinrich Triangle
RESULT
FATALITYFATALITYFATALITYFATALITY
SEVERE SEVERE INJURYINJURY
MINOR INJURYMINOR INJURY
BEHAVIOR
LEADERSHIPACTION
UNSAFE ACTS & UNSAFE ACTS & CONDITIONSCONDITIONS
INVESTIGATIONINVESTIGATION
DISCIPLINEDISCIPLINE
ACCOUNTABILITYACCOUNTABILITY
ACTIONCOMMUNICATIONCOMMUNICATION
RECOGNITIONRECOGNITION
SUPERVISOR PERFORMANCESUPERVISOR PERFORMANCE
slide 8Copyright 2009 © CoreMedia

Copyright 2009 © CoreMedia
Safety Perception Survey 21 Safety Management ProcessesIncident Investigation Alcohol & Drug AbuseAttitude Towards SafetyAwareness ProgramsC i ti
Involvement of EmployeesManagement CredibilityNew EmployeesOperating Procedures
CommunicationDisciplineEmployee TrainingGoals of Safety PerformanceHazard CorrectionInspections
Quality of SupervisionRecognition for PerformanceSafety ClimateSafety ContactsStressSupervisor TrainingSupervisor TrainingSupport for Safety
slide 9Copyright 2009 © CoreMedia
Top management is visibly committedMiddle management is actively involvedSupervision is performance-focusedHourly employees are actively participatingS t i fl ibl t d t it lt
Six Criteria for Safety Excellence
System is flexible to accommodate site cultureSafety system is positively perceived by workforce
― Dan Petersen, Ed.D.
slide 10Copyright 2009 © CoreMedia

Copyright 2009 © CoreMedia
Level One Tools – Reacting | 10 to 20 TRIR, 5 LTIRCompliance Programs, Work Orders, Incident Investigation, Safety Meetings
Level Two Tools – What We See | 3 to 9 TRIR, 1 LTIRObservation Programs, Job Safety Analysis, Near-Miss Reporting, Inspections
Level Three Tools – What We Do | 1 to 2 TRIR 0 1 LTIR
What makes a difference in safety?
Level Three Tools – What We Do | 1 to 2 TRIR, 0.1 LTIRSafety Accountability Systems
Level Four Tools – What We Believe | 0.5 to 0.9 TRIR, 0 LTIRUnseen cultural reality
Level Five Tools – How We Engage | 0.2 to 0.4 TRIR, 0 LTIREffective data-driven safety teams
Level Six Tools – How We Lead | Less than 0.2 TRIR, 0 LTIRCulture in action: participation, ownership, execution, live a passion for safety excellence
slide 11Copyright 2009 © CoreMedia
Compliance Programs (OSHA, DOT, etc.)A passion for foundational perfectionA culture of correct
Safety Culture Training with executive involvementPPE Proced res e pectations
“Level 1” Leading Indicators
PPE, Procedures, expectations
Work OrdersFocus on conditions (5% of all injuries), but dangerous trapsA safety work order system that has a well managed backlog
Incident InvestigationPOP & AIM team with closure tracking for every incidentPost Injury Management excellence
slide 12Copyright 2009 © CoreMedia

Copyright 2009 © CoreMedia
Department Lost Time | Injuries Last 10 Periods
slide 13Copyright 2009 © CoreMedia
Process to Erect a Case
Reach for new case – twist
bodyVisually inspect
case – No good, throw out
Throw case
Unfold case
Apply labelPack case
Fold case
Apply label
Build caseReach and
place case on stand
Pack case
slide 14Copyright 2009 © CoreMedia

Copyright 2009 © CoreMedia
Packer Cause & Effect
slide 15Copyright 2009 © CoreMedia
Continuous Improvement Team – Action Item Matrix
TEAM: Packer Safety Improvement Date: 11/30Members: John, Sam, Steve, Dimitri, Sharon, BobITEM ACTION ITEM WHO DATE COMMENTS
1 Hire ergonomist to study and make recommendations
John 12/10 M. Ayub, J.L. Sangre, K State, UT,
2 Get EE’s to develop training program Sam 3/3
3 Retain doctor to develop physical requirements of job
Steve 3/3
4 Improve case sorting prior to use John & packers
12/2
5 Change supervision rotation program from 6 months to 1 year
Sharon 2/6
6 Improve mechanical reliability of packaging Bob 12/8machines
7 Work with EE’s to develop warm up program Dimitri 1/15
slide 16Copyright 2009 © CoreMedia

Copyright 2009 © CoreMedia
Job Safety Analysis (SOP’s, Pre-Op’s)Workface teams develop, train and use
Job Safety BriefingsGiven at workface by employees as conditions dictate
“Level 2” Leading Indicators
Near-Miss ReportingSerious training in a near miss culture at the crew level
Number done per crew per weekNumber solved per crew per weekAction Item Matrix for Red and Yellow Near MissesA recognition system that reinforces intense participation
Workface AuditsWorkface AuditsIncludes both conditions and accountability activitiesHas hourly, supervision and management participation
slide 17Copyright 2009 © CoreMedia
Purpose Improve safety culture by involving all employees in reporting, analyzing and communicating lessons learned from NMR.Outcomes (deliverables) for this team are:
Define accountabilities of each processDetermine measures for each
Near-Miss Kaizen Team (an example)
Determine measures for eachDetermine rewards and/or recognition methodsFlexibility – Six CriteriaDetermine (establish?) training needsForms – KISSMinimize paperConsider communicationImplementation Plan
Process (by which this will be accomplished):Safety Kaizen to be completed in three (3) days or lessTest model in a pilot work group Rollout to entire region
slide 18Copyright 2009 © CoreMedia

Copyright 2009 © CoreMedia
Fishbone: Near Miss Reports
INADEQUATE NEAR MISS REPORTING
slide 19Copyright 2009 © CoreMedia
Defining What is Expected:Employee – Report to Lead, Scheduler or manager any recognized near miss and complete form, including suggested corrective actions.Leads Same as Employee Plus interview with employee to
The Solution
Leads – Same as Employee. Plus interview with employee to determine RED, YELLOW, GREEN and actions taken. Help if needed . Lead daily “bucket meeting” to communicate safety.Scheduler – Same as Employee, same as Lead. Coordinate root analysis on REDS, “Follow-up”, tracks corrective actions generated on all NMR reports.Managers – Same as Employee, Lead, Scheduler. Backup Leads on daily start of day “bucket meeting” to communicate safetydaily, start of day bucket meeting to communicate safety. Communicate numbers, status, provide recognition, NMR, behavior observations, inspection issues.
slide 20Copyright 2009 © CoreMedia

Copyright 2009 © CoreMedia
Training to Enable Success:Four hour course close to initial hireAll personnel included
The Solution
Mix of hourly and management personnelInclude:
Company definition of near missesLocation of forms (plus request for suggestions)Practice use of forms and reporting of actual incident to “test the waters”Communicate number of near misses and where they occurLeadership as influence at the peer levelLeadership as influence at the peer level
Additional four-hour course on Speak Up! and Listen Up!
slide 21Copyright 2009 © CoreMedia
Measuring:Measure the number reported by department/storeMeasure the number reported per 10,000 exposure-hours
The Solution
Track and report daily, post for high visibilityRecognize reports by crewCorrelate Near Miss Reporting/safety activities with better production, quality, costs, as well as fewer first aid cases
“THE MINIMUM LEVEL OF EXPECTATIONBECOMES THE MAXIMUM LEVEL OF PERFORMANCE ”BECOMES THE MAXIMUM LEVEL OF PERFORMANCE.
slide 22Copyright 2009 © CoreMedia

Copyright 2009 © CoreMedia
• Total # of Accidents2
• LTA1
• TRIR3
Activity Tracking – October 2008 | Albuquerque
YTD NMR173
GOAL FOR YEAR NMR600
3
173
• Red - 42• Yellow - 102• Green - 39• Total no. Near Miss Reporting
98 % of Actions Closed
Inspections
JAN. FEB.. MARCH APRIL JUNE JULY AUG. SEPT. OCT. NOV. DEC. YTD
NMR 0 0 0 0 0 0 0 134 39 0 0 173
p
Week 1 Week 2 Week 3 Week 4 Week 5
C C C C C
Safety Meeting
Meet 1 Meet 2 Meet 3
C C C
slide 23Copyright 2009 © CoreMedia
Reward and RecognitionReward the activity, not the outcomeCrew of the Month
The Solution
Early-out dailyDesirable parking spotsRecognition lunches
Success largely in control of the crewVisibility of performanceThe literal sign of the times
slide 24Copyright 2009 © CoreMedia

Copyright 2009 © CoreMedia
A Power Plant Construction SiteThe Results
TRIR = 0.68Fi t 1 illi h ith d bl
A World Class Safety Organization?
First 1 million hours with no recordablesLWCR = 0.0No lost time injuries for 3.1 Million Hours3,000 Near Miss Reports in 12 Months Now at 230 per week, every weekOSHA VPP STAR Status March 2008Significant Schedule BoostsgAdditional Project Awards
slide 25Copyright 2009 © CoreMedia
Safety Accountabilities developed by a teamApplied and lived at all levels of the organizationCompletion measured and rewarded
“Level 3” Leading Indicators
Safety Process training by employees at all levelsSafety Culture training by employees at all levels
slide 26Copyright 2009 © CoreMedia

Copyright 2009 © CoreMedia
A FOUR STEP APPROACHTHE SAFETY ACCOUNTABILITY CYCLE
Everyone is in charge of safety.Pay attention to the “how and what needs to get done.”Focus on activities that will produce a safe work environment, rather than on results you hope to achieve.
Message to Management (video)
slide 28Copyright 2009 © CoreMedia

Copyright 2009 © CoreMedia
Four Steps to Accountability
slide 29Copyright 2009 © CoreMedia
The Safety River
Leading Indicators (upstream):Supervisors have control over these activities. Their consistent follow-through directly impacts downstream results.
Copyright 2009 © CoreMedia slide 30
Lagging Indicators (downstream):Management is required to "walk the talk" not only by ensuring clear accountabilities throughout the organization, but to support and model how they're defined, trained, measured, and rewarded.

Copyright 2009 © CoreMedia
Accountability flows up, support flows down
Support
Accountabilities
slide 31Copyright 2009 © CoreMedia
The role of the executive is to visibly demonstrate the value of safety by:
Establishing and visibly participating in the safety management process
Role Definitions: The Executive
processReceiving information regularly on who is and who is not performing safely by some pre-determined criteriaInitiate positive or negative rewards to middle managers
slide 32Copyright 2009 © CoreMedia

Copyright 2009 © CoreMedia
Without the support of this group, safety will not succeed. The role of the middle manager is to:
Ensure supervisor/subordinate performanceEnsure the quality of that performance
Role Definitions: Middle Managers
Ensure the quality of that performancePersonally engage in some agreed upon visible tasks
slide 33Copyright 2009 © CoreMedia
The role of the safety staff is to advise and assist line organization in carrying out their responsibilities.
Examples include:Identifying and appraising loss producing conditions and practices
Role Definition: Safety Staff
Identifying and appraising loss producing conditions and practices (Risk Assessment)Developing loss prevention methods, procedures, programsCommunicating loss prevention informationMeasuring and evaluating the effectiveness of the loss control systemCoaching personnel in safety performance improvement
slide 34Copyright 2009 © CoreMedia

Copyright 2009 © CoreMedia
Clearly defining safety activities is the first step in managing safetyActivities/Accountabilities are the things we do to keep ourselves safeNecessity of clear communication
Defining Activities
yMust be specific and measurableMust meet the Six Criteria for Safety Excellence
“THE MINIMUM LEVEL OF EXPECTATIONBECOMES THE MAXIMUM LEVEL OF PERFORMANCE.”
slide 35Copyright 2009 © CoreMedia
TasksBefore each shift, inspect/check the work area to identify unsafe issues and correct or initiate corrective action.Perform daily housekeeping duties to maintain work area in a safe
Operator Accountabilities
Perform daily housekeeping duties to maintain work area in a safe and clutter-free condition.Attend and participate in regular supervisor safety meetings.Team with the supervisor to present/discuss relevant topics during safety meetings (2-4/year).Initiate and follow-up with safety work orders.And more ...
slide 36Copyright 2009 © CoreMedia

Copyright 2009 © CoreMedia
Measures of PerformanceInjury and near-miss recordsJob hazard analysis reviews
Operator Accountabilities
Housekeeping condition and audit scoresDocumentation of safety meeting attendanceCrew safety trainingSafety work order recordsQuarterly safety goals and follow-up reviewAnd more …
slide 37Copyright 2009 © CoreMedia
1. 2. 3. 4. 5.
Are We Managing Safety?
What do you do on a
regular basis (daily) to prevent
accidents?
What do you expect your
employees to do?
How do you measure
safety performance?
How do you reward and recognize
safety performance?
What does your boss
expect you to do an a
regular basis to prevent accidents?
slide 38Copyright 2009 © CoreMedia

Copyright 2009 © CoreMedia
Survey completedInterviews occurringAction Item Matrix teams working on level four issues
“Level 4” Leading Indicators
slide 39Copyright 2009 © CoreMedia
SURVEYRESULTS
SURVEY

Copyright 2009 © CoreMedia
Safety Perception Survey: Summary
Category Emp. Sup. Mgr.Inspections 56.2 69.0 77.5
Percent Positive
pRecognition for Performance 58.5 61.9 42.4
Alcohol & Drug Abuse 59.8 54.6 43.8Operating Procedures 60.9 60.0 71.4
slide 41Copyright 2009 © CoreMedia
Safety Perception Survey: Summary
Question Emp. Sup. Mgr.Hazard
Correction37 Do you think your organization seeks prompt
correction of problems found during inspections? 49.0 50.0 57.1
Percent Positive
p g p 49.0 50.0 57.152 Do you have problems obtaining support for the
correction of hazardous conditions? 51.0 60.0 71.414 Are records kept of potential hazards found
during inspections? 64.4 100.0 100.0
slide 42Copyright 2009 © CoreMedia

Copyright 2009 © CoreMedia
Safety Perception Survey: Summary
Global Database Hourly Supervisors ManagersAverage All Hourly
Takers167 5 7
Inspections 56.2 60.0 1 5R iti f P f 58 5 56 9 2 3 1
Category
The Bottom 10 Categories for each of the organizational levelsCompany Composite
Average Hourly Score
Recognition of Performance 58.5 56.9 2 3 1Alcohol & Drug Abuse 59.8 63.7 3 1 2
slide 43Copyright 2009 © CoreMedia
1.
Describe the
2.
How are
3.How does
upper
4.Who are the
strongest performing
5.Describe
6.If you were in charge of
Interview question examples for each level
Describe the corrective
action process
How are unsafe work
practices corrected?
upper management reinforce the importance of safety?
performing hourly
employees with respect
to safety? Why?
your Continuous
Improvement teamwork
in charge of safety what would you
do differently?
slide 44Copyright 2009 © CoreMedia

Copyright 2009 © CoreMedia
Effective data-driven Safety Improvement TeamsUtilize data to build and implement the 2-3 year planPOP and AIM in place and tracking completionKaizen leader training and practicing
“Level 5” Leading Indicators
slide 45Copyright 2009 © CoreMedia
PRACTICAL GROUND RULESCONTINUOUS IMPROVEMENT LEADERSHIP

Copyright 2009 © CoreMedia
What needs to happen?Open and honest communicationTwo-way input/listening from everyone
Continuous Improvement Leadership
A method by which to put ideas into action (POP)A method to track tasks (AIM)
slide 47Copyright 2009 © CoreMedia
• Volunteers OnlyWho?
POPH ?
Four W’s for Forming a Committee
• POPHow?
• Complaint = GoalWhat?
• AIMWhen?
slide 48Copyright 2009 © CoreMedia

Copyright 2009 © CoreMedia
Statement of PurposeScopeMethodRoles & ResponsibilitiesR A il bl
Charter
Resource AvailableDeliverablesScheduleCommunicationCritical Success Factors
slide 49Copyright 2009 © CoreMedia
POP – The Start of Every Meeting
Purpose
Outcome
PProcess
slide 50Copyright 2009 © CoreMedia

Copyright 2009 © CoreMedia
Purpose, Outcome, Process (example)
Date 10/11/07
Inspection Continuous Improvement TeamPOP Statement
Purpose Develop a comprehensive inspection system that identifies all hazards to help us achieve zero injuries.
Outcomes Rank Comments
C A training program set-up by EHS for the new inspection system Not Applicable
A Gather existing check lists Yes- 8/8
A Team reviews existing check lists & decided to leave them be Yes
C Develop the system- present to Management for critique and approval On going
B Develop inspection accountabilities for all levels (in Policy Statement) Yes- 8/15
slide 51Copyright 2009 © CoreMedia
Fault Tree (example)Effective
Inspection Program
Does the system include inspecting
people and conditions?
AND
Does the system effectively identify
hazards?
AND
Does the system have a process to correct
hazards?
AND
Does the system include management
and worker involvement?
ANDAND
Physical Conditions
Worker Behavior
Risk Factors
AND
Identify who will do inspections
Inspector training
Identify frequency of inspections
AND
Recognize Risks or hazards
Link to identify repeated risk/hazard
Reporting process to correct hazards
AND
Employee opinions sought
Management accountability for
correcting hazards
Employee involvement in prioritizing and
IncludeJHA component
p
Ensure inspections are performed
Rewards given for inspections performed
Tracking process to assign/close
corrective actions; conditions and JHAs
p gcorrecting hazards
Does the system reinforce
management and worker involvement?
slide 52Copyright 2009 © CoreMedia

Copyright 2009 © CoreMedia
Cause & Effect
slide 53Copyright 2009 © CoreMedia
Tasks/Action Items Team MembersTargeted Delivery
90 120 d I t i K i t
Action Item Matrix | Key Components
90–120 days or Intensive Kaizen teams
slide 54Copyright 2009 © CoreMedia

Copyright 2009 © CoreMedia
Action Item Matrix (example)
Inspection Continuous Improvement TeamFollow-up AIM7/4/07Members in attendance: Robert, Richard, Frank, Chad, Cathy, Steve, Mark
ACTION ITEM WHO TARGET DATE X COMMENTSACTION ITEM WHO TARGET DATE X COMMENTS
1 Next meeting 8/1 at 1 pm. Reserve a room-Mead 1 Norm 7/27 X Done
2 Type notes & prioritize outcomes Frank Before 8/1 X Notes typed. Items prioritized 8/13 Review flip chart (figure out hard to read words) Team 8/1 X Done- 8/84 Team Leader/Facilitator TBD on 8/1 8/1 X Norm- Team Leader, Frank- Secretary5 Finish off action item matrix On going6 Develop physical inspection for each dept7 Develop personnel inspection for each dept8 Get other assistance for inspection
9 Develop our process for doing this Inspection/ flow chart
Steve Ross- draft flow chart 8/15 X Done- team reviewed “fault-tree”
10 Bring up to 3 inspection sheets used in your department or area All Team Members 8/8 X Donedepartment or area
11 Review inspection sheets- ck for dis/similarities, redundancy, good info for future use etc? Frank 8/15 X Inspection sheets from different dept
are “all over the map”
slide 55Copyright 2009 © CoreMedia
All personnel shall be familiar with this policy.
Employee’s responsibility: Periodically perform inspections and to participate in audits when required.
Policy Statement
Supervisor’s responsibility: Ensure all required inspections are performed within their area of responsibility, to ensure employees are trained to perform inspections, and to participate in audits when required.
Manager’s responsibility: Periodically perform audits to ensureManager s responsibility: Periodically perform audits to ensure inspections are being performed, to ensure records of audits are kept, and to ensure observations or findings of inspections and audits are acted upon.
slide 56Copyright 2009 © CoreMedia

Copyright 2009 © CoreMedia
Audit/inspector: Employee assigned to make safety audit/inspection.ResponsibilityAll employees are responsible to participate in a safety audit/inspection of their work area or group according to the
Inspection Guidelines
audit/inspection of their work area or group according to the following pre-defined schedule:
1. General Manager – at least one per quartera. Directors – at least one / quarterb. Managers – at least one / quarterc. Supervisors – on a frequency developed by the individual department
or at least as often as they inspect for production and quality issues (minimum of once per month)(minimum of once per month)
slide 57Copyright 2009 © CoreMedia
Continuous Improvement team leaders from all levelsExecutive Steering Team with all level representation
Meets, Plans, ExecutesTracking for Upstream ActivitiesClearly defined rewards for upstream activity culture excellence
“Level 6” Leading Indicators
Clearly defined rewards for upstream activity culture excellenceInjury/incident downstream indicators improve every yearSurvey and interview scores regularly improveZero-incident, zero-error mentality evident in all functions
A culture with a relentless, passionate pursuit of Zero
slide 58Copyright 2009 © CoreMedia

Copyright 2009 © CoreMedia
AIM Team Tracking
70%
80%
90%
100%pl
ete
Action Item Status
0%
10%
20%
30%
40%
50%
60%
Perc
ent C
omp
Teams
slide 59Copyright 2009 © CoreMedia
A Heavy Equipment DealerStarting
TRIR = Around 10LWCR 3 0
Transitioning to World Class?
LWCR = 3.0Few Established Safety ProcessFewer than 10 Reported Near Misses per YearAn Executive Leader who “gets it”173 Near Miss Reports five weeks after RolloutHundreds of Pre-job Hazard Assessments completed
slide 60Copyright 2009 © CoreMedia

Copyright 2009 © CoreMedia
Focused Supervisor Performance Active Employee Involvement
Employees build JHAs and live themOne-on-one interviews to determine additional issues
Safety Accountabilities at the floor level
Morrison Bros. Foundry
Safety Accountabilities at the floor levelComplaint = Goal CI Teams in all departments Significant training of safety basics, safety culture and safety excellence at all operations organizations
The Results 1999 TCIR 28.69, LWDR 3.482007 TCIR 2 73 LWDR 02007 TCIR 2.73, LWDR 0No LTAs since 20021999 Mod Factor 1.34, 2007 Mod Factor 0.7Productivity increased 29%
slide 61Copyright 2009 © CoreMedia
TRUSTThe result of character and competence.TRUSTThe result of character and competence.

Copyright 2009 © CoreMedia
Making Leading Indicators part of the Organization’s DNA
LEADING INDICATORS
Recommended