1
Land Access and Youth Livelihood
Opportunities in Southern Ethiopia
Sosina Bezu and Stein T. Holden School of Economics and Business
Norwegian University of Life Sciences
P.O.Box 5003, 1432 As, Norway
E-mail: [email protected]
September 2013

2
Land Access and Youth Livelihood Opportunities in Southern Ethiopia:
Sosina Bezu and Stein T. Holden
Abstract
This study aims to examine current land access and youth livelihood opportunities in Southern
Ethiopia. Access to agricultural land is a constitutional right for rural residents of Ethiopia. We
used survey data from the relatively land abundant districts of Oromia Region and from the land
scarce districts of Southern Nations, Nationalities and Peoples’ (SNNP) Region. We found that
youth in the rural south have limited potential to obtain agricultural land that can be a basis for
viable livelihood. The law prohibits the purchase and sale of land in Ethiopia. We found that land
access through allocation from authorities is virtually nonexistent while land that can be obtained
from parents through inheritance or gift is too small to establish a meaningful livelihood. The
land rental market has restrictions, including on the number of years land can be rented out.
Perhaps as a result of limited land access, the youth have turned their back on agriculture. Our
study shows that only nine percent of youth in these rural areas plan to pursue farming. The
majority are planning non-agricultural livelihoods. We also found a significant rural-urban
migration among the youth and especially in areas with severe agricultural land scarcity. Our
econometric analyses show that youth from families with larger land holding are less likely to
choose non-agricultural livelihood as well as less likely to migrate to urban areas. We suggest
here some measures to improve rural livelihood such as creation of non-farm employment
opportunities and improvement of land rental markets. We also argue that as a certain level of
rural-urban migration is unavoidable, investigating youth migration is essential to design policies
that help the migrating youth as well as the host communities.
Key words: Youth unemployment, youth livelihood, rural livelihood, migration, Ethiopia
JEL CODES: Q15, J13, R2, R23

3
Acknowledgements
This research has been funded by UNHABITAT and Norwegian University of Life Sciences.
Useful comments have been received from Toril Iren Pedersen. We would like to thank people at
the Land Administration offices in the Oromiya and SNNP regions and districts where we
undertook the survey for facilitating our work and for providing useful information. Thanks are
also due to all the enumerators and supervisors that were engaged in the survey. Finally we want
to appreciate the parents and youth in our sample for setting the time for our interviews. The
responsibilities for the interpretations and conclusions still remain those of the authors.

4
1 Introduction
Youth unemployment and lack of livelihood has become a major global concern following the
global economic crisis that trigger a sharp rise in youth unemployment in 2008-2009. The
current youth unemployment rate is estimated to be 12.6% and is expected to remain high for the
next five years (ILO 2013). Although predominantly agricultural economies may not be hit as
hard by the global financial crisis, there is still significant unemployment. And those reportedly
employed have vulnerable livelihood. Sub-Saharan-Africa has a regional unemployment rate of
11% but the rate of working poverty is by large the highest in the world, estimated at 40.1 per
cent in 2012 at the US$1.25 per day level (ILO, 2013).
Ethiopia’s current population is estimated to be more than 86 million (CSA 2013) .The
populations is predominantly rural with 84% employed in agriculture. A recent nationally
representative survey shows that the majority of Ethiopia’s population is young with the youth
and adolescent population alone accounting for 40.6% the total population in 2011(CSA and ICF
2012). At least for now, access to agricultural land is likely to be the most important determinant
of Ethiopia’s youth livelihood.
Access to agricultural land is a constitutional right in Ethiopia where it has also served as a
safety net in rural areas. But increasingly it has become difficult to fulfill this right for the young
generation. Ethiopia faces land scarcity in parts of the highlands where population densities have
become very high and farm sizes very small. As a result, land as a safety net is eroding and
landlessness emerging among the youth who are unable to stay on their parents’ land. This is
particularly true for Southern Ethiopia where farm size is the smallest in the country. New land
laws also add complication as the minimum farm size is now set at 0.5 hectare while many farms
are already smaller than this. The children therefore either have to co-manage the land with their
parents or leave the farm. The institutional responses to the challenge include distribution of
communal land to youth and voluntary resettlement.
Land is traditionally inherited by the sons who marry and stay on the farm while girls typically
marry and move to the husband’s village. Unmarried girls would, however, get land from their
parents if they had land. This study aims to assess the current land access of youth in Southern

5
Ethiopia and how it determines their livelihood strategies and welfare outcomes. More
specifically we aim to answer the following research questions:
1) What livelihoods strategies do the youth choose when land scarcity becomes very high?
Are the youth aiming to obtain land for agriculture or are they looking for alternative
livelihood options outside agriculture?
2) How is land scarcity and land certification affecting the access to land and land tenure
security of youth?
3) How does extreme land scarcity affect the intra-household competition for land? Who are
leaving and who remain behind and why?
4) How is land scarcity affecting,
a. The nutritional status of children and youth that stay on the farm?
b. The education decisions of the children?
c. The gendered land distribution among children in the household?
5) To what extent are the youth organized and demand land as a source of future livelihood?
6) How and to what extent are the local governments and communities responding to the
youth needs and demands?
7) What are the complementary constraints and needs that the youth face in accessing and
efficiently utilizing land resources to secure their livelihood and improve their welfare?
8) What are the best practices used to improve access to land for youth, to mobilize and
empower them in relation to land utilization?
The report is organized as follows. Part two provides a general background on the land tenure
situation and reforms in Ethiopia, a brief overview of the study areas, data and methods used.
Part three provides descriptive and more detailed analyses of our survey data collected from the
study areas in Southern Ethiopia. Part four presents the findings in our social experiments with
youth in our study areas (dictator and trust games). Part five discusses each of the research
questions in light of the findings before we conclude.

6
2 Background and data
2.1 Land Laws and regulations
The Derg regime that had come into power in 1975 through a military coup abolished the feudal
system in Ethiopia and declared all land, rural or urban, property of the state. The Marxist
government tried to create an egalitarian land access through distribution of the existing farm
land to peasants and through subsequent redistributions of land to accommodate young farmers.
This state ownership of land has not changed with the change in political leadership in 1991 and
the introduction of a more pro-market policy post 1991 that was in fact inscribed in the 1995
Ethiopian Constitution. Land is owned by the state and holders have only user rights. Peasants
obtain land free of charge. While their land use rights have an indefinite duration, the land itself
cannot be subject to sale or other means of exchange.
The 1995 constitution implies entitlement to agricultural land use to residents in rural areas. The
recent federal and regional legislations that deal with rural land administration and land use
enshrine this entitlement in the law. Section 5 of the Rural Land Administration and Land Use
Proclamation of 2005 states that:
Peasant farmers/pastoralists engaged in agriculture for a living shall be given
rural land free of charge (Land Use Law, Section 5, No. 1-A)
Any citizen of the country who is 18 years of age or above and wants to engage in
agriculture for a living shall have the right to use rural land; children who lost
their mothers and fathers due to death or other situation shall have the right to
use rural land through legal guardians until they attain 18 years of age (FDRE,
2005).
The law also gives women equal right to use agricultural land.
Women who want to engage in agriculture shall have the right to get and use
rural land.

7
This law appears to ensure young people’s right to use rural land. But the most important issue
especially in the face of increasing land scarcity is how they obtain the land. The 2005 legislation
identify inheritance, donation and authorities as the source of rural land. Inheritance is the most
common source of land acquisition for young people in Ethiopia and the right of parents to
bequeath land to their children is clearly stated in the 2005 legislation. The Federal land use law
states that:
Any person who is member of a peasant farmer, Semi pastoralist and pastoralist
family having the right to use rural land may get rural land from his family by
donation, inheritance or from the competent authority (Section 5, NO. 2).
Any holder shall have the right to transfer his rural land use right through
inheritance to members of his family (Section 8, No.5)
There are some variations in regional laws that may constrain or relax this access. In Oromia
region for example priority in inheritance is given for those that depend on the holding or do not
have other source of living. In Tigray region land can be taken from households that have been
away from their farm for two years or more without any compensation.
With regard to obtaining land from a competent authority there are three ways this can happen.
Land administrators may distribute unoccupied land, convert community land into individual
farm land or redistribute existing farm lands. It has been argued that the fear of redistribution has
been an important source of insecurity in the past and had negative impact on farmers’
investment on land (Alemu 1999, Holden and Yohannes 2002, Deininger and Jin 2006). As a
result regular land redistribution has been suspended. The 2005 land use law stipulates special
conditions under which land can be taken over and redistributed to the landless or land-poor
farmers (FDRE 2005).
In accordance with land administration laws of the regions farmlands whose
holders are deceased and have no heirs or are gone for settlement or left the
locality on own wish and stayed over a given period of time shall be distributed to
peasant farmers, semi-pastoralist and pastoralist who have no land and who
have land shortage (Section 9, No.1).

8
Another condition where land may be redistributed is through a popular vote and request by
residents of the locality.
Upon the wish and resolution of peasant farmers, semi pastoralists and
pastoralists where land distribution becomes the only alternative, it shall be
undertaken in such a way that it shall not be less than the minimum size of
holding and in a manner that shall not result in fragmentation of land and
degradation of natural resources(Section 9, No.3).
The regional governments design their land law and regulations in line with the Federal law with
small variations and specific regulations to suit the conditions of their region. For example, in
Amhara region, land redistribution takes place only if 80% of land holders in the kebelle1 ask for
it in writing. Resettlement to less densely populated areas is another option that is being explored
and tested in some parts of Ethiopia.
While the Rural Land Use law stipulates that any citizen who wishes to engage in agriculture has
a right to use rural land, there are not enough tools on the ground to ensure that access. The law
recognizes inheritance as a legitimate source of land access but does not specify whether one is
entitled to obtain land from authorities if the individual could not inherit from parents or relatives
because of land shortage. Given the abolition of land redistribution, it is not also clear what
options local authorities have if there are no more unoccupied arable land in that community.
The youth may secure temporary land access through land rental markets. Land access through
rent is likely to increase in importance as less and less parents are able to bequeath land to all
their children. In fact, the recent restriction on minimum land holding sizes of 0.5 ha in cereal-
based farming systems and 0.25 ha in perennial cropping systems is likely to leave most heirs
without land from their parents. But with the 2005 land use law, farmers were allowed to rent out
their land to other farmers or investors as long as this transaction does not displace the original
holder. This may provide a good opportunity for young people to access land through rent.
1 Kebelle is the lowest administrative unit (community or municipality).

9
2.2 Land registration and certification
The land registration and certification in Ethiopia which started in 1998/99 in Tigray region
followed by Amhara, Oromia and SNNP regions in the early 2000s, is expected to improve
tenure security of farmers, including young land holders. Beside the tenure security of current
holders, the registration may also improve the security of young inheritors. The land certification
involves registration of the names of all family members of the household on the certificate. This
allows inheritors to document their entitlement in case of conflict after death of original holders.
It is important to note that the names of both male and female children of the household head are
registered on the certificate and a record of it kept at the district level. Traditionally land
inheritance in Ethiopia is patrilineal and girls do not often inherit land from their parents. They
are expected to access land through their husband who will be inheriting land from own parents.
Whether or not this official registration of girls’ names in their parents’ land certificate will
change the inheritance culture is an empirical question but it can be argued that their position to
claim land share in case of death of parents is strengthened through this.
2.3 Study locations
The locations and households that were included in the study were identified using stratified
random sampling. Stratification was based on agro-ecosystem variation, market access,
population density (urban expansion pressure), and regional differences in land laws and
implementation of land registration and certification. The sample included three major ethnic
groups (with different languages). We built on a baseline study of 615 households in 2007 that
focus on gender and land rights (Holden and Tefera 2008). The study is carried out in sixteen
peasant associations in five districts in Southern Ethiopia; three in Oromia region and two in
the Southern Nations, Nationalities and Peoples (SNNP) region. The study areas are;
a) Wondo Genet in SNNP region: A cash-crop and perennial zone with very high
population density (64% of farms were below 0.5 ha in 2007). The main cash crops are
sugarcane, chat and coffee. Many youth engage in the cash crop business including in the
selling of chat. Maize and enset are main staple crops. It is one of the pilot areas for

10
second stage land certification that provide households parcel based land certificates with
maps of the plots. Most of the population is Protestant.
b) Wollaita in SNNP region: A subsistence oriented perennial zone with very high
population density (67% of farms were below 0.5 ha in 2007). Enset, maize, and root and
tuber crops are the main food crops. Many of the youth migrate to other areas for
employment, e.g. work as shoe-shiners, lottery ticket sellers and maids in urban areas.
Resettlement programs also try to resettle people, including youth, in other less populated
areas of the region. Most of the population is Protestant.
c) Sashemene in Oromia region: A cereal producing area and growing trading centre (small
town development) where farm sizes are relatively larger (22% of farms were below 0.5
ha). Youth may here combine on-farm (on their family farm or on land inherited from
their parents) and off-farm activities. Most of the population is Muslim.
d) Arsi Negelle in Oromia region: A cereal producing area with relatively larger farm sizes
(12% of farms were below 0.5ha). Youth may primarily engage in farming but also in
off-farm activities. Arsi Negelle was also selected because tenure insecurity has been
identified in earlier surveys to be particularly acute in this district (Holden and Yohannes,
2002). Most of the population is Muslim
e) Wondo Genet in Oromia region: This location capture Oromo people that have settled in
the Wondo Genet area and where a referendum has been held which decided to include
some communities with majority of Oromo people under the Oromia region. Agro-
ecological conditions are similar to those in Wondo Genet in SNNP region.
Within each of these we selected peri-urban communities (kebelles, also called peasant
associations) in addition to communities that are located further away from the district centre.
This allows us to assess the difference between peri-urban and more rural communities.

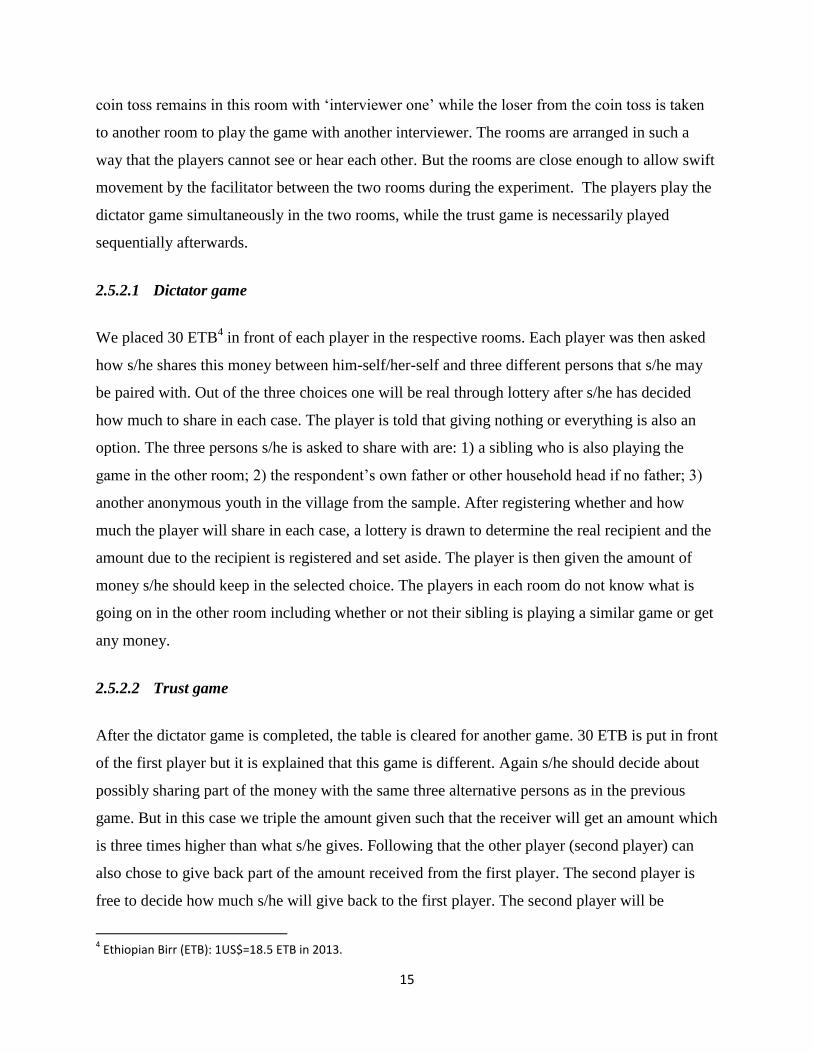
11
Map of Survey areas
2.4 Conceptual framework
To show the link between land access and rural youth livelihood, we borrow concepts from the
livelihood approach which define livelihood as a combination of capabilities, assets and
activities that are required for a means of living (Chambers and Conway 1992, Chambers 1995).
The following simple diagram shows the link between livelihood resources (Scoones 1998,
Morse, Acholo et al. 2009) and livelihood strategies that may be adopted by individuals and
households using these livelihood resources.

12
Rural livelihoods depend heavily on natural capital. Natural capital in the livelihood framework
includes natural resource stocks such as land, water, genetic resources and environmental
services such as pollution sinks (Scoones 1998). Land is particularly important in rural
livelihoods as it is the vital input in agricultural production. Access to land is therefore an
important determinant of livelihood strategies. Individuals who could not access agricultural
land will not be able to engage in agriculture and will need to diversify into non-farm activities
or migrate to other areas. In this study we assess youth land access in rural Ethiopia and examine
its impact on their livelihood strategies.
This study examines land access and livelihood strategies for rural youth in Ethiopia. But most of
the youth live in an extended family where they are neither the only nor the primary decision
maker in the household. To explore this issue further, we build on theories of household
behavior (Manser and Brown 1980, Becker 1981, Lundberg and Pollak 1993) where households
may work as one decision-making unit with a household head taking the final decisions or where
bargaining takes place and outcomes based on the bargaining power of individual household
members and solutions can be cooperative or non-cooperative solutions. Non-cooperative
behavior may result in non-cooperative solutions within households (Lundberg and Pollak 1993).
Individual household members may be more or less selfish and more or less generous towards
other family members and towards other people in their community (Bezu and Holden 2013).
They may also be more or less trustful and more or less trustworthy and these characteristics may
affect the social relations within families and within communities which again affect the degree
of cooperation among family members and other community members. These characteristics are
likely to affect the degree of competition or cooperation in relation to utilization of land
Livelihood resources
Natural Capital (includes land)
Human Capital
Social Capital
Economic/Financial capital
Physical capital
Livelihood strategies
Agricultural intensification/
extensification
Livelihood diversification
Migration

13
resources within households as well as migration decisions and other livelihood-related
decisions.
Fafchamps and Quisumbing (2005) studied marriage, bequest and assortative matching in rural
Ethiopia using household data from 1997 for the four main regions of the country. They found
that most of the land is passed on to the sons at time of marriage while daughters received very
little or no land and that the distribution of wealth at time of marriage was very inequitable both
for grooms and brides. They also found assortative matching such that more wealthy grooms
marry more wealthy brides thus strengthening the tendency of inequitable distribution of
resources across generations. The inequitable distribution also continued at time of inheritance as
the majority of women inherit nothing. They found sibling competition among sons. The
explanation for this pattern may be that sons who stay at home also take responsibility for their
parents as they grow old. They did not find the same sibling competition for land at the time of
marriage, possibly because such marriages do not take place at the same time and because at the
time of their study young married couples may have been more able to obtain land through
allocation from the community (kebelle). Our study 10-15 years later may involve more such
sibling competition because there is no or very little land available from the kebelle and family
land has also become scarcer. The new land proclamations in OR and SNNPR emphasise that
land should be transferred to those children that depend on the land and have no alternative
sources of income. This shows the pro-poor aspect of the land proclamation which emphasises
that land still has a role as a safety net. However, with the increasing land scarcity and
landlessness, this role of land can only support some of the children if family planning and birth
control is not implemented.
2.5 Data and methods
With funding from Research Council of Norway we carried out a new survey in 2012 tracing 580
of the 615 households that were surveyed in 2007. We included an additional random sample of
40 households to increase the sample size from one community that has been delayed in land
registration and certification and also to bring the total sample in 2012 to the 2007 size. For the
current study that focuses on youth land access and livelihood, the main sample consists of youth
representatives but we have taken the benefit from this two-round household and land panel

14
survey to select youth from the same households. In addition to the land related data we collected
on the full sample in 2007 and 2012, we administer a separate survey for households that have
youth members. Using questionnaires we separately interviewed youth and the household head
concerning land access and livelihood issues. In addition we carried out social field experiments
to study generosity and trust among youth.
2.5.1 Survey data
The survey for this youth study was carried out in February-March 2013. The household heads
are typically the fathers unless it is a female-headed household. The questions posed for
household heads deal with past and future land inheritance to children, land registration and
certification status and schooling decisions for children. In addition detailed demographic data
was collected, including information on the household members who left the household. The
youth interview addresses youth involvement in agriculture; land inheritance expectations; trust
and cooperation with siblings and parents; preferences and expectations in relation to marriage;
and livelihood options and choices. In addition to structured questionnaires we carried out social
field experiments that explored the sharing behavior and trust among siblings and with other
youth in the village. The data were entered in Excel and cleaned and transferred to Stata for
analysis. Descriptive analyses and regression analyses are used to answer our research questions.
2.5.2 Social field experiments
We played dictator games2 and trust games
3 with youth in our sample. A public place in the
village was identified for the experiments (such as an office in the health station, agricultural
extension office or school) and all sample youth in the village were handled in one session to
minimize communication and leakage of information before all sample respondents in the village
had played the games. Pairs of siblings (the eldest two youth if we have three or more youth in
the family) were asked to come together as two household members should participate in the
game. For polygamous households we included one pair of youth from each mother whenever
possible. The pairs were first invited into ‘play room one’. The ‘first player’ identified through a
2 See: http://en.wikipedia.org/wiki/Dictator_game for an introduction to dictator games.
3 See: http://en.wikibooks.org/wiki/Bestiary_of_Behavioral_Economics/Trust_Game for an introduction to trust
games.
15
coin toss remains in this room with ‘interviewer one’ while the loser from the coin toss is taken
to another room to play the game with another interviewer. The rooms are arranged in such a
way that the players cannot see or hear each other. But the rooms are close enough to allow swift
movement by the facilitator between the two rooms during the experiment. The players play the
dictator game simultaneously in the two rooms, while the trust game is necessarily played
sequentially afterwards.
2.5.2.1 Dictator game
We placed 30 ETB4 in front of each player in the respective rooms. Each player was then asked
how s/he shares this money between him-self/her-self and three different persons that s/he may
be paired with. Out of the three choices one will be real through lottery after s/he has decided
how much to share in each case. The player is told that giving nothing or everything is also an
option. The three persons s/he is asked to share with are: 1) a sibling who is also playing the
game in the other room; 2) the respondent’s own father or other household head if no father; 3)
another anonymous youth in the village from the sample. After registering whether and how
much the player will share in each case, a lottery is drawn to determine the real recipient and the
amount due to the recipient is registered and set aside. The player is then given the amount of
money s/he should keep in the selected choice. The players in each room do not know what is
going on in the other room including whether or not their sibling is playing a similar game or get
any money.
2.5.2.2 Trust game
After the dictator game is completed, the table is cleared for another game. 30 ETB is put in front
of the first player but it is explained that this game is different. Again s/he should decide about
possibly sharing part of the money with the same three alternative persons as in the previous
game. But in this case we triple the amount given such that the receiver will get an amount which
is three times higher than what s/he gives. Following that the other player (second player) can
also chose to give back part of the amount received from the first player. The second player is
free to decide how much s/he will give back to the first player. The second player will be
4 Ethiopian Birr (ETB): 1US$=18.5 ETB in 2013.
16
informed about the instruction given to the first player and that the amount given by the first
player was tripled by the researchers. Based on that s/he will decide whether to give something
back and how much to give back. The first player is also free to give nothing or to give up to 30
EB to the second player. If s/he gives 30 EB the second player will get 90 EB and is then free to
keep it all or can return part or all of it to the first player.
To avoid causing possible conflict among siblings we did not reveal the real receiver of the
trusted amount to the first player. After the first player decides how much money to send in each
of the three cases (father/household head, sibling, and anonymous youth) the player is taken to a
waiting place while a coin is tossed to determine whether the receiver will be the sibling or the
anonymous youth from the same village. The parent/head of household is dropped from the
payout as the game is among youth but this is not told to the player until after s/he has decided
the allocation for each case. The second player is also asked hypothetically what s/he would give
back if s/he received ETB 45 (15*3 ETB) from the brother/sister, the father/household head, or
an anonymous youth in the village. After this is recorded the envelope with money which may be
from the brother/sister or an anonymous youth is opened. The second player is told that if the
giver was the brother/sister that person will not be told what s/he decides to do. S/he is then
asked to decide whether and how much to give back to the first player and can retain the rest for
her/himself. The second player is also asked to give an assessment of how the brother/sister
would react to her/his decision if they knew of her/his decision. The game protocols for these
games are attached in Appendix 2.
While the households are random samples, the youth interviewed from these households are not.
We needed pairs of youth to undertake the games in the social experiments and hence young
people in the age group 15-29 years old who do not have a brother or a sister in the same age
group were not included in the social experiment and the related interview. However all parents
have been interviewed. One-third of these households currently do not have any youth member.
We obtained 599 youth respondents from 266 households in the five districts.

17
3 Land access and youth livelihood opportunities: Analyses
In this section we will provide descriptive analyses based on our survey data. We also include
some tables and statistics at regional and national levels to put our data into a broader
perspective. Furthermore, we run a variety of regression models to help provide a better basis for
answering our research questions.
3.1 Assessing land availability, current land regulations and youth land access
Table 3.1 provides basic overview statistics for our youth sample. Our sample contains both male
and female youth who live in the sample villages. We found that 94% of the youth in our sample
live with their parents. Female youth account for 41% of the total sample. The average age is
around 19 years and the average grade level completed in school is 7th
grade. The students
account for two-third of the sample. School enrollment seems to be high with 97% registered at
school at least once in their lifetime. However, a temporary or permanent school dropout is also
high with 43% stating that they dropped out of school at one point. 12% of the youth in this
sample are married. Of those who are married, 38% reported to have married through arranged
marriage. There are some differences in the statistics across survey sites highlighting the
socioeconomic difference in the three ethnically and geographically different communities.
There are proportionately more students in Sidama than in the other two places while the dropout
rate is lower in Wollaita. About half of the married youth in Oromia and Wollaita indicate that
their marriage is arranged by parents while in Sidama it was only 13%.

18
Table 3.1. Main characteristics of youth sample by survey sites (three zones)
Oromia Sidama Wollaita All
Percentage N Percentage N Percentage N Percentage N
Female respondent 37 315 48 149 41 134 41 598
Attended school at least once 99 315 99 150 93 134 97 599
Currently student 63 315 77 149 62 133 66 597
Dropped out of school at least once 48 304 41 145 33 120 43 569
Married youth 12 314 15 150 08 134 12 598
Married through arranged marriage 07 315 02 150 02 134 05 599
Involved in farming activity 95 315 76 148 50 133 80 596
Tried to get land access 49 314 28 146 15 133 36 593
Succeeded in getting land access 24 315 08 150 07 134 16 599
Mean N Mean N Mean N Mean N
Age of respondent 18.51 314 19.33 148 18.71 128 18.76 590
Highest grade completed by respondent 7.36 312 7.53 150 6.33 126 7.19 588
Highest grade attained by any member in the
household 9.80 308 9.37 145 8.55 129 9.42 582
Number of respondents' brothers 3.77 315 3.42 149 3.52 134 3.63 598
Number of respondents' sisters 4.00 315 2.78 149 2.84 134 3.44 598
Source: Own survey data.

19
There is also a big variation in youth access to land and participation in farming. A higher
proportion of youth participated in farming and tried to access agricultural land in Oromia than
Sidama and Wollaita. Their success rate is also higher in Oromia. We will discuss the land
access issues in more detail in the next sections.
3.2 Agricultural land holding pattern in Ethiopia
Before we examine land access to the youth, it is imperative to review the current agricultural
land holdings in Ethiopia. As Table 3.2 shows the average household farm size in Ethiopia is
1.22 hectares but 57% of the households hold less than one hectare. Oromia and SNNP have
quite different farm sizes. The average farm size of 1.6 hectares in Oromia is more than twice the
average farm size of 0.7 ha in SNNP.
Table 3.2. Household farm size and household size from national level survey
Average land
holdings per
household
Household size Percentage of households
with land holdings <1
hectare
Ethiopia 1.22 N.A 57
Oromia sample 1.6 5.49 46
SNNP sample 0.7 5.33 78
Source: Compiled from the 2011/2012 Agricultural Sample Survey report (CSA 2012)
Table 3.3 shows the land holding disaggregated by household size. As we can see land holding
does not increase with increase in household size. The proportion of landholders at different
levels of land holding size is largely the same for holders who have one member and those who
have 6-9 members. This shows that the possibility for expanding land holding in response to
growing family size is very small in Ethiopia. This is particularly so in SNNP where, for
example, the proportion of households who held 1-2 hectares of land is 15% for both single
member households and households with 6-9 members.

20
Table 3.3. Household farm size by household size in Ethiopia
Farm size (ha)
Household size
Ethiopia
Oromia
SNNP
1 6--9
1 6--9
1 6--9
Under 0.1 10% 6%
7% 4%
9% 7%
0.1--0.5 27% 26%
20% 15%
46 45%
0.51—1 23% 23%
23% 20%
25% 27%
1.01—2 24% 25%
26% 28%
15% 15%
2.01—5 15% 18%
21% 27%
5% 6%
5.01--10 1% 2%
3% 4%
- 1%
Over10 - -
- 1%
- -
Total 100% 100%
100% 100%
100% 100%
Source: Compiled from the 2011/2012 Agricultural Sample Survey report (CSA 2012)
The mean land holding size in our sample is 0.86 hectares sustaining an average household size
of 7 people but most households have less than that as the median holding is 0.5 hectares. What
is more, there are currently on average two youth per household for whom the family land is
often the only land they have access to.
Table 3.4. Household land holding and demographic character in the sample
Mean N
Household land holding (in hectares) 0.86 609
Household size (current members) 7.05 610
Number of own children (of all age) currently living with the
household 4.88 610
Number of own children ( age 15-29 years) living with the
household 1.72 610
Number of own children alive (including currently non-resident) 6.70 597
Source: Own survey data

21
Table 3.5. Household land holding and demographic character by marriage type
Monogamous
married
Polygamous
married
Female-
headed
Household farm size (in hectares) 0.77 1.34 0.79
Household size (current members) 6.68 11.04 4.70
Number of own children (of all age) currently
living with the household 4.58 8.09 3.12
Number of own children ( age 15-29 years)
living with the household 1.58 2.71 1.57
Number of own children alive (including
currently non-resident) 6.00 11.02 5.71
Source: Own survey data
Table 3.5 shows farm size and household size disaggregated by the type of family and district,
respectively. Polygamous households (accounting for 15% of the households) have bigger farm
size but also significantly larger household size and more children.
Table 3.6 disaggregates the farm size and demographic characteristics by district. Shashemene
and Arsi Negelle, both districts in Oromia have bigger farm size than Wondo Genet and Wollaita
(districts in SNNP). In fact the farm sizes in these Oromia districts are more than twice as big as
in the districts in SNNP. Wondo-Oromia is geographically close to Wondo Genet district
although because of its ethic composition it is administratively belong to the Oromia region. It
has thus significantly lower land holding than the two Oromia districts but still higher than
SNNP districts.

22
Table 3.6. Land holding and demographic characteristics by district
Shashemene
Arsi Negelle
Wondo Genet
Wollaita
Wondo-Oromia
Variable Mean Median
Mean Median
Mean Median
Mean Median
Mean Median
Household farm size (hectares) 1.1 1.0
1.4 1.3
0.5 0.5
0.5 0.5
0.8 0.8
Household size (current
members) 7.9 7.0
7.5 7.0
7.3 7.0
6.1 6.0
7.2 7.0
Number of own children (of all
age) living with the household 5.7 5.0
5.5 5.0
5.0 5.0
3.9 4.0
4.9 5.0
Number of own children ( age 15-
29 years) living with the
household 1.7 1.0
2.0 2.0
2.3 2.0
1.2 1.0
1.5 1.0
Number of own children alive
(including currently non-resident) 7.3 7.0
7.3 6.5
6.6 6.0
6.3 6.0
5.4 5.0
Source: Own survey data
23
Although Wollaita households have the same number of children as those in Wondo Genet and
higher than those in Wondo-Oromia, the number of youth living with the households is the
smallest in the sample, indicating the limited livelihood opportunities for youth in this very
densely populated area with subsistence-oriented rain-fed agriculture creating pressure on the
youth to look for livelihood outside of the household and community.
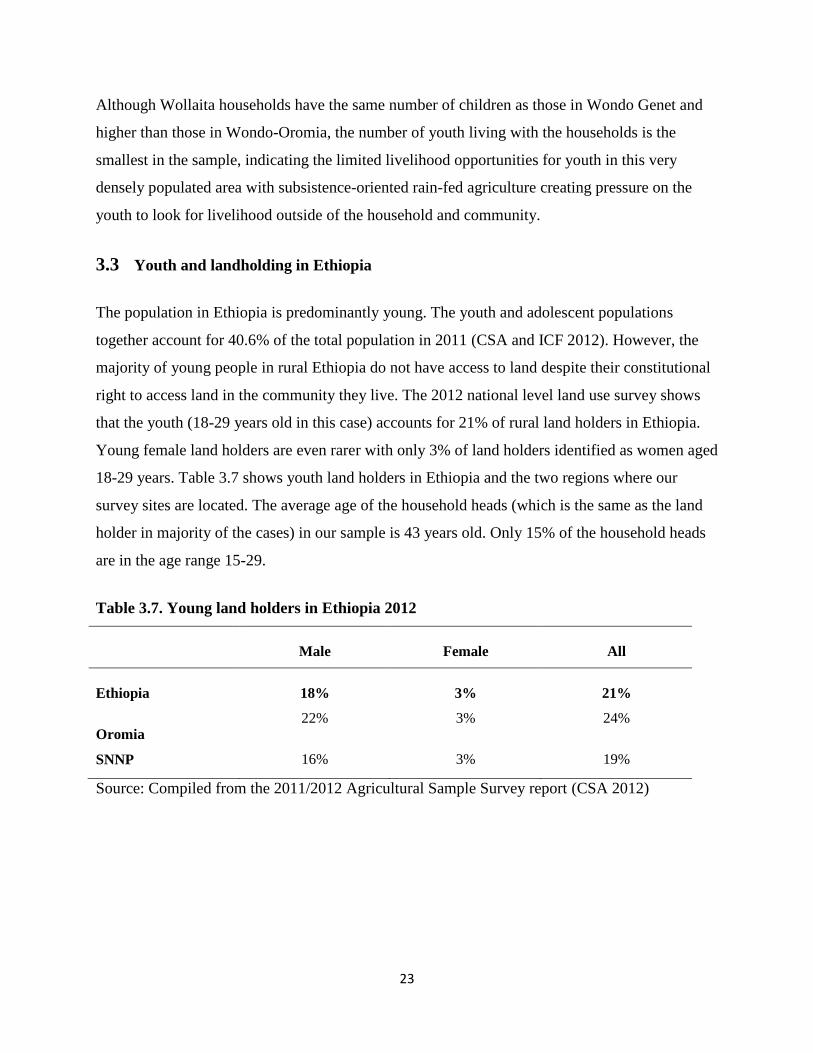
3.3 Youth and landholding in Ethiopia
The population in Ethiopia is predominantly young. The youth and adolescent populations
together account for 40.6% of the total population in 2011 (CSA and ICF 2012). However, the
majority of young people in rural Ethiopia do not have access to land despite their constitutional
right to access land in the community they live. The 2012 national level land use survey shows
that the youth (18-29 years old in this case) accounts for 21% of rural land holders in Ethiopia.
Young female land holders are even rarer with only 3% of land holders identified as women aged
18-29 years. Table 3.7 shows youth land holders in Ethiopia and the two regions where our
survey sites are located. The average age of the household heads (which is the same as the land
holder in majority of the cases) in our sample is 43 years old. Only 15% of the household heads
are in the age range 15-29.
Table 3.7. Young land holders in Ethiopia 2012
Male Female All
Ethiopia 18% 3% 21%
Oromia 22% 3% 24%
SNNP 16% 3% 19%
Source: Compiled from the 2011/2012 Agricultural Sample Survey report (CSA 2012)

24
Table 3.8. Youth involvement in household agricultural production and information on inherence by district
Percentage of households that respond yes to these questions
Shashemene
Arsi
Negelle
Wondo
Genet Wollaita
Wondo
Oromia All N
Sons and daughters participate in household farm activity 76 78 78 52 63 68 606
If they do, type of farm engagement :
As family labor 83 83 96 81 96 86 407
Co-managing the farm 16 15 4 15 4 12 407
Siblings co-manage farm land (family’s or otherwise) 26 31 8 9 5 17 557
Children were informed who may inherit the land 67 60 34 32 43 46 608
Observe or expect competition for the family land 42 42 28 13 48 30 610
Source: Own data

25
In the majority of the households the sons and daughters participate in agriculture in some
capacity. The least participation of own children in household farm activity is observed in
Wollaita where only half of the household heads reported such participation followed by Wondo-
Oromia (63%). For the other districts about three-fourth of the households reported children
participation in own agricultural activities. For 86% of the households this participation is mainly
in the form of family labor while in 12% of cases children co-manage farm with parents. The rate
of co-management with parents in Shashemene and Arsi Negelle is about 16% against only 4%
for Wondo Genet and Wondo-Oromia. Wollaita, although similar in land size to Wondo Genet,
has the fewest youth participating in own agriculture It has comparable percentage of children-
parent co-management of land as Shashemene and Arsi Negelle. Given the larger land holding in
the two Oromia districts and a proportionately smaller participation of youth in farming in
Wollaita, it appears that youth that engage in co-managing the land with parents may be the ones
who intend to make agriculture a livelihood. The livelihood issue and its relation with land
access are explored in more detail in section 3.7.
3.4 Land access options for the youth
As land cannot be bought or sold in the market in Ethiopia, there are only two sources of long
term land access for youth. The first one is land allocation from the authorities and the second
one is inheritance from parents or other relatives.
3.4.1 Land allocation from authorities
The constitutional right to land for residents of rural communities that depended on land for
livelihood was established as part of the 1975 radical land reform in Ethiopia. With population
growth this constitutional right was ensured through redistribution of land within communities as
new young households established and demanded land. First they were allocated some of the
remaining surplus land that had not yet been allocated to individual households. Later, as this
type of land got scarce, land had to be redistributed from relatively land abundant households to
ensure and maintain an egalitarian land distribution within communities (Holden and Yohannes,
2002). With the abolition of the redistribution policy after the change in government in 1991 and
due to increase in land scarcity it has become more and more difficult for youth to access land.

26
Most rural communities have a long waiting list of youth that have applied to get land in the
community. In many places they have started to give them a small plot for building a house but
too small to be used for farming purposes.
In our sample, a total of 95 youth reported to have secured some kind of access to farm land.
However, only 6 obtained land from the land administrative authorities. This demonstrates that
land access no longer serves as a safety net for youth.
3.4.2 Inheritance from parents
Household heads were asked if they have transferred any land to their children so far. Table 3.9
shows that 35% of the households reported that they have done so. Consistent with their larger
land holding size, proportionately more households in Shashemene and Arsi Negelle bequeathed
land to their children than household in other sites. The proportion of households in Wollaita that
bequeathed land to their children is the lowest of the five districts. Only 24% of households in
Wollaita had transferred some land to their children while in Arsi Negelle 47% have done so.
But the average farm size in Arsi Negelle is also almost three times that of Wollaita.
When it comes to plans for future transfer of land (Table 3.10) the majority of the households
heads report that they intend to bequeath at least part of the land while they are alive and the
difference among the districts is not big or systematic. Household heads expect to transfer on
average half of their land holding during their lifetime. The median share for Arsi Negelle is
somewhat smaller at 45% but as we saw earlier, Arsi Negelle also had the highest number of
households who had already transferred some part of their land to their children.

27
Table 3.9. Past land bequeath and current farm sizes by district
District Gave to children part of
farm in the past (%)
Average farm size
(hectares) Total
Shashemene 46 1.15 102
Arsi Negelle 47 1.38 145
Wondo Genet 33 0.55 122
Wollaita 24 0.52 197
Wondo Oromia 30 0.84 40
All 35 0.86 603
Source: Own survey data
Table 3.10. Future land bequeath by district
District
Households planning to
bequeath land while
alive (percentage)
Share of farm to be transferred
N Mean Median
Shashemene 90 0.47 0.50 89
Arsi Negelle 82 0.46 0.45 109
Wondo Genet 87 0.47 0.50 102
Wollaita 90 0.46 0.50 172
Wondo Oromia 93 0.42 0.50 36
All 88 0.46 0.5 508
Source: Own survey data
Table 3.11 reports what types of farm plots households prefer to transfer to their children.
Parents do not appear to be seeking to transfer their less desired land. Proportionately more
people plan to give the land closer to homestead (40%) than land further away from the
homestead (30%). Only 3% of household heads indicated that they will transfer the less fertile
land as opposed to 13% who reported the intention to transfer the more fertile land.

28
Table 3.11. Plots household heads prefer to bequeath to their children
Type of plot Respondent (%)
Plots further from homestead 30
Plots closer to homestead 40
The less fertile land 3
The more fertile land 13
No particular choice 12
Other criterion 2
Total 100
Source: Own survey data
It appears that parents have to hold on to their land to maintain their family and transfer part of
their land as the need arises. With the new legal restrictions on farm sizes of 0.5 hectares in the
annual cropping systems (Shashemene, Arsi Negelle and Wondo-Oromia) and 0.25 hectares in
the perennial zones (Wollaita and Wondo Genet) this may imply only informal land transfers to
children in case of very small farm sizes.
We asked the parents and the youth for their opinion on the most appropriate ‘time’ to transfer
land from parents to children. Table 3.12 summarizes the responses for both parties. Most of the
parents and youth believe that marriage is the most appropriate occasion for a transfer of land
from parent to children. However, proportionately more parents (60%) than youth (46%) choose
marriage as the most appropriate time for land transfer. On the other hand, the percentage of
youth who elected adulthood as the most appropriate time for land transfer is 35%, 10 percentage
points higher than parents that elected the same. In general while marriage seems to be the
accepted time that most parents and children expect the land transfer to happen, the youth prefer
the transfer to happen earlier while the parents’ preference is in direction of a later transfer.

29
Table 3.12. Appropriate time to transfer land from parents to youth
Parents' opinion Youth's opinion
Freq. Percent Freq. Percent
At marriage 340 55.9
277 46.3
When both parents die 60 9.9
24 4.0
When the father dies 6 1.0
6 1.0
When either parent die 17 2.8
11 1.8
When son/daughter become an adult 153 25.2
210 35.1
After son/daughter finish high school and is
unemployed 23 3.8
64 10.7
Other 9 1.5
6 1.0
Sample 608 100 598 100
Source: Own survey data
3.5 Land bequeath to female children
Currently only 3 % of all land holders in Ethiopia are young female holders as we saw in Table
3.7 (CSA, 2012). The Ethiopian land laws provide equal land acquisition and use rights to male
and female citizens. But whether or not girls and women will practically have equal access to
land will depend on the decision of the potential sources of land. Our question for household
heads on this issue reveals that most girls and young women will not be inheriting from their
parents (Table 3.13). 73% of the household heads in our sample admit that none of their
daughters will ever inherit land from them. In Wollaita, where farm sizes are very small, only
6% of household heads have any intention to bequeath land to their daughters. Households in
Oromia, including those in Wondo-Oromia district, are more likely to bequeath land to their
daughters. It appears that the traditional partilineal land inheritance system is not likely to change
in the short run.

30
Table 3.13. Households who intend to bequeath land to female offspring
District Percentage
Shashemene 34.7
Arsi Negelle 43.8
Wondo Genet 30.9
Wollaita 6.1
Wondo Oromia 42.5
All households 27.2
Source: Own survey data
We expected that land certification increases the probability of daughters inheriting land from
parents as their names are typically registered in relation to households’ land holding and on the
land certificates. However, this does not seem to make any difference in the study areas. The
proportion of household heads who intend to bequeath land to their daughters does not differ by
their land certificate status. Similarly, female-headed households are not more likely to bequeath
land to their daughters. In fact, the proportion of female-headed households is smaller in the
inheritors group, although the difference is significant only at 10%. But it seems that education
has better impact on land inheritance to daughters. Household heads in daughter inheriting
households have on average 4 years of education while those who will not inherit have an
average of 2.8 years of education and the difference is statistically significant at 1% level of
significance. Daughter inheriting households also have higher per capita land holding indicating
that land scarcity may contribute to households excluding their daughters from inheritance.
Table 3.14. Household characteristics by decision to inherit female children in the future
Will daughters inherit? Significant
test Household character No Yes Total
Education of household head(yrs) 2.80 4.10 3.16 ****
Age of household head 43.44 44.30 43.67
Female headed household (yes=1) 0.12 0.08 0.11 *
Per capita land holding (hectares) 0.13 0.18 0.14 ****
Household have land certificate 0.82 0.84 0.83
Source: Own survey data

31
But what do the female youth themselves think about this? Table 3.15 provides some evidence.
Young women have lower expectation regarding land inheritance than their brothers/male
counterpart, but their expectation is certainly higher than their parents are ready for. While 74%
of young men who have not previously received land from their parents expect to inherit in the
future, only 41% of young women do. Young women are also less likely to engage in
agricultural activity on the family farm. While 89% of young men engage in household farm
activity in some capacity, only 67% of young women do. The lower farm involvement is perhaps
due to the gender division of labor in Ethiopia where women are typically primarily responsible
for household chores. But the lower expectation to inherit land may contribute to disinterest on
the part of the female youth and their parents to engage them in agriculture. These differences
are highly statistically significant.
Table 3.15. Male and female youth land expectation and farm participation
Male
Youth
(%) N
Significant
test
Female
Youth
(%) N
All sample
(%)
Participate in household farming 89 353 **** 67 242 80
Try to get land access 45 350 **** 23 242 36
Expect land from parent 74 310 **** 41 235 60
Source: Own survey data
3.6 Small land, many inheritors
As we have seen so far, farm sizes in our study areas are small relative to their household size.
Table 3.16 shows how much land each offspring may receive if land was to be divided equally
after the death of their parents or in the event that parents choose to transfer all land and retire.
The 2005 land law states that “where rural land is transferred by succession, it shall be made in
such a way that the size of the land to be transferred is not less than the minimum size holding”
(FDRE, 2005, Section 11-2). In both Oromia and SNNP, the minimum holding size is 0.5
hectares for rain-fed agriculture with annual crops (Holden and Tefera 2008).

32
Table 3.16. Farm size in relation to potential inheritors
SNNP Oromia Total
Mean, ha N Mean, ha N Mean, ha N
Farm size/household size 0.09 322 0.20 287 0.14 609
Farm size/Own children living with
the household 0.14 298 0.30 278 0.22 576
Farm size/Male offspring living
with the household 0.25 280 0.53 266 0.39 546
Source: Own survey data
What is clear from Table 3.16 is that if all sons and daughters of the household inherit, there is
not enough land to meet the minimum holding size requirement or to make a meaningful
livelihood out of it. Even if farmers are to bequeath all land only to their male children, the
average land that each receives will still be below the minimum size for a large share of the
households. Under these circumstances one option of maintaining land access for all the children
will be co-management where the land is registered as a single unit with all inheritors’ names
listed as holders on the land certificate. This will solve the problem with minimum legal holding
size but not necessarily the concern for household food security unless supplementary sources of
income can be found.
To make a meaningful livelihood out of the small farm sizes some of the inheritors may also
willingly give up their entitlement on the land or the parents may decide to bequeath the land to
only some of their children. Our survey indicates that such options have been adopted by some
of the households. Interview with the youth indicated that 40% of the youth who have not
received land from their parents do not expect to inherit in the future (see Table 3.15) and
proportionately fewer women expect to inherit land. For both male and female youth the
expectation of land inheritance is lower in the poorest districts (Wollaita and Wondo - Oromia).
Alternatively, as is common in many other countries, one of the inheritors may compensate the
other for their share and keep the land. We have no evidence of this kind of arrangement among
our sample households. These land transfer issues are increasingly pressing issues where some
regulation may help to reduce sibling competition and within-household conflicts. Such stress

33
factors could affect the level of trust, generosity and willingness to cooperate on land
management within families. Better off-farm employment opportunities due to rapid economic
growth in the country may reduce the pressure and facilitate that youth can find other livelihood
opportunities outside their family farm.
3.7 Land co-management with siblings and parents
As we have indicated earlier co-management of land is likely to increase in importance as further
land division violates the minimum land holding legislated in the land laws. Already we observe
significant co-management of land in our sample. 36% of youth reported that they have co-
managed land with their parents and 21% with their siblings. The percentage of youth that co-
managed land with their siblings is not much different across the different zones but
proportionately more youth co-managed land with their parents in Western Oromia than in the
two SNNP zones Sidama and Wollaita.
The results from the interview indicate that conflicts with parents and siblings with whom the
youth co-manage land are not very common. 72% of those who co-manage land with parents and
70% of those who co-manage land with siblings reported that they have never experienced
conflict (Table 3.17). In general, conflict experiences are more common in Wollaita where only
38% of youth reported never to have experienced conflict.

34
Table 3.17 Land co-management and conflict experience with siblings and parents
Youth land co-management experience
Percentage of youth respondent
Oromia Sidama Wollaita All
Co-managed land with siblings 21 24 20 21
Conflict experience during co-management
frequent 5 0 3 3
Sometimes/rarely 18 15 59 27
Never 77 85 38 70
Co-managed land with parents 49 18 23 36
Conflict experience during co-management
frequent 5 0 3 4
Sometimes/rarely 17 18 59 23
Never 78 82 38 73
Source: Own survey data
3.8 Land scarcity and youth livelihood strategies
Most of the youth from the rural areas we studied do not plan to follow the footsteps of their
parents. Table 3.18 summarizes what the youth reported as their planned or preferred future
livelihood strategy.
Only nine percent of the youth state farming as their preferred future livelihood as can be seen
from Table 3.18. The rest wants to go for higher education in a bid to earn a livelihood outside of
agriculture or want to have their own business either in the same district or outside and plan and
hope for other non-agricultural livelihood.

35
Table 3.18. Summary of preferred livelihood choices by youth in Southern Ethiopia
Livelihood Choice Freq. Percent
Farming 56 9.4
Non-farm wage employment 17 2.9
Non-farm self-employment and business 177 29.9
Urban salaried employment 343 57.8
Total 593 100
Most of those who intend to engage in farming either plan to take over the farm from parents or
farm together with parents. Although resettlement has been considered a way out of the land
scarcity problem particularly in SNNP, only 1 person in our sample plans to resettle. It may be
because resettlement is not something that they can plan on as the authorities are the ones that
decide whether to have a resettlement program, the place of resettlement and who should be
allowed to resettle. But this may also be an indication of lack of interest in or knowledge of the
resettlement opportunity. Urban salaried employment includes those who want to work in
government offices or private companies. About half of these want to go for higher education as
the first step.
Table 3.19 summarizes resource endowment of the parents in each for each type of livelihood
choice. The parents of the youth that choose farming as a livelihood have the largest land
holding. When we compare the resources for those who chose livelihood outside of agriculture,
we see that the youth that want to go for urban salaried employment come from relatively
wealthier families while those who chose off-farm wage employment appear to come from poor
families.

36
Table 3.19. Land holding and wealth of parents of the youth by livelihood choice
Livelihood Choice
Landholding
(in hectares)
Current and durable
assets (in’000 EB5)
Livestock holding
(in TLU)
Median Std. Dev Median Std. Dev Median Std. Dev
Farming 1.25 0.92 1750 27.87 2.19 3.65
Off-farm wage employment 0.50 0.88 720 1.02 2.57 2.23
Non-farm self-employment
and business 0.75 0.80 1845 23.60 2.10 4.23
Urban salaried employment 1.00 0.88 2025 67.62 2.80 5.31
Total 0.88 0.86 1901 16.23 2.40 4.81
This statistics seem to be in line with earlier studies of nonfarm employment in Ethiopia where
unskilled off-farm wage employment is shown to be the least paying of the nonfarm employment
opportunities and attracts the most desperate ones because it does not have an entry barrier
(Woldenhanna and Oskam 2001, Bezu and Barrett 2012). However, entry barriers may even
exist for unskilled off-farm wage employment in Ethiopia due to search costs, seasonality in
access, and risk/uncertainty related to finding such employment (Holden et al. 2004).
To analyze the factors driving a livelihood choice in more detail, we estimated a multinomial
model where we explore the correlation between individual and household characteristics and
livelihood choices. The result from the multinomial model is reported in table 3.20. We
estimated two models progressively including more variables to assess the correlations. The first
model includes individual characteristics of the youth, per capita landholding and household
characteristics. These factors are expected to influence how one views farming and the potential
success in agricultural and non-agricultural livelihood. The second model includes siblings’
involvement in business, migration and nonfarm employment in rural areas since these also may
affect the youth information, network, experience and motivation. The second model also
includes district dummies to test if livelihood choice differs by the place of residence in rural
areas. The district dummies also control for different access to infrastructure, information and
agro-ecological conditions. Because we have more than one youth per household, the standard
5 EB is Ethiopian Currency Ethiopian Birr. 1USD = 19EB

37
errors are corrected for clustering at household level. The likelihood statistics show that inclusion
of the additional factors improves the explanatory power of the models. The results are otherwise
largely consistent across the two models. The reference livelihood category in the reported model
is farming.
First we discuss the coefficient on the farm size variable. The magnitudes of coefficients in a
multinomial model are difficult to interpret directly (Wooldridge 2002), but we are most
interested in the direction of correlation between livelihood choice and the covariates. Looking at
the magnitudes should be enough to evaluate the relative importance. Farm size has a
consistently negative and statistically significant correlation with choice of livelihood outside of
agriculture. An increase in the per capita farm size of the household decreases the likelihood of
young men and women to choose livelihood outside of agriculture. This indicates that an
important factor driving rural youth away from farming is lack of land access. The marginal
effect on farm choice (given in Appendix 2) shows that farm size has the highest marginal effect
on the probability of the farming choice.
Moving to other covariates, we see that young women are more likely to choose urban salaried
employment relative to farming. This is perhaps the cultural influence since in most parts of
Ethiopia agriculture is typically men’s domain. Controlling for the age factor younger
respondents who are currently studying are more likely to choose the urban salaried employment
than those who are not students anymore. This may be because they have yet a higher hope of
achieving their objective through education than those who are not studying anymore. More
education in terms of number of years of successfully completed grades increases the likelihood
of choosing urban salaried employment. This is perhaps because in addition to the impact of
information on one’s interest, increase in educational achievement increases one’s expectation of
success in the urban sector. Education is also positively correlated with the likelihood of
choosing off-farm wage employment and business but the coefficients are significant only at
10% level. First born children are less likely to engage in off-farm wage employment in relation
to farming but this does not affect their decision related to other livelihoods. This may be
because first born children are more likely to inherit land and hence may prefer to work in
farming rather than in off-farm wage employment, further indicating to the land access concern.
Married youth are less likely to choose urban salaried employment as a livelihood option.

38
Married people have family responsibilities and are therefore more likely to settle for what is
available in the village. Marital status also has a negative correlation with off-farm business but
is statistically significant only at 10%.
Household characteristics have little effect on livelihood choice except assets owned. The value
of assets owned by the household to which the young person belongs was negatively correlated
with the likelihood of choice of off-farm wage employment as a livelihood. This may indicate
that better-off households prefer agriculture to off-farm wage employment. We also found that
having brothers and sister who are engaged in business was positively correlated with the
likelihood of choosing off-farm business.
Compared to Shashemene, young people from Arsi Negelle and Wollaita were more likely to
choose off-farm business and salaried employment than agriculture. This may be an indication
that farming activity in Shashemene is more rewarding than in these other two districts. Farming
in Wollaita is subsistence oriented and farm size in the area is very small. And, while farms in
Arsi Negelle are on average larger, some of the villages have been food insecure over the past
indicating poor performance of agriculture.
Youth in Wondo Genet were less likely to choose off-farm wage employment than farming. This
is to be expected since Wondo Genet is a cash crop production area where agriculture perhaps
yields higher returns than off-farm wage employment. On the other hand young people in
Wollaita are more likely to choose off-farm wage employment perhaps due to the higher level of
poverty in these districts, severe land scarcity and therefore stronger push towards low-pay off-
farm livelihood opportunities. Similar positive correlation is observed for Wondo-Oromia,
perhaps for the same reason but it is significant only at 10% level.

39
Table 3.20. Multinomial model of determinants of livelihood choice by female and male youth in Southern Ethiopia
Off-farm wage employment Off-farm self
employment and business Urban salaried employment
Variables Model 1 Model 2 Model 1 Model 2 Model 1 Model 2
Female youth -0.333 0.087 0.306 0.491 0.740* 0.950**
(0.70) (0.74) (0.41) (0.43) (0.40) (0.43)
Age -0.108 -0.144 -0.013 -0.031 -0.087 -0.100
(0.11) (0.11) (0.06) (0.06) (0.06) (0.07)
Education (years) 0.265 0.362* 0.067 0.116* 0.229**** 0.274****
(0.18) (0.19) (0.05) (0.06) (0.06) (0.07)
Currently student 0.930 1.303 -0.108 0.131 1.872**** 2.298****
(0.92) (1.06) (0.43) (0.44) (0.44) (0.46)
First born -14.213**** -15.475**** -0.416 -0.283 -0.175 -0.087
(0.48) (0.52) (0.42) (0.44) (0.42) (0.44)
Married -0.927 -0.650 -0.661 -0.459 -1.384*** -1.159**
(1.02) (0.96) (0.45) (0.45) (0.50) (0.53)
Farm size -5.329* -7.559* -2.691*** -2.616*** -2.205*** -2.703***
(2.99) (4.35) (0.86) (0.86) (0.70) (0.91)
Age of household head -0.019 -0.005 0.003 0.007 0.007 0.013
(0.02) (0.02) (0.01) (0.01) (0.01) (0.01)
Education of household head(years) 0.127 0.072 -0.080 -0.112* -0.010 -0.054
(0.11) (0.11) (0.05) (0.06) (0.06) (0.07)
Number of brother and sisters -0.001 0.028 0.030 0.037 0.035 0.051
(0.13) (0.16) (0.09) (0.09) (0.09) (0.09)
Livestock holding (tlu) -0.004 -0.069 -0.025 -0.012 0.006 0.002
(0.05) (0.11) (0.04) (0.04) (0.03) (0.03)
Value of asset owned -1.074** -1.018** 0.155 0.311 -0.037 0.119
(0.45) (0.44) (0.15) (0.21) (0.16) (0.21)

40
Number of sibling migrated
-0.362
-0.112
-0.175
(0.34)
(0.17)
(0.16)
Number of siblings in business -0.173
0.739**
0.568
(0.86)
(0.37)
(0.38)
Number of sibling in nonfarm employment 0.436
0.054
-0.088
(0.59)
(0.17)
(0.18)
Arsi Negelle
1.825
1.088**
1.654***
(1.39)
(0.54)
(0.51)
Wondo Genet
-14.682****
0.448
0.349
(1.30)
(0.59)
(0.64)
Wollaita
2.408**
1.701***
2.030***
(1.14)
(0.60)
(0.65)
Wondo-Oromia
3.618*
0.527
1.598**
(2.09)
(0.63)
(0.64)
Constant 8.005** 6.141 0.502 -1.929 0.804 -1.884
(3.57) (4.15) (1.62) (1.93) (1.77) (2.06)
Prob > chi2
0.000 0.000 0.000
Loglikelihood
-472.458 -407.336 -400.825
Number of Obs.
566 535 535
Note: The reference livelihood strategy (base outcome) is agriculture. The reported values are coefficients followed by standard errors
in parenthesis. Significance levels: *: 10%, **: 5%, ***: 1%, ****: 0.1%.

41
In summary it appears that young people choose unskilled off-farm wage employment as a
result of desperation because of lack of land access and viable livelihood opportunities (push
factors), while the urban salaried employment seems to be an attractive opportunity for those
with resources, education and flexibility to explore such opportunities (pull factors). This is
in line with findings in the income diversification literature which documents that
participation in unskilled off-farm wage employment is driven by poor performance and risk
in the agricultural sector (see Reardon 1997).
3.9 Land scarcity and migration
We will now assess factors associated with the recent migration of youth from our study
areas. We distinguish between the different locations to which household youth members
have migrated. Table 3.21 gives an overview by sample origin and destinations. The values in
the table represent the percentage of youth population in the sample that has migrated to
different locations. We see that 15% of the youth and adolescent in 2007 have migrated by
2012.
Table 3.21. Overview of youth migration from study areas
District Name
Migration by destination
(% of youth who migrated)
Abroad Addis Ababa Other city
Other Rural
Areas All N
Shashemene 1.2 0 1.2 2.1 4.6 241
Arsi Negelle 2.5 1.2 6.2 1.2 11.2 401
Wondo Genet 0.6 2.5 3.4 0 6.5 325
Wollaita 0.2 5.1 21.6 4.4 31.3 450
Wondo Oromia 0 0 1.6 0 1.6 64
Total 1.1 2.4 9.3 2 14.8 1481
Note: Percentage of youth and adolescent (10-30 years old) who migrated between 2007 and 2013
Source: Own data
We see that Wollaita has the largest migration rate, 31%, of the 10-30 year-olds in2007 have
migrated by 2012. The majority migrated to urban areas other than Addis Ababa. From
informal discussions we learned that youth from Wollaita has in the recent years ‘taken over
the shoe shiner market’ in Addis Ababa indicating that the high level of migration in our
sample is not an exception. This is a remarkable change in a few years showing that this type

42
of migration can really explode when the internal population pressure in a subsistence
community has reached a level beyond its carrying capacity. With continued rural population
growth more and more rural communities will soon reach similar and comparable situations
for their youth populations.
Arsi Negelle is the district with second most outmigration of youth with 11% youth migration
in our sample households. This is an area with less population pressure but it is favorably
located along the main road between Addis Ababa and Awassa and pull factors may here be
more important than push factors. The entry barrier may also be lower here for the youth due
to the favorable location reducing their search and travel costs related to exploring the off-
farm opportunities. Overall, we see that most of the youth migration is rural-urban, as only
2% of the youth have migrated to other rural areas while total migration was 15% of the
youth.
To further assess the various individual, household and district factors associated with youth
migration we ran probit models for the decision to migrate. We report in Table 3.22 results
from probit model on all migration and a separate estimation for the dominant type of
migration- rural-urban migration.6 The first models include individual and household level
determinants while the second model further incorporate the district dummies as they capture
meso-level determinants such as infrastructure, market access, population pressure and agro-
ecology.
Table 3.22 shows that education is a strong driver of youth migration. Education level was
strongly positively associated with all kinds of migration. Education brings information about
opportunities outside of one’s immediate surrounding and raises expectation for better life
there by encouraging youth to explore new opportunities.
We see that the farm size variable has a negative sign and show statistical significance in the
rural- urban migration and all migration models. This indicates that households with smaller
farm sizes are more likely to see their youth members migrate. However, the farm size
variable becomes insignificant when we include district dummies. This is perhaps because
farm sizes are strongly correlated with the district dummies. Particularly, the Wollaita
dummy is likely to capture the farm size effect. An alternative aspect and interpretation of the
6 In the appendix we report the result from the probit estimation for international migration
43
vanishing significance after including the district dummies is that youth may not migrate
alone and this may be a wise strategy when they go to unexplored territory. Smaller
individual farm size variation within communities may then not be as important for the
migration decision as whether individual youth have other youth in the community that s/he
may coordinate migration with.
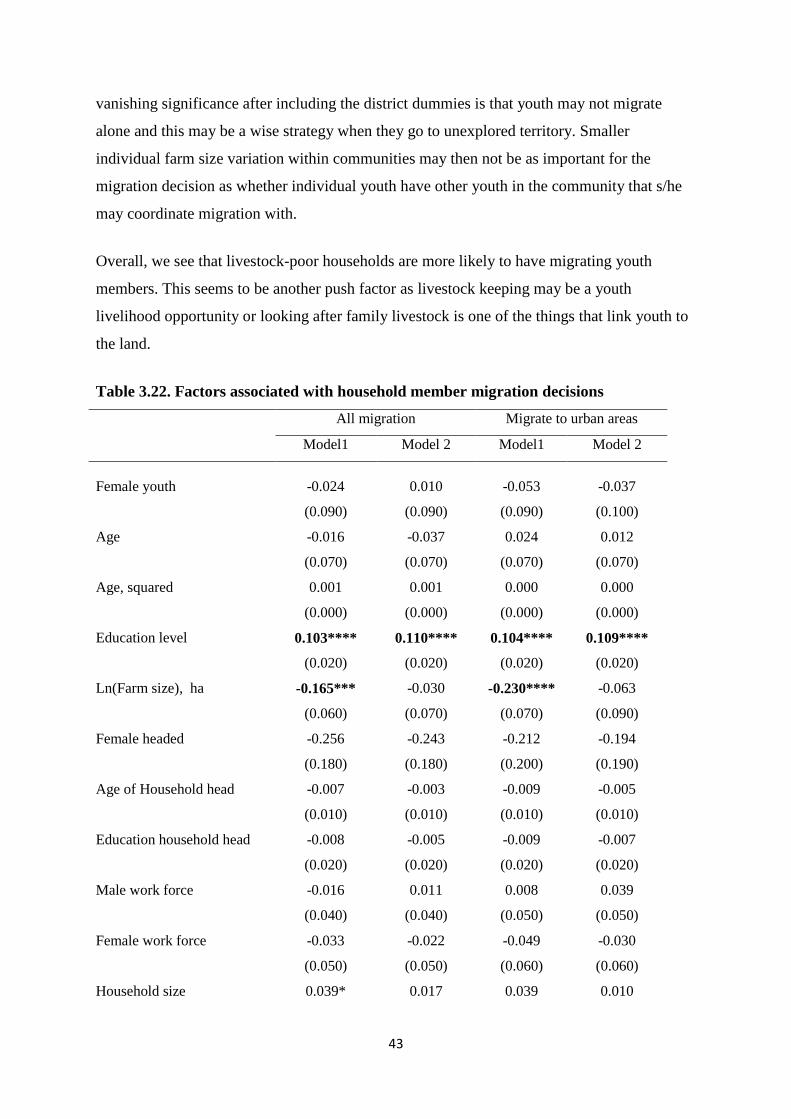
Overall, we see that livestock-poor households are more likely to have migrating youth
members. This seems to be another push factor as livestock keeping may be a youth
livelihood opportunity or looking after family livestock is one of the things that link youth to
the land.
Table 3.22. Factors associated with household member migration decisions
All migration Migrate to urban areas
Model1 Model 2 Model1 Model 2
Female youth -0.024 0.010 -0.053 -0.037
(0.090) (0.090) (0.090) (0.100)
Age -0.016 -0.037 0.024 0.012
(0.070) (0.070) (0.070) (0.070)
Age, squared 0.001 0.001 0.000 0.000
(0.000) (0.000) (0.000) (0.000)
Education level 0.103**** 0.110**** 0.104**** 0.109****
(0.020) (0.020) (0.020) (0.020)
Ln(Farm size), ha -0.165*** -0.030 -0.230**** -0.063
(0.060) (0.070) (0.070) (0.090)
Female headed -0.256 -0.243 -0.212 -0.194
(0.180) (0.180) (0.200) (0.190)
Age of Household head -0.007 -0.003 -0.009 -0.005
(0.010) (0.010) (0.010) (0.010)
Education household head -0.008 -0.005 -0.009 -0.007
(0.020) (0.020) (0.020) (0.020)
Male work force -0.016 0.011 0.008 0.039
(0.040) (0.040) (0.050) (0.050)
Female work force -0.033 -0.022 -0.049 -0.030
(0.050) (0.050) (0.060) (0.060)
Household size 0.039* 0.017 0.039 0.010

44
(0.020) (0.030) (0.030) (0.030)
Livestock (in tlu) -0.048*** -0.029** -0.061*** -0.037
(0.020) (0.010) (0.020) (0.020)
District dummies: Baseline=Sashemene
Arsi Negelle 0.365** 0.805**
(0.180) (0.390)
Wondo Genet -0.073 0.493
(0.240) (0.380)
Wollaita 1.102**** 1.620****
(0.180) (0.350)
Wondo Oromia -0.428 0.283
(0.400) (0.510)
Constant -1.206* -1.731** -1.688** -2.726****
(0.630) (0.680) (0.680) (0.790)
Prob > chi2 0.000 0.000 0.000 0.000
Loglikelihood -541.32 -486.03 -448.72 -395.69
Number of observations 1393 1393 1393 1393
Note: Probit estimates of migration decision for adolescents and youth (age >10 & <30) 2007-2013.
Standard errors corrected for clustering at household level. Significance levels: *: 10%, **: 5%, ***:
1%, ****: 0.1%.
3.10 Land scarcity and nutritional outcome for youth
We wanted to assess how land scarcity affects the nutritional status of youth staying on the
farms and whether the nutritional status is poorer for youth staying on very small farms. Such
a finding could signal a kind of Malthusian effect and a poverty trap. We have regressed the
Body Mass Index (BMI) of youth on individual, household and district dummy variables. The
results are presented in Table 3.22. BMI captures the current nutritional situation in the
communities and is thus a short-term measure.
Table 3.23 indicates that farm size is not significantly correlated with BMI. Three of the
district dummies (Arsi Negelle, Wondo Genet and Wondo Oromia) were significant at 1%
level and with negative signs compared to the baseline district Sashemene while Wollaita was
insignificant and with a positive sign the BMI for youth in Wollaita is comparable to that of
the well-off district Shashemene. This seems to indicate that Wollaita is out of the Malthusian
poverty trap at least in the short-run perspective as migration seems to provide a sufficient

45
vent for the population pressure. BMI is higher for older youth.Table 3.23. Factors
associated with Body Mass Index (BMI) of youth staying on their family farm
Coefficient Robust st. err.
Female, dummy 0.366 0.551
Age of youth 0.115 ** 0.049
Age of household head 0.005 0.013
Education household head -0.08 0.121
Female headed household -1.375 1.394
Farm size per capita -0.369 0.379
Total household size -0.051 0.085
District dummies: Baseline=Sashemene
Arsi Negelle -1.662 *** 0.513
Wondo Genet -1.646 *** 0.48
Wollaita 0.646 1.615
Wondo Oromia -2.097 *** 0.507
Constant 19.57 *** 2.023
Prob > F 0.000
R-squared 0.0237
Number of observations 584
Note: OLS of BMI, controlling for clustering at household level. Significance levels: *: 10%, **: 5%,
***: 1%, ****: 0.1%.
As an additional test we have assessed factors correlated with the probability that youth are
underweight where underweight is identified as individuals with BMI<18.5. The results of a
probit model are presented in Table 3.24.
The results are quite consistent with those in Table 3.23. Land holding was not correlated
with short term nutritional status of the youth in our sample. Table 3.24 shows in addition
that female youth on the farm has a lower likelihood of being underweight than male youth.
Older youth are also less likely to be underweight than younger youth. Both these variables
were significant at 1% level. For the district dummies it appears that youth in Sashemene (the
baseline district) were less likely to be underweight than those in other districts.
Table 3.24. Factors associated with underweight youth (BMI<18.5)

46
Coefficient Robust st. err.
Female -0.331 *** 0.122
Age of youth -0.101 *** 0.021
Age of household head 0.006 0.004
Education household head -0.004 0.019
Female headed household -0.062 0.199
Land holding per capita 0.058 0.105
Total household size -0.013 0.022
District dummies: Baseline=Sashemene
Arsi Negelle 1.017 *** 0.247
Wondo Genet 0.766 ** 0.298
Wollaita 0.497 * 0.296
Wondo Oromia 0.937 *** 0.35
Constant 0.533 0.488
Chi2 statistic 50.194
Prob > chi2 0.000
Number of observations 594
Note: Probit model of underweight (BMI<18.5) controlling for clustering at HH level. Significance
levels: *: 10%, **: 5%, ***: 1%, ****: 0.1%.
While BMI is a short-run measure of nutritional status, height (stunting) captures long-run
effects of under-nutrition. We therefore also implemented an assessment of the variation in
height and whether it is related to land scarcity. The results for models with district fixed
effects and community (kebelle) fixed effects are presented in Table 3.25.
We see that average height of females is about 7.5 cm less than that of male youth which is
not surprising. Farm size was only significant in the model with village fixed effects and
there it was only significant at 10% level. The sign is positive as could be expected and
indicates that land scarcity has been associated with poorer nutrition situation for youth in the
past. The cash cropping district Wondo Genet is associated with better long-term nutritional
status of its youth population. Farm sizes are as small in this area as in Wollaita. Growing of
cash crops therefore seems not to have negatively affected the nutritional situation of
children, rather to the contrary. However, better access to irrigation in this area does not only
stimulate cash crop production but can also stimulate food crop production. Another
interesting result is that female-headed households have taller children than male-headed
households. This result was consistent across the two models although significant only at

47
10% level in both models. Youth from female-headed households were on average about 2.4
cm taller than youth from male-headed households. It is possible that female heads of
households give more emphasis to food access for their children than mothers in male-headed
households are able to but we cannot be sure that this is the reason as female headship could
also be correlated with a number of other factors. We included the coefficients of the village
fixed effects in the table to demonstrate the large variation in height across communities
which is an indication of considerable variation in stunting across communities, something
which was not so obvious from the model with district fixed effects. These village dummies
are also likely to be correlated with variation in farm sizes across communities.
Table 3.25. Factors associates with height of youth in cm
With district FE With village FE
Coefficient Robust
st. err.
Coefficient Robust
st. err.
Female, dummy -7.427 *** 0.843 -7.45 *** 0.83
Age 0.809 *** 0.104 0.784 *** 0.105
Age of HH head -0.011 0.02 -0.011 0.019
Education HH head 0.129 0.129 0.173 0.132
Female headed 2.437 * 1.261 2.377 * 1.251
Farm size, ha 0.429 0.564 0.874 * 0.526
Household size 0.021 0.113 -0.022 0.136
District dummies: Baseline=Sashemene
Arsi Negelle 1.847 1.324
Wondo Genet 3.147 ** 1.448
Wollaita -2.253 1.543
Wondo Oromia 0.543 1.612
Community fixed effects:
_Ikebelle_3 -3.908 ** 1.868
_Ikebelle_4 -7.226 *** 2.531
_Ikebelle_5 -4.946 ** 2.085
_Ikebelle_6 -2.745 1.883
_Ikebelle_7 -0.764 1.854
_Ikebelle_8 -2.192 1.705
_Ikebelle_9 -2.587 3.2
_Ikebelle_10 -4.696 ** 2.239
_Ikebelle_11 -6.066 *** 2.186

48
_Ikebelle_12 -5.052 ** 2.03
_Ikebelle_13 0.554 1.95
_Ikebelle_14 -5.898 *** 2.194
_Ikebelle_16 0.324 2.323
_Ikebelle_17 -1.927 2.573
_Ikebelle_18 -1.586 1.936
_Ikebelle_19 0.134 2.048
_Ikebelle_20 -5.966 ** 2.872
_Ikebelle_21 -9.19 *** 3.045
_Ikebelle_22 -5.747 3.803
Constant 148.906 *** 2.767 152.828 *** 3.12
Prob > chi2 0.000 0.000
Number of observations 584 584
Note: OLS models on height of youth. Significance levels: *: 10%, **: 5%, ***: 1%, ****:
0.1%.
3.11 Land scarcity and educational outcome for youth
We also wonder how land access and land wealth may be related to education outcome of
youth. On the one hand, as a wealth indicator for households, larger land may provide the
means for sending more of the children to school, particularly for higher education. On the
other hand, larger land holding imply more demand for family labor so that the farm activities
may compete with children school demands. Moreover, once they grow up, youth decision on
their own schooling may also be influenced by household land holding. Land provide
livelihood opportunity for more youth family members in a country where there is a tradition
to share the land among male children while the daughters are married out. We expect to see
a positive correlation between farm size and education if the wealth effect dominates.
Here we have assessed factors correlated with the highest completed grade of all children in
our household sample and for the youth sub-sample. The results are presented in Table 3.26.

49
Table 3.26. Factors associated with educational level of youth
All children in the household
sample
Youth sample
Coeff. Robust
st. err.
Coeff. Robust
st. err.
Age 0.241 *** 0.019 0.184 *** 0.042
Female -0.48 *** 0.104 -0.606 ** 0.253
Household size -0.02 0.025 -0.01 0.04
Age of HH head 0.023 ** 0.009 0.028 * 0.015
Education HH head 0.079 *** 0.024 0.094 ** 0.044
Female headed HH 0.099 0.356 0.085 0.548
Farm exp. of HH head -0.012 0.01 -0.035 * 0.018
Farm size (hectares) 0.401 *** 0.102 0.536 *** 0.186
District dummies: Baseline=Sashemene
Arsi Negelle 1.19 *** 0.223 0.738 * 0.413
Wondo Genet 1.027 *** 0.243 1.025 ** 0.459
Wollaita 0.485 ** 0.207 -0.475 0.556
Wondo Oromia 0.743 ** 0.323 -0.766 0.555
Birth rank(oldest=1) 0.114 * 0.059
Constant -1.573 *** 0.335 2.031 ** 0.952
F statistic 48.758 6.576
Prob. > F 0.000 0.000
Number of observations 2934 580
Note: OLS regression of grade level (number of years of successful schooling). Significance levels: *:
10%, **: 5%, ***: 1%, ****: 0.1%.
We find a significant (at 1% level) and positive relationship between farm size and education
level of youth in both samples/models. The wealth effect of land seems therefore stronger
than the farm labor demand effect and the livelihood opportunity effect of land on education.
There is also a significant and positive relationship between the education level of the head of
the household and the education of children. This could mean that more educated household
heads also give more priority to educating their children. But it could also be related to ability
to succeed in the school system something which is also partly an inherited ability.
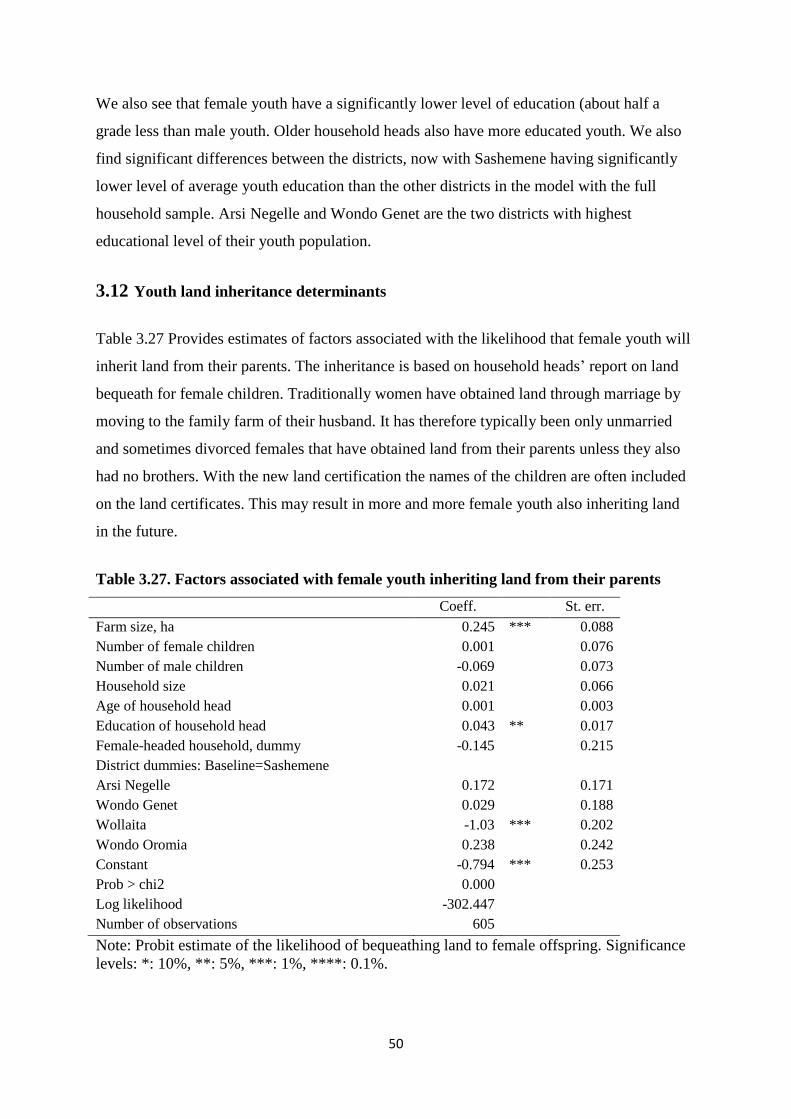
50
We also see that female youth have a significantly lower level of education (about half a
grade less than male youth. Older household heads also have more educated youth. We also
find significant differences between the districts, now with Sashemene having significantly
lower level of average youth education than the other districts in the model with the full
household sample. Arsi Negelle and Wondo Genet are the two districts with highest
educational level of their youth population.
3.12 Youth land inheritance determinants
Table 3.27 Provides estimates of factors associated with the likelihood that female youth will
inherit land from their parents. The inheritance is based on household heads’ report on land
bequeath for female children. Traditionally women have obtained land through marriage by
moving to the family farm of their husband. It has therefore typically been only unmarried
and sometimes divorced females that have obtained land from their parents unless they also
had no brothers. With the new land certification the names of the children are often included
on the land certificates. This may result in more and more female youth also inheriting land
in the future.
Table 3.27. Factors associated with female youth inheriting land from their parents
Coeff. St. err.
Farm size, ha 0.245 *** 0.088
Number of female children 0.001 0.076
Number of male children -0.069 0.073
Household size 0.021 0.066
Age of household head 0.001 0.003
Education of household head 0.043 ** 0.017
Female-headed household, dummy -0.145 0.215
District dummies: Baseline=Sashemene
Arsi Negelle 0.172 0.171
Wondo Genet 0.029 0.188
Wollaita -1.03 *** 0.202
Wondo Oromia 0.238 0.242
Constant -0.794 *** 0.253
Prob > chi2 0.000
Log likelihood -302.447
Number of observations 605
Note: Probit estimate of the likelihood of bequeathing land to female offspring. Significance
levels: *: 10%, **: 5%, ***: 1%, ****: 0.1%.

51
We see that farm size is positively and significantly (at 1% level) related to the probability
that female youth inherit land. This is expected. Land scarcity in combination with minimum
farm size restrictions reduces the probability that all children can inherit land from their
parents. In addition we see that the education level of household head has a positive and
significant correlation with female children inheriting land. This may be because more
educated parents are less bound by gender biased traditions. Finally, we see that female youth
in Wollaita are less likely to inherit land after farm size and other factors have been
controlled for. We may speculate that this is because this traditionally subsistence-oriented
area has more tradition-bound parents.
4 Generosity, trust and cooperation among youth
Generosity and trust among the youth and between the youth and parents is essential for
establishing a cooperation that is needed for co-managing land among siblings, for arriving
at a land sharing arrangement within households or for obtaining and managing land as a
youth group. The main sources of data for analyzing generosity and trust among youth and
with parents are the field experiments. We played dictator and trust games with the youth in
our sample. We expect the trust game to give us information on the trusting behavior and
trustworthiness of the youth and the dictator game to give insights about the generosity and
cooperation among siblings and with parents. In addition we have interview questions that
explore social responsibility and trust among youth.
We summarize here the results from the interview where the youth were asked questions that
reveal cooperation and trust-related behavior. 36% of the youth reported that they have co-
managed land with their parents and 21% with their siblings. The results from the interview
indicate that conflicts with parents and siblings with whom the youth co-manage land are
quite uncommon. 72% of those who co-manage land with parents and 70% of those who co-
manage land with siblings reported that they have never experienced conflict. Frequent
conflict is reported only for 3% and 4% of the respondents, respectively.
To understand the extent of family and social responsibility among the youth of our sample,
we asked whether or not the respondents were willing to work two weekends in exchange for;
a) school uniform for a sibling or other close relative; b) clothes for parents that are worth
100 birr or; c) some equipment for the local school. 79% of the youth reported that they are

52
willing to work two weekends in exchange for the school uniform or in exchange for clothes
for their parents. A slightly higher percentage (81%) reported willingness to work for school
equipment. Their stated preferences thus indicate a strong sense of family and social
responsibility and cooperative attitude to help one another.
Similar attitudes are shown with regard to trust among siblings and between children and
parents. Table 4.1 shows the statistics from willingness to lend questions. While 57% of the
youth are willing to lend to their parents without hesitation, a somewhat lower percentage
(49%) are willing to lend to their siblings while 57% were willing to lend to their parents
without hesitation. 19% of the youth are unwilling to lend for their siblings and 14% are
unwilling to lend for their parents in any way. The rest are willing to lend depending on what
the borrower needs the money for. While the percentage of totally unwilling male and female
youth is comparable, proportionately more female youth are willing to lend unconditionally
than are male youth.
Table 4.1. Willingness to lend money to sibling versus parent
If able and asked, will you lend
your sibling 300 Birr?
If able and asked, will you lend
your parents 300 Birr?
Gender No Yes Depends on the need No Yes Depends on the need
Male (%) 17.8 45.9 36.4
14.8 54.4 30.8
Female (%) 19.6 52.9 27.5
13.1 60.8 26.1
All youth(%) 18.5 48.7 32.8 14.1 57.1 28.9
4.1 Generosity: Dictator game experiment
The dictator game experiment is considered one of the simplest tools to investigate generosity
(Dufwenberg and Muren 2006). We use this experiment to explore generosity among youth
within the same household, generosity of youth towards the father/head of household, and
towards other youth in the village. This information may indicate something about the social
connectedness of the youth and feeling of social responsibility with varying social distance.
We have combined dictator games with trust games to enable us to separate generosity from
trusting behavior (Cardenas and Carpenter 2008). We will come back to the trust game in
next section.

53
As explained in section two, 30 ETB is placed in front of each youth player and the
respondent is asked whether and how much s/he will share with one of these: 1) Father or
other household head (if no father), 2) brother or sister who is in the sample with him, 3)
anonymous youth from the same community. The response for each of these cases will be
recorded before a lottery is drawn to decide who the real recipient will be.
Figure 4.1 shows the total distribution of allocations by gender of the player and Figure 4.2
shows the distribution by recipient relation to the player. Quite a significant share of the
players chooses not to share the money. Proportionately more female youth choose not to
share than male youth. For those who are giving some money, sharing half is the most
common.
Figure 4.1. Distribution of allocation of money disaggregated by gender of player
020
4060
0 10 20 30 0 10 20 30
Boys Girls
Per
cent
Dictator game: Allocation amountGraphs by Sex

54
Figure 4.2. Distribution of allocation of money by dictator disaggregated by recipient
More detailed statistics on the allocation is given in Table 4.2. The probability of non-zero
sharing for the whole sample is 50% and the average rate of sharing for the whole sample is
21% of endowment. However there is significant difference in sharing behavior towards
family members versus anonymous youth from the village. There is a higher probability of
sharing with family members (56%-63%) than anonymous youth in the village (30%). The
average share of endowment that is allocated also differs by beneficiary where the share of
the allocated amount is 23% if the receiver is a brother/sister, is 30% for a father/household
head, and 9% for anonymous youth from the village. Compared to the statistics found in the
literature, the sharing level in our sample is smaller. A survey of dictator game studies that
cover developing and developed countries as well as student and non-student samples report
mean allocations that range from 19% to 47% (Cardenas and Carpenter 2008). Another meta
study of dictator experiments that cover more than 130 papers found that the average sharing
constructed from all the studies is 28.4% (Engel 2011). As most dictator studies involve
sharing among anonymous players, the 9% sharing we observe for anonymous youth seem to
be much lower than findings in other countries.
020
4060
800
2040
6080
0 10 20 30
0 10 20 30
Allocation to brother/sister Allocation to father
Allocation to anonymous youthPer
cent
Dictator game: Allocation amountGraphs by Dictator game: Allocation for whom

55
Table 4.2. Allocation of money in dictator game experiments by gender of player and
recipient
Young women Young men All youth
Allocation for
whom
Youth
willing to
share (%)
Mean
allocationa
(%)
Youth
willing to
share (%)
Mean
allocationa
(%)
Youth
willing to
share (%)
Mean
allocationa
(%)
Sister/brother 55 23.2 57 23.9 56 23.6
Father 61 28.6 64 31.4 63 30.2
Anonymous
youth
27 8.6 33 9.7 30 9.2
Total 48 20.1 52 21.7 50 21.0
Note: a-Allocation is reported in terms of a proportion of total endowment the dictator gave out
There are also differences in sharing behavior across survey sites. Sharing in Sidama zone is
the highest at average sharing of 27% of endowment and lowest in Wollaita at 16%.
However, there are also differences among districts in the same zones. The sharing behavior
of youth from Arsi Negelle is closer to that of youth from Wollaita than to that of the other
Oromia districts. Figure 4.3 shows the distribution for the 5 districts.
Figure 4.3. Youth’s allocation of money in dictator game experiments by district
020
4060
020
4060
0 10 20 30
0 10 20 30 0 10 20 30
Sashemene Arsi Negelle Wondo Genet
Wollaita Wondo OromiaPer
cent
Dictator game: Allocation amount by youth by districtGraphs by Woreda

56
In summary what we observe from the dictator game is that there is significant sharing
among siblings in Southern Ethiopia. More than half of the youth are willing to share with
their brother or sister in a game that involved real payoffs. The experimental results are
consistent with the stated behavior in the questionnaire where the majority of the youth were
willing to work in exchange for clothes for their sibling or parent. However, the extent of
sharing with anonymous youth was much smaller than found in the literature. Parents of these
youth exhibited similar sharing behavior in a parallel study that explored sharing behavior
with spouse and with anonymous villager (Bezu and Holden 2013).
In Table 4.3 we report the results from a model that shows factors that are associated with
youth willingness to share the money they received with different persons. We see that age is
negatively correlated with allocation to father (significant at 5% level). Compared to young
men, young women are less likely to allocate to their fathers and to anonymous youth in the
village indicating that young men are perhaps more generous. Youth from households where
average education level is higher are more generous. The effect of education is most strong
for allocation towards anonymous youth. Surprisingly, controlling the average education
level in the household, the level of education of household head was negatively associated
with amounts given.
The households having a land certificate was significantly (at 5% level) and positively
correlated with the level of generosity (amounts given) within the family (for sibling and
father) while years of certificate ownership was negatively associated with amount given to
father. Number of female youth in the family was weakly positively associated (significant at
10% level) with allocation for sibling while number of male youth in the family was weakly
negatively associated with amounts allocated for anonymous youth. The size of the land
endowment (farm size) was not significantly associated with generosity as revealed with
these dictator games.
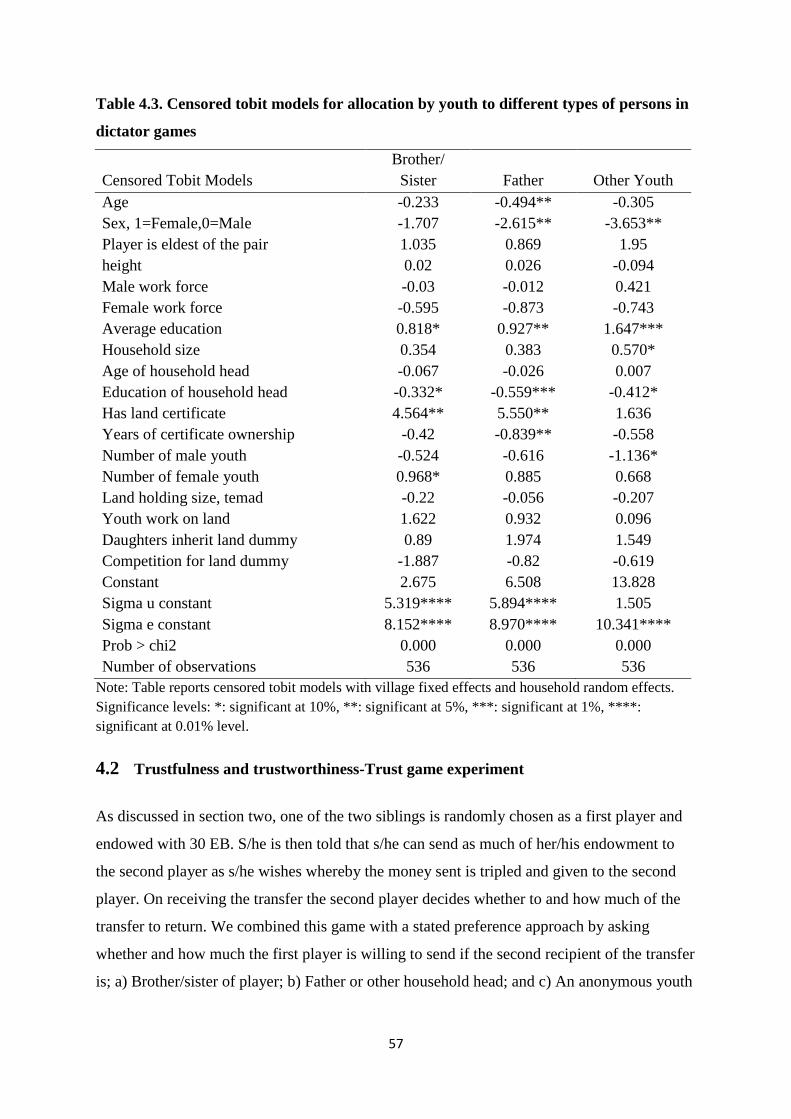
57
Table 4.3. Censored tobit models for allocation by youth to different types of persons in
dictator games
Censored Tobit Models
Brother/
Sister Father Other Youth
Age -0.233 -0.494** -0.305
Sex, 1=Female,0=Male -1.707 -2.615** -3.653**
Player is eldest of the pair 1.035 0.869 1.95
height 0.02 0.026 -0.094
Male work force -0.03 -0.012 0.421
Female work force -0.595 -0.873 -0.743
Average education 0.818* 0.927** 1.647***
Household size 0.354 0.383 0.570*
Age of household head -0.067 -0.026 0.007
Education of household head -0.332* -0.559*** -0.412*
Has land certificate 4.564** 5.550** 1.636
Years of certificate ownership -0.42 -0.839** -0.558
Number of male youth -0.524 -0.616 -1.136*
Number of female youth 0.968* 0.885 0.668
Land holding size, temad -0.22 -0.056 -0.207
Youth work on land 1.622 0.932 0.096
Daughters inherit land dummy 0.89 1.974 1.549
Competition for land dummy -1.887 -0.82 -0.619
Constant 2.675 6.508 13.828
Sigma u constant 5.319**** 5.894**** 1.505
Sigma e constant 8.152**** 8.970**** 10.341****
Prob > chi2 0.000 0.000 0.000
Number of observations 536 536 536
Note: Table reports censored tobit models with village fixed effects and household random effects.
Significance levels: *: significant at 10%, **: significant at 5%, ***: significant at 1%, ****:
significant at 0.01% level.
4.2 Trustfulness and trustworthiness-Trust game experiment
As discussed in section two, one of the two siblings is randomly chosen as a first player and
endowed with 30 EB. S/he is then told that s/he can send as much of her/his endowment to
the second player as s/he wishes whereby the money sent is tripled and given to the second
player. On receiving the transfer the second player decides whether to and how much of the
transfer to return. We combined this game with a stated preference approach by asking
whether and how much the first player is willing to send if the second recipient of the transfer
is; a) Brother/sister of player; b) Father or other household head; and c) An anonymous youth

58
from the village. The real recipient is either sibling or anonymous youth which was
determined by a coin toss after the player had stated the amount in each case.
4.2.1 Trustfulness
Table 4.4 shows the transfers by male and female youth to the respective parties. The average
probability of sending money is 57% and this may be compared with 50% probability of
giving positive amounts in the dictator game. There was no significant difference between
male and female participants. The probability of giving was lower when receiver is
anonymous youth from the village (34%) as compared to sibling (67%) or father (69%). The
probabilities of giving in the dictator games were 30% for anonymous youth, 56% for sibling,
and 63% for father, for comparison. The average % of the endowment sent in the trust game
the youth was 12% for anonymous youth and 35% for sibling or a father. This compares to
9% and 27% in the dictator games. We therefore see increases in both probabilities and
amounts in the trust game as compared to the dictator game. The difference in giving
behavior in the trust game as compared to the dictator game can then be attributed to the
trustfulness of the respondents. While in the dictator game the generosity towards the father
was significantly higher than to sibling, this was not the case in the trust game.
Table 4.4. The probability of non-zero transfer and average amount transferred by
youth in trust game
Young women Young men All youth
Allocation for:
Transfer
probability
(%)
Mean
Allocation
(%) a
Transfer
probability
(%)
Mean
Allocation
(%) a
Transfer
probability
(%)
Mean
Allocation
(%) a
Sister/brother 69 35 68 34 69 34
Father 66 34 68 36 67 36
Anonymous youth 36 13 33 11 34 12
Total 57 27 57 27 57 27
Note: Allocation is reported in terms of a proportion sent by player one to player two of total
endowment.
Figure 4.4 shows the distribution of this transfer for each type of recipient. The majority of
the youth will send some money (ranging from 5-30 EB) if trustee is a family member. Those

59
giving positive amounts to anonymous youth also tended to give smaller amounts than those
who gave positive amounts to family members.
Figure 4.4. Amount of money allocated by player 1 in trust game disaggregated by type of
recipient
Figure 4.5 shows the trust game allocation distribution by district. We can see that Arsi
Negelle and Wollaita have similar distribution in that majority of the youth did not
sendmoney. The variation across districts is similar to that in the dictator game (Figure 4.3).
Figure 4.5. Amount of money allocated by player 1 in trust game disaggregated district
020
4060
020
4060
0 10 20 30
0 10 20 30
brother/sister father/other hhhead
annonymous youthPer
cent
Trustgame: Amount allocated by player 1 in each caseGraphs by Trust game: Allocation for whom
020
4060
020
4060
0 10 20 30
0 10 20 30 0 10 20 30
Shashemene ArsiNegelle Wondo Genet
Wollaita Wondo OromiaPer
cent
Trustgame: Amount allocated by player 1 in each caseGraphs by Woreda

60
The fraction of money sent by trust game players in our sample is low compared to what is
found in the literature. A study that reviewed results from more than 20 studies show that
first-movers sent on average 30%-70% of their endowment. Given that for almost all of these
studies the receiver is anonymous person, the sharing in the literature should be compared
with that for anonymous youth in our sample which is found to be only 12% of the
endowment. Even the fraction of endowment sent for family member in our sample is in the
lower range. Our interview questions also emphasize this lack of trust outside of the family
circle. Around 20% of the youth have no friend they can trust with 100 ETB loan while 37%
trust 1-2 friends only with such a loan.
4.2.2 Trustworthiness
If more than half of the youth are trusting and are willing to send their money in expectation
that they can share from the larger money player 2 receives, how trustworthy are these others
in return? Table 4.5 shows the share of money returned by those who received non-zero
amount. People are more trustworthy to their brother or sister than to anonymous youth in the
village. Young men and women who received a positive amount returned on average about
29% of the received money if sender is a sibling and 16% if sender is anonymous youth from
the village. Young men on average returned about 2% larger share than young women to their
siblings and 4% more to anonymous youth.
Table 4.5. The amount of transfer actually returned by player 2 in trust games
Returned amount as share of transfer receiveda
Male Youth Female youth All Youth N
(%) (%) (%)
Brother/sister 30 28 29 139
Anonymous youth 18 14 16 99
Total 25 22 24 238
a The amount received by player 2 is three times the amount sent by player 1.
Because the amount returned will depend on how much is received and who sent it, we posed
hypothetical (stated preference) questions where each transfer receiver (player 2) is asked
how much s/he will return if s/he receives 45 EB (after the transfer is tripled) from a)
brother/sister; b) father or other household head; c) anonymous youth. This question is
answered before the second player opens the envelope and sees whom the money is from and

61
the actual amount. This allows us to evaluate all of the second players on equal ground. We
also get information on how they would act towards their parent since fathers did not actually
play the game. The results are summarized in Table 4.6.
Table 4.6. The percentage of the transferred amount that would be returned by player 2
(hypothetical questions)
Male Youth Female youth All Youth
Returned for: (%) (%) (%)
Brother/sister 24 21 23
Father 28 24 26
Anonymous youth 14 8 11
Total 22 18 20
We see that the pattern is similar in that people are more trustworthy to their own family
members than to anonymous youth. Moreover, the youth return a relatively higher share of
the transfer if the transfer comes from a father than from a sibling. An additional interesting
observation is that the youth were more trustworthy in the real experiment than in the
hypothetical (stated preference) game. The actual share of endowment returned to a sibling is
6% higher in the real experiment versus in the hypothetical case for male respondent and 7%
higher for female respondents. The actual share returned for anonymous youth in the village
was on average 5% higher than in the hypothetical case.
Figure 4.6 shows the distribution of amounts returned by player 2 in the trust games for the
hypothetical and real games (note that the scale is different on the y-axis in the two graphs).
The real amounts received varied in the real game unlike in the hypothetical game. The real
game had a higher proportion returning 50% or 33%. The latter could be due to the three-
doubling of the amounts given and thus the feeling that player 1 should get back what s/he
has sent (exact compensation) while 50% return may indicate a fairness perception that the
benefit should be shared equally.

62
The fraction of money actually returned by second players in our sample is in the range found
in the reviewed studies in Cardenas and Carpenter (2008). The fraction returned in the
literature range from 18% to50% of endowment. However, when we compare the amount
returned for anonymous youth in our sample with that found in the literature we find that the
fraction returned in our youth sample is at the lower end of the range.
To summarize, trustfulness and trustworthiness appear to be lower among youth in Ethiopia
compared to the level found in the experimental literature. This may be partly explained by
sample difference as the subjects in such experiments are often university students in
developed countries. However, trustfulness and trustworthiness found among non-family
youth in our sample is lower even compared to studies in Tanzania, South Africa and Kenya,
countries that have comparable levels of economic development.
In Table 4.7 we assess factors associated with the degree of trustfulness and trustworthiness
of youth. The first model in the table assesses the trustfulness as measured by the amounts
sent in the trust game. We have included the amounts that they gave in the dictator game as a
control for generosity. We see that this variable was highly significant (0.1% level) which is
consistent with the descriptive analyses we have presented already. Higher allocations in trust
games may be due to generosity and not necessarily be due to higher trust and higher
expectation of getting a larger amount back. However, after controlling for generosity in the
dictator game we hope we have better measures of trustfulness and trustworthiness and
factors associated with these characteristics.
Figure 4.6. Distribution of shares of transfers returned by player 2 in hypothetical trust
game (left) and real trust game (right)

63
The amount allocated to anonymous youth was significantly lower (at 0.1% level) than that
allocated to sibling. The amount allocated to father was also significantly lower (at 1% level)
than that allocated to brother/sister, indicating that they have more trust in their brother/sister
than in their parent to return some of the money. Trustfulness was stronger (significant at 5%
level) in households where it has been indicated that daughters will inherit land and where
youth work on the land while trustfulness was negatively correlated (significant at 5% level)
with the number of years of land certificate ownership. Trustfulness also was positively
correlated with average education of youth in the family (significant at 1% level) and with
number of female youth in the family (significant at 5% level).
The second model in Table 4.7 shows the results for the stated preference models of
trustworthiness. Again the allocations in the dictator game were highly significantly (0.1%
level) correlated with the stated amounts returned out of ETB 45 in the trust game. The stated
amounts that they wanted to return were lower the older the youth was (significant at 5%
level) but in this case there was no significant difference between male and female youth.
Age was weakly negatively associated with stated amounts returned (significant at 10%
level).
Height and Body Mass Index (BMI) were positively correlated with stated amounts returned
indicating that more healthy persons are more trustworthy and more able and willing to return
money. It is obvious that less healthy/more hungry people have more desperate needs for the
money themselves. Furthermore, we see that stated amounts returned are positively correlated
with number of male youth in the family (significant at 1% level) while in this case number
of female youth was insignificant. Those who stated that they trust relatives also stated that
they would return significantly more than those who stated that they only trust some relatives
(significant at 1% level). There was no significant difference between stated amounts to be
returned to sibling or to parent while the stated amounts returned to anonymous youth were
significantly (at 0.1% level) lower than for within family returns. Number of trusted friends
was weakly positively associated with stated amounts returned while farm size was weakly
negatively associated with stated amounts returned (both significant at 10% level).

64
Table 4.7. Factors associated with trustfulness and trustworthiness among youth
Amount sent
in trust game
Hypothetical
Amount
returned in
trust game
Real Amount
Returned in
trust game
Baseline: Allocation for brother/sister
Allocation for father -2.064***
Allocation for anonymous youth -7.623****
Amount allocated in dictator game 0.888**** 1.003**** 0.093****
Age -0.249 -0.380* -1.037****
Sex, 1=Female,0=Male -1.014 2.003 12.699****
Rank of player: 1= Oldest, 2=youngest 0.537 0.000 -0.854
Height -0.033 0.166** 0.720****
BMI -0.141 0.131** 0.038
Male work force 0.554 0.465 1.600*
Female work force -0.365 0.506 -1.155
Average education 1.229*** 0.213 1.032*
Household size -0.133 0.173 0.366
Age of household head -0.078 -0.028 -0.110*
Education of household head -0.285 0.055 -0.386
Has land certificate 0.991 -2.062 1.430
Years of certificate ownership -0.748** 0.305 0.071
Number of male youth -0.064 1.235*** 1.046***
Number of female youth 1.131** 0.334 -0.893
Farm size, temad -0.087 -0.376* 0.193
Youth work on land, dummy 3.794** 0.947 -1.012
Daughters inherit land, dummy 2.934** 0.401 -0.273
Competition for land, dummy -0.111 -0.029 0.577
Number of trusted friends -0.006 0.422* -0.662***
Base: Trust relatives
Trust some relatives -0.961 -3.389*** -2.235***
Trust relatives in some cases 1.212 -0.776 0.220
Return for father 0.076
Return for anonymous youth -4.346****
Player code -7.501 5.521**
Amount sent by player 1 0.690****
Sigma u Constant 21.118 -8.529 -135.996****
Sigma e Constant 5.565**** 5.935**** 13.534****
Constant 7.470**** 7.909**** 2.050****
Prob > chi2 0.000 0.000 0.000
Number of observations 711 732 732
Censored tobit models with village fixed effects and household random effects. Significance levels: *:
significant at 10%, **: significant at 5%, ***: significant at 1%, ****: significant at 0.01% level.

65
The last model in Table 4.7 shows factors associated with the real payments of the second
player in the trust games (assessment of trustworthiness). Again the amounts returned were
highly significantly correlated with the amounts the youth gave in the dictator games
(significant at 0.1% level). As would be expected the amounts returned were also highly
significantly (at 0.1% level) and positively related with the amounts received. Age of the
youth was strongly negatively correlated with the amount returned (significant at 0.1% level)
while female youth returned significantly more than male youth (significant at 0.1% level),
indicating that female youth are more trustworthy than male youth. Taller youth (after
controlling for age) also returned significantly more money (significant at 0.1% level).
Number of male youth in the family was associated with more money being returned while
number of trusted friends was negatively associated with amount returned (both significant at
1% level). Those who trusted their relatives returned significantly more money than those
who only trusted some of their relatives (significant at 1% level). Finally, there was a weak
positive association between average education in the family and amounts given and a weak
negative association between age of household head and amounts given (both significant at
10% level).
We also ran models with district fixed effects instead of village fixed effects. Most of the
results were robust to this change. One of the additional interesting findings in these models
was to assess whether there were significant differences between districts. We found
trustfulness to be significantly lower in Arsi Negelle while trustworthiness was significantly
lower (using Sashemene as base) in Wondo Genet, the cash crop producing area, and
significantly higher in Wondo – Oromia. This demonstrates significant variations across
communities located very close to each other.
5 Overall discussion of the research questions
We will now have an overall discussion of the research questions that were presented in the
introduction given our research findings and other relevant information. This chapter is
organized such that we take one question at the time, however, several of the questions are
inter-related and therefore this requires some overlap in the discussion.

66
5.1 What livelihood strategies do the youth choose when land scarcity becomes very
high? Are the youth aiming to obtain land for agriculture or are they looking for
alternative livelihood options outside agriculture?
The primary source of land for youth in Ethiopia is currently through inheritance from
parents or for girls through marriage. Access to land from the authorities based on the
constitutional right to access land has diminished in recent years such land has also become
very scarce. With prohibition of land sales it is only through land renting that market access
to land is achievable. There were hardly any of the youth in our sample that were considering
to join land resettlement programs as a way to obtain land. We see a very interesting change
in Wollaita, the most densely populated area that is highly subsistence oriented in its
agricultural production. This area looked like a prototype Malthusian poverty trap in 2007
and still had very little outmigration. However, from 2007 to 2012 there has been a drastic
change in the strategy of the youth in Wollaita. From very few leaving the area this has
become the area with highest level of outmigration of youth by 2012. The youth in Wollaita
were also least frequently involved in farming and least likely to try to get access to land
(Table 3.1). Wollaita was the area where the parents were least likely to have given part of
their land to their children in the past (Table 3.8). Wollaita was also the area where female
children were least likely to get land from their parents (Table 3.12).
In our livelihood choice analysis (Table 3.16) we found that small farm size in the household
pushed youth towards preferring all kinds of non-farm employment opportunities. The most
preferred non-farm choices were urban salaried employment and off-farm self-employment
and business. Off-farm (low-pay unskilled) wage employment was only preferred by youth
from the poorest locations (Wollaita and Wondo – Oromia) with small farm sizes.
5.2 How does co-management of very small farms work for parents and their children
and among the children?
The new law restrictions setting minimum farm sizes at 0.5 ha in the annual crop systems and
at 0.25 ha in the perennial crop systems imply that it is not possible to get legal documents
that support splitting farm sizes to sizes below these limits. However, farms that were smaller
than these minimum limits at the time of land registration and certification still obtained land
certificates (Holden and Tefera, 2008). Also in cases of divorce, while the law states that

67
husband and wife shall divide that land equally in such cases, they are not allowed to split the
farm in separate legal units if this will violate the minimum farm size restrictions. Continued
co-management of the farm may be a particularly demanding task in such cases. The outcome
may in such cases be that only one party takes over the farm. Another situation that may
occur is that the farm is officially co-managed as one legal unit but in reality the farm is split
in smaller farm plots with more individual and independent management. Quite a few
respondents stated that this was their preferred arrangement (Holden and Tefera, 2008).
The patrilineal and patrilocal traditions with male dominance in farming are likely to
continue to play a dominant role even though husbands and wives have been given equal
ownership rights to their land with the recent land law reform. In case of disputes with the
husband the wife who is typically living in the village of the husband is likely to be in a weak
position and may lose out in the bargain over how to share a too small farm to be split among
the parties in case of divorce. The number and age of children they have are likely to play a
decisive role in what happens with the sharing of the farm. The presence of older children,
particularly boys, may facilitate continued co-management of the farm and for the divorced
mother to continue to stay on the farm.
5.3 How is land scarcity and land certification affecting the access to land tenure
security of youth?
As we have explained earlier, all residents in rural communities in Ethiopia who do not have
alternative livelihood opportunities have a constitutional right to obtain land as a basis for
their livelihood since 1975. This “land as a safety net” right is also the basis for the
prohibition of land sales in the country. This constitutional right was providing land access to
youth through repeated land redistributions that aimed to maintain an egalitarian land
distribution and households accessed land based on their subsistence needs (family size) and
the production potential (land quality classes) of the land (Holden and Yohannes, 2002).
Increasingly these redistributions had to take place by reallocating land from more land-rich
to land-poor households and this created tenure insecurity as the land redistribution game
became a zero-sum game when all surplus land in the communities had been allocated to
households. It was this tenure insecurity and weak land rights of individual households that
undermined investment in land and created a demand for more secure land rights that
ultimately led to the halting of the land redistributions and to the recent land registration and

68
certification reform that aims to provide more secure land rights and prevent further
fragmentation of land holdings by setting minimum farm sizes. This implies, however, also
that Ethiopia has created conflicting legal rights in favor of current owners and occupiers of
the land and at the expense of future potential occupiers and owners which are the growing
land-poor or landless youth population who cannot rely on their constitutional right being
provided by the state any more.
The lucky situation of this land tenure insecure youth population is that Ethiopia currently
experiences rapid economic growth which provides more non-farm employment
opportunities in Ethiopia than ever before. However, even with a double digit growth rate, if
official figures are correct, may create insufficient non-farm employment opportunities for
the rapidly growing youth population that cannot be provided sustainable livelihood options
on the rural lands. Youth unemployment can therefore become a serious threat to social
security and government action is important to mobilize this valuable human resource to
build sustainable livelihoods in rural as well as in urban areas of the country. This requires
forward looking policies and carefully planned interventions.
5.4 How does extreme land scarcity affect the intra-household competition for land?
Who are leaving and who remain behind and why?
Our analyses of migration revealed that outmigration was strongest in Wollaita, the
traditionally most subsistence-oriented area with highest population density. It is impossible
for a large share of the youth in this area to continue to stay on the farm with their parents and
siblings. We also found that education was a driver for migration implying that the less
educated youth are more likely to stay behind on the family farm. Female youth are also less
likely to stay behind and take over the land of their parents than their brothers but may access
land through marriage with a husband that has access to land. Joint land certification has
strengthened the land rights of wives and they are more likely to keep the land in case of
death of their husband and keep half of the land in case of divorce. In case of widowhood the
traditional requirement to remarry the brother of their late husband is also less likely to be
enforced than before. However, such social pressures are not likely to vanish very quickly.

69
5.5 How is land scarcity affecting the nutritional status of children and youth that stay
on the farm?
Our analysis of Body Mass Index (BMI) data (Tables 3.23 and 3.24) for our youth sample
found no correlation with farm size. This indicates that the recent migration has contributed
to break the poverty-environment trap that appeared severe particularly in Wollaita a few
years ago (Tessema and Holden 2007, Holden and Tefera 2008). Economic growth in
Ethiopia has contributed to better off-farm employment opportunities and this indirectly
affects the nutritional status of youth in rural areas by reducing the population pressure on the
land.
However, when we assessed the height of youth as a measure of the long-term nutritional
status of youth (stunting), land access was significant in the model with village fixed effects
and many of the village dummies were highly significant. This indicates that land access and
variations across communities in access to food in the past has contributed to substantial
variation in stunting. It is therefore likely that the village fixed effects capture part of the land
scarcity effect on long-term nutritional status of youth.
5.6 How is land scarcity affecting education decisions of the children?
We found that land scarcity was negatively correlated with the number of years of education
completed by the youth in our sample. Land wealth therefore seems to stimulate the
education of youth more than it attracts youth away from education by providing the
traditional livelihood opportunity. Land-poor household are therefore less able to educate
their children and at the same time less able to provide them livelihood opportunities on their
farms. Youth from such households are more likely to be pushed into low-wage off-farm
employment.
5.7 How is land scarcity affecting the gendered land distribution among children in
the household?
Based on information from the parents about their plans for bequeathing land to their children
we found that female children were less likely to inherit land the smaller the farm size of their
parents and the lower the education of the household head. The pattern of assortative
matching in the marriage market and how this affects access to land for female youth needs to

70
be studied carefully to further investigate this (Fafchamps and Quisumbing, 2005). This goes
beyond what we have capacity to do in this study.
5.8 To what extent are the youth organized and demand land as a source of future
livelihood?
Youth in our study areas were not organized in ways that could help them to obtain land. The
traditional way to try to get land is to register interest in getting land at the community
(kebelle) level but there are typically long waiting lists to obtain land because of the scarcity
of land. We found no attempts by youth to organize themselves to go for resettlements to
obtain land although we were told by the regional administration in SNNP region that such
resettlement programs for youth existed. The youth migrating to urban areas are likely to
move in groups, like the youth from Wollaita that have established themselves as shoe
shiners in Addis Ababa.
5.9 How and to what extent are the local governments and communities responding to
the youth needs and demands?
The national and regional land laws open for actions at community level to redistribute land
e.g. to landless youth. However, our impression is that such redistributions largely have
stopped after land registration and certification took place. We therefore see very limited
community actions in our study areas to provide land for youth. The parents are considered
the main source of land while at the same time the law prohibits further splitting of legal land
units below the minimum farm sizes of 0.5 ha in the annual cropping areas and 0.25 ha in the
perennial cropping areas.
5.10 What are the complementary constraints and needs that the youth face in
accessing and efficiently utilizing land resources to secure their livelihood and
improve their welfare?
Youth that cannot inherit sufficient land resources from their parents to derive a livelihood
may be able to access land through the land rental market (most commonly through
sharecropping contracts). However, access to land in the rental market may also depend on
their skills, access to oxen for land cultivation, capital, labor and reputation as farmers. These
may cause youth with limited experience and complementary inputs to be rationed out of this

71
market (Ghebru and Holden 2008). The land rental market may, however, be available to
some youth who may access land from relatives through renting or for some youth who are in
an advantageous position in terms of having access to the necessary complementary inputs
and therefore can convince potential landlord households to rent land to them.
5.11 What are the best practices used to improve access to land for youth, mobilizing
and empowering them in relation to land utilization?
We did not find examples of youth cooperatives that have succeeded in obtaining land, but
according to the SNNP region Bureau of Women's , Children's and Youth Affairs both urban
and rural youth are getting organized to access land, startup capital, training or all (BWCYA
2010). The report states that 119,000 young people from SNNP get organized into 3795
cooperatives (appear to include both urban and rural youth in SNNP). In addition, 101,274
youth were trained and then start up modern agriculture on their family land and 18,095
youth were engaged in agriculture in mountainous area producing trees, bamboo, etc.
(BWCYA 2010). We did not see any signs of these activities in our study areas.
Recommendations
Our study shows that the long-term land access of youth through inheritance or allocation
from authorities is diminishing for a rapidly growing share of the youth in rural areas. The
existing land access options for youth are weak and inequitable. Because of this land access
problem and other related concerns most of the rural youth prefer and need non-agricultural
livelihoods as alternatives to farming. At the same time the non-farm opportunities in the
rural areas are currently very limited. A large rural-urban migration is, therefore, a logical
consequence. Our study shows a rapidly increasing rural-urban migration in the study areas.
Below we list some measures that can be taken to increase agricultural land access, improve
rural livelihood opportunities for youth and address youth migration in a way that reduce
stress on migrants and host communities.
1. Improve the legal framework: The land laws and regulations such as the right of citizens
to land access, minimum land holding size and the land registrations and certification
must be harmonized to ensure consistency and equitability in agricultural land access.
Specific measures to consider:

72
Drop the constitutional right to access land as it is impossible to ensure it any more.
Develop clear inheritance rule to ensure that transfer of land from parents to children
does not lead to land fragmentation or conflict among siblings or with parents. One
suggestion is for the oldest child in the family to be given the first right to take over
the land if the farm is too small to be subdivided. The inheritor then has the
responsibility for taking care of the parents when they are getting old and for
accommodating siblings in need. This may give them incentives also to help siblings
with schooling. If the first child does not want to take over the farm the second born is
given the opportunity, etc.
2. Improve land rental market: Improving the land rental market in rural Ethiopia may play
an important role in improving the economic opportunity for youth in rural areas. An
important step may be to relax the current restriction on the maximum number of years
land can be rented out to other farmers and the restriction that maximum half of the farm
can be rented out. Young farmers with complementary resources may then get better
access to agricultural land through the rental market while others may rent out more of
their farmland to obtain working capital for non-farm activity or to get food through a
sharecropping contract without having to work for it if they lack complementary
resources such as oxen for plowing, are labor-poor, sick, disabled and old.
3. Improve non-farm livelihood opportunities in the rural areas: Improvement in the non-
farm livelihood opportunities in the rural areas can help to reduce the high level of
uncontrolled rural-urban migration that is poised to happen. Specific measures may
include:
Design employment generating schemes targeted to the youth that create much
needed public goods and employ youth with different levels of education. Skilled
employments may be performed by youth with short term training.
Provide entrepreneurial training and credit for youth to encourage creation of non-
farm self-employment such as business.
Provide land access, training and credit for youth groups that can engage in
agriculture based businesses such as high value fruit and vegetable production and
processing of agricultural products. Such activities may not need large tracts of land
4. Involve youth in land-related decisions and policy implementations: Stakeholder
meetings and activities should not include only current land holders but also landless

73
youth who will be greatly affected by land-related decisions. This will improve youth
empowerment as well as encourage the relevance of the policies and regulations. Some of
the activities they can be currently involved in include:
Engage youth in implementation of second stage land certification
Engage youth in work of Land Administration Committees in the communities
Develop youth corps for other social needs in the community such as conservation
of communal lands, afforestation programs, etc.
5. Design a youth migration program: Our study shows that because of land scarcity,
population pressure and lack of rural livelihood opportunity, youth migration have
become a very common phenomenon in rural areas. We observed an already significant
and increasing migration from land scarce areas. While generating non-farm employment
opportunities in rural areas and improving access to agricultural land may reduce the need
to migrate for some of the youth, we should still expect a very high level of youth
migration with better infrastructure and information. It is important, therefore, to
understand the migration process in order to make a better use of the youth labor that
migrate into urban areas and reduce the stress and tension on the migrant youth and host
communities.
6 Conclusions
In a country where almost six out of ten farm households cultivate less than one hectare of
land, a high and growing youth population in rural areas pose a challenge in terms of
ensuring access to land and livelihood. Although Ethiopia’s constitution seems to guarantee
youth rights to rural land should they wish to establish livelihood in agriculture, the practical
applicability of this really depends on local land availability, inheritance customs and local
administrative processes for land allocation. This implies that an increasing share of the youth
will be unable to access land as their primary source of livelihood in the future and we will
see a rapid increase in rural-urban youth migration due to population push factors. The recent
strong economic growth in Ethiopia and expanding educational opportunities for youth has
also created more off-farm livelihood opportunities. There is, however, a growing population
of youth with intermediary levels of education that have a hard time finding jobs. Completing
a BSc-degree or even MSc-degree in the country is no longer a guarantee for obtaining a
good job while there is a high scarcity of PhD-holders to fill university positions in the many
universities in the country, something that also affects the quality of the university education.

74
We saw examples of youth who had completed their education but came back to their
parents’ place as they had problems obtaining off-farm jobs.
Youth unemployment is a growing international challenge not only in Africa. A growing
urban unemployed youth population may also become an important political factor that may
potentially threaten the political stability unless acceptable livelihood opportunities are
provided. A pro-active approach to engage youth in innovative actions is essential in a
sustainable livelihood approach to development. The youth should be actively involved in
forming its future. We saw that youth migration has really taken off the last five years in
some of our most densely populated study areas. These were, however, more spontaneous
actions by the youth themselves as individuals or groups and it was not a result of publicly
organized activities or policies. Our research revealed very little of such publicly organized
activities for youth in the rural areas that we have studied in Ethiopia. What we have revealed
is a very rapid transition of youth livelihood opportunities and strategies that will require
immediate proactive political action to minimize severe future problems. Inability to address
the land and livelihood access problems may result in social and economic crisis not only in
rural areas but also in urban areas where a rapidly increasing number of youth migrate to. Our
study is really to our knowledge just a first study of these issues in Ethiopia and should be
followed up at a broader scale over time to better understand the dynamics and its
implications.
We think that youth face similar problems in many densely populated African countries that
face similar transition challenges. UN-Habitat may play an important role to orchestrate more
studies of these issues and to identify political and administrative solutions that can engage
youth directly in innovative approaches to develop and promote new livelihood opportunities.

75
References
Alemu, T. (1999). Land Tenure and Soil Conservation: Evidence from Ethiopia
(PhDdissertation), Göteborg University, Göteborg.
Becker, G. S. (1981). Altruism in the Family and Selfishness in the Market Place.
Economica, 48(189), 1-15.
Bezu, S. and Barrett, C. (2012). Employment dynamics in the rural nonfarm sector in
Ethiopia: Do the poor have time on their side? Journal of Development Studies, 48(9),
1223-1240.
Bezu, S. and Holden, S. T. (2013). Generosity and social distance in dictator game field
experiments with and without a face. Norwegian University of Life Sciences, Centre
for Land Tenure Studies: CLTS Working Paper, 1, 13.
BWCYA. (2010). Youth development scenario: Geared and accomplished duties by
SNNPRG Bureau of Women's , Children's and Youth Affairs. Hawassa: Bureau of
Women's , Children's and Youth Affairs.
Cardenas, J. C. and Carpenter, J. (2008). Behavioural Development Economics: Lessons
from Field Labs in the Developing World. The Journal of Development Studies,
44(3), 311-338.
Chambers, R. (1995). Poverty and livelihoods: whose reality counts? Environment and
Urbanization, 7(1), 173-204.
Chambers, R. and Conway, G. (1992). Sustainable rural livelihoods: practical concepts for
the 21st century: Institute of Development Studies (UK).
CSA. (2012). Agricultural Sample Survey 2011/2012, Volume IV: Report On Land
Utilization. Addis Ababa, Ethiopia: Central Statistical Agency.
CSA. (2013). National Statstics Abstract. http://www.csa.gov.et. Centeral Statstical Agency.
CSA and ICF. (2012). Ethiopia Demographic and Health Survey 2011. Addis Ababa,
Ethiopia and Calverton, Maryland, USA: Central Statistical Agency and ICF
International.
Deininger , K. and Jin, S. (2006). Tenure Security and Land-related Investment: Evidence
from Ethiopia. European Economic Review, 50, 1245-1277.
Dufwenberg, M. and Muren, A. (2006). Generosity, anonymity, gender. Journal of Economic
Behavior & Organization, 61(1), 42-49.
Engel, C. (2011). Dictator games: a meta study. Experimental Economics, 14(4), 583-610.
doi: 10.1007/s10683-011-9283-7
Fafchamps, M. and Quisumbing, A. R. (2005). Marriage, bequest, and assortative matching
in rural Ethiopia. Economic Development and Cultural Change, 53(2), 347-380.
FDRE. (2005). Federal Rural Land Administration and Utilisation Proclamation. Federal
Democratic Republic of Ethiopia.
76
Ghebru, H. and Holden, S. (2008). Factor market imperfections and rural land rental markets
in Northern Ethiopian Highlands. In S. T. Holden, K. Otsuka and F. Place (Eds.), The
Emergence of Land Markets in Africa: Assessing the Impacts on Poverty, Equity and
Efficiency (pp. 74-92). Washington D.C: Resources For the Future Press.
Holden, S. T., Shiferaw, B. and Pender, J. (2004). Non-farm Income, Household Welfare and
Sustainable Land Management in a Less-favoured Area in the Ethiopian Highlands.
Food Policy 29, 369-392
Holden, S. and Tefera, T. (2008). From Being Property of Men to Becoming Equal Owners?
Early Impacts of Land Registration and Certification on Women in Southern
Ethiopia: Unpublished report for UNHABITAT.
Holden, S. T. and Yohannes, H. (2002). Land Redistribution, Tenure Insecurity, and Intensity
of Production: A Study of Farm Households in Southern Ethiopia. Land Economics,
78(4), 573-590.
ILO (2013). Global Employment Trends for Youth 2013: A generation at risk Geneva:
International Labour Office.
Lundberg, S. and Pollak, R. A. (1993). Separate spheres bargaining and the marriage market.
Journal of Political Economy, 988-1010.
Manser, M. and Brown, M. (1980). Marriage and household decision-making: A bargaining
analysis. International Economic Review, 21(1), 31-44.
Morse, S., Acholo, M. and McNamara, N. (2009). Sustainable Livelihood Approach: A
critical analysis of theory and practice: University of Reading.
Reardon, T. (1997). Using evidence of household income diversification to inform study of
the rural nonfarm labor market in Africa. World Development, 25(5), 735-747.
Scoones, I. (1998). Sustainable rural livelihoods: a framework for analysis (Vol. 72):
Institute of development studies Brighton.
Tessema, W. and Holden, S. T. (Eds.). (2007). Too Poor to Invest? Poverty and Farm
Intensification in Southern Ethiopian Highlands. Ås: Norwegian University of Life
Sciences,.
Woldenhanna, T. and Oskam, A. (2001). Income diversification and entry barriers: evidence
from the Tigray region of northern Ethiopia. Food Policy, 26(4), 351-365.
Wooldridge, J. M. (2002). Econometric analysis of cross section and panel data. Cambridge,
Mass.: MIT Press.

77
Appendices
Appendix 1. Additional result tables
Appendix 1.1 Marginal effects of covariates on likelihood of choosing farming as a
livelihood
Marginal effects
Delta-method
dy/dx Std. Err. P>z
Female youth -0.051 0.031 0.105
Age 0.005 0.004 0.284
Education (years) -0.014 0.004 0.001
Currently student -0.085 0.029 0.003
First born 0.038 0.029 0.184
Married 0.057 0.033 0.080
Land holding 0.200 0.051 0.000
Age of household head -0.001 0.001 0.279
Education of household head(years) 0.006 0.004 0.173
Number of brother and sisters -0.003 0.006 0.613
Livestock holding (tlu) 0.001 0.002 0.804
Value of asset owned -0.014 0.014 0.333
Arsi Negelle -0.099 0.035 0.005
Wondo Genet -0.005 0.042 0.909
Wollaita -0.135 0.046 0.003
Wondo-Oromia -0.080 0.045 0.074
Number of sibling migrated 0.011 0.012 0.374
Number of siblings in business -0.046 0.027 0.082
Number of sibling in nonfarm employment 0.000 0.012 0.977

78
Appendix 1..2 Factors associated with household member international migration
decisions
Migrate abroad
Model1 Model 2
Female youth 0.536*** 0.611***
(0.210) (0.210)
Age -0.049 -0.045
(0.150) (0.160)
Age, squared 0.000 -0.001
(0.000) (0.000)
Education level 0.110**** 0.126****
(0.030) (0.020)
Ln(Farm size), ha 0.205** -0.040
(0.090) (0.130)
Female headed 0.149 0.035
(0.430) (0.480)
Age of Household head 0.012 0.018*
(0.010) (0.010)
Education household head 0.006 0.011
(0.040) (0.040)
Male work force -0.023 -0.018
(0.090) (0.070)
Female work force 0.027 -0.031
(0.080) (0.080)
Household size 0.027 0.065
(0.050) (0.040)
Livestock (in tlu) -0.014* -0.029***
(0.010) (0.010)
Arsi Negelle 0.330
(0.270)
Wondo Genet -0.745*
(0.390)
Wollaita -0.945**
(0.460)
Wondo Oromia
Constant -3.086* -3.623**
(1.620) (1.580)
Prob > chi2 0.000 0.000
Loglikelihood -75.02 -68.63
Number of observations 1393 1324

79
Appendix 2. Survey Instruments : Questionnaires and experiment protocols
Norwegian University of Life Sciences
In collaboration with
UN-Habitat
Land Access and Youth Livelihood Opportunities in Southern Ethiopia
Youth questionnaire
February 2013
Zone ____________
Zone codes : 1=West Arsi, 2=Sidama, 3=Wollaita
Woreda __________
Woreda codes : 1=Sashemene, 2=Arsi Negelle, 3= Wondo Genet, 4= Wollaita, 5=Wondo Genet Oromiya
Kebelle ____________(2013)
Kebelle codes: 1=Abaro, 2=Muleta, 3=Shere Derara, 4=Maja Dema, 5=Bulcha Deneba, 6=Askoka, 7=Gorbi
Derera, 8=Makoda, 9=Gembelto, 10= Gununo, 11 =Doge shakisho, 12=Doge mashido, 13= Wosha soyama, 14
= Damba zamine, 16=Wondo chuko, 17=Medo, 18= wotera, 19=Ebicha, 20=Gununo01, 21= Gununu02,
22=Gununu 03
Name of head of household________________________Hh.Number______________ Name of youth respondent:______________________________ Respondent ID in the HH:_____
Age_____________________gender___________________(Code: 1=female, 0= male)
Relation to household head:_____
Codes: 1=own son/daughter, 2=Step-son/step-daughter, 3=brother/sister of head or spouse, 4=
grandson/granddaughter, 5=Nephew/niece, 6=Other, specify:____________
Date of interview:________________________ Enumerator: ____________________ Code ____ Signature ______________

80
Questionnaire for Youth
From the household roster, fill out the name and address of the household head AND the name
and ID of the YOUTH RESPONDENT before asking the following questions.
1. Questions on land and family relations
S.No Questions Unit Answer
1 Have you ever been to school? 1=yes, 0= no Code
2 If yes, what is the highest grade you completed? (eg. 6=6th grade) Number
3 If no, why not? 1= Needed for work at home, 2= Needed for work at the farm, 3= School is very far, 4=Not healthy enough/got sick 5= financial problem, 6= others
Code
4 Are you a student now? 1=yes, 0= no Code
5 Have you ever dropped out of school? 1=yes, 0= no Code
6 If yes, why? 1= Needed for work at home, 2= Needed for work at the farm, 3= School is very far, 4=Not healthy enough/got sick 5= financial problem, 6= others
Code
7 Are you engaged in farming activity? 1=yes, 0= no Code
8 How ? 1= As a family labor only, 2= co-manage the farm with parents , 3= co-manage the farm with siblings, 4= work as a tenant only, 5= have my own farm, 6=other
Code
9 Have you ever tried to get access to agricultural land ? 1=yes, 0= no
Code
10 Did you succeed in getting access to agricultural land? 1=yes, 0= no
11 If you tried and succeeded how did you get access to land? 1=obtained/inherit land from parents, 2=obtained individual land from PA, 3=Obtained group land from PA, 4= ‘purchased land’, 5= rented land for cultivation, 6= other
Code
12 Have you ever co-managed land with your siblings? 1=yes, 0= no
Code
13 If yes, how often do you experience conflict concerning use of the land? 1= frequently, 2= sometimes, 3=rarely, 4=never
Code
14 Have you ever co-managed land with your parents? 1=yes, 0= no
Code
15 If yes, how often do you experience conflict concerning use of the land? 1= frequently, 2= sometimes, 3=rarely, 4=never
Code
16 If you haven’t received land from your parents yet, do you think you will get land from them someday? 1=yes, 0= no
Code
17 If you haven’t received land from your parents yet, do you think you should have received by now? 1=yes, 0= No
Code
18 At what occasion do you think it is appropriate for parents to bequeath land to their children? 1=At marriage, 2= Only if/when both parents die, 3=Only if/when the father dies, 4= when either of the parents die, 5= when the son/daughter become adult even if is not soon to be married, 6=after completing highschool/college and have no other employment, 7=others____________
Code
19 If you obtain land, what do you intend to do with it? 1=cultivate it, 2=rent/share-crop it, 3= ‘sell it’, 4= use it for non-farm investment, 5= Use it only for residential building
Code

81
20 In terms of possible success and happiness of the family, how do you compare parental arranged marriage(marriage1) with marriage decided by marrying couples (marriage 2)? 1=marriage 2 is much better than marriage 1, 2= marriage 2 is somewhat better than marriage 1 3= they are the same/depends on the family, 4=marriage 1 is somewhat better than marriage 2 5= marriage1 is much better than marriage 2
Code
21 Are you married or engaged? 1= yes, 0= No Code
22 If yes, was it an arranged marriage/engagement? 1= yes, 0= No
Code
23 If no, Is it possible that your parents may decide to arrange a marriage for you? 1=Yes, 0= no, 2= I don’t know/May be
Code
24 If your parents choose a husband/wife for you, will you agree to marry that person? 1=yes, 0=no, 2= It depends
Code
25 If you have/could have the money and your sister or brother needs to borrow 300 birr, will you lend her/him? 1=yes, 0=No, 2= Depends on what he need it for
Code
26 If you have/could have the money and your mother or father needs to borrow 300 birr, will you lend her/him? 1=yes, 0=No, 2= Depends on what he need it for
Code
27 Write whether or not you would work in the following conditions
a Work two weekends in exchange for a new school uniform for your brother or sister or other near relation? 1= yes, 0= No
Code
b Work two weekends in exchange for advanced equipment to be donated for the local school laboratory? 1= yes, 0= No
Code
c Work two weekends in exchange for 100 birr worth of clothes for your parents? 1= yes, 0= No
Code
28 Do you have a separate cash economy from your parents or do you share your income with your parents? 1=I decide over my own income independently, 2=I share part of my income with my parents but I decide how much, 3=I share my income with my parents but retain some for my own use, 4=I give all my income to my parents and ask when I need some things, 5=Other, explain:
Code
29 How many of youth friends do you have that you trust so much that you would dare to lend them 100 EB (and expect to get it back)?
Number
30 Do you have equal trust in all your close relatives (father, mother, brothers, sisters)? 1=Yes, 2=No, it varies across persons, 3=No, it depends on the issue (such as money matters, work cooperation in the family, asset sharing, keeping promises, provide help when asked for)
Code(s)
31 If your answer to the previous question was 2(varies across persons), elaborate: 1=I trust my parents more than my brothers and sisters, 2=I trust my brothers and sisters more than my parents, 3=I trust my father more than my mother, 4=I trust my mother more than my father, 5=Some of my brothers/sisters are more trustworthy than others, 6=Other, specify:________________
Code(s)
32 If trust depends on the issue (such as money matters, work cooperation in the family, asset sharing, keeping promises, provide help when asked for), give a rank to each of the following person for each of these issues: Ranks: 1=Very trusted, 2=Trusted, 3=Sometimes unreliable, 4=Often unreliable, 5=Unreliable, -99=Not applicable (eg. No brother or no mother)

82
32a Money matters: Use ranks above for Father
Mother
Oldest brother
Oldest sister
Other brothers
Other sisters
32b Work cooperation in the family Father
Mother
Oldest brother
Oldest sister
Other brothers
Other sisters
32c Asset sharing, Father
Mother
Oldest brother
Oldest sister
Other brothers
Other sisters
32d Keeping promises, Father
Mother
Oldest brother
Oldest sister
Other brothers
Other sisters

83
32e Provide help when asked for Father
Mother
Oldest brother
Oldest sister
Other brothers
Other sisters
2. Livelihood questions and information on siblings
S.no Questions Unit Answer
1 Did you live with your parents the last 6 years? 1=yes , 0=No Code
2 Rank in birth order in family: 1=First born, 2=Second born, etc. Rank
3 Main occupation: 1=Schooling, 2=Farming, 3=Off-farm job, 4=Business,
5=Unemployed
Code
4 Highest schooling grade completed by any member in your household Grade
5 What is your planned future livelihood/occupation? 1=Take over the farm
from parents, 2=Farm together with parents, 3=Farm together with
siblings, 4= Farm together with parents and siblings, 5=Off-farm wage
employment in the kebele or woreda , 6=Business , 7=Resettlement,
8=Work in government office or private companies, 9=Higher education,
10=Marry and farm with husband, 11=Marry and find livelihood outside
agriculture/farming 11=Other, specify:__________________
Code
Questions on sibilings
6 Number of brothers No
7 Number of sisters No
8 Number of brothers staying in the household No
9 Number of sisters staying in the household No
10 Number of brothers going to school No
11 Number of sisters going to school No
12 Number of brothers involved in farming No
13 Number of sisters involved in farming No
14 Number of brothers with off-farm job (in rural areas) No
15 Number of sisters with off-farm job (in rural areas) No
16 Number of brothers involved in business No
17 Number of sisters involved in business No
18 Number of brothers unemployed No
19 Number of sisters unemployed No
20 Number of brothers married No
21 Number of sisters married No
22 Number of brothers migrated to urban areas No
23 Number of sisters migrated to urban areas No
24 Number of brothers migrated abroad No
25 Number of sisters migrated abroad No
26 Number of brothers migrated other rural areas No
27 Number of sisters migrated other rural areas No

84
Questions for household head (if head not available, interview the spouse or another adult)
1. Questions on youth members (sons/daughters and other relatives living with the household head)
S.no Questions Unit Answer
1 How many male children aged 15-29 do you have? Number
, 2 How many female children aged 15-29 do you have? Number
3 How much land do you have? Temad
4 Have you ever given any land to your children?
1=yes, 0= no
Code
5 If yes, who got it?
(enumerator: consult the roster for individual ID )
Individual ID
(separate if more than
one)
6 Do you intend to give your children any part of your
current land holding while you are alive?
1=yes, 0= no
Code
7 If yes, which of your land/plot will you transfer first?
1= land/plots further from my homestead, 2=
land/plots closes to my homestead, 3= the less fertile
land, 4= the more fertile land, 5= plots I have been
renting out, 6= no particular choice , 7= other criterion
Code
8 If yes, who will get the land (or part of it)? Individual ID
(separate if more than
one)
9 How much land will you bequeath to your children? Temad
10 If only one or some of your children get the land, what
is the most important criterion for bequeath?
1=gender (male children given priority), 2=farming
ability (strong farmer given priority), 3= birth
rank(elder children given priority), 4=marriage
(person(s) marrying given priority), 5= favorite
son/daughter given priority, 6=other
Code
11 At what occasion do you think is it appropriate to
bequeath land?
1=At marriage, 2= Only if/when both parents die,
3=Only if/when the father dies, 4= when either of the
parents die, 5= when the son/daughter become adult
even if is not soon to be married, 6= after the youth
finish high school/college and is unemployed,
7= others________
Code
12 Will any of your daughters inherit land from you?
1=yes, 0= no
Code
13 Do you think that there is (or there will be in the
future) a competition among your children for access
to your land?
1=yes, 0= no
Code
14 Did you inform your children about whether or not
they will inherit land from you? 1=yes, 0= no
Code

85
15 Do any of your sons/daughters work on your land?
1=yes, 0= no
Code
16 If yes, how are they engaged?
1= As a family labor only, 2= co-manage the farm
together and share output, 3= son/daughter work as a
tenant only, 4= other
Code
17 If you are co-managing the land with your children,
how often do you experience conflict concerning use
of the land?
1= frequently, 2= sometimes, 3=rarely, 4=never
Code
18 Are any two or more of your children engaged among
themselves in co-managing this households’ or
another land? 1=yes, 0= no
Code
19 If yes, how often do they experience conflict
concerning use of the land?
1= frequently, 2= sometimes, 3=rarely, 4=never,
5=don’t know
Code
20 Are there family members between the age of 6 and
18 that are not attending school? 1=yes, 0= no
Code
21 If there are, how many? Number
22* Which of types of children do you believe should be
kept in the school the longest? (write in the box
clearly and briefly)
23* Which types of children do you believe should be
pulled out whenever there is a need (write in the box
clearly & briefly)
* Open ended question for background information
2. Questions on land certificate
24 Do they have a land certificate? 1=Yes, 0=No
Code
25 If yes, how long was it since you received the certificate?
Years
26 If yes, where do you keep it? 1=in a locked safe box, 2= In unlocked box with other documents, 3= No specific place-different places, 4=other _______________________
Code
27 If yes, who keeps it? 1=household head, 2= household head or spouse, 3= son/daughter with the most education, 4=everyone knows/is responsible for keeping the certificate, 5=others_______
Code
28 Enumerator: Ask the household to show you the certificate and rank (1 to 5) how well the certificate is maintained . 1=certificate is tattered/writing difficult to read, picture difficult to see, 2= writing in certificate is readable but shows some tear or much crease, 3= Certificate looks old /dirty and few creases but no tear 4= certificate not very clean or new but no crease or tear, 5= certificate is like new
Code
29 If household didn’t show certificate, why not: 1=Never received one, 2=Lost it, 3=Have resubmitted it to LAC, 4=Have resubmitted it to Kebelle leaders, 5=Not willing, 6=Other, __________
Code
30 If they have a certificate, whose names are on the Code

86
certificate? 1=Husband's only, 2=Husband and wife, 3=Husband and several wives (polygamous hh), 4=Husband, wife and children, 5=Husband, several wives and children, 6=Female head, 7=Female head and children, 8=Polygamous wife and her children, 9=Polygamous wife only, 10=Polygamous wife, husband, and their joint children/her children, 11=Other, explain
31 If you have a certificate, are there photos on the
certificate? 1=Yes, 2=No
Code
32 If yes to photos, whose photos are on the
certificate? 1=Husband only, 2=Husband and wife, 3=Female head only, 4=Polygamous wife only, 5=Polygamous wife and husband, 6=Polygamous husband and first wife, 7=Polygamous husband and more than one wife (is there space on the certificate in SNNP?), 8=Other______________________
Code

87
UN-Habiatat Youth and Land
Experimental protocol
Introduction to social experiment 1
This is an experiment for pairs of youth family members (can be a brother and sister, two brothers, or
two sisters). The players will also answer a questionnaire. The group of pairs is first divided in two
equally sized groups where persons from each pair join the same group. One of the groups is
organized to answer the questionnaire (survey instrument) before they play the games. The other
group plays the experiments first, and responds to the questionnaire afterwards. Separate enumerators
should do the interviews, and trained experimenters should do the experiments under close
supervision. The groups and individual members should be kept separate such that they do not
influence the responses of others in the survey interviews as well as in the experiments.
Identify first player (who is also giver in Trust game)
1. Call youth pairs one at the time. Fill out, front page information on household and players. This
first game will identify who of the two players will play first. There should be no communication
between the players during these games.
2. Toss a coin where Head on the coin represents the oldest and Tail represents the youngest of the
pair. Mark who the player is.
3. The experiment starts for the player who won the coin toss, while the other player start with
her/him in a separate place, where s/he could play the dictator game first, and then get the
envelope with donation from the first player/donation from random unknown person).
First player Game
First player Dictator Game:
1. The first player can now freely and independently decide how to share 30 Birr (2 “10 Birr” notes
and 2 “5 Birr” notes) between him-/herself and each of three different options, out of which one
will be real and determined through lottery after s/he has decided how much to share with each:
Write the allocation decision in the form provided .Allocation decisions:
a) Her/his brother/sister also playing the game: How much will s/he
allocate?__________EB
b) Her/his father (or other head of household if no father): How much will s/he
allocate?__________EB
c) Another unknown( random) youth among the youth that will play the game in the village:
How much will s/he allocate?__________EB
2. Toss a coin (head=household head, Tail= brother/sister. Write in the game form provided:
Outcome of toss___________
Amount allocated for other person:___________EB
3. The player keeps the amount he should have in the selected choice. You should then write in a
separate ACCOUNT form the receiver of the money from this game (anonymous vs. sibling)
and the amount of money to be paid later.

88
First player Trust Game:
Trust games
Introduce the next game , 30 EB is put in front of the player but it is explained that this game is
different. Again s/he should decide about possibly sharing part of the money with the same three
alternatives as in the previous game. But in this case we multiply the amount given by 3 such that
the other player will get an amount which is three times higher than what s/he gives. Following that
the other player can also chose to give back part of the amount received to the first player. The other
player is free to decide how much s/he will give back to the first player. The second player will be
informed that the amount given by the first player was tripled by the researchers and based on that
s/he will decide whether to give something back and how much to give back. The first player is also
free to give nothing or to give up to 30 EB to the other player. If s/he gives 30 EB the other player
will get 90 EB and is then free to keep it all or can return part or all of it to the first player.
1. With these rules the player will decide first how much to allocate to each of the three persons
like in the previous game. Write in the form provided, how much money the player decides to
send in each of the following case.
a) Her/his brother/sister also playing the game: How much will s/he
allocate?__________EB
b) Her/his father (or other head of household if no father): How much will s/he
allocate?__________EB
c) Another unknown (random) youth among the youth that will play the game in the village:
How much will s/he allocate?__________EB
2. The player will be informed that the real receiver of the transfer is identified by lottery after s/he
left for the youth questionnaire interview. S/he will be informed that s/he will get the money from
the trust game after the completion of the interview. (This will allow us to prevent the player from
knowing whether or not the receiver is the sibling or anonymous youth from the village. The
sibling can tell later his/her sharing decision if s/he wants to.
3. After the player has left for the youth questionnaire interview and before calling another player, a
coin is then tossed to identify whether the receiver of the transfer from the trust game is
i. The brother/sister if the coin lands on Head (Code =1)
ii. The unknown random youth person if the coin lands on Tail (Code=2)
(the parent/head of household is dropped from the payout here but this is told to the
player only after s/he has decided the allocation for each).
4. The money allocated is tripled by the researchers and put in an envelope marked with TRUST +
Household ID number or TRUST N if for random youth. The envelopes are transferred to the
other playroom. Some extra envelopes with randomized amounts from “anonymous person” can
be used at the beginning

89
Second player Game
Second player Dictator Game:
1. The second player can now freely and independently decide how to share 30 Birr (2 “10 Birr”
notes and 2 “5 Birr” notes) between him-/herself and each of three different options, out of which
one will be real and determined through lottery after s/he has decided how much to share with
each: Write the allocation decision in the form provided .Allocation decisions:
d) Her/his brother/sister also playing the game: How much will s/he
allocate?__________EB
e) Her/his father (or other head of household if no father): How much will s/he
allocate?__________EB
f) Another unknown( random) youth among the youth that will play the game in the village:
How much will s/he allocate?__________EB
2. Three cards (1=a, 2=b, and 3=c) are used and mixed and the player pulls one to determine who
will get the money out of the three above. Write in the game form provided:
Outcome of card sampling (a, b or c):___________
Amount allocated for other person:___________EB
The player keeps the amount he should have in the selected choice. You should then write in a
separate ACCOUNT form the receiver of the money from this game (anonymous vs. sibling) and
the amount of money to be paid later.
Second player Dictator Game:
Introduce the game: The next game is introduced, which is a trust game. Explain that 30 EB is put in
front of the first player (brother/sister). S/he should decide about possibly sharing part of the money
with the same three alternatives as in the previous game. But in this case we multiply the amount
given by 3 such that the second player will get an amount which is three times higher than what s/he
gave. Following that the second player can chose to give back part of the amount received from the
first player who will get what is returned (full amount but not tripled this time). The second player is
free to decide how much s/he will give back to the first player. If the first player gives 30 EB, the
second player will get maximum 90 EB and is then free to keep it all or can return part of it to the first
player.
1. Now assume that you receive 45 EB in the envelope from the first player. This implies that the
first player gave 15 EB out of the 30 EB s/he received. Based on this, how much will you give
back to the first player if the first player is: (write the answer in the game form provided)
a. Her/his brother/sister also playing the game: How much will s/he
allocate?__________EB
b. Her/his father (or other head of household if no father): How much will s/he
allocate?__________EB
c. Another unknown( random) youth amoung the youth that will play the game in the
village: How much will s/he allocate?__________EB
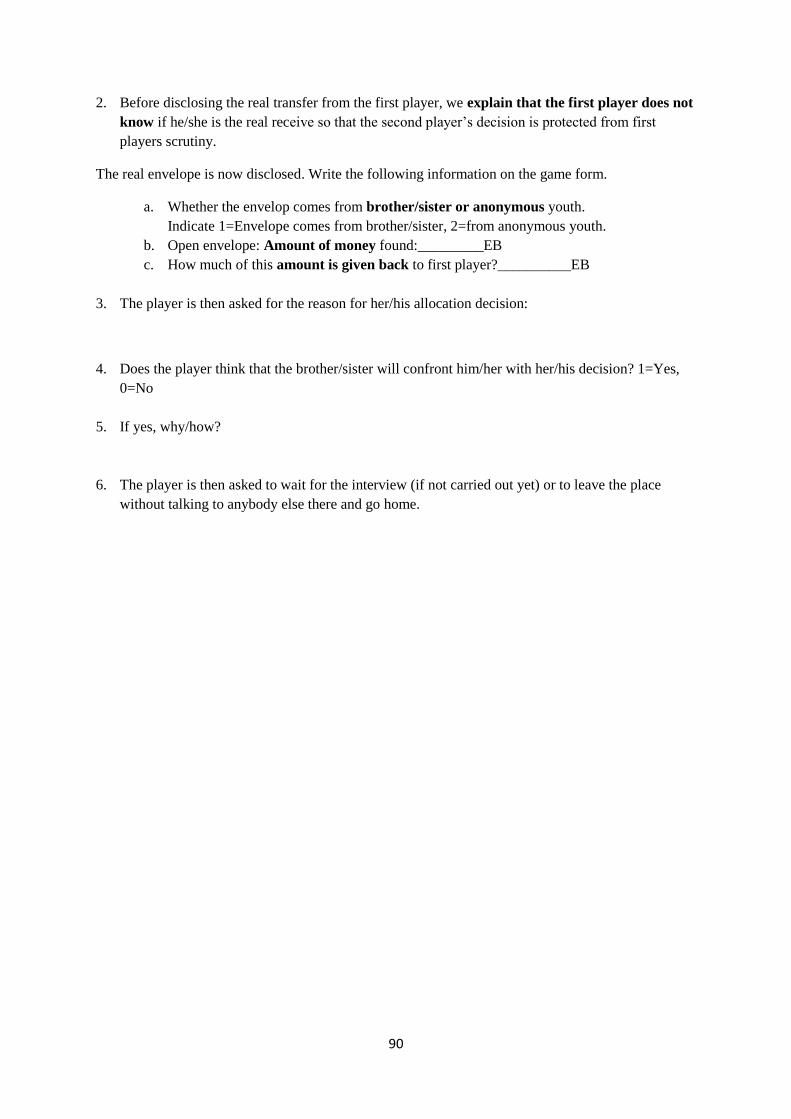
90
2. Before disclosing the real transfer from the first player, we explain that the first player does not
know if he/she is the real receive so that the second player’s decision is protected from first
players scrutiny.
The real envelope is now disclosed. Write the following information on the game form.
a. Whether the envelop comes from brother/sister or anonymous youth.
Indicate 1=Envelope comes from brother/sister, 2=from anonymous youth.
b. Open envelope: Amount of money found:_________EB
c. How much of this amount is given back to first player?__________EB
3. The player is then asked for the reason for her/his allocation decision:
4. Does the player think that the brother/sister will confront him/her with her/his decision? 1=Yes,
0=No
5. If yes, why/how?
6. The player is then asked to wait for the interview (if not carried out yet) or to leave the place
without talking to anybody else there and go home.
Recommended