This article was downloaded by: [Linkopings universitetsbibliotek]On: 13 March 2013, At: 02:04Publisher: Taylor & FrancisInforma Ltd Registered in England and Wales Registered Number: 1072954 Registered office: Mortimer House,37-41 Mortimer Street, London W1T 3JH, UK
International Journal of Pavement EngineeringPublication details, including instructions for authors and subscription information:http://www.tandfonline.com/loi/gpav20
Laboratory Performance Evaluation of Modified AsphaltMixtures for Inchon Airport PavementsHyun-Jong Lee a , Jo S. Daniel b & Y. Richard Kim ca Department of Civil Engineering, Kangnung National University, Kangnung, Kangwondo,210-702, Koreab Graduate Research Assistant Department of Civil Engineering, North Carolina StateUniversityc Associate Professor Department of Civil Engineering, North Carolina State UniversityRaleigh, P.O. Box 7908, NC, 27695-7908Version of record first published: 01 Feb 2007.
To cite this article: Hyun-Jong Lee , Jo S. Daniel & Y. Richard Kim (2000): Laboratory Performance Evaluation of ModifiedAsphalt Mixtures for Inchon Airport Pavements, International Journal of Pavement Engineering, 1:2, 151-169
To link to this article: http://dx.doi.org/10.1080/10298430008901703
PLEASE SCROLL DOWN FOR ARTICLE
Full terms and conditions of use: http://www.tandfonline.com/page/terms-and-conditions
This article may be used for research, teaching, and private study purposes. Any substantial or systematicreproduction, redistribution, reselling, loan, sub-licensing, systematic supply, or distribution in any form toanyone is expressly forbidden.
The publisher does not give any warranty express or implied or make any representation that the contentswill be complete or accurate or up to date. The accuracy of any instructions, formulae, and drug doses shouldbe independently verified with primary sources. The publisher shall not be liable for any loss, actions, claims,proceedings, demand, or costs or damages whatsoever or howsoever caused arising directly or indirectly inconnection with or arising out of the use of this material.
Inrrm. J. Pmrrnmt Engineering. 2MO. Vol ((2,. pp. 151-169 Reprintr "vuilabls d iml ly fmm Ihe publisher Phulacapying pcrmiltcd by license only
O 2WOOPA (Oveneu hbl i rhen Assminion) N.V. hblirhcd by liccnrc undcr (he
Gordon m d Bmrch Scicnee hblisherr imprint. Printed in Malaysia
Laboratory Performance Evaluation of Modified Asphalt Mixtures for Inchon Airport Pavements
HYUN-JONG LEE"*, JO S. DANIEL^ and Y. RICHARD KIM'^
"Deparrmenr rf Civil Engineerirlg Kangnun~ Narional University Kangnung. Kangwondo 210-702, Korea. b~radlcore Research Assisronr Deparrmenr of Civil Engineering Norrh Carolina Stare University and CAssociare Professor RO. Box 7908 Depann~enr of Civil E~rgineering Norrh Carolina Stare Universiry Raleigh. N C 27695-7908
(Received January 19. 1998; Infinal form July 29. 1999)
In this paper, fatigue and rutting characteristics of various modified and unmodified mixtures are evaluated using uniaxial tension and triaxial compression cyclic tests, respectively. The fatigue and healing behavior of the mixes is presented by means of the viscoelastic, contin- uum damage (VCD) model previously developed by the authors. Since the VCD model takes the same form as the classical, strain-based fatigue model, the coefficients in the classical model are described in terms of fundamental material properties and test conditions in the VCD model. The explicit form of the VCD model and different performance data from all the mixes are used to investigate the effects of the material properties on the fatigue life and microdamage healing potential of asphalt concrete. Structural analysis based on the multi-lay- ered elastic theory is conducted to compare the fatigue lives of the various mixes in pavement systems.
A simple permanent deformation model that correlates vertical pernlanent strain and number of applied loads is used in representing the data from the triaxial compression tests at different confining pressures. The modified mixtures demonstrate better rutting resistance as expected, although the ranking among the modified mixtures changes depending on the con- fining pressure. The role of additive at high temperatures and different gradations and binder contents used in the modified mixtures seem to explain these observations.
Keywords: Modified Asphalt Mixtures, Fatigue, Healing, Rutting. Viscoelasticity. Damage
INTRODUCTION though the materials and environmental conditions of
Yong Jong-Do pavements are different from those
The Korean Airport Construction Authority plans to used in developing the FAA design equations. Dae-
build an international airport a t YongJong-Do, Korea. bon Engineering Corp. (DEC) was charged to build
Pavements in the airport are designed based on the and evaluate test pavement sections to verify the
FAA airport pavement thickness design method even thickness designs and has developed a comprehensive
* Phone: 82-391-640-2419 FAX: 82-391-640-2244 E-mail: [email protected] t Phone: 919-515-7758 FAX: 919-515-7908 E-mail: [email protected]
151
Dow
nloa
ded
by [
Lin
kopi
ngs
univ
ersi
tets
bibl
iote
k] a
t 02:
04 1
3 M
arch
201
3

HYUN-JONG LEE et a/.
plan to instrument these pavements with sensors to mcuurc pavcnicnt responses (stresses, strains, and dcforniations) under simulated loading conditions.
As n part of this work, laboratory fatigue and per- mancnt dcformntion modcls were applied to the vari- ous modilicd and unmodified mixtures used in the ficld tcst pavement project. The principal objectives of thc work conducted at North Carolina State Uni- vcrsity wcrc: (I) to determine the viscoelastic mate- rial propcrtics of the asphalt mixtures at varying loading frcqucncics; and (2) to evaluate the fatigue and rutting pcrformance of the different asphalt mix- turcs. Evcntually, the laboratory prediction models wcrc used to provide information on performance ranking of these mixtures in terms of fatigue and rut- ting.
Thcrc arc scvcn diffcrent asphalt mixtures used in thc construction of the test sections, five mixtures for thc surface course and two for the base course. The materials for the surface course include a conven- tional dcnsc graded asphalt mixture, Stone Matrix Asphalt, and asphalt mixtures modified with Latex (SBR), SBS, and Gilsonite (hereafter called S19, SMA, SBR, SBS, and GIL mixtures, respectively). The two materials used for the asphalt concrete base coursc arc a conventional asphalt base course and asphalt ~nodificd with Chemcrete (hereafter called 025 and CHE mixtures, respcctively).
Uniaxial tensile creep tests were performed to mcasurc viscoelastic material properties of each mix- turc. Rclaxation modulus and dynamic modulus were predicted from the creep data using theory of linear viscoclasticity. Uniaxial tensile fatigue tests were conducted on the seven asphalt mixtures to evaluate fatigue pcrformance. A mechanistic fatigue perform- ancc prediction model proposed by Lee and Kim ( 19983, 1998b). and Lee el al. (1 998) was used to esti- mate the fatigue lives of the mixtures. Rutting per- formance was evaluated for five surface course materials by performing triaxial compression tests. A typical permanent deformation model was adopted in this study to model the permanent deformation of the mixtures.
PERFORMANCE PREDICTION MODELS
Fatigue Prediction Models
The two main approaches in the fatigue characteriza- tion of asphalt mixtures are phenomenologically and mechanistically based approaches. One of the most commonly used phenomenological fatigue models relates the initial response (such as tensile strain) of an asphalt mixture to the fatigue life:
where
Nf = number of cycles to failure,
~g = initial strain response, and
a, b = regression coefficients.
This phenomenological model is simple to use because only the mixture response at the initial stage of fatigue testing needs to be measured. This model does not account for how damage evolves throughout the fatigue life, and hence it is only valid for a given set of loading conditions (Dijk and Visser 1997) and may need additional means to account for complex damage under realistic loading conditions (e.g., multi-level loading, rest periods, etc.).
Recently, a uniaxial constitutive model of nonaging asphalt-aggregate mixtures has been developed by the authors (Kim et al. 1997, Lee and Kim 1998a, 1998b). It employs the elastic-viscoelastic correspondence principle (Schapery 1984) and Schapery's work potential theory (Schapery 1990) to model the mechanical behavior of asphalt concrete under cyclic loading with rest periods. It was proven by the labora- tory experimental study that this model was able to predict hysteretic stress-strain behavior of asphalt concrete under different loading histories (monotonic and cyclic), varying rates of loading, different modes-of-loading (controlled-stress and control- led-strain), various stresslstrain amplitudes, and ran- dom rest periods.
Based on the constitutive model described above, Lee et al. (1999) developed a simplified fatigue per- formance prediction model as follows:
Dow
nloa
ded
by [
Lin
kopi
ngs
univ
ersi
tets
bibl
iote
k] a
t 02:
04 1
3 M
arch
201
3
EVALUATION OF MODIFIED ASPHALTS
CI 16: : Pseudo Stiffness (SR)
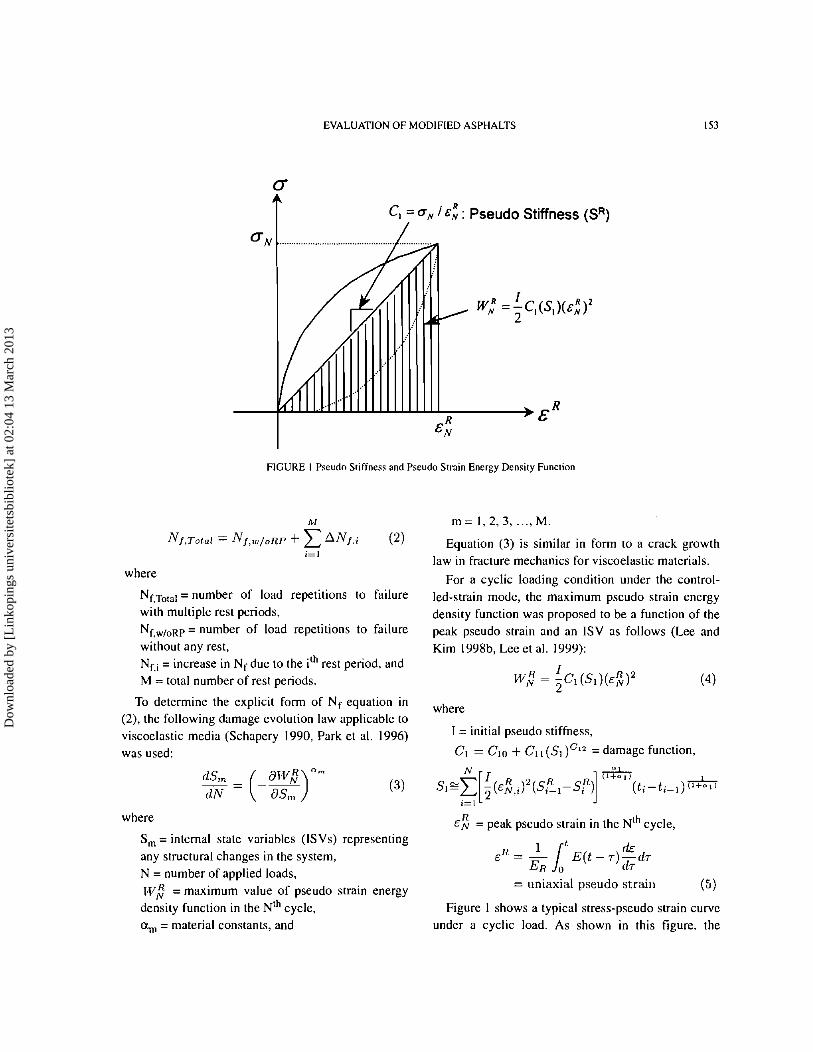
FIGURE I Pseudo Stiffness and Pseudo Strain Energy Density Function
where
Nf,Tol,l = number of load repetitions to failure with multiple rest periods, Nf,w/oRP = number of load repetitions to failure without any rest, Nf . i = increase in Nf due to the ith rest period, and M = total number of rest periods.
To determine the explicit form of Nf equation in (2). the following damage evolution law applicable to viscoelastic media (Schapery 1990, Park et al. 1996) was used:
where
S, = internal state variables (ISVs) representing any structural changes in the system, N = number of applied loads, 1.v: =maximum value of pseudo strain energy
density function in the N ' ~ cycle, a, = material constants, and
m = 1 , 2 , 3 ,..., M.
Equation (3) is similar in form to a crack growth law in fracture mechanics for viscoelastic materials.
For a cyclic loading condition under the control- led-strain mode, the maximum pseudo strain energy density function was proposed to be a function of the peak pseudo strain and an ISV as follows (Lee and Kim 1998b, Lee et al. 1999):
where
I = initial pseudo stiffness,
CI = C l o + Cll ( s ~ ) ~ ~ ~ = damage function,
R EN = peak pseudo strain in the N ' ~ cycle,
= uniaxial pseudo strain (5)
Figure I shows a typical stress-pseudo strain curve under a cyclic load. As shown in this figure. the
Dow
nloa
ded
by [
Lin
kopi
ngs
univ
ersi
tets
bibl
iote
k] a
t 02:
04 1
3 M
arch
201
3

154 HYUN-JONG LEE CI a/.
pseudo stiffness, denoted by sR, is defined as the slope of the stress-pseudo strain loop (i.e., n N / € ; ). Thc pseudo stiffness decreases as cyclic loading con- tinucs due to fatigue damage in the system, which is rcprcscntcd by the function C I . The S t in Equation (4) is thc first ISV representing the fatigue damage growth in the system.
The NI. equation without rest periods may be obtnincd by integrating Equation (3) after the substi- tuting in Equations (4) and (5):
where
11 = slope of the creep compliance versus time curve in log-log scales,
C I I , C I 2 =damage coefficients to be determined from experiments,
S I f = the value of damage parameter at failure.
EO = tcnsilc strain amplitude,
T = loading frequency, and
I E * ~ =dynamic modulus.
The Nl.,v,uRP is a function of damage evolution ch:~rncteristics of the material ( C I I and CI2), viscoe- lastic nia~erial propenies (n and I E* I), fatigue test conditions ( E ~ and 0, and a failure criterion (St&
The major difference between the fatigue model in Equation (6) and the phenomenological fatigue model in Equation ( I ) is that all the coefficients in the fatigue model in Equation (6) are represented by engi- neering parameters except the coefficients C I 1 and CI2 . These regression coefficients are necessary to model the nonlinear behavior of the material as it is undergoing damage. Pavement engineers may be able to use the fatigue model in Equation (6) as a tool to sclcct or design more fatigue resistant asphalt mix- turcs by investigating ways of changing the parame-
ters in ways that improve the fatigue life of the mixture.
Similarly, Lee et al. (1999) proposed the following equation for determining the increase in fatigue life due to a rest period:
where
p3 = l+(l-C32)a3,
C, = CZO + CZ1 ( s ~ ) ~ ~ ~ = increase in pseudo stiffness during the rest period,
C3!, C32 = damage coefficients after rest periods to be obtained from experiments,
a2 , a3 = material constants to be obtained from experiments,
SSe = a value of damage parameter S3 when
sR = s:: 7
~2 =pseudo stiffness immediately before the rest period, and
S: =pseudo stiffness immediately after the rest period.
Detailed steps involved in ;he development of the fatigue models in Equations (6) and (7) can be found in Lee et al. (1999). Substituting Equations (6) and (7) into Equation (2) gives the final equation:
In this study, both phenomenological and viscoe- lastic continuum damage models are applied to the fatigue characterization of asphalt mixtures.
Dow
nloa
ded
by [
Lin
kopi
ngs
univ
ersi
tets
bibl
iote
k] a
t 02:
04 1
3 M
arch
201
3

EVALUATION OF MODIFIED ASPHALTS 155
Permanent Deformation Model 'The permanent deformation is composed of two
In the last two decades, permanent deformation (rut- ting) has been one of the major traffic associated fail- ure modes in asphalt concrete pavements. Especially with increases in axle load, load repetition, tire pres- sure, and asphalt concrete thickness, a methodology to predict permanent deformation and mitigate poten- tial safety problems associated with this distress is needed (Sousa et al. 1990).
The layer-strain predictive methodology and vis- coelastic procedure have commonly been used to pre- dict the amount of rutting in a multi-layered asphalt pavement system (Sousa et al. 1990). The layer-strain method consists of predicting rut depths using perma- nent deformation characteristics determined from lab- oratory tests together with an analysis procedure for the pavement structure using either linear or nonlinear elastic theory. The general principle of this method was first proposed by Barksdale (1972) and Romain (1972). One of the major advantages of the viscoelas- tic approach is that moving wheel loads can be con- sidered in conjunction with time-dependent material properties to define the state of stress and strain at particular points in the pavement structure. Material properties can be defined either in terms of models consisting of finite numbers of Maxwell andlor Kel- vin elements in various arrangements. Detailed infor- mation on the layer-strain and viscoelastic methods is well reviewed by Sousa et al. (1990).
Since rutting in typical asphalt pavements has been found to primarily be a result of the permanent defor- mation in the asphalt layer (Sousa et al. 1990), this study focuses on the permanent deformation that occurs in the asphalt surface course only.
There are numerous types of permanent deformation models of asphalt concrete available. One of the most common permanent deformation models to correlate the plastic strain with number of cycles is as follows:
where
E~ = permanent strain,
N = number of applied loads, and k t , k2 = regression constants.
different mechanisms: densification (volume change) and repetitive shear deformation (plastic flow with no volume changes). In general, the densification occurs at the early stage of cyclic loading while the shear deformation (plastic flow) is a long-term process. Thus, the coefficient k, may represent the densifica- tion of the specimen. The slope of the plastic strain-number of cycle curve k2 may be more related to the characteristics of plastic flow. The coefficients k t and k2 depend mainly on the material types and state of stress, and can be determined from the labora- tory tests.
Stress states in a pavement section under the traffic loading vary from location to location. Brown and Bell (1977) proposed the use of stress invariants as the most appropriate method of representing the cor- rect stress state for material characterization. The use of stress invariants is particularly advantageous in the tension zone at the bottom of asphalt layers and also in predicting rutting away from the axis of symmetry of loading. Wijeratne and Sergious (1987) success- fully used two stress invariants, mean normal stress (p) and shear stress (q), to characterize the model coefficients k t and k2 in Equation (9).
Celard (1977) emphasized, based on the dynamic creep tests, the important effect of shear stress on the rate of permanent deformation. For example, in Celard's tests, increasing the shear stress from 0.1 to 0.25 MPa increased the rate of permanent deforma- tion from 0.1 to 10. On the other hand, varying the normal stress from 0.1 to 0.25 MPa did not signifi- cantly change the rate of permanent deformation. Similar conclusions can be derived from the work of Brown and Bell (1977).
MATERIALS AND TESTING PROGRAM
Materials
The asphalt cement used in this study was penetration grade 60-70 and the optimum binder content was determined by DEC using Marshall mix design
Dow
nloa
ded
by [
Lin
kopi
ngs
univ
ersi
tets
bibl
iote
k] a
t 02:
04 1
3 M
arch
201
3

HYUN-JONG LEE er 01.
Sieve Size (mm) FIGURE 2 Aggregate Gradations
method. Four different types of aggregate gradations SMA mixture has a 12.5 mm NMSA gradation and were used in this study as shown in Figure 2. As can the SBS mixture a different 19 mm gradation. For the bc seen in this figure, the S19, SBR, and GIL mix- asphalt treated base courses, B25 and CHE mixtures tures havc a typical dense gradation with nominal have the same gradation with a 25 mm NMSA. maximum size of aggregate (NMSA) of 19 mm. The
TABLE I Mixture Information
SIY 5.8 - 160 150 150 150
SHK 5.5 0.440 180 160 170 160
GII, 5.6 0.672 180 160 170 170
SllS 5.3 Premixed 180 160 180 160
SMA 6.7 0.482 180 150 160 150
1125 4.9 - 160 150 150 150
Cll l l 4.4 0.098 180 150 150 150
;I. Opti~nu~n aspht~lt content is by weight of dry aggregate. h. Modilier content is by weigh1 of dry aggregate.
Dow
nloa
ded
by [
Lin
kopi
ngs
univ
ersi
tets
bibl
iote
k] a
t 02:
04 1
3 M
arch
201
3

EVALUATION OF MODIFIED ASPHALTS 157
The general information on component materials, mixing and compaction temperatures, and mixing procedures was provided by DEC and summarized in Table I. Two different types of cylindrical specimens, 100 mm diameter by 150 mm tall specimens for fatigue testing and 150 mm diameter by 150 mm tall specimens for rut testing, were fabricated by using a gyratory compactor. Superpave Level 1 Mix Design (1995) was used to determine the appropriate com- paction parameters. Trial specimens for each mixture were compacted to determine the effort required to obtain the desired air void content of 4 * 0.5 %. Once this was done, the test specimens were fabricated with the correct air voids.
Testing Program
Uniaxial Tension Test
All tests were conducted at 25OC in a uniaxial tension mode using a servo-hydraulic closed-loop testing machine. Creep tests were performed for the charac- terization of viscoelastic material properties. Load levels used in the creep tests were between 267 N and 400 N. Displacements were measured between the top and bottom loading plates, which resulted in a 150 mm gage length. Stresses and strains used in the analysis were nominal (average) values.
A haversine wave with 0.2-second loading time was used in fatigue tests. Two loading histories in the fatigue tests were used for different purposes. These loading histories were:
I) Constant strain amplitude cyclic loading histo- ries without rest periods to characterize the fatigue performance of the materials, and 2) Constant strain amplitude cyclic loading histo- ries with rest periods to characterize microdamage healing of the materials.
The first loading history was used to model the damage growth in asphalt concrete. In order to char- acterize the short, intermediate, and long term fatigue damage of asphalt concrete, four different strain amplitudes were experimentally determined to pro- duce failure at approximately 3,000, 10,000, 50,000, and 300,000 cycles.
The second loading history was designed to evalu- ate and model the microdamage healing that occurs during rest periods. Three different strain amplitudes were used in these tests. Five different rest durations (20, 40, 80, 320, and 1280 seconds) were introduced between repetitive loading groups. The number of cycles in a loading group between two rest periods was large enough to eliminate the effects of the previ- ous rest period on the current one, and to create some additional damage in the specimen. With these issues in mind, two sequences of loading and rest periods were carefully designed. The first sequence was com- posed of five loading blocks separated by five rest periods in increasing duration. In the second sequence, the order of the rest periods was reversed (i.e., decreasing duration). Upon completion of the second sequence, the specimens were subject to con- tinuous cyclic loading until failure occurred.
Triaxial Test
The five surface course materials evaluated in this portion of the study included S19, SBR, GIL, SMA, and SBS. Recognizing the fact that fairly thick sur- face courses are to be used in the Inchon airport pave- ment and based on published report (Sousa et al. 1990), it was decided that the evaluation of the sur- face materials was sufficient.
To characterize the rutting performance of the materials, triaxial tests were conducted at 60°C under different stress states using a servo-controlled pneu- matic machine in the "Texas" triaxial mode. This machine has an actuator loading capacity of 5 kN on the vertical axis, and a confining pressure capacity of 400 kPa. The triaxial test method employed in this study applies the confining pressure to the perimeter of the cylindrical specimen without applying the same stress to the ends of the specimen, by exposing the ends out of the triaxial cell. Therefore, it is not neces- sary to start from a state of stress that is virtually hydrostatic, nor is it necessary to make corrections for loading shaft and platen areas in the computation of stress. Also, the radial pressure applied to the speci- men is controlled separately from that provided by the axial actuator. Two LVDTs were used for the meas- urements of vertical deformations. In addition, two radial deformations were measured. An environmen-
Dow
nloa
ded
by [
Lin
kopi
ngs
univ
ersi
tets
bibl
iote
k] a
t 02:
04 1
3 M
arch
201
3

HYUN-JONG LEE er a/.
1E-05 0.0001 0.001 0.01 0.1 1 10 100
Frequency (Hz)
Frequency (Hz) FIGURE 3 Dynamic Modulus versus Frequency: (a) Surface Mixes; (b) Base Mixes
tnl chamber that accommodates the triaxial testing conditions that occur in the field. Therefore, the load- machine was used to maintain the test temperature. ing and environmental conditions for this testing were
The objective of the triaxial testing was to develop chosen to achieve a reasonable number of cycles to on accelcr~tcd test method by which the relative per- failure while providing a clear distinction in rutting fornlances of the five mixtures could be determined. performance among the five mixtures. By definition, an accelerated test can not simulate the
Dow
nloa
ded
by [
Lin
kopi
ngs
univ
ersi
tets
bibl
iote
k] a
t 02:
04 1
3 M
arch
201
3

EVALUATION OF MODIFIED ASPHALTS 159
TABLE I1 Stress States Used in Triaxial Compression Tests
Srress Amplirude ofAxial Luading Confining Pressure Max. Mean Normal Stress, Max. Shear Stress. ldenrificarion
fkPa) PO) P fkpa) 4 W a )
CCI 275 405 118 235
CCZ 275 20 105 255
CC3 275 10 98 265
A haversine loading with 0.5 s of loading time and 1.5 s of rest period was used in the axial direction. The 0.5 s of loading time was selected because it approximately corresponds to 15 km/hr (Kim 1994), which simulates a slowly moving aircraft on the taxi- way (which is a more critical condition for rutting). The 1.5 s of rest period was selected to give the speci- men enough time to recover more than 95% of recov- erable deformation.
Static confining pressures instead of dynamic con- fining pressures were used in the tests due to the con- straint of the triaxial testing machine. The static confining pressures included 10, 20, and 40 kPa and the resulting stress states are summarized in Table 11. The reader is reminded that shear stress q is identical to the deviator stress in the triaxial loading condition. The p and q values in Table 11 reduced (p) and increased (q) from those that would have been experi- enced in a test in which the confining stress was cycled about its mean value. Such modified values may be more representative for comparison with other studies (Wijeratne and Sargious 1987).
CHARACTERIZATION O F FATIGUE PERFORMANCE
Viscoelastic Material Properties
Creep compliance, relaxation modulus, and dynamic modulus are essential material properties in viscoelas- tic analysis. These viscoelastic material properties can be measured directly from laboratory tests, or can be obtained from the creep compliance through applica- tion of theory of linear viscoelasticity. In this study, only creep tests were conducted and the relaxation and dynamic moduli values of each specimen were
predicted from the creep data based on the procedure proposed by Kim et al. (1997).
Figures 3(a) and 3(b) show the typical behaviors of dynamic moduli for surface and base materials, respectively. As shown in Figure 3(a), GIL has the highest and SMA has the lowest modulus values at low frequencies (equivalent to a slow loading rate or high temperature). In the high frequency range (equivalent to a fast loading rate or low temperature), GIL has the highest modulus values while SBR has the lowest modulus values. For the base course mate- rials, CHE has higher dynamic modulus values than B25 as shown in Figure 3(b).
Structural Analysis of the Pavement Sections
To accurately and fairly evaluate the fatigue perform- ances of different mixtures, it is essential to perform a structural analysis of the asphalt pavements to be con- structed in the field because each mixture has a differ- ent stiffness value that results in a different structural response. There are three different pavement sections (shown in Figure 4) considered in the structural anal- ysis. As can be seen in Figure 4(a), Section 1 is the same as Section 2 except CHE was used in the asphalt concrete base layer in Section 2 instead of conven- tional asphalt concrete (i.e., B25). These two pave- ment sections were used to evaluate the fatigue performance of the 825 and CHE mixtures. Figure 4(b) shows Section 3 that was built in the test track to evaluate the performance of the five different surface course materials.
Structural analysis was perfomled using the load- ing configuration for a special vehicle developed to apply the design loading to the test pavements in this project. The loading configuration consists of dual wheels that each carry a load of 206 kN with a tire
Dow
nloa
ded
by [
Lin
kopi
ngs
univ
ersi
tets
bibl
iote
k] a
t 02:
04 1
3 M
arch
201
3

HYUN-JONG LEE er a/.
* Z (a) Section 1 and 2
pressure of 1379 kPa (200 psi). The distance between treated base layers and subgrade were assumed as the centers of these two wheels is 112 cm. shown in Figure 4. The values of elastic modulus for
For the structural analysis, the multi-layered elastic the five surface course materials and two base course program ELSYM5 was used. Typical values of elastic materials were determined from the dynamic modulus modulus and Poisson's ratio for aggregate and cement curves in Figure 3 at a frequency of 5 Hz.
Dow
nloa
ded
by [
Lin
kopi
ngs
univ
ersi
tets
bibl
iote
k] a
t 02:
04 1
3 M
arch
201
3

EVALUATION OF MODIFIED ASPHALTS 161
TABLE Ill Results of Fatigue Characterization (f = 5Hz)
Mixlure 5-19 GIL SBR SMA SBS BZ5 CHE
a, 2.92 3.27 3.08 2.72 3.50 3.08 3.22 IE*~, MPa 1,435 1,665 1,361 1.420 1,369 1.418 1.795
Coeff. CII 0.00196 0.00497 0.0152 0.00445 0.00370 0.00384 0.00118 in Eq (6) C ~ 2 0.53 0.43 0.55 0.47 0.46 0.47 0.53
PI 2.372 2.864 2.386 2.442 2.890 2.61 1 2.513
st, 33,000 53,000 34,000 22,800 45.000 16.270 18.200
Tensile Strain (x 1 0 3 3.90 3.61 4.042 3.952 4.03 5.509 4.992 Fatigue Pred. NR w1oRP 2.22 X lo6 1.92 x lo7 3.26 x lo6 5.53 X lo5 2.22 x lo7 67.860 201.920
Rank 4 2 3 5 1 2 I
For fatigue performance characterization, the maxi- mum tensile strains developed at the bottoms of the conventional AC base layer (i.e., 35 cm below sur- face) and CHE layer under the dual wheel loads were analyzed by using ELSYM5 and are provided in Table 111. The tensile strains at the bottom of the five surface course materials (i.e., 5 cm below surface) are also provided in this table.
Characterization of Fatigue Prediction Models
Controlled-strain uniaxial cyclic tests under four dif- ferent strain amplitudes were performed to evaluate the fatigue performance of the five surface course and two base course materials. Using the experimental data obtained from the cyclic tests, fatigue lives (Nf) were calculated. It is important to note that the fatigue life is defined as the number of cycles at which pseudo stiffness reaches 50% of the initial value. The choice of pseudo stiffness instead of stiffness is based on the fact that the stiffness reduction during fatigue cycles is due to both damage growth and viscoelastic- ity (i.e., the time dependence of the relaxation modu- lus). Working with the pseudo stiffness removes the relaxation effect in fatigue cycles from the overall reduction of stiffness, and therefore yields a failure criterion more directly related to cracking.
The average Nf values at different strain levels for the surface course and base course mixtures are plot- ted in Figures 5(a) and 5(b), respectively. Of the five surface course mixtures, it appears that SBS has the best and SMA has the worst fatigue performance. It is
more difficult to compare the base course mixtures, but it appears that at higher strain amplitudes, CHE has better fatigue performance than 825.
From regression analysis of this data, the phenome- nological model coefficients in Equation (I) were determined for each mixture and are presented in Table IV. The model coefficient " b describes the slope of the log-log relationship between strain ampli- tude and Nf. A greater value of " b indicates that the fatigue performance of the mixture is more sensitive to strain amplitude. This means that a mixture such as SBR (b=-4.84) will perform better than S19 (b = -6.054) at high strain amplitudes but will approach and eventually fall below the performance of S19 as the strain amplitude becomes smaller. Care- ful examination of Figure 5(a) shows this occurring. Of course the coefficient "a" is needed for a complete description of the fatigue performance.
Another fatigue model employed in this study is the one proposed by Lee et al. (1999) as shown in Equation (8). The coefficients in the fatigue predic- tion model without rest periods in Equation (6) are presented in Table 111. In the calculation of the model coefficients for each mixture, two sets of test data with different amplitudes were used to reduce the sample-to-sample variability in the analysis. The pro- cedure for calculating these model coefficients is as follows:
1) Determine an average value of I E * ~ for a mix- ture at the frequency of 5 Hz (Figure 3). 2) Determine an average value of "n" from the creep compliance data.
Dow
nloa
ded
by [
Lin
kopi
ngs
univ
ersi
tets
bibl
iote
k] a
t 02:
04 1
3 M
arch
201
3

HYUN-JONC LEE eta/ .
FIGURE 5 Fatigue Lives a [ Various Strain Amplitudes: (a) Surface Mixes; (b) Base Mixes (Data Points from the Regression Analysis)
3) Calculate the values of pseudo stiffness and S I 4) Calculate a, and p l . at cach cycle collected during the test. Plot pseudo 5) Back calculate an average value of S l f from stilTness versus S I using all available data and Equation (6) using measured Nf values and the obtain the regression coefficients of the function coefficients obtained from steps 1)-4). C I (i.c., C I I and C12).
Dow
nloa
ded
by [
Lin
kopi
ngs
univ
ersi
tets
bibl
iote
k] a
t 02:
04 1
3 M
arch
201
3

EVALUATION OF MODIFIED ASPHALTS
TABLE IV Comparison of Fatigue Model Coefficients
Mixrure S19 GIL SBR SMA SBS 825 CHE
Eq ( I ) "a" 5.5 x 1 0 - l ~ 3.8 x lo-'' 5.3 x lo-" 9 . 6 ~ 6.8 x l0-I7 1.7 x 3.7 x
Eq (6) "A" 2.7 x 10-'"5. x 3.3 x 10-'".7x 3.8 x 4.1 x 1 0 - l ~ 8 . 9 ~ l0d7
Eq (1) "b" -6.05 -5.33 4 . 8 4 -5.21 -6.93 -5.70 -5.01 Ea (6) "-Za," -5.84 -6.54 4 . 1 6 -5.44 -7.0 -6.16 -6.44
Using Equation (6) with the coefficients and tensile strain values shown in Table 111, the values of Nf without rest periods are predicted and compared with the measured values in Figure 6. The data shown in this figure include the fatigue test data not used in the determination of the model coefficients. In general, a good agreement is found between the measured and the predicted fatigue lives, which demonstrates the validity of the fatigue prediction model in Equation (6). A similar verification result was observed in pre- vious works (Lee et al. 1999) for two conventional asphalt mixtures. The verification result shown in Figure 6 implies that the fatigue model in Equation (6) can be applied to both conventional and modified asphalt mixtures.
Examining the predicted fatigue lives of the mix- tures shown in Table 111, SBS has the best and SMA the worst performance of the surface course mixtures and the CHE base course performs better than the 825 mixture. Examination of the base courses at a lower strain amplitude (0.0003) will show that the performance of B25 is better. It is noted from this table that the fatigue lives of the base course materials are much shorter than the fatigue lives of the surface materials. This implies that, for fatigue cracks origi- nating at the bottom of the asphalt layer, the fatigue performance of the whole pavements is dominated by the fatigue life of base course material. That is, once the fatigue cracks begin to propagate from the bottom of the base layer, fatigue cracks may be observed on the surface of the pavement long before the fatigue life of the surface material is reached.
The weakening of the base course due to fatigue damage increases the tensile strain in the surface course, accelerating damage accumulation and has- tening failure. However, for the fatigue cracks starting from the surface of the asphalt layer, the fatigue
1.€+02 1.€+03 I.E+04 I.E+05 1.€+06
Measured N,
FIGURE 6 Validation Results of Fatigue Prediction Model in Equa- tion (6)
resistance of the surface mixtures is still important. In this case, cracks may be developed due to a combina- tion of complex fracture modes (e.g., crack opening mode, shearing mode, and tearing mode etc.). The uniaxial tension fatigue test may not be sufficient to consider all these mechanisms.
A comparison of the strain amplitude exponents in the phenomenological ("b" in Equation I ) and contin- uum damage (-2aI in Equation 6) models shows that the values are similar. However, one needs to be care- ful in comparing "a" from the phenomenological model with "A" in Equation (6). The coefficients that determine the value of "A" are all linear viscoelastic parameters, and are iherefore strain independent. I t must also be remembered that the phenomenological coefficients are determined from a direct regression of the strain amplitude versus Nf relationship. The con- tinuum damage coefficients a l , I E * ~ , and pl are deter- mined from an independent creep test while C I I , CI2, and S l f are determined from the cyclic loading test.
Dow
nloa
ded
by [
Lin
kopi
ngs
univ
ersi
tets
bibl
iote
k] a
t 02:
04 1
3 M
arch
201
3

164 HYUN-JONG LEE el a/.
Thc two models take completely different approaches lo modeling the fatigue behavior, but result in similar values for the coefficients, as shown in Table IV. For the GIL, SBR, and CHE mixtures, the difference bctwccn "a" and " A seems fairly large compared to the other mixtures. However, these mixtures also show a grcatcr differcnce between " b and -2al , and i t is thc two coefficients together that describe the fatigue behavior of the mixture.
Combining the above observations with the discus- sion at the beginning of this section, one may begin to scc how the material characteristics, properties, test conditions, and failure criterion affect the fatigue per- formance. Thc similarity between "b" and "-2al" suggests that the slope of the creep compliance curve (from which a l i s calculated) determines how sensi- tive thc Ihtiguc performance is to the applied strain ;uiiplitudc. For instance, a lower value of "n" results in a lowcr value of "-2aI" and a mixture less sensitive to the strain level. This makes sense in respect to the crccp compliancc; that is, a flatter slope in a creep curve indicates that the material is more elastic and hcnce onc would expect the response to be less sensi- tive lo strain level.
It is dimcult to examine the individual effects of thc parameters in Equation (6) on the fatigue life because they arc interdependent, meaning that ch;uiges in one parameter are associated with changes in another paramcter. As an example, consider a mix- ture that is subject to aging. As the mixture ages, the viscoclastic propcrties change, affecting the damage evolution characteristics and ultimately, the S value. Thus, accurate prediction of the fatigue life of this asphi~lt mixture would require not only loading condi- tions (c.g., tensile strain in the phenomenological model) and linear viscoelastic material properties (c.g., the slope of creep compliance versus time rela- tionship in a logarithmic scale in more recent fatigue modcls), but also the determination of damage and microdamage healing characteristics.
I t may not be possible to select a single parameter that governs the fatigue lives of asphalt mixtures bccnusc of the above reasons. However, it is still desirable to select one or two governing material propcrtics to allow identification of better fatigue
resistant mixtures for design purposes. Thus, a careful investigation of the fatigue model in Equation (6) was performed. As can be seen in Equation (6), a higher value of S l r and a lower value of I E * ~ extend the fatigue life. Equation (4) shows that S l f is propor- tional to the value of (Ez)2a1/(1+al). For the strain-controlled continuous cyclic loading, & is equal to eOIE(t)+ 1~*1]/2 (Lee et al. 1999) and thus, a higher value of IE*~ is required to have a higher value of Sl f . This complicated interdependency implies that it may not be possible to identify a better fatigue resistant mixture only using I E * ~ . It is clearly seen in Table IV that a significant relationship does not exist between the IE*~ values and the fatigue performance ranking.
Another important parameter affecting the fatigue life is a l . The a t value affects Sl f . ~ g , I E * ~ , CI1 , and CI2. If the al value increases, S l f and ~ 0 ~ " ~ increase (increase in Nf), but (CIIC12)-a1 and I E * I - ~ ~ ~ decrease (decrease in Nf). It is seen from this observa- tion that identifying the effects of at on the Nf is very difficult without utilizing actual experiment data. It can be seen in Table 111 that at is very well correlated with the fatigue performance ranking. That is, the higher the al value (i.e., the lower the slope of creep compliance curve, n), the longer the fatigue life for surface and base mixtures, respectively.
It is noted in Table 111 that the SBR and 825, and GIL and CHE have similar at values, but the fatigue lives of the surface versus base courses are signifi- cantly different. This is partially due to the fact that the levels of tensile strains between surface and base courses are quite different resulting in different fatigue lives. Therefore, it is unfair to compare fatigue lives of surface mixtures with those of base mixtures directly. However, if the base courses are evaluated at a strain level closer to those found in the surface courses (~=0.0004), the fatigue lives of B25 (3.5 x lo6) and CHE (6.8 x lo6) are similar to those of SBR (3.26 x lo6) and GIL (1.92 x lo7), respectively.
The value of S l f also correlates well with the fatigue ranking because an increase in the al results in an increase in the Slf . The rank reversal of SBS and GIL mixtures is not unexpected due to the difference in I E * ~ values and recalling that both IE*~ and at affect
Dow
nloa
ded
by [
Lin
kopi
ngs
univ
ersi
tets
bibl
iote
k] a
t 02:
04 1
3 M
arch
201
3

EVALUATION OF MODIFIED ASPHALTS 165
the value of Slf . Other parameters in Table 111, pl , C I I , and C12 do not correlate well with the fatigue performance ranking.
Several parameters ( a I and Slf) appear to govern the fatigue behavior of these mixtures. However, it is not advisable to only consider these parameters when evaluating the fatigue behavior because even though they are highly influential, all of the parameters play a role in the fatigue performance. It is conceivable that a situation could occur where an unfavorable combi- nation of other parameters could prevail over a rank- ing determined by just looking at one or two parameters. It must also be noted that these findings are a result of testing seven mixtures that have vary- ing binder content and gradation, which will influence the fatigue performance as well.
Effect of Rest Periods on Fatigue Life
To evaluate the effect of rest periods on fatigue life, controlled-strain cyclic loading tests with multiple rest periods were conducted at three different strain amplitudes for five surface course mixtures. In order to compare the healing potentials of the mixtures, the increase in pseudo stiffness (i.e., CZ) during multiple rest periods was calculated for the five surface course mixtures and is presented in Figure 7. The figure shows that the model is able to distinguish between the healing performance of the different mixtures.
0 200 400 600 800 1000 1200 1400
Rest Periods (sec)
FIGURE 7 Increase in Pseudo Stiffness C2 During Rest Periods
The values of C2 in Figure 7 increase as the dura- tion of rest increases. That is, the longer the rest period, the more the recovery of the damage. I t is observed from this figure that the SBS shows the highest increase in pseudo stiffness during rest peri- ods among five mixtures while the unmodified mix- ture S19 shows the lowest increase in pseudo stiffness. All four modified mixtures (GIL, SBR, SMA, and SBS) showed a better potential for healing than the S 19 mixture.
The GIL mixture shows a large gain in C2 in the short term (quick healing), but levels out and longer rest periods have little beneficial effect. The SBS mixture, on the other hand, has a slower initial rate of healing, but continues to gain strength with time, indi- cating a better healing potential over time.
The amount of binder in the mixture will also affect the healing performance. Although the effect of binder content was not examined in this project, the relatively high binder content in the SMA mixture is probably the main reason for the good healing per- formance that was observed.
CHARACTERIZATION O F RUTTING PERFORMANCE
Test Results and Discussions
The rutting performance of a mixture can be affected by several factors such as aggregate gradation, angu- larity and texture of aggregate, asphalt content, and asphalt stiffness, etc. Of the mixtures tested during this study, S 19, SBR, and GIL used the same grada- tion while SBS and SMA each used a different grada- tion. One type of asphalt binder was used in the mixtures but the stiffness of binder in each mixture was likely different due to the presence of modifier, and each mixture had its own binder content. For these reasons, it was not possible to evaluate the effect of modifiers on rutting performance in this study. However, it was possible to rank the mixtures in regards to their rutting performance, which was done by examining the vertical permanent deforma-
Dow
nloa
ded
by [
Lin
kopi
ngs
univ
ersi
tets
bibl
iote
k] a
t 02:
04 1
3 M
arch
201
3

HYUN-JONG LEE era/.
No. of Cycles
0 5000 10000 15000 20000 25000 30000
No. of Cycles
0 5000 10000 15000 ZOO00 25000 30000
No. of Cycles
FIGURE 8 Increase in Permanent Strain at the Confining Pressures of: (a) 40 kPa; (b) 20 kPa; (c) 10 kPa
Dow
nloa
ded
by [
Lin
kopi
ngs
univ
ersi
tets
bibl
iote
k] a
t 02:
04 1
3 M
arch
201
3

EVALUATION OF MODIFIED ASPHALTS 167
tion. The reader is reminded that the objective of this testing was a comparative analysis and therefore the reported values are not those that would be observed in the field under actual conditions.
Using the data obtained from triaxial tests, all the values of vertical permanent strain were calculated and are presented in Figures 8(a), 8(b), and 8(c) for 40, 20, and 10 kPa of confining pressures, respec- tively. It is clearly shown in these figures that the rut- ting performance of the modified mixtures including SBR, GIL, SMA, and SBS were better than the con- ventional S19 mixture. The SBS mixture shows the best rutting performance at confining pressures of 10 and 20 kPa while the SMA mixture shows the best performance at a confining pressure of 40 kPa. It is seen from these figures that more permanent strain occurs at lower confining pressures when the axial stress is constant. Also, it may be observed that the performance of SBS is less sensitive to confining pressure than SMA.
There are several reasons whis the SBS may have showed good rutting performance. First could be the difference in grading; the SBS binder is graded (PG 76-22) and the ordinary binder (PG 64-1 6) is accord- ing to the Superpave binder specification. The differ- ence in the PG grades clearly indicates that the SBS mixture will perform better at high temperatures and will be more resistant to rutting.
The second reason for the good performance of SBS could be the aggregate gradation. The aggregate gradation for the SBS mixture follows the recommen- dation in the Superpave mix design method (Asphalt Institute 1995) and passes below the restricted zone as shown in Figure 9(a). The S19 gradation passes above and through a portion of the Superpave restricted zone (Figure 9(b)). This could be another reason that the rutting performance of S 19 mixture was the poor- est, and the SBS among the best of the five surface course mixtures tested.
Characterization of Permanent Deformation Model
The nature of Equation (9) requires that k l and k2be determined for each test. Therefore, the values of the
IE l 0.45 Power d C / / I
!stticled Zone
0 1 2 3 4 5
Sieve Size Raised to 0.45 Power
(b) " " " "
0 1 2 3 4 5
Sieve Size Raised to 0.45 Power
FIGURE 9 Cornpaison of Target Aggregate Gradations with Superpave Specification: (a) SBS Mixture; (b) S19 Mixture
coefficients vary with the applied stress level for a particular mixture. The permanent deformation model coefficients k l and k2 in Equation (9) were first deter- mined from a regression analysis of the triaxial test data shown in Figure 8. A relationship between the applied stress condition and the regression coeffi- cients k l and k2 was then developed.
First, k, and k2 were separately regressed with respect to the p and q values of each stress condition. In general, the q values were better correlated with the coeff~cients kl and k2. The regression analysis con- ducted with respect to q resulted in an equation of the form:
Dow
nloa
ded
by [
Lin
kopi
ngs
univ
ersi
tets
bibl
iote
k] a
t 02:
04 1
3 M
arch
201
3

Dow
nloa
ded
by [
Lin
kopi
ngs
univ
ersi
tets
bibl
iote
k] a
t 02:
04 1
3 M
arch
201
3

EVALUATION OF MODIFIED ASPHALTS 169
five surface course mixtures. The four modified mix- tures display better healing potentials than the unmodified S19 mixture, with SBS showing the greatest increase in pseudo stiffness during rest peri- ods.
Regarding the rutting performance of the mixtures, it was found that a linear relationship exists between the vertical permanent deformation and number of applied loads in a logarithmic scale and the vertical permanent deformation increases with an increase in q (shear stress invariant). The four modified mixtures performed better than the conventional S19 mixture, with the SBS mixture performing the best at the two lower confining pressures and the SMA mixture per- forming the best at high confining pressure. However, the differences in gradation and binder content among the different mixtures must be considered as they also affect rutting potential of a mixture.
Based on the comparison study of the performance of five surface mixtures, overall, the SBS mixture showed the best performance with regard to fatigue, healing, and rutting. It is also worth noting that all of the modified mixtures performed better than the sin- gle conventional mixture. Only the fatigue perform- ance of the base course mixtures was investigated, and the CHE mixture displayed a greater fatigue resistance than the B25 mixture.
Acknowledgemenrs
This study is sponsored by Korea Research Founda- tion in the program year of 1998 and Korean Airport Construction Authority. The authors are grateful for their support.
References Asphalt Institute (1995) Superpave Level I Mix Design. Superpave
Series No. 2. Lexington. KY. Barksdale, R.D. (1972) Laboratory Evaluation of Rutting in Base
Course Materials. Proceedings. Third International Confer-
ence on the Structural Design of Asphalt Pavements. Vol. I . London.
Brown, S.F. (1975) Improved Framework for Predicting Permanent Deformation in Asphalt Layers. Transportation R e s e o ~ h Record 537.
Brown, S.F. and Bell, C.A. (1977) The Prediction of Permanent Deformation in Asphalt Pavement. Proceedings r,jthe Forth lnternational Conference on the Struct~rral Design ofA.rpImlt Pavements. Vol. I, Ann Arbor. Michigan.
Celard, B. (1977) ESSO Road Design Technology, Pmceedings of the Forth International Conference on the Struct~rral Design ofAsphalt Pavements. Vol. I, Ann Arbor. Michigan.
Dijk, w. van and Visser. W. (1977) The Energy Approach to Fatigue for Pavement Design. Proceedingr of the Asrociation of Aspholr Paving Technologisrs, Vol. 46. 1.
Kim, N.S. (1994) Development of Performance Prediction Models for Asphalt Concrete Layers. Ph.D. Dissenation. Dept. o r Civil Eng., Noah Carolina Stale University. Raleigh. NC.
Kim, Y.R., Lee, H.J. and Little, D.N. (1997) Fatigue Characteriza- tion of Asphalt Concrete Using Viscoelasticity and Continuum Damage Theory. Journal of rlrc Associalion of Asphalt Paving Technologists, Vol. 66. pp. 520-569.
Lee, H.J. and Kim. Y.R. (19983) A Uniaxial Vircoelastic Constitu- tive Model for Asphalt Concrete under Cyclic Loading. Jr: of Eng. Mech., ASCE. Vol. 124. No. I . 1998.
Lee, H.J. and Kim. Y.R. (1998b) A Viscoelastic Continuum Darn- age Model of Asphalt Concrete with Healing. Jr: of Engineer- ing Mechanics. ASCE. Vol. 124. No. I I . November 1998, pp. 1-9.
Lee. H.J., Kim. Y.R.. and Daniel. J.S. (1999) A Viscoelastic Con- tinuum Damage Mechanics-Based Fatigue Prediction Model of Asphalt Concrete. Ir: of Materials in Cit'il Engineering. ASCE. (Accepted).
Park. S.W., Kim, Y.R., and Schapery, R.A. (1996) A Viscoelastic Continuum Damage Model and Its Application to Uniaxial Behavior of Asphalt Concrete. Mechanics of Materials, 24, p 241-255.
Romain. J.E. (1972) Rut Depth Prediction in Asphalt Pavements, Proceedings. Third lnteniational Conference on die Struct~rral Design of Asphalt Pavements. Vol. I, London.
Schapery, R.A. (1984) Correspondence Principles and a General- ized J-integral for Large Deformation and Fracture Analysis of Viscoelastic Media. Int. J. Fracr.. 25, pp. 195-223.
Schapery, R.A. (1990) A Theory of Mechanical Behavior of Elastic Media with Growing Damage and Other Changes in Structure. JI: Mech. Phps. Solids, 38, pp. 215-253.
Sousa. J.B., Craus. J. and Monismith. C.L. (1990) Summary Repon on Permanent Deformation in Asphalt Concrete. lnstitute of Transponation Studies, University of California at Berkeley.
Wijeratne. A. and Sargious. M. (1987) Prediction of Rutting in Vir- gin and Recycled Asphalt Mixtures for Pavements Using Tri- axial Tests. Proceedings of the Association of Asphalt Paving Technologisrs. Vol. 56.
Dow
nloa
ded
by [
Lin
kopi
ngs
univ
ersi
tets
bibl
iote
k] a
t 02:
04 1
3 M
arch
201
3
Recommended