KNOWLEDGE-BASED EXPERT SYSTEM FOR
AGRICULTURAL LAND USE PLANNING
Thirumurugan Ponnusamy
Thesis submitted for the degree of Master of Arts (Research)
Department of Geography and Environmental Studies
University of Adelaide
February 2007

2
PREFACE
The knowledge-based expert system outlined in this thesis might seem redundant for a
developed country like Australia. However, such a system is an essential requirement for
developing countries. This expert system was conceived with the needs of Indian farmers in
mind, who often do not have access to expert knowledge and advice in agriculture. The expert
system is intended to give customized expert advice, anytime and anywhere. Due to the non-
availability of geographic data from India, restricted time and financial resources, a study area
in South Australia was chosen for conducting the research. The system uses knowledge-bases
pertaining to South Australian agriculture, land use practices and crops. The expert system
should ideally work for any geographic datasets with necessary changes applied to the
knowledge-bases. The Department of Water, Land and Biodiversity Conservation (DWLBC),
South Australia has supplied the essential data used for the development of this expert system,
which is also beneficial to DWLBC, as the current thesis explores a knowledge-based approach
and builds on the existing land evaluation computer program used by the DWLBC in evaluating
land and suggesting suitable crops.

3
ABSTRACT
The research constitutes a knowledge-based approach to land evaluation for selecting
suitable agricultural crops for a land unit. This thesis presents the design, and development
of a prototype Knowledge-based Spatial Decision Support System (KBSDSS) -“Crop Advisor”-
for evaluating land resources and choosing suitable agricultural crops for a farm unit. The
prototype “Crop Advisor” expert system (ES) utilises multiple knowledge rules to determine
suitable, optimal crops for a farm unit considering the farm unit’s resources. It considers the
land evaluation process as a group-decision making process involving many experts from
diverse scientific domains. The expert system is powered primarily by human knowledge
collected from a land evaluator or a crop expert. The knowledge base consists of
representative rules to reflect physical, economic, environmental and social factors that affect
the choice of land use. The expert system makes use of Geographic Information System (GIS)
tools to manage spatial information that are required for the evaluation process. These
powerful tools (ES and GIS) help in choosing a crop, from a group of crop choices that gives
more economic benefits without compromising environmental values. The expert system model
is tested on the soil and physiographic data provided by Department of Water, Land and
Biodiversity Conservation, South Australia (DWLBC) and Primary Industries and Resources,
South Australia (PIRSA). This knowledge-based approach to land evaluation is built on the land
evaluation framework designed by the United Nations Food and Agriculture Organisation
(FAO). The DWLBC model of land evaluation suggests a strategic land use plan at regional
level considering soil, climate and physiography which eliminates non-feasible land use or crop
choices. The “Crop Advisor” expert system takes such regional data and suggests, in
consultation with the farmer, a group of suitable crop choices that are best in terms of physical,
economic, social and political factors associated with a farm unit.

4
DECLARATION
This thesis contains no material which has been accepted for the award of any other degree or diploma
in any university or other tertiary institution and that, to the best of my knowledge and belief, contains no
material previously published or written by another person, except where due reference has been made
in the text of the thesis.
I give consent to this copy of my thesis, when deposited in the University Library, being available for
loan and photocopying.
Full Name: THIRUMURUGAN PONNUSAMY
Signed:
Date: 14th, December 2007

5
ACKNOWLEDGEMENTS
I would like to extend my gratitude to my Principal Supervisor Dr Kevin Harris for his constant
guidance and supervision. He mentored me through the whole process of my research giving
his valuable suggestions and advice. I would like to extend my deep appreciation to my Co-
Supervisor Mr Neil Coffee for his frequent feedbacks, especially in terms of the GIS
components of the research and for his constant encouragement for completing my research. I
sincerely thank Dr David Maschmedt, Soil Scientist at DWLBC for his interest in this research;
he offered me his expert knowledge and guidance in developing the expert system. Much of my
success goes to you, David. Also, I sincerely appreciate the helpfulness of Mr David Tonkin,
GIS Manager at DWLBC for providing me the data and expert guidance during the
development of the “Crop Advisor” expert system. I am very thankful to Rajesh Thiagarajan
from University of South Australia and Karthick Elangovan from University of Adelaide who had
extended their programming skills to quickly wrote the „program code‟ for the “Crop Advisor”
expert system. Without their help, my „Crop Advisor‟ program would have remained only a
„theoretical idea‟ as I had no programming skills in Visual Basic.
The research presented here is supported by International Postgraduate Research
Scholarship (IPRS) and University of Adelaide (UAS) scholarships. I would like to express
my sincere thanks to the Australian Government and the University of Adelaide for supporting
me in these two years. It has truly expanded my realm of knowledge and experience.
My friends are my constant sources of inspiration and support. My sincere thanks to Jacinta
Poskey and Matthew Miles; both inspired me and provided me a second home in Australia. My
sincere thanks to my fellow researchers Vigya Sharma, Tony Lockwood and to my friends
Hariharan G, Senthilkumar PK, Anand T, Prakash, Lakshmi, Hari, Abrar, Girish and my
roommates for their support and encouragement. My heart-felt thanks go to my father
Ponnusamy, mother Alamelu, sister Jayalakshmi and brother Sivakumar for showering me with
their self-less love and blessings. I dedicate this research thesis to my mother who means
the world to me. I am also thankful to Mrs Anandhi Shankar who encouraged me to take up
this research programme in Australia. My sincere thanks to dear friend, Mrs. Rashmi Mohan,
for her moral support. I would like to extend my thanks to Arun Prasad Raja and Mrs Ashwini
Arun who helped me to come to Australia, without them I would have never come to Australia.

6
Finally, I would like to express my gratitude to my Postgraduate Co-ordinator Dr Dianne Rudd
and the Department of Geographical and Environmental Studies (GES), National Centre for
Social Applications of Geographic Information Systems (GISCA) for providing me with essential
resources. My sincere acknowledgments to the University staff particularly Ms. Sarah Hoggard,
Mr David Coombe, Ms. Maria Fugaro and Dr Kate Cadman for their advice and help during
various stages of the research project.
Thirumurugan Ponnusamy

7
TABLE OF CONTENTS
PREFACE .................................................................................................................................. 2
ABSTRACT ................................................................................................................................ 3
DECLARATION .......................................................................................................................... 4
ACKNOWLEDGEMENTS .......................................................................................................... 5
TABLE OF CONTENTS ............................................................................................................. 7
LIST OF FIGURES ....................................................................................................................11
LIST OF TABLES ......................................................................................................................12
DEFINITION OF TERMS ..........................................................................................................13
CHAPTER 1 ..............................................................................................................................15
INTRODUCTION .......................................................................................................................15
1.1. Background to the research .....................................................................................15
1.2. Purposes and significance of the study ..................................................................16
1.3. Research methodology ............................................................................................19
1.3.1. Developing an appropriate model for agricultural land use decision making ...19
1.3.2. Developing the expert system .........................................................................19
1.3.3. Testing the expert system ...............................................................................19
1.4. Limitations of the current study ................................................................................19
1.5. Theoretical contributions ..........................................................................................20
1.6. Practical contributions ..............................................................................................20
1.7. Organisation of thesis chapters ...............................................................................21
1.8. Summary .................................................................................................................22
CHAPTER 2 ..............................................................................................................................23
AGRICULTURAL LAND USE PLANNING ................................................................................23
2.1 Introduction ..............................................................................................................23
2.2 Land and its importance ..........................................................................................23
2.3 Land evaluation and land use planning ...................................................................24
2.4 Strategic land use planning......................................................................................26
2.5 Farm level land use planning ...................................................................................26
2.6 Needs of farmers .....................................................................................................29
2.7 Summary .................................................................................................................29
CHAPTER 3 ..............................................................................................................................31
COMPUTERS IN AGRICULTURAL LAND USE PLANNING ....................................................31
3.1 Introduction ..............................................................................................................31

8
3.2 Computers in decision support ................................................................................31
3.3 Computers in land use planning ..............................................................................32
3.4 Disadvantages of traditional approaches .................................................................33
3.5 Expert systems ........................................................................................................34
3.6 Components of an expert system ............................................................................36
3.6.1 Knowledge base ..................................................................................................36
3.6.2 Inference engine ..................................................................................................37
3.6.3 User interface ......................................................................................................37
3.7 Importance of GIS ....................................................................................................38
3.8 Expert systems and GIS in agricultural land use planning .......................................39
3.9 Summary .................................................................................................................41
CHAPTER 4 ..............................................................................................................................42
FRAMEWORK FOR KNOWLEDGE-BASED SPATIAL DECISION SUPPORT SYSTEMS ......42
4.1 Introduction ..............................................................................................................42
4.2 Data, information and knowledge ............................................................................42
4.3 Knowledge in agriculture .........................................................................................44
4.4 Framework for knowledge acquisition ......................................................................44
4.5 Framework for knowledge-based spatial decision support system ..........................45
4.6 Frameworks for land evaluation ..............................................................................46
4.7 Current research framework ....................................................................................48
4.8 Summary .................................................................................................................50
CHAPTER 5 ..............................................................................................................................51
LAND EVALUATION AND CROP SUITABILITY ANALYSIS ....................................................51
5.1 Introduction ..............................................................................................................51
5.2 Different approaches to land evaluation ..................................................................51
5.3 Knowledge based approach to land evaluation .......................................................54
5.4 Crop suitability analysis ...........................................................................................55
5.5 Procedure for crop suitability analysis .....................................................................57
5.6 Summary .................................................................................................................58
CHAPTER 6 ..............................................................................................................................59
METHODOLOGY ......................................................................................................................59
6.1 Introduction ..............................................................................................................59
6.2 Physical land evaluation by DWLBC ........................................................................59
6.3 Suitability analysis ...................................................................................................63

9
6.4 Study area ...............................................................................................................64
6.5 Summary .................................................................................................................66
CHAPTER 7 ..............................................................................................................................67
DESIGN AND SPECIFICATIONS .............................................................................................67
7.1 Introduction ..............................................................................................................67
7.2 Targeted users and data sources ............................................................................67
7.3 Knowledge engineering for “Crop Advisor” expert system .......................................69
7.3.1 Deriving the factors .............................................................................................72
7.4 System properties ....................................................................................................74
7.5 Development environment and software tools .........................................................74
7.6 Architecture of “Crop Advisor” expert system ..........................................................76
7.7 Summary .................................................................................................................77
CHAPTER 8 ..............................................................................................................................79
TESTING AND FEEDBACK ......................................................................................................79
8.1 Introduction ..............................................................................................................79
8.2 Functioning of “Crop Advisor” expert system ...........................................................79
8.3 Farm assessment: an illustrated example................................................................84
8.4 Testing the “Crop Advisor” expert system ................................................................88
8.5 Validating the results of “Crop Advisor” expert system ............................................90
8.6 Feedback for “Crop Advisor” expert system.............................................................92
8.7 Summary .................................................................................................................96
CHAPTER 9 ..............................................................................................................................97
DISCUSSIONS AND CONCLUSIONS ......................................................................................97
9.1 Introduction ..............................................................................................................97
9.2 Demerits of “Crop Advisor” prototype ......................................................................98
9.3 Merits of “Crop Advisor” expert system ....................................................................98
9.4 Improvements for “Crop Advisor” expert system ......................................................99
9.5 Implementation of “Crop Advisor” expert system ..................................................101
9.6 Contributions of the research .................................................................................103
9.7 Future research directions .....................................................................................104
9.8 Conclusion .............................................................................................................105
9.9 Summary ...............................................................................................................105
References ..............................................................................................................................106

10
APPENDICES
Appendix I: Factors used in Physical Land Evaluation ............................................................114
Appendix II: Factors used in Land Suitability Analysis ............................................................115
Appendix III: List of Crop Choices ...........................................................................................120
Appendix IV: Criteria for assessing land suitability for Canola crop as developed by DWLBC 121
Appendix V: Source code of the Crop Advisor Expert System ................................................123
Appendix VI: Screenshots of the Crop Advisor Expert System version 1.0 .............................136

11
LIST OF FIGURES
Figure 1.1 Traditional land use planning and a knowledge-based expert system .....................18
Figure 2.1 Land Evaluation as an economic activity, adapted from FAO framework ................25
Figure 3.1 Evolution of Computer Systems in Decision Support ...............................................31
Figure 3.2 Components of a typical Expert System ..................................................................35
Figure 4.1. Knowledge Pyramid ................................................................................................43
Figure 4.2 Figure showing various users associated with expert systems ................................45
Figure 4.3. Simplified sequence for making decisions about the best use for land ...................49
Figure 5.1 Different approaches to land evaluation including
that taken by the current research ...........................................................................54
Figure 5.2 Stages involved in land evaluation and crop suitability ............................................57
Figure 6.1 Suitable land units for growing Olives ......................................................................61
Figure 6.2 Suitable land units for growing Ryegrass .................................................................62
Figure 6.3 Map showing the study area of Blyth and Clare .......................................................65
Figure 7.1 Architecture of Crop Advisor Expert System ............................................................77
Figure 8.1 Main screen of Crop Advisor expert system .............................................................80
Figure 8.2 Executing Crop Advisor expert system to get suitable crops ...................................82
Figure 8.3 Crop Advisor Developer team ..................................................................................83
Figure 9.1 Control panel for Crop Advisor expert system ........................................................100
Figure 9.2 Determinants of successful implementation ...........................................................101

12
LIST OF TABLES
Table 5.1 Factors involved in agricultural land evaluation and crop suitability analysis.............56
Table 6.1 Five land suitability classes and their general definitions ..........................................61
Table 6.2 Database showing suitability order of crops for a farm unit .......................................63
Table 7.1 Datasets used in the research and their sources ......................................................69
Table 7.2 Table showing the knowledge base of crop requirements .........................................71
Table 8.1 Farm table showing initial crop choices after physical land evaluation by DWLBC ...84
Table 8.2 Elimination of crop choices based on rainfall ............................................................85
Table 8.3 Crop choices after labour availability factor is evaluated ...........................................87
Table 8.4 Table showing final crop choices for the farm unit with
survey number H210800 S605 ...............................................................................88
Table 8.5 Characteristics of “Crop Advisor” expert system .......................................................89
Table 8.6 Results of “Crop Advisor” system compared with 2003 land use map
provided by DWLBC ................................................................................................92
13
DEFINITION OF TERMS
The following terms and definitions are adapted in the present research thesis.
Land use:
Land use refers to the use of land for raising agricultural crops, dairy and livestock. The current
research deals with land use at farm level, a mapping scale of 1:10,000.
Agricultural land evaluation:
The procedure for surveying and assessing land resources in a farm unit to find its suitability to
grow agricultural crops is known as agricultural land evaluation.
Crop suitability assessment:
Crop suitability assessment is performed based on the results of agricultural land evaluation. It
aims to select an optimal crop that is suitable for growing in a farm unit, based on physical,
economic and socio-political factors associated with the farm unit.
Farm unit:
A farm unit refers to a parcel of land used by a farmer or land owner for agricultural purposes. It
is defined by a field boundary and usually considered as a management unit for cultivation.
Agricultural land use planning:
Agricultural land use planning refers to the combined procedure of land evaluation for
agriculture and crop suitability assessment. In this research, the term “agricultural land use
planning” refers to the farm level assessment of land resources and factors that affect the use
of land and the act of choosing the most feasible crop option for a farm unit.
Strategic land use planning:
The process of land evaluation and land use allocation performed by the government
authorities at regional scale is termed as strategic land use planning. The scale of mapping is
usually between 1:50,000 to 1:1,000,000.
Geographic Information System:
A set of tools for managing geographically referenced data and information for planning and
decision-making purposes.

14
Heuristic Knowledge
Heuristic (from the Greek word "heuriskein" meaning "to discover") knowledge pertains to the
process of gaining knowledge through experience, trial by error methods rather than by
following a formal step-by-step process (Roy 2001). For example, heuristic knowledge includes
the knowledge gained from experience, rules of thumb and trial-by-error methods.
Expert
“An expert is a person who has a comprehensive and authoritative knowledge of or skill in a
particular area” (Pearsall 1998:647). Experts have prolonged or intense experience, practice or
education in a particular field that goes significantly beyond any general or shallow
appreciation.
Knowledge Base
A collection of rules, assertions and facts about a problem domain represented in a machine-
readable format is termed as a knowledge base.
Expert Systems
An expert system is a program which attempts to emulate the knowledge and reasoning
capabilities of a human expert in order to solve a specific problem. Expert systems derive
knowledge from various sources in the form of rules and assertions.
Knowledge Acquisition
The process of acquiring knowledge from various sources and converting them into a machine-
readable form is referred as knowledge acquisition. The knowledge may come from various
sources such as human minds, books, research findings and other reliable sources.
Knowledge Engineer
Knowledge Engineer is the person responsible for acquiring knowledge and coding it into a
knowledge base in machine-readable form.
User
User is the person who uses the expert system. It is assumed that a typical user is an owner of
a farm who wants to choose an optimal crop for his/her farm unit.

15
CHAPTER 1
INTRODUCTION
1.1. Background to the research
Land evaluation is the procedure of assessing the capability of land for specific land use
purposes (FAO 1976:1; 1983:5). The process of land evaluation forms a vital part of land
management and helps in preparing a successful land use plan. The purpose of land use
planning is to utilize available resources in a land unit to maximize economic returns without
degrading environmental values. Multi-disciplinary knowledge is required for a comprehensive
evaluation of a farm unit‟s resources and to identify its true potentials and limitations. In case of
agricultural land use, the results of land evaluation can help in choosing the most suitable land
use and a profitable crop for a farm unit. Land evaluators and crop experts help farmers to
choose the most profitable crop that is best suited for a farm unit by assessing the farm unit‟s
performance by observing its land characteristics. However, not all farmers have access to
such agricultural advice and information, especially farmers living in the developing countries
(Reddy & Ankaiah 2005:1906; Zijp 1994:3). By having an agricultural expert system, the
problem of scarcity of experts, especially in Agriculture, can be overcome (Rafea 1998:35-3).
The aim of this research is to borrow the human intelligence used by a land evaluator (crop
expert) and use it to develop a knowledge-based expert system that can guide farmers to
choose a suitable crop for their land unit.
This thesis develops a knowledge-based, agricultural land use decision support model for a
farm-based crop suitability assessment. In particular, the research aims at designing and
building a prototype expert system that will assist farmers in choosing a suitable agricultural
crop that can be grown on a farm unit by analysing the physical, social and economic factors
associated with that farm unit. In this process, it aims to use various dynamic knowledge-rules
which contain scientific and heuristic1 information. This introductory chapter discusses the
purpose and significance of this research, outlines its scope, limitations and contributions and
presents the organisation of the thesis chapters.
1Heuristic refers to the type of information or knowledge gained through experience not from scientific
studies.

16
1.2. Purposes and significance of the study
The objectives of this research are twofold:
a. To develop a framework for designing a model for agricultural land evaluation and
crop suitability assessment that uses knowledge from various sources and helps in
selecting an optimal crop for a farm unit after a detailed evaluation of various
contributing factors. The knowledge may be of scientific and or heuristic nature.
b. To develop a prototype expert system that utilises knowledge drawn from a
human expert (crop advisor) to help farmers in choosing an optimal agricultural
land use (and an optimal crop) for a farm unit by assessing a farm unit‟s physical
resources and social, economic factors associated with it.
Land classification and land evaluation had been the domain of soil scientists until the early
1990‟s (Rossiter 1996:3). Mainly, because it was believed that soil was the key factor in
deciding a particular land use. However, the land evaluation frameworks prepared by FAO
(FAO 1983, 1985, 1994) have reiterated in their methods that it is not only the soil that
influences the land use, but also a whole range of other factors, including climate, geology,
water availability, social and economic objectives of farmers. As a result, the land
classification and land evaluation approaches have undergone a radical change. Modern
methods try to assess a land unit‟s suitability for different land use choices, unlike the
traditional land evaluation methods (pre-1973) which classified a land on a general
goodness factor (Diepen et al. 1991:153). The land evaluation procedure no longer
belongs to or depends on, a single scientific domain. Indeed, an integrated and multi-
disciplinary approach predominates (Beynon, Rasmequan & Russ 2002:127). Expertise
from various scientific domains such as soil science, geology, groundwater, climatology,
agriculture, environmental science, economics and politics are essential to choose an
optimal crop or to develop a sustainable land use plan for a farm unit. Ideally, land
evaluation should be carried out by a land evaluation expert working with a team of
specialists who have expertise on various aspects of land use science (Rossiter 1996:3).
The current research uses knowledge inputs from scientific studies and human
experiences that come from various sources for land evaluation and crop suitability
assessment.
Heuristic knowledge derived from human experiences, rules-of-thumb and trial-by-error
findings have proved to be worthy in certain fields such as Agriculture and Medicine (Shu-

17
Hsien Liao 2005:94). In particular, land management scientists and land use planners have
learnt much from their past experiences and also from the experiences of farmers. This
knowledge plays a vital role in executing successful land resources management programs
as reported by Wei, Jianbang & Tianhe (1992:322). Traditional Decision Support Systems
(DSS) that use static algorithms find it difficult to solve such land use planning problems
due to the inherent uncertainties involved in the decision-making process (McClean et al.
1995:79). The number of factors affecting a land use decision may increase or decrease
depending on the scale and type of land use considered. Hence, decision support systems
need to solve such land use planning problems with a human-type problem solving
approach. Land use experts and crop consultants use a heuristic approach to arrive at an
optimal land use plan (Detlefsen & Jensen 2004:58). Their approach combines scientific
evaluation procedures, such as the results of soil testing, groundwater quality assessment,
and heuristic assessment of social conditions, and political and market factors. Many
decision support systems that deal with land development and land use planning problems
require both spatial and heuristic analytical capabilities to solve problems (Somrang,
Chuenpichai & Chuenpichai 2002:Section I). Expert Systems (ES) permit us to add the
heuristic knowledge as facts and rules into DSS thereby providing heuristic analytical
capabilities to the process of decision making.
Conventionally, the land owner approaches a group of experts to get a better land use plan.
The experts analyze resource potentials and constraints to arrive at a feasible land use
option for the land unit. In an ideal situation, various experts associated with land
evaluation are invited to participate in the decision-making process to decide upon the best
land use or a crop for a farm unit given certain feasible land use or crop choices. By
negotiations and debates, an optimal consensus decision is determined. Various
researchers (Geertman, Openshaw & Stillwell 1999:18; Ventura, Miller & Barry 2003:87;
Leung 2003:201 and Randolph 2004:55) have stressed the need for decision support
systems that could help people to use collective knowledge (from various sources) and
help them in arriving at an optimal land use plan. This type of model, which supports
collaborative decision-making, can be emulated by having an expert system. As shown in
Figure 1.1, an expert system can use networked knowledge servers which provide required
information and knowledge rules necessary for decision-making. The inference engine will
then act as an intermediary between the user and knowledge bases to deliver suggestions
to the user.
18
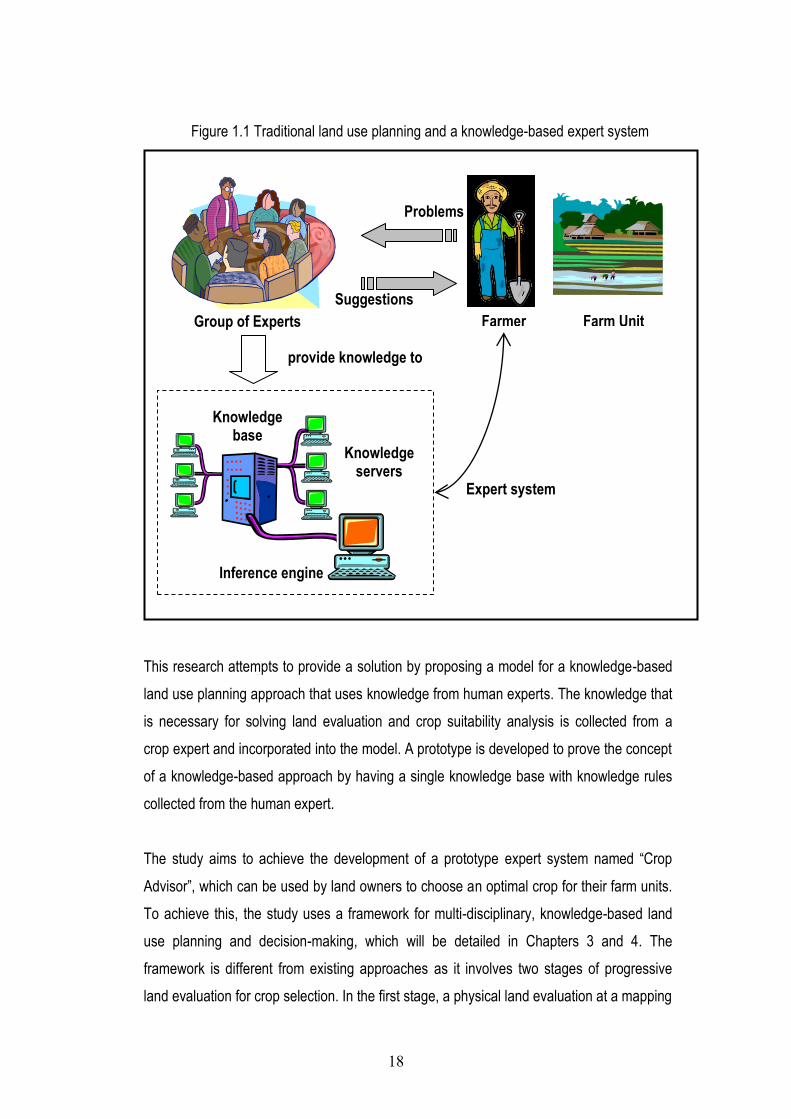
Figure 1.1 Traditional land use planning and a knowledge-based expert system
This research attempts to provide a solution by proposing a model for a knowledge-based
land use planning approach that uses knowledge from human experts. The knowledge that
is necessary for solving land evaluation and crop suitability analysis is collected from a
crop expert and incorporated into the model. A prototype is developed to prove the concept
of a knowledge-based approach by having a single knowledge base with knowledge rules
collected from the human expert.
The study aims to achieve the development of a prototype expert system named “Crop
Advisor”, which can be used by land owners to choose an optimal crop for their farm units.
To achieve this, the study uses a framework for multi-disciplinary, knowledge-based land
use planning and decision-making, which will be detailed in Chapters 3 and 4. The
framework is different from existing approaches as it involves two stages of progressive
land evaluation for crop selection. In the first stage, a physical land evaluation at a mapping
Farm Unit Farmer Group of Experts
Expert system
Inference engine
Knowledge base
Knowledge servers
Suggestions
Problems
provide knowledge to

19
scale of 1:100,000 is made to eliminate crop categories that are not feasible for a region.
This results in a group of suitable crop choices for a farm unit. Within the second stage,
climate, economic, social and political factors, derived from user inputs, are used to
suggest three crop choices that are best suited for the farm unit.
1.3. Research methodology
The research methodology consists of three phases:
1.3.1. Developing an appropriate model for agricultural land use decision
making
This phase includes determining the factors required for agricultural land use planning
and their relative importance towards the whole planning process. A comprehensive
model is developed considering these factors and by consulting a crop expert who is
specialized in land evaluation and land use planning. This phase forms the foundation
on which the expert system will be developed, and is dealt within Chapters 5 and 6 of
this thesis.
1.3.2. Developing the expert system
The model has to be translated into a schematic database which includes factors and
their linkages that contribute towards possible agricultural land use decisions. This
phase involves the collection of knowledge rules from a crop expert and coding them
into a knowledge base. It involves development of a prototype to test the model with
experimental data. Chapters 4, 6 and 7 aim to address this phase of the research.
1.3.3. Testing the expert system
When the expert system is ready, real world data will be introduced to it and tested for
validity of land use decisions. The validity of the expert system will be judged by
comparing its recommended crop choices with actual crops grown in the respective
farm units. A series of iterative testing, feedback and improvement phases will build a
satisfactory expert system. Chapter 8 deals with the testing methods and assesses the
feedback from people who tested it.
1.4. Limitations of the current study
Though the scope of the project is substantially large, it has some inherent limitations that
are briefly outlined below:

20
a. This research primarily focuses on amalgamating scientific and heuristic knowledge
into the land use planning process and serves as a proof-of-concept for a knowledge-
based decision-making approach. The quality of decisions depends on the quality of
the knowledge base and the vastness of knowledge rules used in an expert system.
Due to time constraints, the knowledge rules collected from the crop expert reflects
only a few factors, which serve the purpose of validating a knowledge-based approach
to agricultural land evaluation.
b. The research also discusses the importance of developing methods and tools for a
collaborative, knowledge-based planning approach. References are drawn from the
literature to support the advantages of multi-disciplinary, knowledge-based,
collaborative approach over the other methods.
c. From a system development life-cycle point of view, the proposed methods and
application provides only limited capabilities for use in real-world situation. As
discussed earlier, the main focus of this research is to prove this concept works by
developing prototype software and testing it with South Australian data. It is expected,
however, that the early findings of this thesis may lead to future large-scale,
commercial developments with substantive improvements. For example, with the
involvement from many organisations and with more resources, the system can be
developed into a real-time farm advice service for farmers through Internet. However,
the use of the term „real-time information‟ applies to weather and market factors which
change frequently rather than soil and geological factors.
1.5. Theoretical contributions
The current research aims to make following theoretical contributions:
1.5.1. At the outset, in the Decision Support Systems discipline, this work elaborates
a framework to design an expert system that could draw upon both scientific and
heuristic expertise to arrive at land use decisions. Such an approach has been
missing at the farm level, and this research is an attempt to fulfil the gap.
1.5.2. This research adds to the body of land use planning literature related to a
multi-disciplinary, knowledge-based land evaluation and crop suitability decision-
making at the farm level.
1.6. Practical contributions
The current research proposes to make the following practical contributions:

21
a. Develop a method to bring together scientific and heuristic knowledge to the
agricultural land use planning process to suggest a crop best suited for any
farm unit.
b. Establish a framework for adding knowledge into knowledge bases with
procedures for easy modifications and updates.
c. Though the expert system may not find an immediate commercial application,
it would be a pre-cursor for developing commercial knowledge-based,
collaborative land evaluation and land use planning tools in the future.
1.7. Organisation of thesis chapters
The thesis has been organized into nine chapters. Following the Introductory, Chapter 2,
Agricultural land use planning, elucidates the importance of land resources management
and land use planning (LUP), the importance of geographic information systems (GIS) in
LUP, and the process of land use decision-making for agriculture. It also discusses
different frameworks that are practised for land evaluation and introduces the knowledge-
based GIS approach and the current research framework. Chapter 3, Land suitability
evaluation and crop selection, discusses the process of crop suitability assessment as
practised by farmers and crop advisors and the factors involved in that process, their
relevance and how it can be represented in a heuristic form. The fourth chapter,
Computers in agricultural land use planning, traces the history of computing in agricultural
land use planning, the disadvantages of their algorithmic approach, introduction of expert
systems and the application of expert systems and GIS in agricultural land use planning. It
also reviews the current decision support systems that use a knowledge-based approach
to land evaluation. This chapter leads into Chapter 5, Land evaluation and crop suitability
analysis, which presents an overview of the proposed expert system, the framework used
for knowledge-based crop suitability assessment and explains the crop suitability model. It
discusses the procedure for collecting knowledge from various sources, and validating and
coding it into knowledge-bases. Chapter 6, Design and specifications, details the design
standards and architecture of the expert system, software and tools used to create the
expert system. Chapter 7 outlines the rationale and methodology adopted in developing
the expert system, and the procedure of building the expert system. In Chapter 8, Testing
and feedback, the process for testing the expert system, assessment of feedbacks and
modifying the prototype is described. The last chapter, Chapter 9, Discussions and

22
conclusions, presents the outcomes of the research, the theoretical and practical
contributions made by the thesis and directions for further research.
1.8. Summary
This chapter has laid the foundations for this thesis by introducing the research objectives
and significance of the research. It has also introduced the theoretical and practical
contributions it expects to develop; and the limitations imposed on the research. Finally, it
presented an overview of how the thesis chapters are organized.

23
CHAPTER 2
AGRICULTURAL LAND USE PLANNING
2.1 Introduction
This chapter analyses the importance of land and the necessity to manage land resources in a
sustainable way. It reviews the concepts of land use, land evaluation and land use planning at
various hierarchical levels and defines the relationship between land evaluation and land use
planning. The chapter further elaborates the process of translating sustainable land use plans
at the regional level to farm land use plans.
2.2 Land and its importance
Land can be defined as a block of earth‟s surface which constitutes stable, dynamic or cyclic
attributes of the biosphere that extend vertically above (atmosphere) and below (subsurface)
an area (FAO, 1985:212). It is often characterized by the results of past and present human
and animal (and impacts of climate) activities to the extent that these attributes exert a
significant influence on future land uses (FAO 1980:6). Land is considered to be the basic
building block of human civilization. Almost all living beings depend on land for their existence.
In particular, humans heavily depend on land for food, clothing, fuel and shelter. Knowing its
importance, ancient civilizations worshipped land as one of the five elements of nature, along
with air, water, light (fire) and space (Dutt 2001:29; Wong 2004:16). In the pre-agricultural age,
the community owned the land and it was free to use by anyone (Mather 1986:3). The
community shared a responsibility for raising crops and preserved the lands with a sense of
stewardship to pass on to the next generation. Slowly, the ownership of land moved to
individual hands and hence the land use decision vested with individual interests. Land units
were seen and managed as individual management units with profit maximization as the prime
goal (Highsmith & Northam 1968:23) without much consideration about ecosystem. In other
words, conservation of land and use of land in conjunction with surrounding ecosystem became
the least priority among land owners. This was due to the lack of knowledge about ecosystem
principles as farmers concentrated on short-term gains without worrying about the long-term
impacts of their poor land use choices on the surrounding environment resulting in land
degradation (Donovan & Case 1998:19). Such type of land degradation was more apparent in
the developing nations as farmers practised cultivation in marginal lands with very little access
to scientific methods. As a result, the environmental balance was disturbed and many of the
land use choices practised by individual farmers were not sustainable over time. Intensive

24
agricultural practices and unsustainable farming practices have deprived the soil of nutrients
and paved the way for land degradation (Clay 2004:2). One remedy to this situation is to adopt
sustainable land use practices.
In order to sustain the environmental balance, the land and its resources need to be managed
in an effective way. To do this, an understanding of existing land resources and their current
uses is essential. From historical times, land has been exposed to many risks such as
degradation and over-utilization due to improper cultivation practices. Improper farming
practices alone have reduced agricultural productivity and caused environmental damage in
major parts of the world (World Bank 1997:1). Other factors, such as increasing population,
decreasing yield and reduction of cultivable lands have created tremendous pressure on
existing land resources. The marginal land areas available for agriculture are becoming
exhausted all over the planet (Homer-Dixon 1999:63; Barrett, Place & Aboud 2002:1) and
bringing additional lands into agriculture is no longer a feasible option. Agriculture land use
faces intense competition from urban, industrial and recreational land uses. From the 1960‟s,
societies have faced a challenge to maximise agricultural outputs from existing land in a
sustainable way. In his book “The Earth Can Feed Us” Osvald (1966) outlined ways of
increasing food production. His proposals included bringing more lands into cultivation,
increasing agricultural yield, using fertilisers and pesticides, plant breeding and mechanization
of agriculture. Importantly, Osvald devotes a chapter (Osvald 1966:99-101) emphasising the
importance of educating farmers of developing nations to increase overall farming efficiency.
The knowledge for understanding land characteristics, their relations and effects on crop yield
must be taught to farmers. Then, the farmers can undertake an accurate evaluation of existing
land resources, utilising them to maximum advantage by employing better cultivation methods
to increase crop yields. The prototype “Crop Advisor” expert system will attempt to fulfil this
kind of knowledge transfer to developing countries.
2.3 Land evaluation and land use planning
A piece of land can be described in terms of its physical, chemical, environmental, economic
and social attributes. These attributes are essential in determining the best use of the land. The
process of determining, assessing and characterizing land attributes is known as land
evaluation. The United Nations Food and Agriculture Organisation (FAO 1976:7) defines land
evaluation as the process of assessing land attributes to find its potentials or constraints for
specific (future) land use purposes. It is a multi-disciplinary science involving inventory,
25
Supply side Demand side
Specific land characteristics
Land
Land qualities
is defined by
are grouped as
Landuse
Land use requirements
needs land areas that fulfill
analysis and assessment of the physical, chemical, biological and socio-economic
characteristics of land. Land evaluation is a key step in land use planning. Land use planning is
the allocation of the best use for a land unit considering its resource potentials and limitations.
It involves careful consideration of available resources and matching them with a proper land
use activity that is also feasible from a socio-economic point of view (FAO 1993:1).
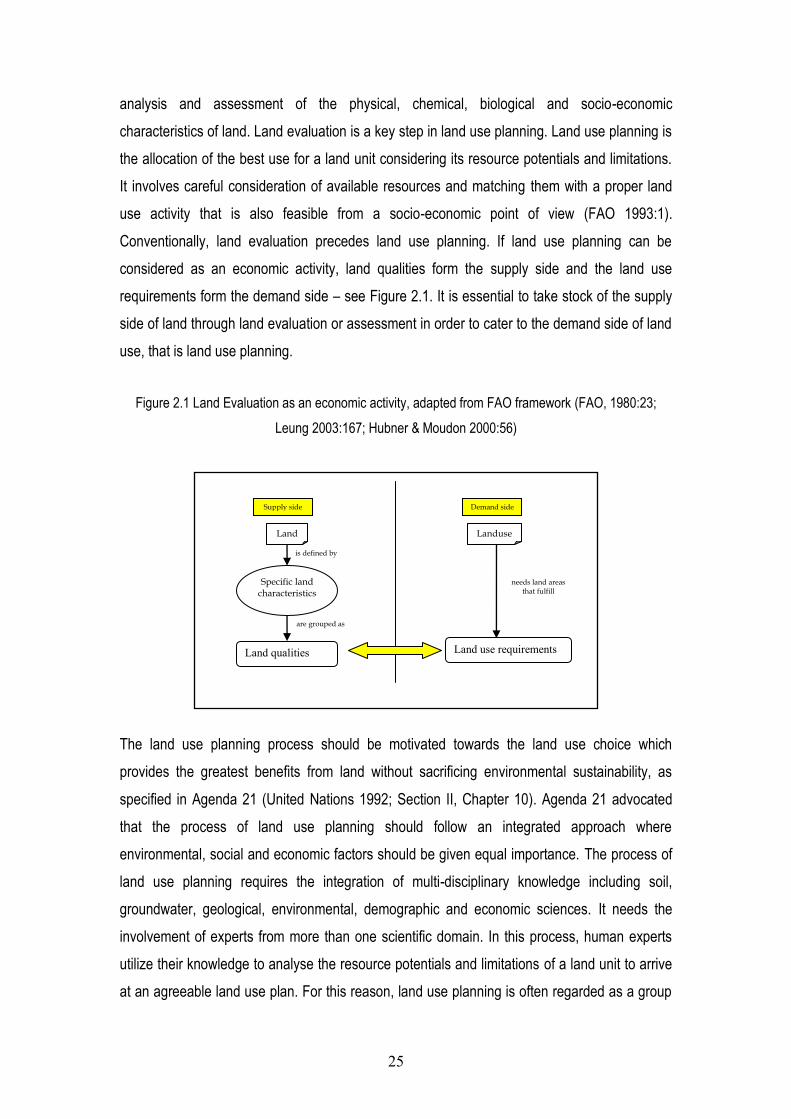
Conventionally, land evaluation precedes land use planning. If land use planning can be
considered as an economic activity, land qualities form the supply side and the land use
requirements form the demand side – see Figure 2.1. It is essential to take stock of the supply
side of land through land evaluation or assessment in order to cater to the demand side of land
use, that is land use planning.
Figure 2.1 Land Evaluation as an economic activity, adapted from FAO framework (FAO, 1980:23;
Leung 2003:167; Hubner & Moudon 2000:56)
The land use planning process should be motivated towards the land use choice which
provides the greatest benefits from land without sacrificing environmental sustainability, as
specified in Agenda 21 (United Nations 1992; Section II, Chapter 10). Agenda 21 advocated
that the process of land use planning should follow an integrated approach where
environmental, social and economic factors should be given equal importance. The process of
land use planning requires the integration of multi-disciplinary knowledge including soil,
groundwater, geological, environmental, demographic and economic sciences. It needs the
involvement of experts from more than one scientific domain. In this process, human experts
utilize their knowledge to analyse the resource potentials and limitations of a land unit to arrive
at an agreeable land use plan. For this reason, land use planning is often regarded as a group
26
activity that involves debates and negotiations between various experts, resulting in an optimal
solution.
2.4 Strategic land use planning
Strategic land use planning aims to conserve and develop land resources for commonhood.
The word „commonhood‟ dictates that the activity of land use planning should satisfy the needs
and aspirations of a broad range of people related to a piece of land. If land use planning is left
within individual hands, it would in all probability, be used according to their own interest and
may not be in conjunction with the interest of their neighbours. World Conservation Strategy
(IUCN-UNEP-WWF 1980: Section 1) defines “conservation” as the act of managing the Earth‟s
resources for the optimal uses by current inhabitants and maintaining the ability to meet the
desires and needs of future inhabitants. Also, it further defines “development” as the use of
biosphere and the application of living and non-living resources for satisfying human needs and
improving quality of life for everyone. Hence, it is essential to meet individual needs without
compromising needs of the society for sustaining resources. A state or planning authority takes
responsibility to make a land use plan for a region by considering the interests of commonhood
in order to achieve fair use of resources by everyone. Trade-offs and conflict resolutions are
part of land use planning and decision-making processes and require consensus among the
associated stakeholders (Malczewski 1999:87), primarily the land owners and farmers of a
region. In order to convince land owners, a regional land use plan should accommodate
economic and social aspirations of land owners, risking abandonment of the plan by land
owners if it does not. The regional land use plan should also consider short and long term
implications of alternative land use plans and scenarios for a geographical region. This
necessitates a comprehensive land use plan which should accommodate multiple land use
options and crop choices for land owners of the region. Such a plan can be only achieved by a
collaborative approach by involving stakeholders who will be affected by those decisions. At
least, the necessities of different stakeholders can be translated into a set of decision criteria,
and they can be included in the decision-making process.
2.5 Farm level land use planning
The purpose of a strategic land use plan prepared at a regional level is to guide land owners
and farmers in a region to develop their own land use plans for their farm units. Regional
strategic land use plans are developed after a preliminary assessment of soil and land

27
resources and they provide a good indication of possible broad land use categories that the
region can support. Government, through Land Resource Assessment agencies, usually carry
out land surveys and employ classification techniques to determine suitable land uses for long-
term sustainable production in an area and to identify preferred land use types (Shields, Smith
& McDonald 1996:7). Such preferred land use types and crops suitability results for a region
are published in the form of maps, often the mapping scale ranging from 1:1,000,000 to
1:50,000. These maps serve the purpose of guiding farmers and landowners to adapt and
devise their own land use plans for their farm units. The government agencies also push these
regional level land capability and suitability information to farmers and land owners to help
them to produce “Whole Farm plans” or “Farm-level land use plans”.
Whole Farm Planning is an approach to teach farmers to adopt sustainable land use practices
on their individual farm units by conveying information from regional soil surveys, land
capability and land suitability classifications (Shields, Smith & McDonald 1996:10). In a typical
“Whole Farm Planning” workshop session, farmers are assisted in mapping their own farm
resources and classifying them into discrete map units to assess the land capability for each
map unit (Garret 1993:11). The planning process considers the total farm assets, the soil,
water, pastures, crops and livestock, and how to make the best use of them. Such resource
inventorying and assessment measures are marked on the maps usually with the help of aerial
photos of the farm. Such “whole farm maps” form as a guide to the utilisation optimal farm
resources. A booklet published by Department of Conservation and Natural Resources, Victoria
(Garret 1993) illustrates the method of producing whole farm plans and includes successful
case studies by farmers.
Decision making at the farm level is often hampered by the scarcity of spatial data and reliable
information at the large-scale. The data and data sources become sparse as the scale
increases from 1:1,000,00 to 1:10,000. Farmers have to collect and interpret the required
information, from sources such as aerial photos and satellite images. With the lack of
knowledge and tools, this exercise is difficult, especially for farmers in developing countries.
Farm level decision making in agriculture is often risky because of uncertainties related to
some of its input information, such as market and weather factors. The future decision-making
models need to address unstructured, heuristic problems and the models must utilize more

28
than one type of knowledge (Harsh 1998:7). With the scientific knowledge, the knowledge
gained from experiences – heuristic knowledge – need to be used in decision making.
In the current research context, land use planning is relatively simple as it involves only
individual farm units on a mapping scale of 1:10,000. The land use planning at farm level is
carried out by the land owner, and is generally motivated by profit maximization utilizing
available resources. Further, there exist some common challenges to land use planning at farm
level (Fresco 1994:5-7), which include:
1. Diverse land owners – land owners are unique and different, come from various social
and cultural backgrounds and hence they are likely to have different approaches and
methods to choose a land use.
2. Goals among the stakeholders involved in the planning process are diverse. For
example, a landowner might be interested in profit maximization but the government
may not allow a certain land use in the interests of conserving the environment.
3. Future expectations – land use planning is a continuous, iterative process which
demands minor adjustments as and when needed.
4. Limitations of existing models – current models do not accommodate scale variations
and community involvement.
There are commonly two approaches that explain land use decisions by land owners (Mather
1986:26). One approach assumes that the physical factors such as soil type and water
availability determine the use of land. The other approach views the land use decision making
as a purely economic activity of investing resources and reaping benefits. Land owners make
land use decisions and choose crops based on their economic aspirations. Farmers then,
evaluate these land use choices based on the past performance (yield levels), neighbouring
farmer‟s advice, market demands, seasonal weather forecasts and government regulations.
There are some decision supports systems that help farmers in the process of evaluating
various crop choices and then choosing the optimal crop for their farm units. A brief overview of
such computer-based decision support systems are presented in the next chapter.

29
2.6 Needs of farmers
The current research is aimed at farmers of developing countries who often do not have expert
agriculture advice from crop advisors. Hence, it is necessary to study the specific goals that
motivate land owners and farmers. Basically, farmers would like:
to understand the potentials and limitations of their farm units‟ resources
to discover how the available land resources can be utilized optimally
to find out, in particular, which specific crop will be most profitable and feasible for the
farm unit
to determine ways to restore land productivity that will lead to conservation of
resources for future
Based on these motivations, the basic purpose of land evaluation is to estimate the potential of
land to get optimal economic returns by cultivating alternate crops. Farmers who have
understood their land potential and who derive maximum benefits from their farm would not be
interested in formally evaluating their land units for alternate crops. This “Crop Advisor” expert
system is for those farmers and land owners who are contemplating a different land use or crop,
and who want to better utilize their farm resources to meet their economic goals.
During the period June 2001 to November 2001, Indian Agribusiness Systems Pty Ltd
conducted an information-needs survey (Maru 2003:9-10) across selected districts of three
States of India to understand the needs and information requirements of Indian farmers. The
study highlighted the fact that most farmers wanted to know the best crop for their land unit
considering their land‟s resources. Others wanted to know such as how to grow crops
efficiently and how to market them to obtain the best price. Farmers were also interested in
evaluating their farm units to find out feasible new crop choices.
2.7 Summary
Land is the basic necessity for our survival. Land has been exposed to many risks resulting in
degradation due to improper management. Land resources need to be evaluated and land
uses must be planned for the successful management of land. Different stakeholders involved
in the land management arena are motivated by different objectives. To develop a successful
land use plan, the knowledge and expertise from various stakeholders must be gathered and
negotiated under a common framework. A multi-disciplinary approach is essential for arriving at

30
a consensus among the different stakeholders involved in the land use management. Land
evaluation and land use planning are regarded as group activities involving various experts
from different disciplines and thus a decision support system that is capable of handling the
complexity is needed. The current research proposes to collect knowledge from a single crop
expert who is capable of providing multi-disciplinary knowledge rules to build an expert system
for developing land use plans at farm level. In the next chapter, a review of existing decision
support systems that have been developed and applied in land evaluation and land use
planning is presented and discussed.

31
CHAPTER 3
COMPUTERS IN AGRICULTURAL LAND USE PLANNING
3.1 Introduction
The chapter presents an overview of the application of computers in land evaluation and land
use planning. It begins with an historical account of use of computers in decision-making and
use of computer-based decision support systems in land use planning. It lists the drawbacks of
early decision support systems that are based on algorithmic approach to solve land use
problems. The chapter then introduces the expert systems and how it resolves the drawbacks
of traditional DSS and discusses about the use of knowledge-based tools and GIS tools in land
use planning. Finally, the chapter reviews present decision support systems that combine the
Expert Systems and Geographic Information Systems (GIS) technologies.
3.2 Computers in decision support
The use of computers in decision-making dates back to the 1960s (Lucas 1973:22-24). The
earliest computer systems were Transaction Processing Systems (TPS) that were used to do
repetitive, labour-intensive processes that could be streamlined to reduce costs (Stair 1996:58).
Later, Information Systems were developed for digitizing, storing data and retrieving
information. Management Information Systems (MIS) made use of these information systems
to assist management functions including report preparation, scheduling and planning. The
evolution of various technologies adopted in decision support systems is presented in Figure
3.1.
Figure 3.1 Evolution of Computer Systems in Decision Support (adapted from Power 2005)
Tra
nsac
tion
Pro
cess
ing
Sys
tem
s
Man
agem
ent I
nfor
mat
ion
Sys
tem
s
Exe
cutiv
e In
form
atio
n S
yste
ms
Gro
up D
ecis
ion
Sup
port
Sys
tem
s
Exp
ert S
yste
ms
1930 Mid 1980s
Web
-bas
ed E
xper
t Sys
tem
s
Early 1980s 1970s 1960s Mid 1990s

32
Decision making involves three stages viz., (i) defining a problem, (ii) developing alternate
solutions and (iii) choosing the best solution from those alternatives (Mintzberg, Raisinghani &
Theoret 1976:251). An ideal decision support system should help users in these three steps of
decision-making to solve a specific problem. Decisions Support Systems have been applied in
almost every conceivable field, have embraced every kind of technology, and have grown
stronger over the years (Beynon, Rasmequan & Russ 2002:127). With other complementary
technologies, decision support systems have been applied in planning and management of
resources. Land use planning is one such area in which they have been found a successful
application.
3.3 Computers in land use planning
The process of land use planning has become simpler and more refined with the advent of
computers. Many organizations developed information systems to store, analyze, and retrieve
stored information for helping in day-to-day decision-making (Lucas 1973:22-24). These
information systems helped decision-makers to solve resource allocation problems better and
faster. However, these systems simply stored the data and facts which supported decision
makers. Decision makers were supplied with critical information and patterns that exist in the
data for simplifying the decision-making process. Also, each information system was a stand-
alone computer system, which made the interaction process difficult in case of a problem which
could benefit from integration of information from multiple scientific disciplines.
Later, semi-automated decision support systems were introduced which used specific
algorithms for solving problems. Semi-automated decision support systems presented
decision makers with various alternate choices and recommending the best among
them. Numerous decision support systems have been developed for land evaluation and land
use planning and they have been reported in the literature. The more significant are the Field
level GIS (FLEGIS) (Runquist, Zhang & Taylor 2001; Zhu, Xuan & Dale 2001), the spatial
decision support system (SDSS) (Matthews, Sibbald & Craw 1999), the Technique for Order
Preference by Similarity to Ideal Solution (TOPSIS) (Malczewski 1996) and the Multiple-Criteria
Decision-Making model (MCDM) DSS (Pereira & Duckstein 1993). These consider multiple
factors to support problem-solving in land use decision making. A notable recent development
is the Spatial Decision Support System (SDSS) in Kenya (Ochola & Kerkides 2004) which
carries out land quality assessment based on a number of factors such as land holding, farm
labour availability and access to agricultural extension services as well as selected socio-

33
economic factors. However, such decision support systems could not match the decision-
making process of a human expert and had some inherent limitations. These decision-support
systems required a set of predefined input datasets to begin their analysis. Without providing
such inputs in a proper required format, the system could not begin the analysis. After getting
inputs from users, with a step-by-step approach, as dictated by algorithms, the decision support
systems proceeded to analyze the input data to reach conclusions. Often the knowledge about
solving the problem was represented in the DSS‟s algorithm based on a multiple-criteria
decision-making model (Laaribi, Chevallier & Martel 1996:354). The system analyzed the input
information and produced a better land use plan after evaluating the land capabilities and
eliminating unfeasible crop choices for a farm unit. The quality of the results of land evaluation
and land use decisions depended on the efficiency of algorithms. The algorithms were
embedded within the decision support systems and hence a change in algorithm needed
redevelopment of the decision support systems. New algorithms, and hence new decision
support systems, were developed in order to improve the quality of land use decisions. The
following section lists the drawbacks of such traditional decision support systems that depend
on algorithms that are difficult to change without modifying the entire software application.
3.4 Disadvantages of traditional approaches
The inherent disadvantages associated with traditional algorithmic DSS can be listed as follows:
i) The algorithm is directly embedded into the application i.e., the knowledge of
problem-solving is within the program (software). The software needs to be
modified or redeveloped if the knowledge base needs to be updated. In other
words, the criteria for solving the problem cannot be separated from the
software program.
ii) Modifications of the criteria are difficult as it requires programming expertise or
knowledge about the models and software tools used in DSS.
iii) Algorithmic approach is fixed and rigid as it is not flexible enough to modify on-
the-run.
iv) Any new alternative solutions required the entire application or software to be
re-written.
v) Algorithmic approach controls the flow of problem solving by step-by-step,
linear approach rather than quick, intuitive approach. For any given inputs, the

34
algorithmic approach would follow the same steps and hence take the same
amount of time for every run.
Though there are many disadvantages found in a rigid, fixed approach it is not humanly
possible to solve a problem which has no predefined number of variables. In any decision-
making problem, all the variables which affect a decision are not taken into account. Instead,
the ones that are considered sufficient to solve the problem are used. In a classical decision-
making problem, it is often difficult to predict the number of variables involved in advance (Hale
& Whitlam 1997:138). The number of factors (variables) may decrease or increase depending
on each input case. Each case may use different number of factors (variables) depending on its
complexity. The user may not have inputs for all the variables (or the user may not wish to use
all variables) required by the program. Hence, it is sensible to search for an approach which
accommodates such flexibility. The decision making model should function even if the user
omits some variables from the set used by the decision support system. It would be an added
advantage if the decision support system facilitates adding of new variables to it based on
which the problem can be solved.
In short, land evaluation and land use planning require a program which can handle these
uncertainties (data availability) and simple enough to be modified by anyone without the need
to rewrite programs and software. Despite many improvements in algorithms, tools and user-
interfaces, the implementation and usability of DSS had been moderate due to the lack of a
human centric, empirical approach to problem-solving (Beynon, Rasmequan & Russ 2002:127).
There were no provisions to include such heuristic knowledge into the traditional decision
support systems. The DSS followed a machine-like approach rather than the human-like,
cognitive approach. In addition, these systems were found to be rigid and the criteria required
for the decision-making process were coded directly in the software program. Hence, any
modification needed alteration of the entire program. These shortcomings led researchers to
conceive a system where the knowledge base (criteria used to solve a problem) could be kept
separately, which would enable modifying the knowledge base without disturbing the whole
structure.
3.5 Expert systems
In the early 1980s, the science of artificial intelligence began to develop knowledge-based
expert decision support systems (or simply, expert systems) which could use not only scientific

35
knowledge but also cognitive knowledge to solve some simple medical diagnostic problems
(Kent, Hall & Williams 2000:115). Although the problems solved were simple, expert systems
became invaluable tools in automating certain laborious, well-structured tasks such as
diagnosing a disease by following a set of symptoms. With acquired in-depth knowledge and
expertise in a narrow domain, expert systems can be engineered to deliver decisions and
recommendations (suggestions) as easily as humans can. Like a human expert, these systems
rely on an extensive knowledge base to solve domain-specific problems (Jackson 1999:2). A
typical knowledge base stores information and knowledge in the form of rules and it is
independent from other program modules (see section 3.6 for more details). Expert systems
keep the rules used in decision-making (called as knowledge base) separate from the program
which controls the flow (the inference engine) -see Figure 3.2. Expert Systems utilize the
derived human intelligence (knowledge) to imitate human experts in solving a problem. Expert
systems are usually suited for land evaluation and land use planning problems, as this field
requires comprehensive, up-to-date knowledge from various domains involving a variety of
information sources. Since expert systems work on a continuously growing knowledge base,
they can behave similarly to a human expert in solving multiple problems in a domain.
Figure 3.2 Components of a typical Expert System (adapted from Luger & Stubblefield 1989:294)
Most of the expert systems also have an explanation module, which can give an explanation for
arriving at a particular decision. Another advantage with the ES is that the knowledge base can
User asks a query User-interface (UI) formats the query and sends to the Inference
Engine (IE)
User may request more information about the reasoning
behind a query or result
Explanation system
Expert System
IE matches the query with existing Knowledge rules in the Knowledgebase (KB) and
sends a request to KB
Knowledgebase (KB) stores facts, assumptions, and
knowledge rules
Explanation System gives explanation to users about
questions and results
Knowledge base
Inference Engine
User Interface

36
be created, expanded and edited by anyone without disturbing the program module. Expert
systems can work even if some factors are omitted by the user as opposed to the traditional
decision support systems which will not solve a problem unless all the necessary factors are
provided by the user.
3.6 Components of an expert system
A typical knowledge-based expert system essentially should possess three components
(Figure 3.2) viz.,
(i) Knowledge base which contains the necessary rules and procedure for solving a problem
(ii) Inference engine which controls the information flow between the user interface to
knowledge base and
(iii) User interface which collects inputs from the user and displays outputs to the user.
3.6.1 Knowledge base
The knowledge base is the heart of a knowledge-based system (KBS). It records the factual
and causal knowledge from human experience and scientific studies in more than one way.
The knowledge base contains a collection of rules and assertions on land evaluation and crop
suitability. The knowledge rules used in the research are supplied by the South Australian
Department of Land, Water and Biodiversity Conservation (DWLBC). The validation of
knowledge rules is an important step in building the knowledge base. The knowledge rules
used in this research have been thoroughly cross-checked for consistency across the entire
knowledge base with assistance from a crop expert at DWLBC. In case of more than one
expert or expert knowledge bases, this process can become tedious as there are more
chances of disagreements among the various rules. For example, a rule may be favoring a
certain crop choice but another rule may completely omit that choice. In this case, priorities and
confidence levels must be set for each knowledge rule to ascertain which rule should take
precedence in case of a rule disagreement. This is similar to the procedure giving weightings
(prioritizing) to the factors and rules involved in a multi-criteria decision making problem.
Prioritizing is ranking of factors on their significance towards the overall decision making
process. Confidence levels are specifically developed for heuristic rules which come from
human experience. This is because human perceptions and notions resulting from experience
may vary from person to person. So, for each rule, a confidence level needs to be specified to
ascertain the rule‟s consistency. Confidence level for a rule can vary from 0 to 100 on a scale

37
of consistency measure, where 0 indicates absolute unsurety and 100 indicates absolute surety.
Ideally, a threshold confidence level can be set for each factor to make a rule active, and this
threshold depends on the nature of factors and the importance of each factor in problem
solving. For instance, if the threshold confidence level for a factor is set at 70, it is necessary
that a rule should have higher confidence value (surety) to become active. If not, that particular
rule will be ignored in the problem solving.
3.6.2 Inference engine
When the user inputs a set of land qualities or land characteristics, the inference engine
matches these with the existing rules in the knowledge base and suggests a crop most suited
(optimal) to that particular land unit. It acts as an interpreter between the knowledge base and
the user interface. The inference engine receives each incoming query (problem) and matches
it with a similar pattern in the existing knowledge-base to prepare a solution (answer) for that
query. In other words, the inference engine does the reasoning and then provides explanations
for arriving at a particular solution.
3.6.3 User interface
This is the most important component of the expert system from a user‟s point of view. It should
act as an easy-to-use interface to get inputs from users and provide outputs to users.
The expert systems of the 1970s were specifically developed for a single domain problem, for
example, MYCIN (Shortliffe et al. 1975) enabled medical diagnosis and PROSPECTOR (Duda,
Gaschnig & Hart 1979) helped in mineral prospecting. Slowly, the trend of ES applications
shifted from discipline-specific (solving all problems in a domain) to problem-specific (solving a
problem using multi-disciplinary knowledge) (Shu-Hsien Liao 2005:99). Some complex
problems like land evaluation and land use planning demand multi-domain knowledge and this
led to the development of multi-domain expert systems. Multi-domain expert systems require
knowledge from more than one domain and generally used to solve multi-disciplinary problems
(Chew, Tan & Murphy 1995:177).
In the real world, environmental, socio-economic and demographic phenomena occur in a
spatial context. Decision making associated with these phenomena is regarded as “spatial” as
it is a process of “solving spatial problems using spatial means to achieve desired spatial ends”
(Erik De Man, 1991 quoted in Chen & Gold 1992:2). Land management problems are

38
essentially spatial in nature, in that they involve observations (measurements) from a
geographical area. The management decision-making is dealt with by considering the land as
discrete, spatial units. Recent years have seen the rise of GIS (Geographic Information System)
tools as an effective way to manage spatial information in a digital environment. Hence, most of
the decision support systems in the land management domain are spatial decision support
systems (SDSS). They simplify the implementation process by producing results in the form of
scaled maps which can be referred to during ground surveys. The combined approach
integrating heuristic knowledge bases in a spatial environment helps land managers in planning
and decision-making. They integrate the spatial modelling capabilities of a typical GIS and
reasoning ability of expert systems.
3.7 Importance of GIS
Geographic Information Systems (GIS) are a set of tools which capture, store, analyze and
present geographically referenced spatial data (Burrough 1992:1). To assess and manage
resources, appropriate tools are needed to understand and visualize their inter-relationships.
GIS tools help in modelling and visualizing complex relationships in order to solve a spatial
problem. This involves an integration of social expectations and ecological capabilities and
minimizing the differences between resource demand and availability. While the satellite borne
sensors and mapping technologies help in providing inputs, GIS tools have been useful in
breaking down the “spatial complexities” that exist between various natural and man-made
phenomena on the Earth's surface (Ponnusamy & Gowda 2002).
The real world can be categorized and its entities including natural, demographic, socio-
economic information and infrastructure facilities and services can be mapped into several
spatial datasets. The integration of this diverse datasets within a framework needs powerful
tools that can manage a huge amount of spatial information. It demands consistency across the
datasets and requires an effective matching of entities based on their geographic locations.
GIS tools permit a synergy between various conventional datasets, computerized databases
and information from diverse disciplines including statistics, cartography, photogrammetry and
remote sensing (Ponnusamy & Gowda 2002). A successful approach to land evaluation
invariably requires data, information and knowledge from various sources to be integrated. GIS,
with its associated tools, is capable of performing integrated analyses to transform the datasets
into the required information for land evaluation. Expert systems use GIS tools to handle these
spatial datasets and by employing the knowledge rules and methods contained in their

39
knowledge-bases, they go hand-in-hand to solve problems like land evaluation, environment
impact assessment and site suitability studies. Many instances of expert systems and GIS
integrations can be found from the literature, and the next section reviews some integrated
systems that have been developed to solve land evaluation and land use planning problems.
3.8 Expert systems and GIS in agricultural land use planning
From an extensive survey of literature since 1986, at least 30 decision support systems can be
found that combine Expert System and Geographic Information System tools to solve the
problem of land evaluation and land use planning. Of these 30 decision support systems, only
seven are actively used in the decision making processes and they are presented in Table 4.1.
There are some specific land use planning expert systems that have used multi-domain
knowledge bases to deliver land use decisions and recommendations. The majority of these
expert systems followed the theoretical framework for land evaluation outlined by the Food and
Agriculture Organisation (FAO 1976).
Table 4.1 List of Expert Systems used in Land Evaluation and Land Use Planning
NAME ES GIS Land Evaluation (LE) OR Land Use Planing (LUP)
COMMENTS Farm level Decisions?
MicroLEIS Both web enabled
serves a specific region
little use by farming community
No. Can be used as a guide.
LEIGIS LE physical LE, limited economic factors
social, economic, climate factors need to be included
considers 5 crops
Yes.
ILUDSS, Scotland soil and water conservation
cost estimation for development
Yes.
EGIS, Thailand Both? uses ALES shell No.
CRIES, Kenya LE uses ALES shell No.
PNGLES, Papua New Guniea
LE uses ALES shell No.
LEV-CET, Ethiopia LE uses ALES shell 3 crops
Yes.

40
The Automated Land Evaluation System (ALES) is a customizable ES shell that can be
developed into an expert system to the user‟s requirements (Rossiter 1996:3). Kenya‟s
Comprehensive Resource Inventory and Evaluation System (CRIES) (CRIES 1983), Papua
New Guinea Land Evaluation Systems (PNGLES) (Venema & Daink 1992) and the Land
Evaluation system for Central Ethiopia (LEV-CET) (Yizengaw & Verheye 1995) are few expert
systems developed using ALES expert system shell. However, all of these systems relied
heavily upon the physical land evaluation, neglecting social and economic factors. Socio-
economic conditions of farmers such as farmer‟s skills, size of land holding, current market
price for a crop, its market demand, neighbouring land uses and government policies and
regulations have a considerable effect on land use decisions. Only a few land use expert
systems, such as the Islay Land Use Decision Support System (ILUDSS) (Zhu, Xuan, Aspinall
& Healey 1996), the Land Evaluation using an Intelligent Geographical Information System
(LEIGIS) (Kalogirou 2002) and the Mediterranean Land Evaluation Information System
(MicroLESS) (Rosa 2004) consider economic factors, and then only in a limited way.
More significantly, none of these expert systems took current knowledge (market price,
demand for a crop produce, weather forecast, government policies) into consideration. Instead,
most of these expert systems have a static knowledge base which does not take this dynamic
information. It is however agreed that it is impossible to preconceive all the factors necessary
for a decision-making problem. So, provisions need to be made to incorporate new, additional
factors into the decision support system. At least a software framework needs to be developed
which allows addition of new factors. Further, the reported expert systems were mono-
objective, conceived to solve a specific land use problem such as finding land units suited for
growing a particular crop rather than attempting to find a best crop for a land unit considering
available resources and crop choices.
While such reviews are important from a systems perspective, Bacic, Rossiter & Bregt (2003)
investigated the reasons for failure of land evaluation systems in a case study in Brazil. The
primary shortfalls of land evaluation programs as identified by the survey respondents included
the failure to assess crop suitability with factors such as weather, yields, profits and market
(financial) analysis, absence of social analysis (needs and motivations of users), and
inadequate choices for land use alternatives (not providing multiple land use options). These
deficiencies could have been avoided with a demand-driven approach, by considering the true
needs and opportunities of the users. Hence, finding the needs and expectations of users of

41
the proposed expert system becomes a critical, an essential step. Though, current research
never attempted to find the needs and expectations of the users directly, it used secondary
sources (See section Error! Reference source not found.) to understand their needs. It aims
to build a knowledge-based expert system which would overcome some of the shortfalls of
existing expert systems that are used in farm level land evaluation that help in choosing optimal
crop choices.
3.9 Summary
The role of decision support systems which use algorithms is very limited in land evaluation
and land use planning. Expert systems approach the problem by emulating human experts and
having a continuously growing knowledge base. The existing expert systems are limited in real-
world application as they consider limited factors, suggest few land use options and do not
consider socio-economic and local factors. There is a need for a comprehensive agriculture
land use expert system, which could help farmers with a holistic approach, served by multi-
disciplinary knowledge bases to assist land owners in deciding a suitable crop. There is also a
need to know what the users‟ expectations are and provide power in the hand of users to
choose between alternative crop choices among the suitable ones. The next chapter outlines
the various frameworks used in land evaluation and land use planning and presents current
research framework.

42
CHAPTER 4
FRAMEWORK FOR KNOWLEDGE-BASED SPATIAL DECISION SUPPORT
SYSTEMS
4.1 Introduction
This chapter discusses the concept of data, information and knowledge and explores the
knowledge flow in agriculture. It lists the types of knowledge and proposes a framework for
acquiring knowledge from human experts. The chapter reviews the various frameworks that
have been used in designing land evaluation and land use planning systems and then outlines
the concepts and frameworks adopted in the current research. It argues the advantages of a
knowledge-based framework over other frameworks.
4.2 Data, information and knowledge
If data can be defined as a collection of discrete, unorganized facts or observations, information
will refer to the processed data aggregated in a meaningful way that provides additional value
(Awad & Ghaziri 2004:36). Knowledge will then refer to the information with a context that is
ready for usability for decision-making (Spender 2005:135). Knowledge can be a collection of
rules, guiding principles, events and measures that are contextual to a problem. With the help
of knowledge, snippets of data and information can be aggregated, organized and presented
as a solution to the problem in hand. The relationship between data, information and
knowledge can be depicted in an illustrative form (Figure 4.1). This relation was first proposed
in the literature as a Data-Information-Knowledge-Wisdom (DIKW) hierarchy model (Ackoff
1989 quoted in Spender 2005:135).

43
Figure 4.1. Knowledge Pyramid (adapted from Awad & Ghaziri 2004:41)
As shown in Figure 4.1, data forms the fundamental base for deriving information, knowledge
and wisdom. Computers are useful in handling data and information and knowledge to some
extent, whereas, attaining or realising wisdom is still the sole territory of human beings.
Database management systems are specialized in managing data. Information systems are
useful in classifying and organizing data in a coherent, meaningful way. Knowledge can be
derived by collating various pieces of information with a collection of rules and procedures that
have similar (common) context. Expert systems are useful in collecting, storing, processing and
delivering this knowledge. At the bottom-end of the pyramid remains the data which can be
programmed algorithmically. As we move to top, we find knowledge and wisdom that are non-
algorithmic and heuristic in nature.
Knowledge is primarily gained through learning by experience, studying and validating
information gathered from many sources. Awad & Ghaziri (2004:42-47) classify knowledge into
categories based on the ease of access, method of accruing and ease of programming. They
can be summarized into two types viz., (i) procedural, shallow knowledge and (ii) episodical,
deep knowledge. While it is easy to acquire and use the first type of knowledge, it is often
difficult to extract the second type, which is tacit and deeply embedded in human minds and
which cannot be easily expressed in words. Such form of tacit knowledge is very useful in
disciplines of medicine and engineering which require qualitative advices and opinions from

44
experts (Nikolopoulos 1997:1). Expert systems help in collecting, storing, manipulating these
type of knowledge for decision-making.
4.3 Knowledge in agriculture
One of the earliest definitions of agriculture (Norton 1855:2-3) describes it as a mix of art and
science. Agriculture is the art, science and business of cultivation by raising crops and livestock
(Ramharacksingh 2000:3). It is essentially a scientific process, but can become an art when
production resources are constrained as in the case of rain-fed farming. The knowledge of
farming comes from an understanding of different ecological factors that directly or indirectly
influence plants and animal growth (Piper & Soule 1992:79). Farmers who interact with these
factors have acquired this knowledge through their life time experiences. This knowledge is
very vital and how it flows from one person to other forms an interesting study. During this flow,
knowledge is validated, updated, generalized or even modified to suit regional variations. The
knowledge flow in agriculture is complex but can be broadly categorized into two categories
(Arunachalam, 2002):
(i) Knowledge flow from farmers to scientists (as a result of ground observations and
field practices)
(ii) Knowledge flow from scientists to farmers (from theories, experiments and cross-
cultural studies)
To these, a third and important category of knowledge flow can be added - knowledge flow
between farmers (traditional knowledge, local, empirical knowledge). This type of knowledge is
used by farmers widely in their day-to-day operations and practice but rarely gets published in
scientific literature.
The challenge for any expert system is to integrate all these types of knowledge into a system
to help in solving agricultural land use problems. While the first two categories of knowledge
can be readily found in the form of text-books and reports, the third category which deals with
empirical knowledge gained by farmers and crop advisor (who closely work at the farm level)
can be acquired from them.
4.4 Framework for knowledge acquisition
Acquiring knowledge is an important yet daunting task for a knowledge engineer – a person
who designs and builds a knowledge-based system (See Figure 4.2). The knowledge engineer

45
interacts with experts to gather the knowledge required to solve the problem addressed by the
expert system. The user uses the expert system and provides much needed feedback to the
knowledge engineer who uses them to improve the expert system. As the current research is
time-constrained; knowledge is not acquired directly from the farmers. Instead, the research
relies on the secondary knowledge gained by land evaluators and crop experts who interact
with these farmers. Using this knowledge, current research attempts to construct a working
prototype for evaluating land resources. The success of a knowledge-based expert system will
lie in the accuracy of its knowledge base. The limited knowledge base used in developing the
prototype may not be sufficient to provide real-world solutions, but it aims to set a framework
which can be improved further at a later stage.
Figure 4.2 Figure showing various users associated with expert systems (Refer to page 5 for definition of terms)
4.5 Framework for knowledge-based spatial decision support system
Land management problems such as land evaluation, land use planning and site selection
demand knowledge from multiple disciplines. Often these problems are complex as the factors
associated with them and their inter-relations are difficult to measure and model. Experts who
solve such problems may need to accommodate for incomplete, inaccurate or fuzzy datasets.
Hence, these problems need a flexible, knowledge-based, heuristic approach as opposed to
algorithmic, rigid methods of problem-solving. The dual objective of developing a knowledge-
User
Uses Expert
System
Designs and builds
Expert system
Knowledge Engineer
Provides expertise to
build expert system
Expert
Provides feedback

46
based system is to acquire human expertise about a problem domain and to use it to mimic a
human approach to solve the problem.
In a detailed review, Zhu, Xuan, Aspinall and Healey (1996:279-301) argued that users
experienced difficulty in operating these hybrid systems due to their unfriendliness. User
interventions were required for exchanging data or information and transferring controls among
those ES and GIS i.e., a smooth inter-operability between ES and GIS was missing. Users not
only needed to know about the problem-solving methods but also the intricacies of ES and GIS
tools and procedures. Combining the knowledge-based approach with spatial decision support
tools, Zhu et al (1996:281) proposed an integrated “Knowledge-based Spatial Decision Support
System” (KBSDSS) for assisting planners in strategic land use planning. A KBSDSS
incorporates spatial, quantitative, and qualitative modelling capabilities for problem-solving
(Zhu, Xuan , Healey & Aspinall 1998:37). It integrates components such as domain knowledge
bases (for solving problems), model knowledge bases (for formulating approaches) with
problem processor and back end systems containing GIS and expert systems (rule bases). A
query processing system helps in receiving queries from users and displaying results back to
users after analysis. A modelling subsystem allows users to wither choose an existing model or
design their own model of problem-solving.
Developing such a tightly integrated system costs money and time. With both these resources
restricted, it is proposed in this present research to keep GIS operations separate from the
expert system development. The spatial analyses of datasets will be carried out in a GIS and
converted into a form which is ready-to-use by the proposed expert system.
4.6 Frameworks for land evaluation
Land evaluation is considered as a complex, multi-faceted problem. Attempts have been made
since 1950s to develop a satisfactory, universal land evaluation model (Rossiter, 1996:2-3). A
comparative evaluation and a detailed review of different land evaluation frameworks were
presented by Rossiter (1996). Prior to the land evaluation frameworks released by Food and
Agriculture Organisation (FAO 1976, 1983, 1984, 1985 and 1991), land evaluation programs
had some common shortfalls. They gave much importance to physical land evaluation and
ignored socio-economic aspects of land use. They tried to classify land for a generic land use
which is an inappropriate method of evaluation as opposed to a detailed, local evaluation of
land attributes for specific land use purposes (Diepen et al. 1991:153). To alleviate these

47
shortcomings, scientists at the United Nations Food and Agriculture Organisation (FAO)
worked together to prepare a common framework - “Framework for Land Evaluation”- (FAO
1976), which is considered to be a milestone in the discipline of land evaluation (Beek 1981
quoted in McKenzie 1991:13). This framework provided a general overview of land evaluation
methodology outlining important considerations in designing a methodology for land evaluation
suited to local conditions. It provides definitions, a description of land qualities and guidelines
for physical and economic land evaluation. The radical changes reflected in the FAO
framework are the inclusion of socio-economic and local political factors in the land evaluation
process, assessment of land with respect to specific land use types, a multi-disciplinary
approach to land evaluation, setting priorities for environmentally sustainable land uses and
providing alternative land use options for users. Moreover, the FAO framework is easily
modifiable to adapt different implementation methods to different local conditions.
The framework developed by FAO comprises key terms and their definitions such as land
characteristic, land quality, land utilization type and land use requirement (FAO 1976:9-12).
Land characteristic is a direct measure of simple attributes of the land that can be directly
observed in a routine survey. For example, soil texture or pH of the soil. Land quality is a
complex attribute that can be derived by combining one or more land characteristics. It could
be a qualitative or quantitative derivative of land characteristics. For example, a land quality
named soil acidity is derived from pH, calcium, aluminium measurements in the surface and
deep soil. Land utilization type is a type of broad land use category. For example, horticulture
crops, dry land farming or intensive (irrigated) farming represent different land utilization types.
Combinations of certain land qualities form the ability of the land to fulfill specific land use
requirements. Land use requirements are the criteria required by certain land use (or a crop in
particular) for successful implementation of a land utilization type. For example, the criteria
(conditions) that are required by intensive farming may be different from dry land farming.
Further, the FAO (FAO 1994:15) framework outlines the steps involved in executing a land
evaluation which is briefly presented below:
i) Identification of decision-makers, their objectives and means of implementation
ii) Definition of the spatial entities that need to be evaluated
iii) Definition of the land utilization types to be evaluated
iv) Definition of the land utilization types in terms of land use requirements
v) Translation of the land use requirements in terms of land qualities and land
characteristics

48
vi) Building computer models for evaluation
vii) Computing and calibrating the results
viii) Presentation and Implementation of results
4.7 Current research framework
The FAO framework is simple and broadly aids at developing a land evaluation model. Hence,
it has been adapted in the current research. The FAO model is illustrated in Figure 4.3. It
includes climate factors, economic, social and political factors which influence the crop
selection process. This procedure also takes environment risk (if any) associated with each
land use choice (specific crop), yield levels and anticipated market demand for a crop produce.
While the physical land evaluation (Part 1 in Figure 4.3) process would eliminate the impossible
land use choices (or specific crop types) for a land unit, the socio-economic evaluation (Part 2
in Figure 4.3) would discard land use choices which are uneconomical or not feasible due to
other social or political reasons. In the end, selecting the best land use always rests with the
land owner, the user of the model, who will be usually presented with land use choices in a
descending order from most suitable to least suitable. Hence, it is also possible to provide
remedial measures or explanations in order to switch to a second choice in case the user is not
willing to settle for the first crop suggested by the system.

49
Figure 4.3. Simplified sequence for making decisions about the best use for land (FAO 1994:15)
Rossiter (1996) classifies land evaluation models into three major categories viz., (i) non-spatial
models that do not consider actual location of a land unit (ii) spatial models that consider
geographical surroundings (iii) multi-area land distribution model which achieves an optimal
plan. The first two categories are further classified into four sub-categories each based on
whether the resource bases are considered static or dynamic and if the land suitability is static
or dynamic. The current research model is classified as spatial based on a dynamic resource
base to provide dynamic land suitability. The model considers geographical location of a land
Social and
political factors
1
Objectives
Resources
Constraints
Land resources
database
2
Soil
Climate
Other factors
Land use
database
3
Crop
requirements
Production
systems
Economic
database
4
Costs of input
Sale prices
5
Identify
Land-management
Units
Select best land use
Carry out multiple goal optimisation exercise to maximise achievement of the
desired goal
6
For each land-management unit identify:
i. Possible crop(s) or products
ii. Possible production systems
iii. Yield levels for each
iv. Output/input ratio
v. Risks
vi. Environmental impact
LAND USE OPTIONS Part 1: Physical evaluation
Part 2: Socio-economic evaluation

50
unit for evaluation, the rainfall distribution occurring in a farm unit. The model evaluates land on
a dynamic basis i.e., the suitability of a land unit for a particular land use varies with time.
Whenever land is evaluated, current weather, market value and government regulation factors
will be taken into account. In order to build a successful decision support system, it is essential
to know how people make agriculture decisions in the real-world. Also, it is necessary to
identify the specific decision criteria used by them in the whole process of decision-making.
Only after a thorough understanding of the current decision-making process, will it be possible
to suggest improvements.
4.8 Summary
The land use evaluation process is a complex process which demands knowledge and
expertise from many disciplinary experts. Land use evaluation and planning problems require
integration of datasets from various sources using GIS. Expert systems are useful in gathering
the knowledge rules and methods of operation from human land use experts. The proposed
research utilizes FAO framework in solving the land evaluation problem. It aims to give equal
emphasis to physical, economic, social and political factors associated with land. This
approach is significantly different from the traditional ones which require the necessary
information and knowledge beforehand. Farmers or crop advisors use an ad-hoc approach to
solve such land evaluation problems. The knowledge can be from variety of sources that are
related to the planning objectives.

51
CHAPTER 5
LAND EVALUATION AND CROP SUITABILITY ANALYSIS
5.1 Introduction
The aim of this chapter is to present different approaches to land evaluation and to find out an
apt method for evaluating land which can accommodate different type of knowledge types. The
chapter lists the motivations and needs of farmers who would use this expert system and
methodology adopted by crop advisors. The factors used in crop suitability analysis and their
relative importance and two stages involved in the analysis are presented.
5.2 Different approaches to land evaluation
Generic approaches to land evaluation are discussed extensively in the literature (Dent and
Young 1981, McRae and Burnham 1981, McKenzie 1991). The adequacy of different methods
has to be judged in terms of their capability to support whole farm planning or farm level
agricultural land use planning. McRae and Burnham (1981:2-4) classified land evaluation
methods into two major categories, direct and indirect. The direct method is site-specific and
involves choosing a land use for a land unit and documenting the changes thereby adopting a
better land use next time. The indirect land evaluation methods are based on the assumption
that certain land characteristics support a specific land use successfully, and by carefully
observing and comparing land characteristics, similar land units suitable for that land use can
be predicted. Dent and Young (1981:119-120) classified land evaluation approaches into three
types based on the results they produce. They are (i) qualitative, (ii) quantitative physical and
(iii) quantitative economic methods of land evaluation. A qualitative land evaluation method
classifies land units on a relative scale of suitability such as “Highly Suitable”, “Moderately
Suitable” or “Not Suitable” for a specific type of land use. This kind of evaluation is more
generalized as the physical, social and economic factors are not exactly quantified in numerical
terms; hence, it is of little value to land owners and farmers as they would have already known
by their experiences. However, qualitative evaluation plays an essential role in estimating land
suitability and classifying land units at a regional level and it is very helpful for planners and
decision-makers. Alternatively, a quantitative physical evaluation method takes numerical
estimates of production inputs and outputs of farming into consideration while evaluating a farm
unit. The factors such as farm size, crop yields, and fertilizer inputs are quantified for each crop
type and the crop which gives maximum economic returns is selected as the most suitable crop
for the farm unit. It is carried out as a precursor to economic evaluation. The third method,

52
quantitative economic land evaluation adds market factors in terms of profit and loss, for each
kind of land use or crop choice. In this method, environmental, social and political factors are
combined with economic data as a basis for decision-making. Economic land evaluation is
usually carried out before the decisions of land purchases are made and it forms an essential
step in a project management process.
McKenzie (1991:9-13) classifies the approaches to land evaluation into four types based on
their scientific measure, ranging from the least scientific, “trial and error”, to more complex
method such as “process modelling”. The four types include trial and error methods, empirical
methods that rely on transfer-by-analogy, semi-empirical methods and process modelling
methods. Trial and error method of land evaluation is the oldest approach and it is based on
correcting and improving on the past experiences and mistakes (McKenzie 1991:10). This
approach has been widely practised and does not need any scientific information. It consumes
a great deal of time and often it is risky, especially when new land units are tried for the first
time or when new, untried land use types are introduced in a region. In the past, many
programs used the trial and error method of evaluation as scientific soil survey results were
lacking. Another popular approach is the “empirical land evaluation” method which is based on
“transfer-by-analogy” (McKenzie 1991:10) that is similar to the indirect land evaluation method
observed by McRae & Burnham (1981:2-4). This is based on the assumption that if a particular
land unit is capable of supporting a specific land use, by analogy, other land units which have
similar properties should also support that particular land use. The success and reliability of this
method depends on how well the classification methods interpret the analogy between those
land units. Physical measurements such as soil type, texture and other morphological factors
are useful in categorizing the land types and thereby predicting the land capability. However,
such physical measurements are difficult to measure accurately and do not exactly correlate
with the land capability classes. These shortcomings led land resource scientists to develop a
semi-empirical approach to land evaluation (McKenzie 1991:11). In this semi-empirical
approach, a land unit‟s capability to sustain a land use is evaluated by mapping and assessing
soil and land qualities through ground surveys. The most limiting factor determines the land
suitability to support a land use. The reliability of such method of approach is based on the
understanding of physical processes that govern land management process. Finally, “the best
theoretical approach to land evaluation”, (McKenzie 1991:12) the process modelling approach,
attempts to represent the complex relationships between land characteristics and land uses to
predict the land suitability for a land unit. The first three approaches are good examples of
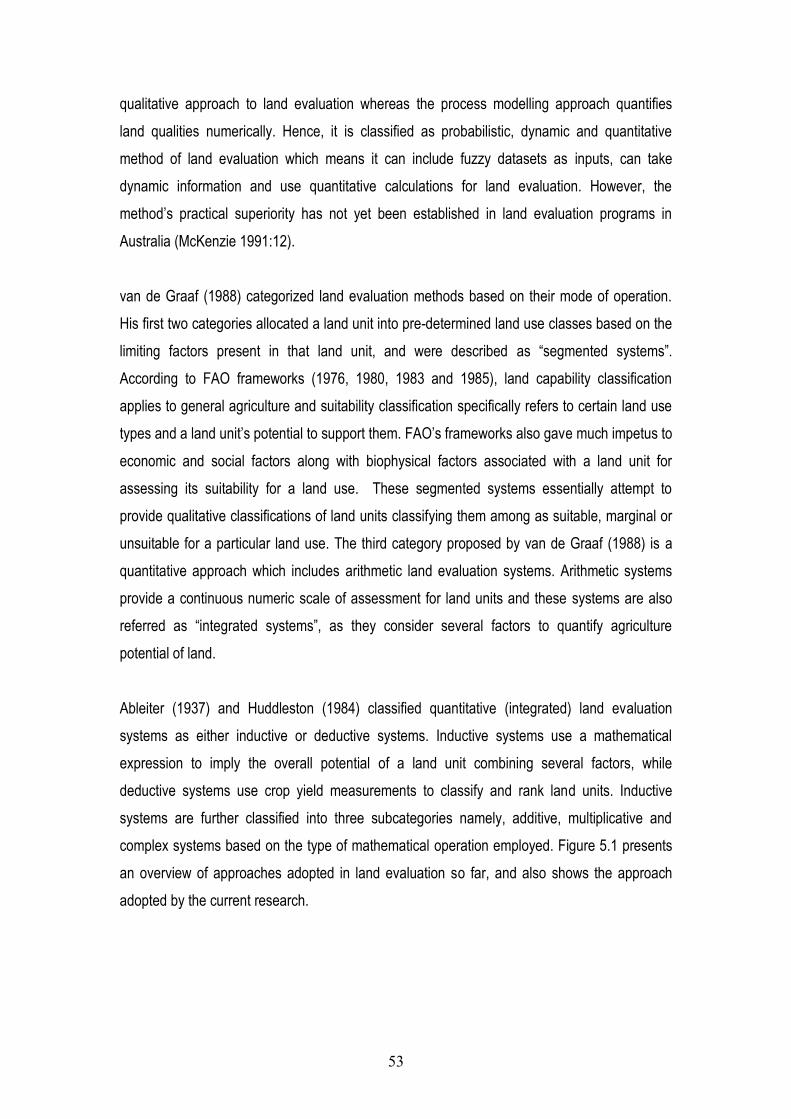
53
qualitative approach to land evaluation whereas the process modelling approach quantifies
land qualities numerically. Hence, it is classified as probabilistic, dynamic and quantitative
method of land evaluation which means it can include fuzzy datasets as inputs, can take
dynamic information and use quantitative calculations for land evaluation. However, the
method‟s practical superiority has not yet been established in land evaluation programs in
Australia (McKenzie 1991:12).
van de Graaf (1988) categorized land evaluation methods based on their mode of operation.
His first two categories allocated a land unit into pre-determined land use classes based on the
limiting factors present in that land unit, and were described as “segmented systems”.
According to FAO frameworks (1976, 1980, 1983 and 1985), land capability classification
applies to general agriculture and suitability classification specifically refers to certain land use
types and a land unit‟s potential to support them. FAO‟s frameworks also gave much impetus to
economic and social factors along with biophysical factors associated with a land unit for
assessing its suitability for a land use. These segmented systems essentially attempt to
provide qualitative classifications of land units classifying them among as suitable, marginal or
unsuitable for a particular land use. The third category proposed by van de Graaf (1988) is a
quantitative approach which includes arithmetic land evaluation systems. Arithmetic systems
provide a continuous numeric scale of assessment for land units and these systems are also
referred as “integrated systems”, as they consider several factors to quantify agriculture
potential of land.
Ableiter (1937) and Huddleston (1984) classified quantitative (integrated) land evaluation
systems as either inductive or deductive systems. Inductive systems use a mathematical
expression to imply the overall potential of a land unit combining several factors, while
deductive systems use crop yield measurements to classify and rank land units. Inductive
systems are further classified into three subcategories namely, additive, multiplicative and
complex systems based on the type of mathematical operation employed. Figure 5.1 presents
an overview of approaches adopted in land evaluation so far, and also shows the approach
adopted by the current research.

54
Figure 5.1 Different approaches to land evaluation including that taken by the current research (Adapted from Shields, Smith & McDonald (1996:13) including that taken by the current
research
5.3 Knowledge based approach to land evaluation
The method adopted in the current research is a mixed, all-in-one, type approach which uses
the positives of the methods mentioned above. The knowledge-based approach involves the
collection and use of knowledge rules that govern land evaluation process. The type of
knowledge rules can be drawn from trial and error methods, empirical studies and process
modelling methods. A variety of qualitative, quantitative and heuristic factors can be translated
into knowledge rules that can be used in the process of land evaluation. As shown in the Figure
5.1, the current approach to land evaluation starts with the results of physical land capability
classification done at a regional scale. A qualitative assessment of physical factors is sufficient
to classify land units on a regional scale. When the land evaluation is done at the farm level,
the physically evaluated land use options are explored from economic, social and political
perspectives to prescribe suitable crop choices for each farm unit. At this stage, quantitative,
qualitative and heuristic knowledge rules can be brought in so that each farm unit is assessed
on these knowledge rules and an appropriate land use or crop is allocated accordingly.
Physical factors
Land Evaluation
Segmented approach
Integrated approach
Land capability classification
Land suitability classification
Deductive systems
Inductive systems
Simulation modelling
Additive
Multiplicative
Complex
(Qualitative)
(Quantitative)
Economic, Social and
Political factors
Approach adopted in the current research

55
5.4 Crop suitability analysis
The problem of crop selection is a historic problem. Some lands possess abundant resources
which can support a diversity of crops. Other lands restrict crop choices. The term “land
capability” defines a land unit‟s ability to support particular land uses, such as agriculture or
forestry and while “land suitability” refers to the land unit‟s ability to support a particular crop
such as wheat, canola or grape (McRae & Burnham 1981:3). Day and Howe (1986) and David
Masscmedt (1993) (both quoted in Shields, Smith & McDonald 1996:11) argue that physical
land characteristics are sufficient to predict the land capability but to assess the land suitability
for a specific crop, other factors such as economic, social and political factors are needed.
There are number of factors or parameters which affect crop choices, which can vary widely
across different geographical regions. The common ones are listed in the Table 5.1 with their
relative influence on the evaluation processes at regional and farm level.

56
Table 5.1 Factors involved in agricultural land evaluation and crop suitability analysis
Physical Factors Does the factor has an influence at
Regional level? Farm level?
Topography Yes Yes
Irrigation availability No Yes
Soil fertility and physical conditions
Yes Yes
Waterlogging / salinity / drainage
Yes Yes
Soil depth / water storage
Yes Yes
Chemical barriers to root growth Yes Yes
Erosion potential Yes Yes
Water quality Yes Yes
Climate and rainfall Yes Yes
Economic Factors
Size and nature of land No Yes
Profitability (Costs/Returns) No Yes
Market Price and Demand for a crop No Yes
Access to Market No Yes
Other factors
Crop Rotation No Yes
Equipment & Labour No Yes
Government policies and restrictions Yes Yes
Environmental factors Yes Yes
Certain physical factors such as topography and climate play a major role in land classification
at the regional level, and they decide the major land use for a region. Other factors such as
market price, market demand for a crop, availability of labour and machinery play a vital role in
deciding a suitable crop for a farm unit. Hence, a two-stage knowledge-based evaluation
approach (see section 5.5) is adopted in the current research to help farmers in selecting a
suitable crop for their land unit.

57
5.5 Procedure for crop suitability analysis
Crop advisors perceive the land evaluation process as a problem-solving activity. They use
their past experience and lessons from past mistakes to suggest crops based on the available
resource conditions. Crop advisors make use of regional soil surveys, land classification results
and suitability maps released by Government agencies (see section 2.5 for more details). Crop
advisors not only base decisions on the current situation, but also consider future trends on
market factors and government policies to suggest a particular crop for a land unit (Ruud,
Huirne & Anderson 2004:234). The current knowledge-based “Crop Advisor” system is being
developed with the help of the Department of Water, Land and Bio-diversity Conservation
(DWLBC), South Australia. The expert system outlined in the current research imitates the
problem-solving approach adopted by a crop advisor and it is designed based on the
knowledge provided by officials at DWLBC. The “Crop Advisor” expert system adopts a
combined land evaluation and crop suitability analysis methodology consisting of two stages of
decision-making (Figure 5.2). The initial stage involves identification of a suitable set of crops
considering physical spatial attributes, and the elimination of crop choices that are not feasible
due to soil and physiographic resources. The second stage involves the user‟s interaction to
identify few suitable crops based on various social, economical and political inputs from the
user. The methodology uses regional spatial datasets in the initial stages, and as it proceeds to
farm level, it uses the inputs from farmers.
Figure 5.2 Stages involved in land evaluation and crop suitability
Selection of feasible crop families
based on physical land evaluation
Elimination of crops those are not
feasible to grow because of water,
climate restrictions
Selection of a suitable crop with
interaction from users
Stage 1
Stage 2
Physical,
Climate factors
Economic,
Social and
Political factors

58
The assessment criteria (see Appendices I, & II for more details) used in the physical
evaluation has been adapted from the DWLBC Guidelines and Methodology for Assessing
Crop Potential (DWLBC 2003a) and other factors used in economic, socio-political evaluation
are gathered from the agricultural experts at DWLBC and from various departments of South
Australian Government. For this research, a crop expert and land evaluator Mr. David
Maschmedt agreed to act as the human expert who provided the knowledge for the
development of the prototype „Crop Advisor‟. The knowledge rules collected by the researcher
were individually verified and checked by Mr. David Maschmedt before they were coded into
the „Crop Advisor‟ system. Whilst the system can be scaled to include multiple experts from
different disciplines, this is beyond the scope of this thesis.
5.6 Summary
The chapter discussed the different type of approaches adopted in land evaluation studies and
discussed the knowledge-based approach adopted in the current research. The chapter listed
the factors used in the land evaluation and crop suitability analysis and their relative importance
to the overall decision-making process. It briefly outlined a two stage plan for agricultural land
evaluation and crop suitability analysis which will be discussed at length in the next chapter.

59
CHAPTER 6
METHODOLOGY
6.1 Introduction
The methodology adopted in this research for developing the “Crop Advisor” expert system, a
knowledge-based, spatial decision support system, is briefly outlined in the present chapter.
The land evaluation process starts from a broad assessment of land resources at a regional
scale and proceeds to the selection of optimal crops that can be grown in a farm unit. As the
land evaluation process is a multi-disciplinary problem, it requires different kinds of knowledge
at various scales. The regional level land evaluation is primarily based on soil and
physiographic data, climate, water availability data and gives a likely indication of feasible crops
that can be grown in a region. It is a rigorous process of elimination of options (crops) that are
not suited for that region. The farm level decision making (refer to Chapter 2 section 2.5 and
2.6) requires the land owner‟s participation and it is an interactive process in which farmers
can choose or omit certain factors that are to be used in the assessment to evaluate crops for
their farm units. Such factors include economic data (market information), climate (average
rainfall in the farm unit), soil physiography, water availability (for irrigated crops), social
considerations and government regulations.
The emphasis of the current research is that a knowledge-based land evaluation model could
accommodate qualitative, quantitative, heuristic assessment factors more efficiently than other
approaches (refer to sections 5.2 and 5.3 for details) of land evaluation. To prove that this
knowledge-based approach works, a proof-of-concept prototype model has been developed.
The types of factors used in the land evaluation process are chosen in such a way that some
factors are qualitative, and classified on a relative scale (low, medium and high), while other
are quantitative, and are numerically quantified (amount of rainfall, market price). Others are of
heuristic type, which is based on human judgements such as the extent of government support
for a crop.
6.2 Physical land evaluation by DWLBC
The purpose of developing this knowledge-based “Crop Advisor” expert system is to help
farmers in choosing an optimal crop that can be grown on their land. Currently, the Department
of Water, Land and Biodiversity Conservation (DWLBC) of South Australia uses soil and
physiographic data to generate crop-wise suitability maps for a region on a mapping scale of

60
1:100,000. These maps were derived by interpreting 1:40,000 scale aerial photographs for
most parts of South Australia. These maps play an important role in strategic land use planning
at regional scale and in making regional level land use decisions. Such regional plans help
farmers to develop their farm-level land use plans. The Department of Water, Land and
Biodiversity Conservation of South Australia has developed an assessment methodology
(DWLBC 2003a) for physical land evaluation which evaluates soil and landscape parameters of
a region to assess its suitability for different crops. This methodology uses soil and landscape
mapping data bases compiled for the agricultural districts of South Australia between 1990 and
2000 (DWLBC 2003b). Each mapped soil landscape unit has been classified with respect to a
range of attributes which affect agricultural land use and thereby crop suitability. These
attributes include susceptibility to waterlogging, acidity, salinity, rockiness and another 31
attributes (see Appendix I for the list of attributes). Each crop has a specific requirement of
these attributes and a criteria table is developed to define these crop requirements in terms of
these attributes (refer to Appendix IV for the criteria developed for assessing canola crop). By
matching the values of these land attributes with the requirements of specific crops, the relative
potential of a particular soil landscape unit to sustain a particular crop can be predicted.
Based on these methods, DWLBC has developed an Arc Macro Language (AML) program that
can be executed in the ArcINFO (ESRI 2005) environment to evaluate soil and landscape data
and subsequently produce a suitability map for a certain crop for any region. Each farm unit is
evaluated based on a number of physical factors such as topography, waterlogging, salinity,
drainage conditions, soil depth, water storage, chemical barriers to root growth, soil fertility, and
erosion potential (refer to Appendix II for more details) to classify the land for its suitability to
grow a particular crop. The land is classified into one of the five classes of suitability, from High
suitability to Low suitability, as shown in Table 6.1. For example, it produces a “potential lands
suitable for olives” map (see Figure 6.1), showing land units under five categories (from highly
suitable to not suitable). The program needs to be executed for every crop to identify whether a
land unit is suitable for that crop. The difficulty with this approach is that a farmer needs to look
at a number of individual crop suitability maps (DWLBC 2003c) (Figures 6.1 and 6.2) to find the
most suited crop. In other words, a farmer may need to execute the program up to 37 different
times to find the best crop suitable for a land unit. A full list of crops grown in South Australian
agriculture districts is presented in Appendix III.
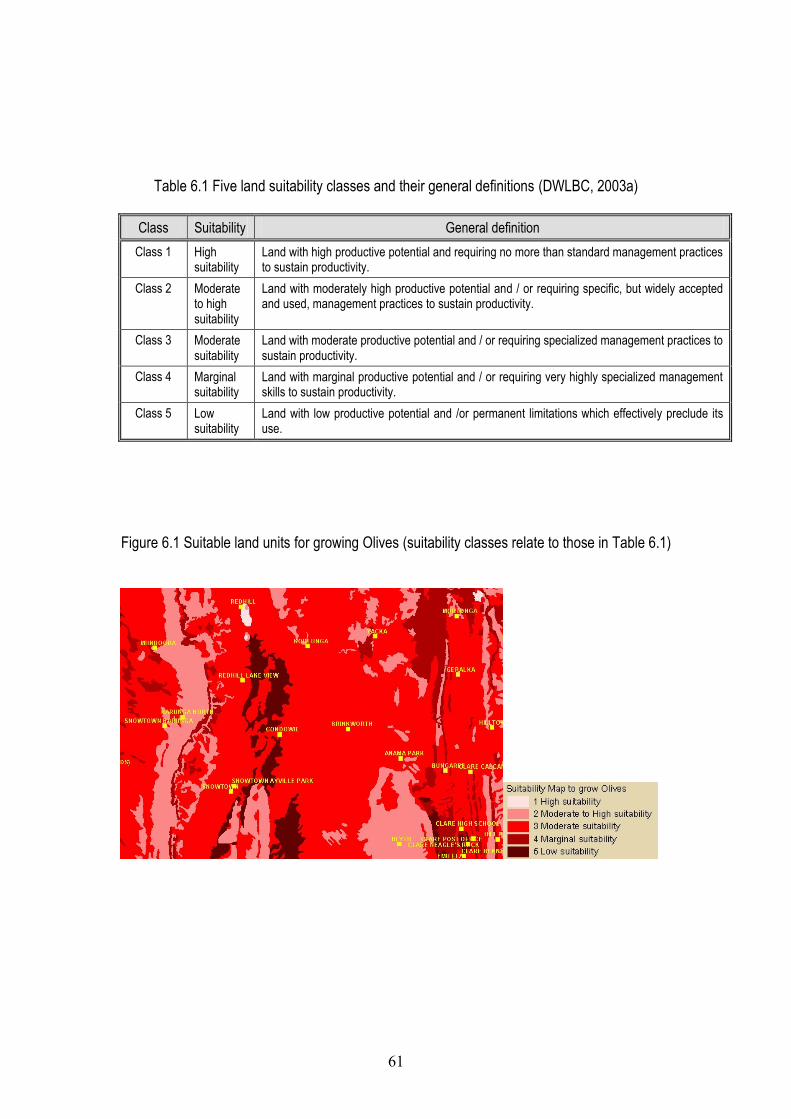
61
Table 6.1 Five land suitability classes and their general definitions (DWLBC, 2003a)
Class Suitability General definition
Class 1 High suitability
Land with high productive potential and requiring no more than standard management practices to sustain productivity.
Class 2 Moderate to high suitability
Land with moderately high productive potential and / or requiring specific, but widely accepted and used, management practices to sustain productivity.
Class 3 Moderate suitability
Land with moderate productive potential and / or requiring specialized management practices to sustain productivity.
Class 4 Marginal suitability
Land with marginal productive potential and / or requiring very highly specialized management skills to sustain productivity.
Class 5 Low suitability
Land with low productive potential and /or permanent limitations which effectively preclude its use.
Figure 6.1 Suitable land units for growing Olives (suitability classes relate to those in Table 6.1)

62
Figure 6.2 Suitable land units for growing Ryegrass (suitability classes relate to those in Table 6.1)
The main purpose of the land suitability assessment program developed by DWLBC is that
they would be useful in regional land use planning and strategic decision-making. The mapping
scale is 1:1, 000,000, which means they will be of little use to farm-level decision making
processes, but since there is no other spatial data available at a mapping scale closer to farm
level, the 1:100,000 scale data is used in the current research. The present knowledge-based
system builds on the existing program to extend its capability to suggest suitable crops that can
be grown in a farm unit. The scale of farm maps that are going to be used is 1:10,000 which
shows demarcated boundaries and survey numbers associated with each farm unit. Using the
land suitability maps developed by DWLBC, the crop families that are not suitable for a farm
unit can be eliminated at the initial level. This elimination is based on the physical land
evaluation done by DWLBC considering only soil and physiographic factors. Hence, the
present “Crop Advisor” knowledge-based system considers additional factors for land
evaluation and crop suitability and uses a non-spatial method, but spatial datasets can be
included in the future.
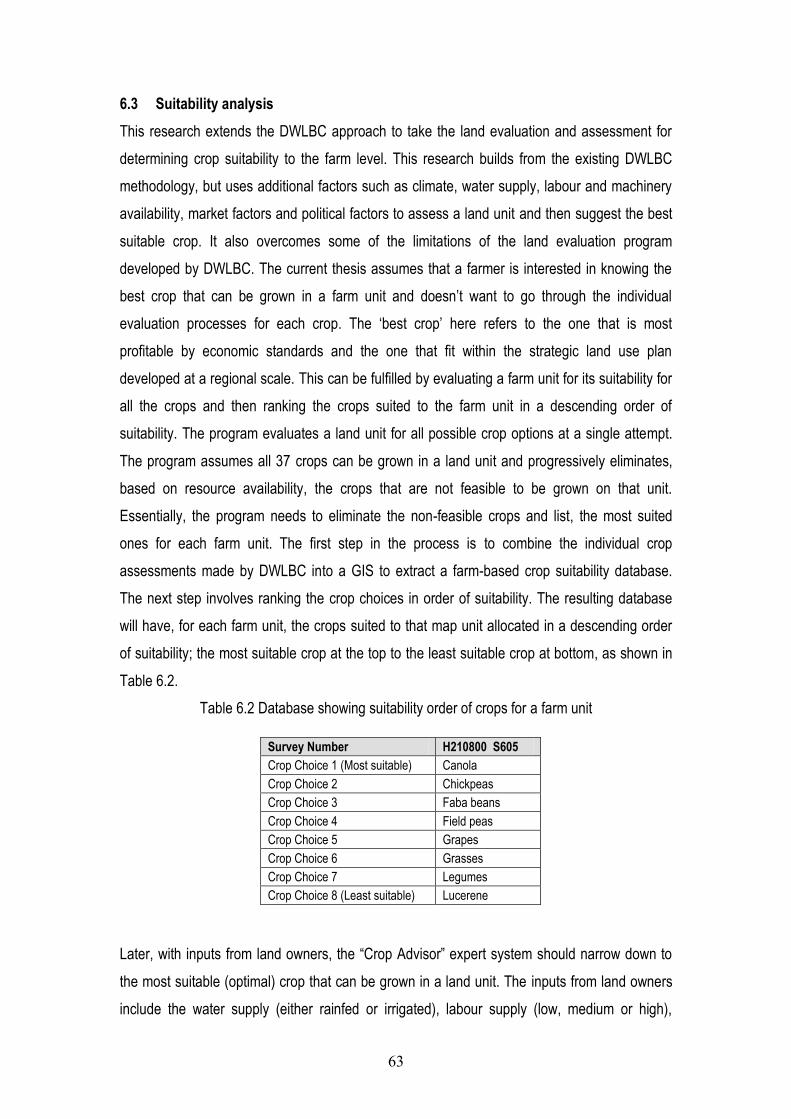
63
6.3 Suitability analysis
This research extends the DWLBC approach to take the land evaluation and assessment for
determining crop suitability to the farm level. This research builds from the existing DWLBC
methodology, but uses additional factors such as climate, water supply, labour and machinery
availability, market factors and political factors to assess a land unit and then suggest the best
suitable crop. It also overcomes some of the limitations of the land evaluation program
developed by DWLBC. The current thesis assumes that a farmer is interested in knowing the
best crop that can be grown in a farm unit and doesn‟t want to go through the individual
evaluation processes for each crop. The „best crop‟ here refers to the one that is most
profitable by economic standards and the one that fit within the strategic land use plan
developed at a regional scale. This can be fulfilled by evaluating a farm unit for its suitability for
all the crops and then ranking the crops suited to the farm unit in a descending order of
suitability. The program evaluates a land unit for all possible crop options at a single attempt.
The program assumes all 37 crops can be grown in a land unit and progressively eliminates,
based on resource availability, the crops that are not feasible to be grown on that unit.
Essentially, the program needs to eliminate the non-feasible crops and list, the most suited
ones for each farm unit. The first step in the process is to combine the individual crop
assessments made by DWLBC into a GIS to extract a farm-based crop suitability database.
The next step involves ranking the crop choices in order of suitability. The resulting database
will have, for each farm unit, the crops suited to that map unit allocated in a descending order
of suitability; the most suitable crop at the top to the least suitable crop at bottom, as shown in
Table 6.2.
Table 6.2 Database showing suitability order of crops for a farm unit
Survey Number H210800 S605
Crop Choice 1 (Most suitable) Canola
Crop Choice 2 Chickpeas
Crop Choice 3 Faba beans
Crop Choice 4 Field peas
Crop Choice 5 Grapes
Crop Choice 6 Grasses
Crop Choice 7 Legumes
Crop Choice 8 (Least suitable) Lucerene
Later, with inputs from land owners, the “Crop Advisor” expert system should narrow down to
the most suitable (optimal) crop that can be grown in a land unit. The inputs from land owners
include the water supply (either rainfed or irrigated), labour supply (low, medium or high),

64
machinery availability (yes or no) for the farm unit which is under consideration. The land owner
has an option of including assessment factors such as government regulations and market
factors (price and demand) in the assessment process.
6.4 Study area
The study area adopted for the current research is Blyth and Clare districts, which fall within the
Central districts of South Australia, shown in the Figure 6.3. It is covered by map sheets 6530
and 6630 of scale 1:100,000 on PIRSA spatial database (PIRSA 2003). The geographical
region of Blyth and Clare has a varying topography of hills and valleys with elevation ranging
from 300 to 500 metres. The rainfall months are predominantly June to September during
winter and spring seasons with generally dry summer months. The soils vary from red to brown
grey and support major crops such as wheat, maize, canola, oilseeds and grapes. A total of
9000 farm units were arbitrarily selected from the study area and the crop choices from
DWLBC physical land evaluation were joined based on their spatial location. For each farm
unit, a group of crop choices (maximum of 20) are assigned on the descending order of their
suitability with most suitable crop as choice 1 and least suitable crop as choice 20.
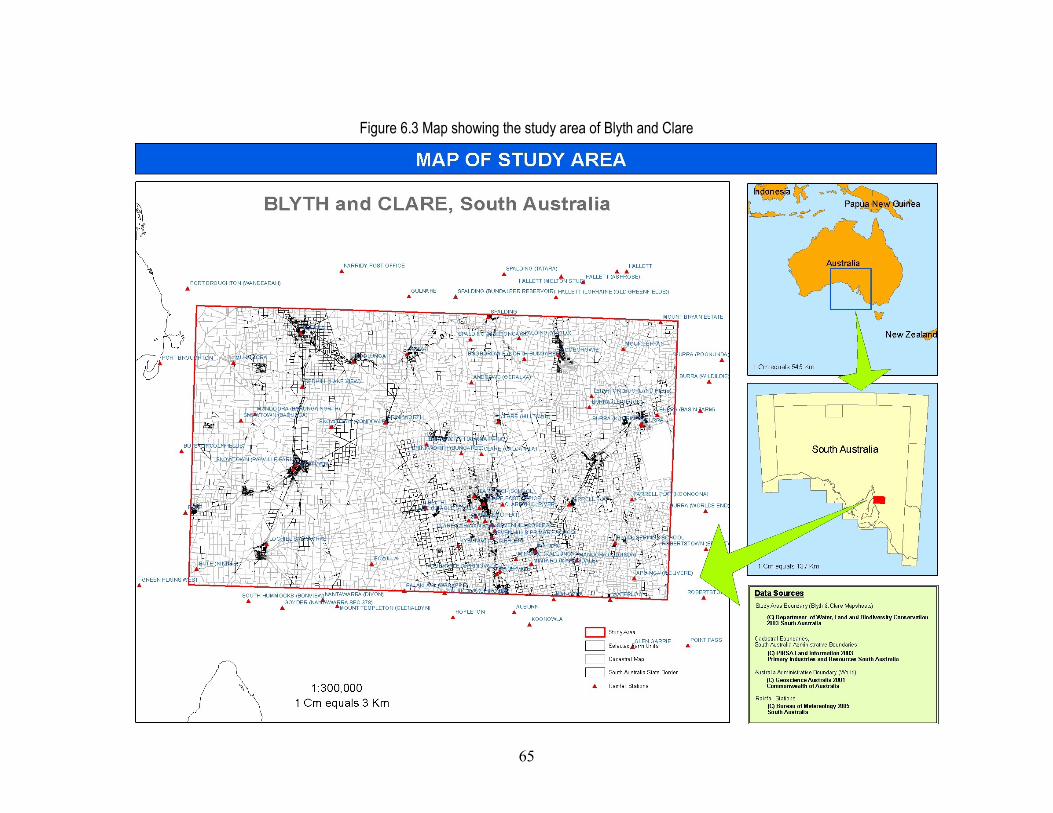
65
Figure 6.3 Map showing the study area of Blyth and Clare

66
6.5 Summary
This chapter discussed the methodology adopted in the current research and how it has been
constructed from the existing DWLBC method of land evaluation and crop suitability. The current
research method significantly varies from the DWLBC approach as the emphasis is placed on the
farm units rather than a region. The importance of a knowledge-based approach is also brought out
in this chapter as the current research follows a non-spatial approach at farm level to find suitable
crops for a farm unit. The study area chosen for the current research is briefly described. The next
chapter will outline the design and specifications of the “Crop Advisor” expert system and will
discuss the factors included in the knowledge-base and their relative importance for land
evaluation and crop suitability analysis.

67
CHAPTER 7
DESIGN AND SPECIFICATIONS
7.1 Introduction
The purpose of the current knowledge-based system is to suggest an optimal agricultural crop best
suited for a land unit based on its potential. The land can be evaluated for its suitability to grow a
particular crop based on a number of parameters. These parameters have been listed in Appendix
I and their degree of influences on crop suitability were analyzed in Chapter 4. Chapter 4 also
briefly explained the user needs and expectations of farmers. In the current chapter, the design
and specifications of the “Crop Advisor” expert system is outlined, covering the system
specifications, data used and target users. The chapter further explores how the knowledge base
is designed and the software tools and application environment used in the development process
of the expert system. The final section of the chapter details the system architecture on which the
expert system is built and how the software tools fit into the architecture.
7.2 Targeted users and data sources
The primary user groups of the current “Crop Advisor” expert system are farmers, agricultural
advisers and land use planners. Other users of the system could include administrators, scientists
and students.
The knowledge base forms a key component of the “Crop Advisor” expert system and lists different
agricultural crops and their resource requirements and thereby defines the criteria for choosing a
suitable crop. The criteria have been developed for each crop by agricultural scientists at DWLBC.
As a part of this current research, additional factors such as social, economic and political factors
needed for crop suitability analysis were determined by consulting experts at DWLBC (see section
7.3) and listed in the form of a criterion table. Various spatial databases such as digital cadastral
maps, soil and landscape maps, rainfall data and physical crop suitability maps were used in
preparing the farm database. The datasets originate from different ground surveys and remote
sensing (satellite observation and aerial photography) methods. For example, the rainfall data is
collected by daily measurements at ground stations and the soil database is prepared by
interpreting remotely sensed images with limited field-level ground observations. The spatial
databases were converted to a database format that is readily usable by the “Crop Advisor” expert
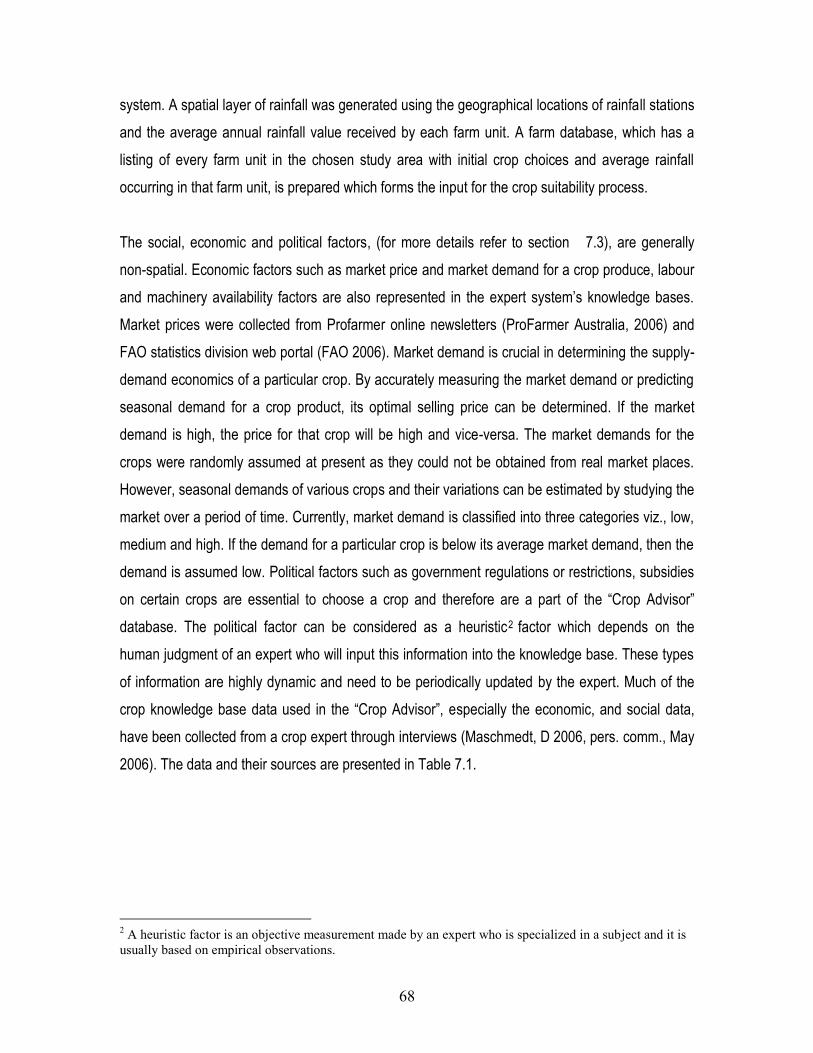
68
system. A spatial layer of rainfall was generated using the geographical locations of rainfall stations
and the average annual rainfall value received by each farm unit. A farm database, which has a
listing of every farm unit in the chosen study area with initial crop choices and average rainfall
occurring in that farm unit, is prepared which forms the input for the crop suitability process.
The social, economic and political factors, (for more details refer to section 7.3), are generally
non-spatial. Economic factors such as market price and market demand for a crop produce, labour
and machinery availability factors are also represented in the expert system‟s knowledge bases.
Market prices were collected from Profarmer online newsletters (ProFarmer Australia, 2006) and
FAO statistics division web portal (FAO 2006). Market demand is crucial in determining the supply-
demand economics of a particular crop. By accurately measuring the market demand or predicting
seasonal demand for a crop product, its optimal selling price can be determined. If the market
demand is high, the price for that crop will be high and vice-versa. The market demands for the
crops were randomly assumed at present as they could not be obtained from real market places.
However, seasonal demands of various crops and their variations can be estimated by studying the
market over a period of time. Currently, market demand is classified into three categories viz., low,
medium and high. If the demand for a particular crop is below its average market demand, then the
demand is assumed low. Political factors such as government regulations or restrictions, subsidies
on certain crops are essential to choose a crop and therefore are a part of the “Crop Advisor”
database. The political factor can be considered as a heuristic2 factor which depends on the
human judgment of an expert who will input this information into the knowledge base. These types
of information are highly dynamic and need to be periodically updated by the expert. Much of the
crop knowledge base data used in the “Crop Advisor”, especially the economic, and social data,
have been collected from a crop expert through interviews (Maschmedt, D 2006, pers. comm., May
2006). The data and their sources are presented in Table 7.1.
2 A heuristic factor is an objective measurement made by an expert who is specialized in a subject and it is
usually based on empirical observations.
69
Table 7.1 Datasets used in the research and their sources
Data Specifications Year of Publication
Agency / Custodian
Crop suitability maps based on soil and physiographic evaluation
Blyth and Clare region; Map sheets 2003 Department of Water, Land and Biodiversity Conservation, South Australia (DWLBC)
Land use land cover map Blyth and Clare region; Map sheets 2003 DWLBC
Digital Cadastral Database Farm units with survey number 2003 Department for Environment and Heritage, Government of South Australia
Meteorological Stations South Australian rainfall station locations 2005 Bureau of Meteorology, South Australia
Temperature and Rainfall Rainfall stations (Point data) covering the study area
2005 SILO, Bureau of Meteorology, http://www.bom.gov.au/silo
Water availability Surface, Groundwater, Pipelines 2003 PIRSA Land Information Primary Industries and Resources South Australia
Market information Market prices in A$ per Tonne 2005-06 FAO, Profarmer Newsletters
Crop knowledge base Collected by interviewing expert 2006 DWLBC (See Table 7.2)
Administrative boundaries –Australia, South Australia
2001, 2003 PIRSA Land Information Primary Industries and Resources South Australia, Geoscience Australia
7.3 Knowledge engineering for “Crop Advisor” expert system
Through years of experience in conducting soil surveys and land evaluation in South Australia,
land use experts at DWLBC have developed a body of knowledge that can be used in land
evaluation and crop suitability analysis. The knowledge that is used in the current research has
been assembled by interviewing experts, using published reports and from the Internet. Primarily,
the knowledge base for the “Crop Advisor” contains the conditional requirements of each crop
choice, and how a factor decides crop suitability for a farm unit. The conditional requirements relate
to crop water requirements – average rainfall or irrigated water, labour inputs -low, medium or high,
machinery requirement for cultivating a crop -required or not required, market factors -market price,
demand for a crop and government support for a crop -favourable or not favourable. The values for
each factor are just representative only as in some cases, a factor can have more than two or three
categories. For example, the Machinery requirement could be classified into Low, Medium and
High requirements instead of „required‟ or „not-required‟ classes. As this research involved the

70
development of a prototype model, simple classes were used. These knowledge rules are defined
in Table 7.2. The advantage of a table format is that it is very easy to verify, modify and update the
knowledge base.
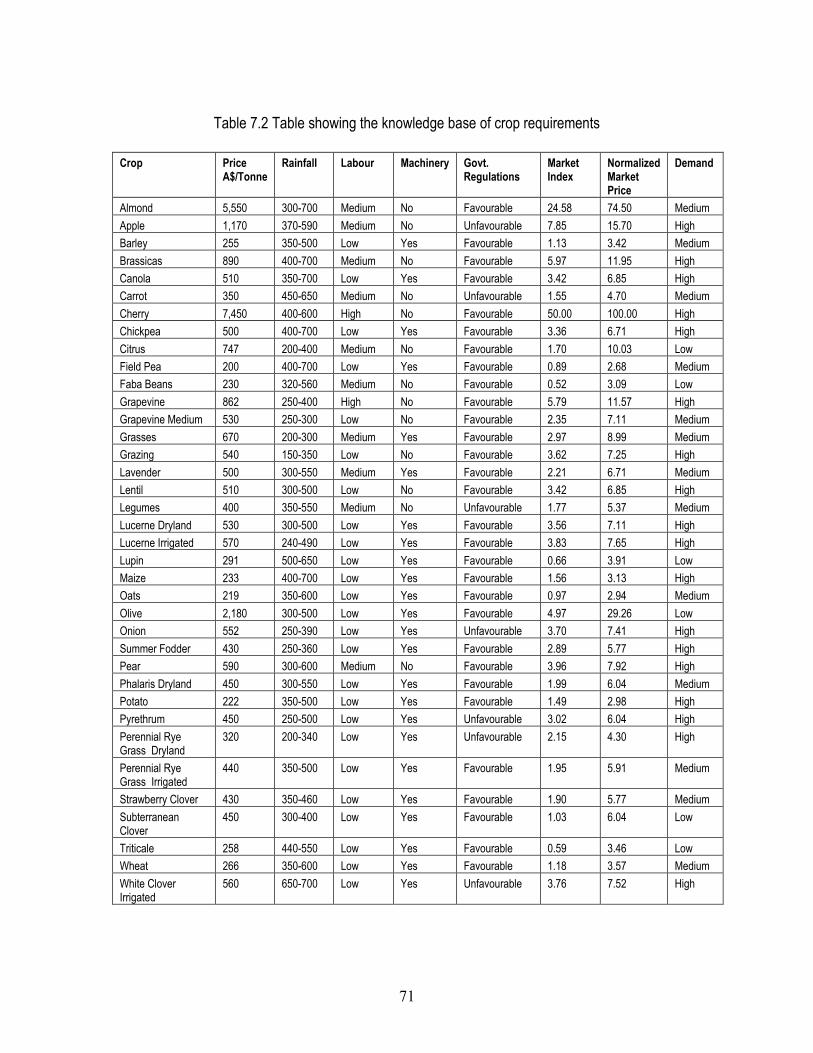
71
Table 7.2 Table showing the knowledge base of crop requirements
Crop Price
A$/Tonne Rainfall Labour Machinery Govt.
Regulations Market Index
Normalized Market Price
Demand
Almond 5,550 300-700 Medium No Favourable 24.58 74.50 Medium
Apple 1,170 370-590 Medium No Unfavourable 7.85 15.70 High
Barley 255 350-500 Low Yes Favourable 1.13 3.42 Medium
Brassicas 890 400-700 Medium No Favourable 5.97 11.95 High
Canola 510 350-700 Low Yes Favourable 3.42 6.85 High
Carrot 350 450-650 Medium No Unfavourable 1.55 4.70 Medium
Cherry 7,450 400-600 High No Favourable 50.00 100.00 High
Chickpea 500 400-700 Low Yes Favourable 3.36 6.71 High
Citrus 747 200-400 Medium No Favourable 1.70 10.03 Low
Field Pea 200 400-700 Low Yes Favourable 0.89 2.68 Medium
Faba Beans 230 320-560 Medium No Favourable 0.52 3.09 Low
Grapevine 862 250-400 High No Favourable 5.79 11.57 High
Grapevine Medium 530 250-300 Low No Favourable 2.35 7.11 Medium
Grasses 670 200-300 Medium Yes Favourable 2.97 8.99 Medium
Grazing 540 150-350 Low No Favourable 3.62 7.25 High
Lavender 500 300-550 Medium Yes Favourable 2.21 6.71 Medium
Lentil 510 300-500 Low No Favourable 3.42 6.85 High
Legumes 400 350-550 Medium No Unfavourable 1.77 5.37 Medium
Lucerne Dryland 530 300-500 Low Yes Favourable 3.56 7.11 High
Lucerne Irrigated 570 240-490 Low Yes Favourable 3.83 7.65 High
Lupin 291 500-650 Low Yes Favourable 0.66 3.91 Low
Maize 233 400-700 Low Yes Favourable 1.56 3.13 High
Oats 219 350-600 Low Yes Favourable 0.97 2.94 Medium
Olive 2,180 300-500 Low Yes Favourable 4.97 29.26 Low
Onion 552 250-390 Low Yes Unfavourable 3.70 7.41 High
Summer Fodder 430 250-360 Low Yes Favourable 2.89 5.77 High
Pear 590 300-600 Medium No Favourable 3.96 7.92 High
Phalaris Dryland 450 300-550 Low Yes Favourable 1.99 6.04 Medium
Potato 222 350-500 Low Yes Favourable 1.49 2.98 High
Pyrethrum 450 250-500 Low Yes Unfavourable 3.02 6.04 High
Perennial Rye Grass Dryland
320 200-340 Low Yes Unfavourable 2.15 4.30 High
Perennial Rye Grass Irrigated
440 350-500 Low Yes Favourable 1.95 5.91 Medium
Strawberry Clover 430 350-460 Low Yes Favourable 1.90 5.77 Medium
Subterranean Clover
450 300-400 Low Yes Favourable 1.03 6.04 Low
Triticale 258 440-550 Low Yes Favourable 0.59 3.46 Low
Wheat 266 350-600 Low Yes Favourable 1.18 3.57 Medium
White Clover Irrigated
560 650-700 Low Yes Unfavourable 3.76 7.52 High
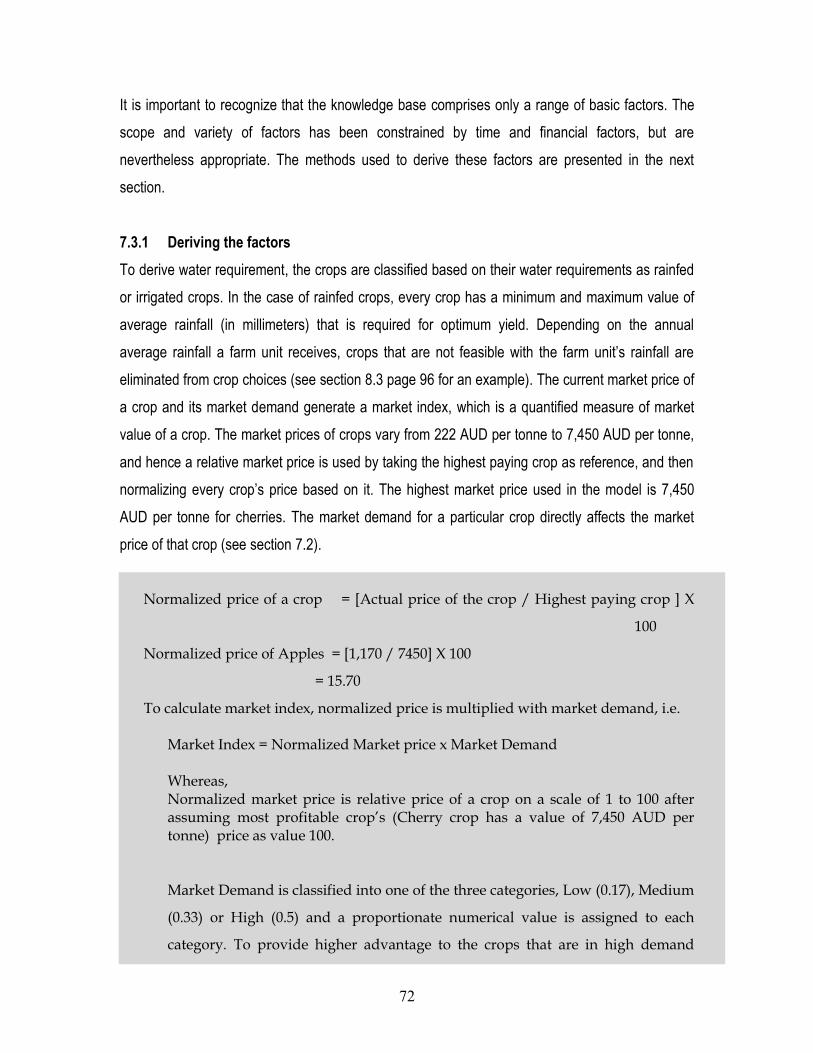
72
It is important to recognize that the knowledge base comprises only a range of basic factors. The
scope and variety of factors has been constrained by time and financial factors, but are
nevertheless appropriate. The methods used to derive these factors are presented in the next
section.
7.3.1 Deriving the factors
To derive water requirement, the crops are classified based on their water requirements as rainfed
or irrigated crops. In the case of rainfed crops, every crop has a minimum and maximum value of
average rainfall (in millimeters) that is required for optimum yield. Depending on the annual
average rainfall a farm unit receives, crops that are not feasible with the farm unit‟s rainfall are
eliminated from crop choices (see section 8.3 page 96 for an example). The current market price of
a crop and its market demand generate a market index, which is a quantified measure of market
value of a crop. The market prices of crops vary from 222 AUD per tonne to 7,450 AUD per tonne,
and hence a relative market price is used by taking the highest paying crop as reference, and then
normalizing every crop‟s price based on it. The highest market price used in the model is 7,450
AUD per tonne for cherries. The market demand for a particular crop directly affects the market
price of that crop (see section 7.2).
Normalized price of a crop = [Actual price of the crop / Highest paying crop ] X
100
Normalized price of Apples = [1,170 / 7450] X 100
= 15.70
To calculate market index, normalized price is multiplied with market demand, i.e. Market Index = Normalized Market price x Market Demand Whereas, Normalized market price is relative price of a crop on a scale of 1 to 100 after assuming most profitable crop’s (Cherry crop has a value of 7,450 AUD per tonne) price as value 100. Market Demand is classified into one of the three categories, Low (0.17), Medium
(0.33) or High (0.5) and a proportionate numerical value is assigned to each
category. To provide higher advantage to the crops that are in high demand

73
(hence, more profitable), a market demand factor is introduced. Market Demand
factor is obtained by proportionately representing the three categories of market
demand that is equivalent to a total value of 100. When, the value of 100 is
proportionately divided into three classes, 50%, 33% and 17% represent for High,
Medium and Low market demand categories. When they are converted to an
equivalent of 1, they represent 0.5, 0.33 and 0.17 as shown below.
Class Weightage Value
Low 17% 0.17
Medium 33% 0.33
High 50% 0.50
Total 100% 1.00
The highest value of market index can be 50 (if a normalized market price of 100
and 0.5 for “High” market demand are considered), and hence the Market Index
can vary from 1 to 50. For example, Apples relative price compared to Cherries is
15.70 and its demand in market is classified as “High”, and hence Market Index
for apples is obtained by multiplying 15.70 and 0.5 that gives 7.85 (on a scale of 1
to 50)
The labour requirements for a crop are represented qualitatively as low, medium and high. Here,
an element of expert judgment is taken into account for setting the limits of these classes in the
knowledge base. Another factor which heavily depends on human judgment is the level of
government support for a crop. It is classified as either favoured or unfavoured. This factor is
related to the role of government in providing assistance to farmers, such as tax incentives, tax
breaks, domestic and international price support policies and regulations, and other relevant
restrictions determined by the government. By selecting „unfavourable‟ for government support, the
user can determine which crops (out of the suitable crop choices) are not favoured by government
policies at the moment.

74
7.4 System properties
The following set of properties is the desired requirements of the “Crop Advisor” expert system.
The objective has been to develop a set of properties for the “Crop Advisor” expert system so that
it can be:
1. Comprehensive. The expert system should evaluate a farm unit for its ability to grow all of the 37
selected crops (refer to Appendix III), eliminate non-feasible crop choices and to suggest a list of
optimal crops suited for that farm unit. This comprehensive approach is necessary in order to
simplify the crop selection process, analyze the problem from a farmer‟s perspective and consider
individual farms as decision-making units.
2. Up-to-date. As the process of land evaluation demands knowledge from various sources, the
knowledge-bases need to be kept up-to-date. It calls for a database structure which can be easily
editable and which would allow network-based updating possibility. This capability would enable
future development where the databases can reside at different places and the expert system can
access them through network connections.
3. Interactive. The crucial part of the expert system lies in providing easy interaction for the end-
users (farmers and land owners) with a Graphical User Interface (GUI). The Graphical User
Interface has been designed to be aesthetically simple, clutter-free and easy-to-use. Help and tips
for operation of every aspect of the expert system have been embedded within the user interface.
7.5 Development environment and software tools
The “Crop Advisor” expert system is developed using Microsoft Visual Basic 6.0 (Microsoft 2005),
Microsoft Access 2002 (Microsoft 2002) and ArcGIS 9.1 (ESRI 2005) software. Visual Basic 6.0 is
part of Microsoft Visual Studio (Microsoft 2005) which is an integrated development environment to
enable programmers to create programs and software applications that run on computers with
Microsoft Windows Operating Systems. Pre-built GUI tools can be simply added to develop an
application without writing numerous lines of programming code to describe the appearance and
location of interface elements. The "Basic" part of Visual Basic refers to the BASIC (Beginners All-
Purpose Symbolic Instruction Code) language, a language used by more programmers than any

75
other language. Visual Basic has evolved from the original BASIC language and now contains
several hundred statements, functions, and keywords, many of which relate directly to the
Windows GUI applications. The finished software application can be converted to an executable
(.exe) file and freely distributed to anyone who can run the program on a Windows based Personal
Computer. The system requirements to run the “Crop Advisor” expert system are mentioned in
section 8.2 and a standard Windows Personal Computer with no specialized software is sufficient
for executing the expert system. Microsoft Access 2002 is the database management tool used in
building the “Crop Advisor” expert system.
MS Access 2002 is a relational database management system which combines the relational
Microsoft Jet Database Engine with a graphical user interface. Microsoft defines a typical access
database as a “collection of data and objects, such as tables, queries, or forms, related to a
particular topic or purpose” (Microsoft 2002: Help Manual). A database in MS Access can have a
number of tables in which data are stored in rows and columns. With a programming language
such as Visual Basic (VB), software applications can be developed with MS Access for managing
databases. MS Access offers Open Data Base Connectivity (ODBC), a standard database access
method, which enables a programming language like Visual Basic to access data from any
application, regardless of which database management system (DBMS) is handling the data. It
manages this by establishing a middle layer, called a database driver, which communicates
between an application and the DBMS. The purpose of the database driver is to translate queries
(data requests, for example from farmers) from the application into commands that the DBMS
understands. Visual Basic and MS Access are ODBC-compliant – the application developed using
Visual Basic is capable of issuing ODBC commands and the DBMS in this case, MS Access, is
capable of responding to the commands. There are two tables contained in the MS Access
database (See Figure 7.1), viz.,
(i) Farm database which has the farm records and initial crop choices that resulted from
physical land evaluation and average rainfall for that farm unit and
(ii) Crop database which has a list of crops and their individual requirements (criteria) for
different factors such as labour and machinery requirements.
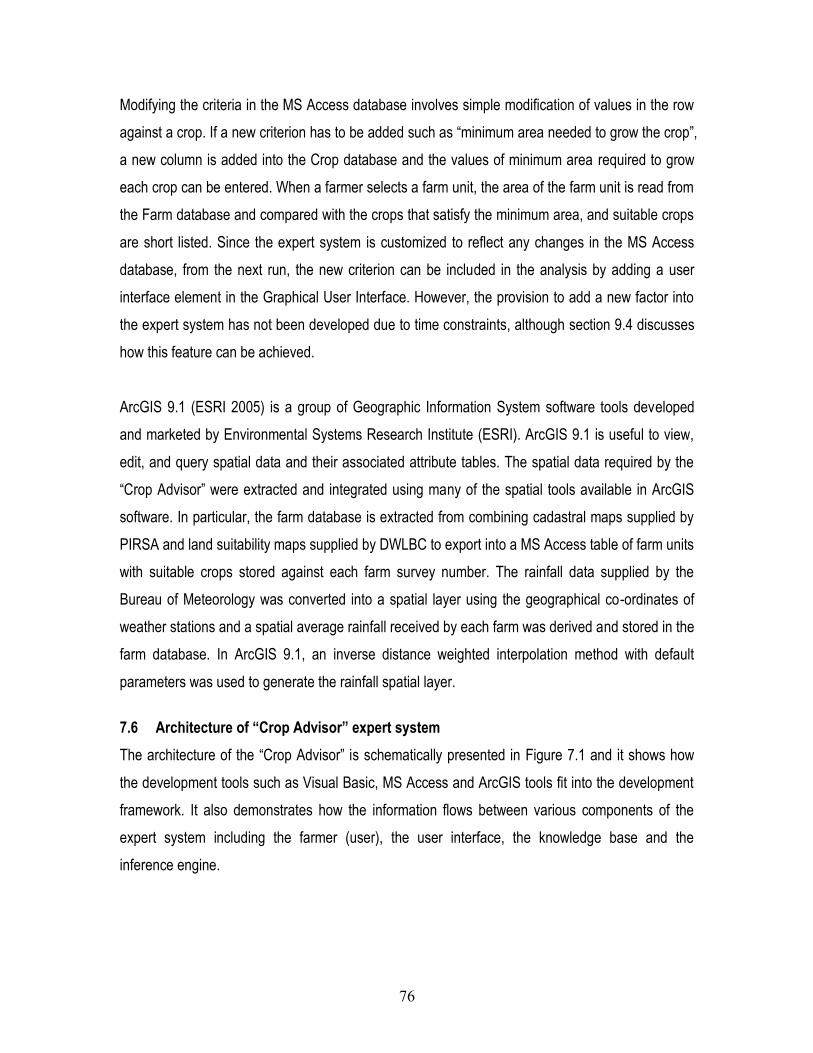
76
Modifying the criteria in the MS Access database involves simple modification of values in the row
against a crop. If a new criterion has to be added such as “minimum area needed to grow the crop”,
a new column is added into the Crop database and the values of minimum area required to grow
each crop can be entered. When a farmer selects a farm unit, the area of the farm unit is read from
the Farm database and compared with the crops that satisfy the minimum area, and suitable crops
are short listed. Since the expert system is customized to reflect any changes in the MS Access
database, from the next run, the new criterion can be included in the analysis by adding a user
interface element in the Graphical User Interface. However, the provision to add a new factor into
the expert system has not been developed due to time constraints, although section 9.4 discusses
how this feature can be achieved.
ArcGIS 9.1 (ESRI 2005) is a group of Geographic Information System software tools developed
and marketed by Environmental Systems Research Institute (ESRI). ArcGIS 9.1 is useful to view,
edit, and query spatial data and their associated attribute tables. The spatial data required by the
“Crop Advisor” were extracted and integrated using many of the spatial tools available in ArcGIS
software. In particular, the farm database is extracted from combining cadastral maps supplied by
PIRSA and land suitability maps supplied by DWLBC to export into a MS Access table of farm units
with suitable crops stored against each farm survey number. The rainfall data supplied by the
Bureau of Meteorology was converted into a spatial layer using the geographical co-ordinates of
weather stations and a spatial average rainfall received by each farm was derived and stored in the
farm database. In ArcGIS 9.1, an inverse distance weighted interpolation method with default
parameters was used to generate the rainfall spatial layer.
7.6 Architecture of “Crop Advisor” expert system
The architecture of the “Crop Advisor” is schematically presented in Figure 7.1 and it shows how
the development tools such as Visual Basic, MS Access and ArcGIS tools fit into the development
framework. It also demonstrates how the information flows between various components of the
expert system including the farmer (user), the user interface, the knowledge base and the
inference engine.
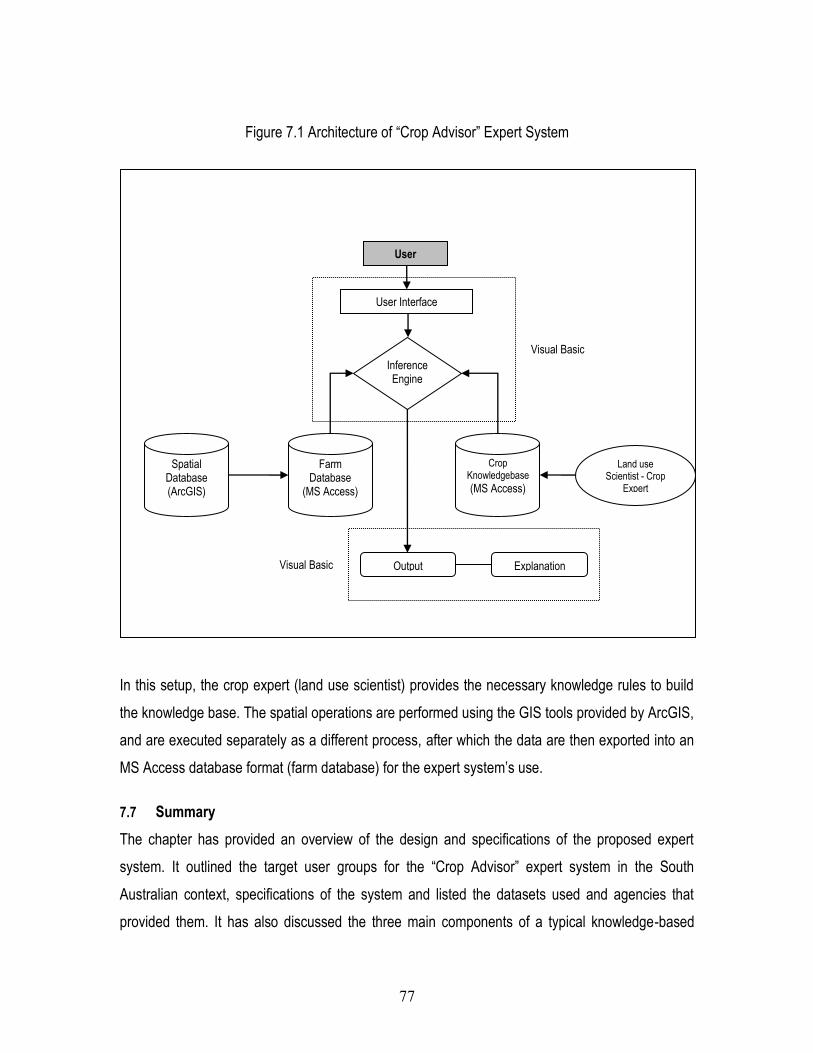
77
Figure 7.1 Architecture of “Crop Advisor” Expert System
In this setup, the crop expert (land use scientist) provides the necessary knowledge rules to build
the knowledge base. The spatial operations are performed using the GIS tools provided by ArcGIS,
and are executed separately as a different process, after which the data are then exported into an
MS Access database format (farm database) for the expert system‟s use.
7.7 Summary
The chapter has provided an overview of the design and specifications of the proposed expert
system. It outlined the target user groups for the “Crop Advisor” expert system in the South
Australian context, specifications of the system and listed the datasets used and agencies that
provided them. It has also discussed the three main components of a typical knowledge-based
Spatial Database (ArcGIS)
Farm Database
(MS Access)
Crop Knowledgebase
(MS Access)
Land use Scientist - Crop
Expert
Output
Explanation
Inference Engine
User
User Interface
Visual Basic
Visual Basic

78
expert system and explained how the knowledge-base for “Crop Advisor” expert system was
developed. Finally, the development environment, software tools used and the architecture of the
expert system were defined. The next chapter discusses how the expert system functions to
achieve land evaluation and presents a step-by-step approach to illustrate how a farm unit is
assessed by the “Crop Advisor” to determine suitable crops for it.

79
CHAPTER 8
TESTING AND FEEDBACK
8.1 Introduction
Previous chapters have discussed the methodology involved in the process of crop suitability
analysis and design and specifications of the “Crop Advisor” expert system. The current chapter
describes the functioning of the expert system, various options available with the expert system
with screenshots. Considering a farm unit as a case study, the working of “Crop Advisor” expert
system is illustrated in a step-by-step process. It then proceeds to test the expert system by
validating the recommendations given by the expert system. It lists the feedback received from its
early use in a controlled software testing environment.
8.2 Functioning of “Crop Advisor” expert system
A standard Windows Personal Computer is essential to install and execute the “Crop Advisor”
expert system. The system requirements for using the “Crop Advisor” expert system include a
Windows operating system, 128 Megabytes of RAM (Random Access Memory), 10 Megabytes of
free disk space and a monitor with at least 800 by 600 pixels resolution. Figure 8.1 shows the user
interface when the “Crop Advisor” expert system is initialized.

80
Figure 8.1 Main screen of “Crop Advisor” expert system
The user has the option of typing the “Survey number” (circle 1 in Figure 8.1) of the farm unit which
is under evaluation or alternatively the survey number can be selected using the drop-down menu.
As soon as a farm unit is selected, the live crop choices appear at the right side window (circle 2 in
Figure 8.1) which is based on the physical land evaluation done by DWLBC (See section 6.2 for
more details). The other input required is the previous crop (or the current crop) that is grown on
the farm unit (circle 3 in Figure 8.1) to avoid cultivating same crop again. The previous year‟s crop
affects the productivity of a farm unit. Crop advisors suggest farmers avoid repeating the cultivation
of the same crop consecutively for various reasons that include loss of soil nutrients and continuing
pest life cycle. Crop rotation3 is a process in which different crops are cultivated on a rotational
basis to refurbish soil nutrients and to break the pest life cycle. However, although advice would be
given to avoid the previous crop grown on the farm unit, it will appear in the final list of suitable crop
3 Crop rotation – alternating between crops - is not widely practised in developing countries and this might
be one of the reasons why farm productivity declines over time.
1
3 2

81
choices, with a note to alert the user, such as “You have already grown the crop wheat in the
previous season”. Hence, the user has an option to compare their choice (previous or current
grown) with the choices suggested by the “Crop Advisor” expert system. The factors for water
availability, labour supply, machinery availability and government support are available for
assessment by the “Crop Advisor” and their use by the farmer is purely optional. The user of the
“Crop Advisor” expert system can include or exclude any combination of available factors and the
resulting crop choices can be observed on the right-hand side of the user interface under Live Crop
Choices4 (circle 3 in Figure 8.2).
4 They are called ‘Live Crop Choices’ because, the choices change dynamically as the user selects the
inputs.

82
Figure 8.2 Executing “Crop Advisor” expert system to get suitable crops
The important point to stress is that the user actually decides which factors need to be taken into
consideration by the assessment procedure and chooses options for each factor. When all the
choices are made, the user can include „Market Index‟ to take market price and market demand
into account. When the „Evaluate‟ button is pressed, final suitable crop choices appear under
“Suitable Crops” (circle 5 in Figure 8.2). The three most suitable crops for the farm unit are
presented in descending order of suitability.
Some combination of user inputs can result in zero crop choices. If there are insufficient crop
choices available to proceed for further assessment, a reminder appears in the “Messages” box
(circle 5 in Figure 8.2) which suggests that the user change the options or inputs. For example, if
the user selects labour supply as “Low” and resulting crop choices are zero, then the choice for the
labour supply may be changed to “Medium” or “High”.
3
4
4
6
5 5
7

83
The explanation subsystem is part of the “Crop Advisor” expert system. Each factor is associated
with a “?” button (for example, circle 4 in Figure 8.2) which gives further details on that factor and
provides a description for the user, by clicking on the “?” button. At the end of evaluation, a
message appears to remind the user of the factors that have been used in the process of crop
suitability assessment (see circle 6 in Figure 8.2).
The current or previous crop grown by the farmer is highlighted underneath the crop choices with a
special message – saying that the user has already grown the crop previously - (see circle 7 in
Figure 8.2). This also reminds the user how the previous season‟s crop fares in the evaluation and
crop suitability analysis. If the current crop comes in top of the table, then it is understood that the
crop that is grown need not be changed unless the farmer wishes to change. It is a good way to
check if the current crop choice for a farm unit is the best choice after considering the physical,
economic and social factors associated with the farm unit. When the user wants to know more
about the “Crop Advisor” expert system and the developers of the system, the “About Crop
Advisor” button brings a “splash screen” 5 which lists the contributors who have helped in the
various stages of development (see Figure 8.3).
Figure 8.3 “Crop Advisor” Splash screen
5 A splash screen usually provides information of software, developer and people who have contributed to
the development and copyright warnings.

84
8.3 Farm assessment: an illustrated example
To illustrate how the “Crop Advisor” expert system analyses and prescribes optimal crops for a
farm unit; a case study is presented below.
The initial crop choices resulting from physical land evaluation based on physiographic and soil
landscape parameters for the farm unit which has a survey number “H210800 S605” are listed in
the Table 8.1. The expert system directly accesses the farm database and pulls out the survey
number and its associated record showing crops suitable for that farm unit and average annual
rainfall (in millimeters) received by the farm. The crop choices are represented in the form of codes
to enable easy processing by the expert system and the equivalent crop names are available in the
crop database.
Table 8.1 Farm table showing initial crop choices after physical land evaluation by DWLBC
DCDB_ID H210800 S605 Crop Names
CHOICE1 BARLEY Barley
CHOICE2 BRASSICA Brassicas
CHOICE3 CANOLA Canola
CHOICE4 CHICKPEA Chickpeas
CHOICE5 FABA_BEA Faba beans
CHOICE6 FIELD_PE Field peas
CHOICE7 GRASSES Grasses
CHOICE8 GRAZING Grazing
CHOICE9 LEGUMES Lentil
CHOICE10 LUCERNE_D Lucerne Dryland
CHOICE11 LUCERNE_I Lucerne Irrigated
CHOICE12 MAIZE Maize
CHOICE13 PASTURE Summer Fodder
CHOICE14 PHALARIS Phalaris Dryland
CHOICE15 RYEGRASS_D Perennial Ryegrass Dryland

85
CHOICE16 RYEGRASS_I Perennial Ryegrass Irrigated
CHOICE17 ST_CLOVE Strawberry Clover
CHOICE18 TRITICAL Triticale
CHOICE19 WHEAT Wheat
CHOICE20 Not available Not available
Rain 483 (mm)
The next step chooses the current crop grown in the farm unit. It is assumed for the case study that
the farmer chooses “Strawberry Clover”. Next, the farmer has to choose the water availability for
the farm unit - whether the farm unit depends on rainfall or irrigated water for agriculture. If the
choice is “Rainfed”, the average annual rainfall of the farm unit is taken and the crops which can be
sustained with that rainfall amount are short listed. If the choice is “Irrigated”, then the crops which
are profitable with irrigation cost and expenses are suggested. In the present example, the farmer
chooses “Rainfed” for the water availability option, which causes crops which require irrigation to
be eliminated and crops which can be grown with the farm unit‟s rainfall are listed on the “Crop
Advisor” screen and theses are shown in Table 8.2.
Table 8.2 Elimination of crop choices based on rainfall
DCDB_ID H210800 S605 Status
CHOICE1 BARLEY Barley
CHOICE2 BRASSICA Brassicas
CHOICE3 CANOLA Canola
CHOICE4 CHICKPEA Chickpeas
CHOICE5 FABA_BEA Faba beans
CHOICE6 FIELD_PE Field peas
CHOICE7 GRASSES Eliminated (Needs Irrigation)
CHOICE8 GRAZING Eliminated (Too much Rainfall)
CHOICE9 LEGUMES Lentils
CHOICE10 LUCERNE_D Lucerne Dryland
CHOICE11 LUCERNE_I Eliminated (Needs Irrigation)

86
CHOICE12 MAIZE Maize
CHOICE13 PASTURE Eliminated (Too much Rainfall)
CHOICE14 PHALARIS Phalaris Dryland
CHOICE15 RYEGRASS_D Eliminated (Too much Rainfall)
CHOICE16 RYEGRASS_I Eliminated (Needs Irrigation)
CHOICE17 ST_CLOVE Strawberry Clover
CHOICE18 TRITICAL Triticale
CHOICE19 WHEAT Wheat
Each crop has a specific lower and upper limit of rainfall that is required to reach its optimal crop
production. The average rainfall received by the farm unit should be more than the minimum
rainfall (lower limit) required by the crop. The crops which require more rainfall than the average
rainfall received by the farm unit are eliminated by “Crop Advisor”. The farm unit‟s rainfall should
not exceed the maximum amount of rainfall (upper limit) that can be required by a crop. Too much
rainfall may diminish the crop yield and may not give optimal outputs. For example, if a farm unit
receives an average of 400mm rainfall and a crop has lower and upper limits of rainfall
requirements as 300 and 500mm respectively, then the farm unit will sustain the crop. In this case,
the rainfall limits required by “Dryland Ryegrass” is 200 to 340 mm and the farm unit‟s average
rainfall, 483 mm exceeds the upper limit of the crop – so, it would result in decreased crop
efficiency. Hence, “Dryland Ryegrass” is dropped from the list by the “Crop Advisor” inference
engine.
The next step for the user is to enter the amount of available labour for the farm unit. “Crop
Advisor” provides three options – low, medium and high. In the case study, the user chooses low
labour and the crops that require high and medium labour supply are eliminated from the crop
choices. Those crops that remain as options are shown in Table 8.3.
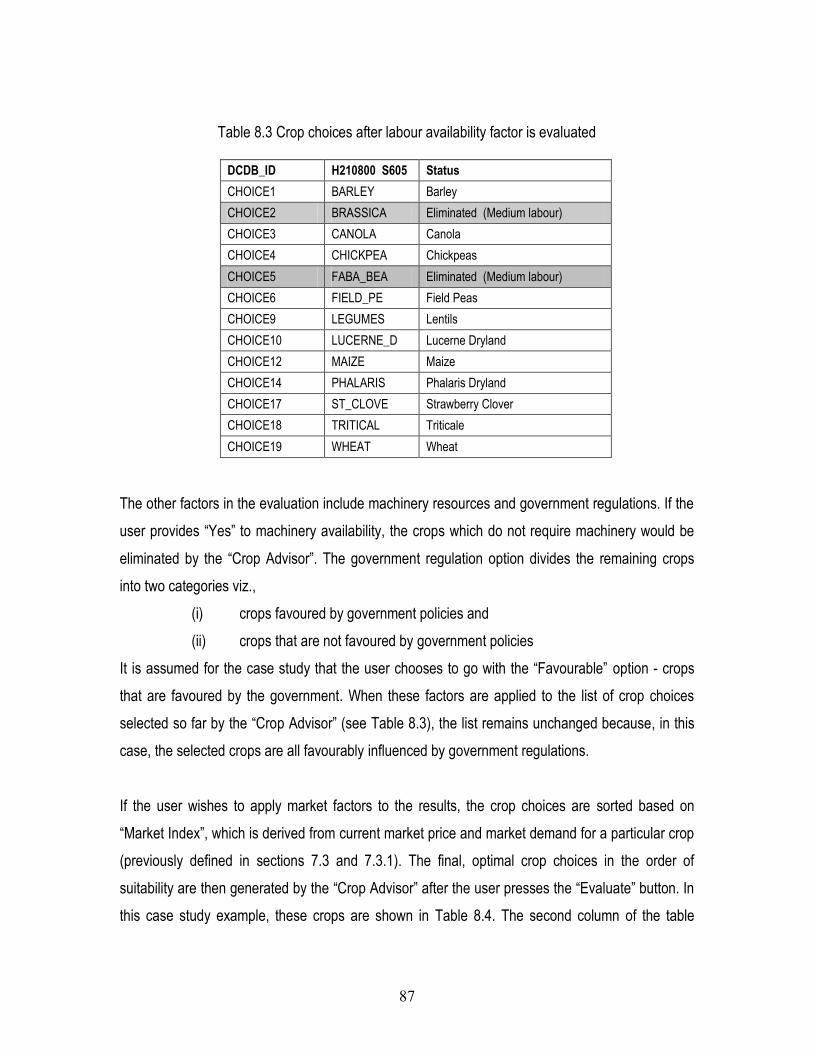
87
Table 8.3 Crop choices after labour availability factor is evaluated
DCDB_ID H210800 S605 Status
CHOICE1 BARLEY Barley
CHOICE2 BRASSICA Eliminated (Medium labour)
CHOICE3 CANOLA Canola
CHOICE4 CHICKPEA Chickpeas
CHOICE5 FABA_BEA Eliminated (Medium labour)
CHOICE6 FIELD_PE Field Peas
CHOICE9 LEGUMES Lentils
CHOICE10 LUCERNE_D Lucerne Dryland
CHOICE12 MAIZE Maize
CHOICE14 PHALARIS Phalaris Dryland
CHOICE17 ST_CLOVE Strawberry Clover
CHOICE18 TRITICAL Triticale
CHOICE19 WHEAT Wheat
The other factors in the evaluation include machinery resources and government regulations. If the
user provides “Yes” to machinery availability, the crops which do not require machinery would be
eliminated by the “Crop Advisor”. The government regulation option divides the remaining crops
into two categories viz.,
(i) crops favoured by government policies and
(ii) crops that are not favoured by government policies
It is assumed for the case study that the user chooses to go with the “Favourable” option - crops
that are favoured by the government. When these factors are applied to the list of crop choices
selected so far by the “Crop Advisor” (see Table 8.3), the list remains unchanged because, in this
case, the selected crops are all favourably influenced by government regulations.
If the user wishes to apply market factors to the results, the crop choices are sorted based on
“Market Index”, which is derived from current market price and market demand for a particular crop
(previously defined in sections 7.3 and 7.3.1). The final, optimal crop choices in the order of
suitability are then generated by the “Crop Advisor” after the user presses the “Evaluate” button. In
this case study example, these crops are shown in Table 8.4. The second column of the table

88
shows the list of optimal crops without considering market factors and the third column shows them
arranged based on their current market index.
Table 8.4 Table showing final crop choices for the farm unit with survey number H210800 S605
Strawberry Clover (which is at the top of the second column in the Table 8.4) is the most suitable
crop without considering the market factors (current market price and market demand) which, in
this case study, is also the present crop grown in the farm unit (as provided by the farmer for the
option “Previous Crop Grown”). However, Lucerne Dryland crop has good market potential
according to the Crop Advisor‟s assessment based on market factors. A message will appear
below the list of final crop choices that the farmer has already grown Strawberry Clover. The
system advises the farmer that a better crop (Lucerne Dryland) is available which will provide
better economic returns compared to the present crop. The user is presented with many flexible
options and any crop within the first five choices are considered to yield optimal economic returns
based on the physical, economic, social and political factors considered.
8.4 Testing the “Crop Advisor” expert system
The previous section discussed how the “Crop Advisor” system functions and how a farm unit is
assessed by it to determine the most suitable crops. This section discusses how the “Crop Advisor”
expert system was tested, and presents feedback from experts who have used the prototype
system. The success of any system is measured by the degree to which the expert system‟s
Farm unit
H210800 S605
Without considering market factors
Considering current market factors
CHOICE 1 Strawberry Clover Lucerne Dryland
CHOICE 2 Triticale Canola
CHOICE 3 Wheat Chickpeas
CHOICE 4 Maize Phalaris Dryland
CHOICE 5 Barley Strawberry Clover
CHOICE 6 Canola Lentils
CHOICE 7 Chickpeas Maize
CHOICE 8 Field peas Wheat
CHOICE 9 Lentils Barley
CHOICE 10 Lucerne Dryland Triticale
CHOICE 11 Phalaris Dryland Field peas
89
results matches with a human expert‟s recommendations, sufficiency of explanations provided by
the system and the consistency with which the expert system produces results without failure
(Turban 1988:582). The “Crop Advisor” expert system, although in the prototype stage, showed
remarkable consistency to produce reliable crop suggestions on every run. The validation of “Crop
Advisor” expert system involves two stages viz.,
(i) Checking if the “Crop Advisor” expert system is valid in terms of its functions and
(ii) Verifying the results delivered by the “Crop Advisor” expert system.
The first stage involves checking if the functions of “Crop Advisor” expert satisfy the common
requirements of a typical, knowledge-based system. The common characteristics of a typical
expert system are reported in the literature (Turban 1988:610), and are presented in Table 8.5. The
table also shows the extent to which the “Crop Advisor” expert system satisfies each characteristic.
Table 8.5 Characteristics of “Crop Advisor” expert system (based on Turban, 1988:610)
From Table 8.5, it can be seen that six of seven common attributes of expert systems are fulfilled
by the “Crop Advisor”. The seventh attribute – that expert systems should be capable of learning
new knowledge – is more applicable to medical and legal expert systems which encounter case-
by-case inputs where past events are stored in the form of knowledge base with expert‟s
feedbacks and corrections. Such a capability is not applicable to an agricultural expert system as it
operates with a common knowledge base to evaluate every land unit. Unlike the users of medical
and legal expert systems, the users of the “Crop Advisor” are not experts who can correct the
expert system and hence the necessary editing has to be made by experts. Currently, the
S.No Characteristic of a typical Expert System “Crop Advisor” prototype Expert System
1. Expert System should address a recognized need Yes. Need for suitable crop advice.
2. Expert System should be easy to use even by a novice
Yes. Very simple to use.
3. Knowledge base is kept independent of the program.
Yes. Knowledgebase remains independent.
4. Presence of easily modifiable knowledge base Yes. Easy to use table format.
5. Explanation subsystem for explaining conclusions Yes. Reasoning for working of the system.
6. Expert System should be able to increase the expertise of the user
Yes, the knowledge rules are kept in the form of a table. Easy to understand by anyone.
7. Expert System should be capable of learning new knowledge
No. “Crop Advisor” Expert system cannot learn on its own. Experts have to code the knowledge.

90
knowledge base of the “Crop Advisor” system can be updated by editing the Crop database (Table
7.2). However, adding a new factor to the “Crop Advisor” expert system can be done only by
editing the Visual Basic application which would require a programmer who has a hands-on
experience with Visual Basic programming. The method to add such functionality to the “Crop
Advisor” expert system is explained in section 9.4 where future developments are detailed.
8.5 Validating the results of “Crop Advisor” expert system
An indirect method of validation of “Crop Advisor” results (see Table 7.2) involves a thorough check
of knowledge base by the experts who provided the knowledge rules. This has been done for this
research and the knowledge base has been thoroughly verified. A direct method of validation of
“Crop Advisor” results involves evaluating each farm unit on a case-by-case basis and field checks
of the specific farms. This is, however, a very time consuming approach and has not been
attempted in the present study. However, the recommendations (crop suggestions) of the “Crop
Advisor” expert system can be compared by overlaying a set of selected farm units on the current
land use map which contains the crop categories grown on each farm unit. As part of the valuation
exercise of farm lands, DWLBC, periodically collects details of currently grown crops. These
surveys categorize farm units into broad land use types such as cereals, pastures and vineyards
(DWLBC 2003b). This broad categorisation means that the individual crop choices (for example,
maize, canola, grapes) provided by the expert system cannot be directly compared with the land
uses of the farm units (for example, cereals, grazing, irrigated vine fruits) provided by land use
maps. This validation process is attempted for a few selected farm units (1312) and the results are
summarized in Table 8.5. The selection of farm units is automatically done by a spatial join
operation using ArcGIS. Using ArcGIS, the land uses of these farm units as reported by DWLBC
are extracted. If the expert system had suggested the crops which match with the land uses
presented by the DWLBC land use data, it would be considered a reasonable choice by the expert
system. The first five crop choices suggested by the “Crop Advisor” expert system are taken into
account for this purpose and compared with the latest available land use data provided by DWLBC
(DWLBC 2003b). To obtain the first five choices from the “Crop Advisor” expert system, a standard
set of inputs, rainfed, low labour, machinery availability, favourable government support and market
factors, were assumed and executed for each farm unit. Assessment involved a Visual Basic
routine which used these standard inputs to evaluate farm units and aggregated the resulting five
crop choices for each farm unit (identified by its Survey Number) in an MS Access table. This table

91
was exported into ArcGIS to enable a table-join, with survey number as common identifier, with the
land use data provided by DWLBC. According to the DWLBC land use data, the selected farm
units fell into one of six land use categories cereals, grazing and modified pastures, vineyards,
legumes, oilseeds and woodland. The farm units were grouped into six land use categories with
each farm unit having the crop choices (in the form of attributes) suggested by the “Crop Advisor”
expert system. Table 8.6 presents a comparison (matches and mismatches) between the “Crop
Advisor” expert system‟s recommendations and the present land use data obtained from the field
observations. In 83 percent of cases, the “Crop Advisor” expert system‟s recommendations
matched with the present land use at the farm units. However, depending on the individual user
inputs by farmers, the suitable crop for each farm unit may vary.

92
Table 8.6 Results of “Crop Advisor” system compared with 2003 land use map provided by DWLBC
Suggested crops by “Crop Advisor” Expert System
Land use category found in the farm units in the DWLBC land use map
Number of farm units
Comments
Barley, Maize, Canola, Pastures
Cereals 549 532 matches;
17 mismatches
Lucerene (Dryland & Irrigated), Pasture, Grazing, Brassicas, Canola, Faba beans, Field peas
Grazing and modified pastures 566 404 matches
162 mismatches
Grapes, Grapevine Irrigated vine fruits 62 62 matches
0 mismatches
Canola, Brassicas, Faba beans, Carrots, Chick peas
Legumes 60 41 matches
19 mismatches
Pasture, Canola, Triticale, Ryegrass
Oilseeds 50 32 matches
18 mismatches
Strawberry clover, Almonds, Subterranean clover
Woodland 25 12 matches
13 mismatches
Total number of farm units 1312 1083 matches
229 mismatches
Percentage 83% matches
17% mismatches
The validation process was partially successful, because the “Crop Advisor” expert system actually
expects direct user inputs for the resource requirements for each farm unit and the results may
vary according to the farmer‟s inputs. Considering the study area is predominantly dryland (rainfed)
based, the validation process has provided a satisfactory result.
8.6 Feedback for “Crop Advisor” expert system
A selected group of land use experts and crop advisors who were involved in the knowledge base
development stages of this research were given a demonstration of the “Crop Advisor” expert
system and asked for their feedback and commentary. Their feedback and comments are listed

93
below, together with details of how these have been incorporated, where possible into the “Crop
Advisor” expert system. The “Crop Advisor” expert system presented in the thesis (section 8.2) has
been modified on the basis of these experts feedback and comments (refer to Appendix VI for the
screenshots of previous version of “Crop Advisor”).
The feedback received and the improvements incorporated, where applicable are presented below:
1. The previous crop grown on a farm unit needs to be taken into account so it may be
avoided from the suitable crops suggested.
The option to specify the previous or current crop was included in the “Crop Advisor”, and, an
alert can be issued to the user if the same crop is displayed in the final crop choices. The
message alerts the user to consider other crops on the basis of crop rotation purposes.
2. If a user chooses “High” labour supply, the crop choices should not be restricted to
crops that have “High” labour requirements, but also crops that have “Medium” and
“Low” labour requirements as well. This is because, if a farmer has a high amount of
labour supply, it is inclusive of “Medium” and “Low” labour supply requirements as well.
This advice has been implemented. If “High” labour supply is selected, the “Crop Advisor”
selects crops requiring “Medium” and “Low” labour supply as well.
3. The weather forecasts information can be included so the crop suitable for the next
growing season can be estimated in advance.
This is a valid suggestion as a farmer would expect to know what crop options are available
considering future weather conditions. It is possible to include weather predictions and the crop
options automatically will be updated by the “Crop Advisor” expert system based on the
available rainfall in the predicted season. This feedback has not been implemented in the
current version of “Crop Advisor” as the data could not be obtained within the stipulated
timeframe.
4. The factor based on government regulations needs to be refined to include greater
variations instead of just two classes (“favourable”, “unfavourable”).
94
In the present version of “Crop Advisor”, this is included as a heuristic factor, judged by a
human expert. Although, it is possible to include a factor (possibly a numerical score or rank)
based on a quantitative assessment of government impact on agriculture, such an exercise is
beyond the scope of the current thesis as it requires considerable expertise and resources. It
should, however, be considered in any commercial application of “Crop Advisor” that may
occur in the future.
5. It is a good prototype to start with but the factors and data need big refinements in order
to give meaningful farm level assessment.
The principal purpose of the research for this thesis has been to provide a proof-of-concept for
knowledge-based land evaluation and crop suitability (see section 5.3). The proof-of-concept
has been established, and it is agreed that “Crop Advisor” will benefit enormously if farm level
resource spatial data are included in the knowledge bases.
6. The provisions to add additional factors need to be supplied.
In its present form, additional factors can be added only by modifying the application using
Visual Basic. A method to enable additional factors to be added to the knowledge base has
been explained in section 9.4, but this has not been implemented in the current version of the
“Crop Advisor” expert system. Instead, new options (for example, instead of two options for
water availability, three or four options could be included) can be added or modified in the
knowledge base. Additional crops can be added with corresponding crop requirements such as
rainfall, labour, and market factors in the knowledge base table. The expert system will
accommodate such changes from the next execution. However, adding a new factor is
possible in the database, but adding it in the Graphical User Interface needs a working
knowledge of Visual Basic programming.
7. The knowledge base needs to include factors that govern physical land evaluation as
well.
Currently, the expert system reformats the individual crop suitability data supplied by the
DWLBC to derive crop choices suitable for a farm unit. It is possible to include those soil and

95
physiographic factors (presented in Appendix III) in the assessment as knowledge rules. This
exercise is not undertaken due to time constraint.
8. The market prices and market demand may change on a daily, weekly basis so
provisions should be made to include the changes without manual intervention.
The purpose of keeping the knowledge bases separate from the program (inference engine) is
to ensure such knowledge base can reside remotely. So, it is feasible to connect to web
sources (databases) to obtain dynamic information on market prices and demand as and when
required by the expert system. Such functionality requires collaboration from external agencies
who measure market factors of crop on a periodical basis.
9. It will be easier if farmers could choose their farm units by pointing and selecting on a
digital map.
The process of exporting the Visual Basic application into ArcGIS is possible, but has not yet
been undertaken. Once completed, users will be able to access the “Crop Advisor” expert
system on a spatial format and its results will be presented in a spatial format as well.
10. There need to be additional explanations provided at every stage to explain the users
why a factor is essential for the assessment process.
There are help (“?”) buttons presently provided. Additional information for a wide range of
factors and how they contribute to the crop evaluation process is relatively easy improvement
to “Crop Advisor” in due course.
11. A compound factor of market factors need to represent both market price and market
demand for a particular crop.
The previous version of “Crop Advisor” considered (refer to Appendix VI), considered only
market price. In the present version, the current market price and market demand are
combined to form a market index with a numerical scale of 1 to 50, details of which have been
presented in section 7.3. A crop choice is profitable if it has a high market index value.

96
12. The user should be able to omit certain factors, and still proceed with the assessment
process.
The user has the option to select or omit a factor from the analysis. The expert system will
function and provide crop choices even if some factors are omitted by the user. The factors
used in the analysis are listed at the end of evaluation and appear next to the evaluated results
(final crop choices).
13. If the expert system ran out of crop choices, it should instruct users to change their
options.
In this case, a reminder appears in the bottom-right corner (under “Messages”) of the user
interface that advises the user to change the options.
The feedback received regarding the “Crop Advisor” expert system has been generally favourable.
Most comments are data specific, recommending the inclusion of more factors and the use of
detailed spatial data and quantification of factors used in the assessment process. Most observers
believe that the user interface is simple and aesthetic and provides the user with a smooth, trouble-
free user experience. As it is a prototype, the knowledge base has the potential to be updated
significantly by more sophisticated data collection from an expanded range of sources. The current
prototype is, however, stable enough to handle queries from users and suggest suitable crops for
consideration.
8.7 Summary
This chapter has provided an overview of how the “Crop Advisor” expert system prototype
functions and how it assesses a farm unit to suggest suitable crops using a simple, step-by-step
process. It has detailed how the prototype‟s functions and results were validated. It also presented
some assessment of the expert system provided by a selection of persons who have been involved
in the project. The author‟s responses to feedback and suggestions have been discussed.

97
CHAPTER 9
DISCUSSIONS AND CONCLUSIONS
9.1 Introduction
The current chapter revisits the research objectives and assesses the “Crop Advisor” expert
system‟s functions and capabilities based on the gaps identified in the literature review. It
discusses the results and evaluates the merits and demerits of the “Crop Advisor” expert system.
As the “Crop Advisor” expert system was conceived with Indian farmers in mind, the issues
surrounding the implementation of such a system in a developing country like India are discussed.
The chapter concludes with an assessment of the contributions it has made in theoretical and
practical terms to the body of knowledge and charts directions for further research.
The research commenced with a two-fold objective to:
(i) develop a model for knowledge-based agricultural land evaluation and crop suitability
assessment that can use different types of scientific and heuristic knowledge from
various sources and
(ii) produce a prototype expert system that can demonstrate the model as proof-of-concept.
This research adopted a knowledge-based approach to farm level agricultural planning that
combines knowledge-based systems methodology with GIS tools. The present approach is
different from the traditional approaches to land evaluation as this can represent different types of
factors such as qualitative, quantitative and heuristic factors that are associated with land
evaluation. The knowledge-based expert system model enables the easy integration of these
factors thus enabling collaborative decision making process. The prototype “Crop Advisor” expert
system successfully demonstrated that a software tool can be developed that uses a knowledge-
based approach for choosing an optimal crop for a farm unit. The knowledge-base of the “Crop
Advisor” is independent of the inference engine and any necessary data changes to enhance the
expert system can be easily incorporated by changing the knowledge base table. The development
of “Crop Advisor” expert system is justified by the need to offer crop advice to farmers of
developing countries who have no access to human crop experts (crop advisors). Crop Advisor can
be used in scenarios where there is a need to use collective expertise, from multiple sources, to

98
suggest an optimal crop and where there is a need to accommodate dynamic information into the
crop evaluation process. From the feedback received, it can be inferred that the prototype “Crop
Advisor” expert system has fulfilled the objective of the research.
9.2 Demerits of “Crop Advisor” prototype
There are certain limitations that can be found in the prototype of “Crop Advisor” expert system,
including:
a. Adding a new factor to the system needs an intervention by a person who has an operative
knowledge of MS Access and Visual Basic. Contrary to the argument made in the literature
review (Refer to section 3.8), this facility is not included because of time-constraints, but,
however a later section in this chapter discusses the method to do that.
b. The knowledge rules used in the physical land evaluation prepared by DWLBC are not
coded into the “Crop Advisor” expert system‟s knowledgebase and hence, the “Crop
Advisor” expert system requires the results of preliminary land evaluation done by the
DWLBC. However, the factors and options used in the physical evaluation need to be
revised and hence corresponding knowledge rules need to be developed in consultation
with officials at DWLBC, or subsequently by other authorities if the expert system is used
in India, or other developing economies.
c. The spatial data used to derive the initial crop choices are mapped at 1:100,000. This
scale data is inadequate and unsuited for a farm based assessment. Since the expert
system operates independent of scale, large-scale, farm level spatial data is needed to
derive appropriate farm level suggestions.
9.3 Merits of “Crop Advisor” expert system
The current prototype simplifies the procedure of agricultural land evaluation and crop suitability
assessment, with the following advantages:
a. It can accommodate different type of factors and heuristic types of knowledge rules can be
added readily to the knowledge base. It can be potentially expanded to link many different
knowledge bases that may reside at different servers (at various geographical locations)

99
so the expert system can access the knowledge through a network when it is required to
do the analysis.
b. The expert system is very simple in operation and uses no specialized, expensive expert
system shells. MS Access and Visual Basic were used to develop the “Crop Advisor”
expert system.
c. The knowledge base is stored in a table format enabling the knowledge rules to be edited
easily.
9.4 Improvements for “Crop Advisor” expert system
Due to time constraints, many of the originally conceived features of the “Crop Advisor” expert
system were not developed. The “Crop Advisor” expert system presented in this research is an
improved second version (see Appendix VI for the screenshots of older version of the “Crop
Advisor” expert system). This section presents the improvements that would enhance a third
version of the prototype. These improvements are:
(i) Integration of GIS:
The analysis of spatial data to suit the “Crop Advisor” expert system involves routine
streamlined GIS functions that can be integrated into the expert system with tools
provided by ArcGIS manufacturers. It is possible to include the “Crop Advisor” expert
system as a module into ArcGIS programme so the user can select a farm unit from
a map, evaluate and get results on a spatial format that can be printed as a map.
(ii) Adding a control panel:
A control panel can be designed for experts who would like to add new factors,
change crop options and edit the knowledge base. The control panel, as shown in
Figure 9.1, will have the provision to add a new factor, modify existing factor or
delete any of them. Each factor has different classes, for example, labour availability
having three classes such as low, medium or high, that can be defined with “Modify
classes” button. Each crop has to be classified based on every factor and by clicking

100
the “Classify crops” button, the knowledge base table can be edited to include a new
factor and add appropriate classes for each crop. The edits can be saved by clicking
the “Save” button. By clicking “Design GUI” button, the graphical user interface (see
Figure 8.1), the main screen of “Crop Advisor” expert system, can be re-developed
to reflect the newly added factors. After this control panel is implemented, it would
be possible for anyone to edit the knowledgebase without using programs such as
MS Access and Visual Basic.
Figure 9.1 Control panel for “Crop Advisor” expert system
(iii) Including dynamic information:
It has been argued in various sections of this thesis that an expert system should be
able to handle dynamic information. A number of factors can be periodically updated
from internet sources. For example, the market price, market demand and weather
forecasts could be accessed from web servers 6 that provide this information
periodically. When the knowledge base expands with many knowledge rules, it
would be necessary to use a collection of “If-Then” statements instead of having a
knowledge base table. This will also allow experts include variable number of rules
6 Web servers are a set of hardware, software tools that help to broadcast information through internet to
World Wide Web.

101
for different crops for example, number of knowledge rules that need to be referred
may depend on individual crops. To implement this, an expert system shell can be
used instead of MS Access and Visual basic.
9.5 Implementation of “Crop Advisor” expert system
Implementation is defined as a process by which a newly developed or significantly changed
system is introduced to users (Turban 1988:580). The implementation process is an iterative
process where every stage produces feedback to apply to further improvement of the product. In
the current research, the expert system was developed using South Australian data and knowledge.
Ultimately, the expert system is for Indian farmers (see section Error! Reference source not
found.). Accordingly, the issues involved in successfully adopting the expert system for a country
like India are discussed.
There are many factors that determine a successful implementation of a new software application,
some relevant factors are shown in Figure 9.2 and discussed.
Figure 9.2 Determinants of successful implementation (Adapted from Turban 1988:584)
Implementation
Technical
factors
Project related
factors
Data factors
Human factors
Cultural
factors
Organisational
Support
User
Involvement

102
a. Technical factors
The technical issues associated with implementation can be of two types; technical constraints
resulting from limitation of available technology and technical problems that occur due to the
scarcity of resources. In India, there will be no problem with the available technology but the
scarcity of resources might be a barrier that needs resolution, possibly with some financial support
from the governments of developing countries.
b. Data factors
The non-availability of data, data access restrictions, incorrect data and non-availability of timely
information are some of the problems that need to be overcome in most developing countries. The
data collection procedures need to be established to ensure timely, quality data is collected. Some
of these data need to be processed before they could be input into the “Crop Advisor” expert
system. These steps can be automated with available GIS software tools.
c. Project related factors
The project needs to be tailored to the actual requirements of users and organisations that are
already involved in farmer, community development. Apart from suggesting a best crop, additional
crop advices can be included with information on how to grow a crop efficiently and how to market
the produce to get a good price. The “Crop Advisor” expert system should be part of a
comprehensive agriculture support service for the farmers.
d. Organisational support
Much of the data problems, financial resources can be solved with organisational support. A
political will is necessary to take up such a massive project. In countries like India, already, there
exist “Village Information Kiosks” which deliver essential weather and market price information to
farmers on a daily basis (Lancaster 2003). Crop Advisor can be installed in these village
information kiosks so farmers can access the service easily.
e. Cultural factors
There may be doubts among the users about the reliability of expert system‟s credibility. They may
continue to adopt decisions in their own way. The suggestions provided by the “Crop Advisor”

103
expert system should bring profit to users to bring reliability. It would be necessary to involve
farmers to ask for their feedback and what do they expect from an agricultural advice system.
f. Human factors
The experts may not co-operate due to a fear of losing their importance and job security. The
experts who share their knowledge should be compensated with some incentives. The experts
should be assured of their job security; they will also benefit by the sharing of their knowledge.
g. User involvement
The users need to be involved in the knowledge base development stage. Sufficient emphasis
must be given to traditional agriculture knowledge and practices that can be included as knowledge
rules. Local institutions and agricultural officers who interact with users on a daily basis should be
entrusted to do a user-needs survey.
These implementation hurdles can be managed by adopting a set of implementation strategies
(Turban 1988:606) including:
dividing the implementation into manageable stages
keeping solutions simple
developing a satisfactory support base
meeting user needs and institutionalising the system
In the less-developed countries, the development of spatial databases and other supplementary
databases will take the bulk of the time and efforts in project implementation stage. However, in
some countries like India where, federal and state agencies have defined a national spatial data
infrastructure in place and under this most of these natural datasets are being developed. These
databases are tailor-made and can become direct inputs for a decision support system such as the
„Crop Advisor‟.
9.6 Contributions of the research
In this section the contributions made by the research are reviewed and evaluated. As a
theoretical contribution, the research has tested a knowledge-based approach to land evaluation
and crop suitability and suggests that this approach has the potential to solve a real-world spatial
104
problem. The research fulfilled the need to extend the regional level land evaluation procedure to
provide crop suitability analysis at the farm level. At present, the land use plans in the developing
countries are being developed at the farm level and government agencies periodically release
strategic land use plan maps which are not being used in the farm level planning processes by
farmers. The method used in the research where the use of a strategic, regional land use plan to
dictate the land use decision making process at the farm level will benefit the farmers as well as
maintaining the environmental balance. The practical contributions of this research include the
development of a prototype expert system, “Crop Advisor”, that is helpful for farmers by suggesting
suitable crops based on land evaluation. Although, the factors incorporated in the knowledge-base
could be improved further, the research provided a basic framework on which the system can be
expanded to meet user needs. The framework for adding new knowledge into the knowledge
bases was established with procedures for easy modifications and updates. The prototype is a pre-
cursor for developing a knowledge-based, collaborative land evaluation and land use planning tool.
9.7 Future research directions
The current research proved the workability of a knowledge-based approach to land evaluation and
agricultural land use planning of farm units. The next step would be to strengthen it with extensive
knowledge bases by collecting detailed knowledge rules on various disciplines and factors
associated with land evaluation and land use planning. Instead of a single knowledge-base table
used in this research, several different knowledge-base servers can be used as inputs for the
expert system. These knowledge base servers can reside at different geographic locations as
shown in the Figure 1.1 (Chapter 1), can be linked to a central knowledge base of the expert
system. At present, the “Crop Advisor” expert system suggests suitable crop choice for a given
time. It can be further developed, with inputs from climate prediction models, to predict future land
use choices, what crops would be suitable after five, ten or twenty years, for a land unit based on
predicted changes in climate. Additional land uses with their knowledge rules to reflect their land
use requirements can be added, so that the functionality of the expert system can be extended to
industry site selection, ecological evaluation and impact assessment purposes. The research can
be extended to create a web-based expert system that connects with various knowledge bases to
access knowledge rules in real-time to deliver agriculture recommendations (Ponnusamy, 2005).
This can be achieved by having multiple knowledge bases, one for each scientific discipline,
105
connected by a communication network which would serve the expert system and by this way,
human experts can keep knowledge bases updated and accurate. The expert system would
access appropriate knowledge bases when a problem demands them. As pointed by Rafea
(1998:35-3), such a network of knowledge base servers would remain up-to-date and duplication of
expert knowledge at different places can be avoided. This type of web-based expert system can be
developed to support users who cannot easily access expertise, expert advice and knowledge from
human experts. Such web-based expert systems are necessary in even non-agricultural fields such
as Medicine, Law and Finance as the web capability enable to deliver advices and suggestions
anytime and anywhere.
9.8 Conclusion
The objective of the research is fulfilled by the development of the “Crop Advisor” expert system
which provided a proof-of-concept demonstration for a knowledge-based approach to land
evaluation and crop suitability assessment. Though, the developed system is still in a nascent
stage, it could be further developed to include more complex factors, knowledge bases and provide
more relevant recommendations and crop advices to land owners.
9.9 Summary
The current chapter presented the results of the present study which resulted in the development
of “Crop Advisor” expert system prototype. It presented a review on the merits and demerits that
exist with the system and presented a few methods on how they can be improved. The chapter
presented several strategies and factors that need be taken into account when such an expert
system is implemented in the real-world. Finally, it discussed the contributions made by the current
study, laid out directions for further research and concluded the thesis.

106
References
Ableiter, JK 1937, 'Productivity ratings in the soil survey report', Proceedings of Soil
Science Society of America, vol. 2, pp. 415-422.
Arunachalam, S 2002, Communication flow between scientists - the case of agricultural
research, ISNAR and IICD, viewed 5 December 2005,
<http://www.dgroups.org/groups/iNARS/docs/thinkpiece_arun.doc>.
Awad, EM & Ghaziri, HM 2004, Knowledge management, Pearson/Prentice Hall, Upper
Saddle River, NJ, USA.
Bacic, ILZ, Rossiter, DG & Bregt, AK 2003, 'The use of land evaluation information by
land use planners and decision-makers: A case study in Santa Catarina, Brazil',
Soil Use and Management, vol. 19, no. 1, pp. 12-18.
Barrett, CB, Place, F & Aboud, AA 2002, 'The challenge of stimulating adoption of
improved natural resource management practices in African agriculture', in CB
Barrett, F Place & AA Aboud (eds), Natural resource management in African
agriculture: Understanding and improving current practices, CABI Publishing,
Nairobi, Kenya, pp.1-22.
Beynon, M, Rasmequan, S & Russ, S 2002, 'A new paradigm for computer-based
decision support', Decision Support Systems, vol. 33, no. 2, pp. 127-142.
Burrough, PA 1992, 'Development of intelligent geographical information systems',
International Journal of Geographical Information Systems, vol. 6, no. 1, pp. 1-
11.
Chen, J & Gold, CM 1992, 'Research directions for spatial decision support', paper
presented to The International Colloquium on Photogrammetry, Remote Sensing
and Geographic Information Systems, Wuhan, China.
Chew, LML, Tan, CL & Murphy, DH 1995, 'An object-oriented knowledge base for
multi-domain expert systems', Expert Systems with Applications, vol. 8, no. 1, pp.
177-185.
Clay, JW 2004, World agriculture and the environment: A commodity-by-commodity
guide to impacts and practices, Island Press, Washington D.C.
CRIES 1983, Comprehensive resource inventory and evaluation system: Kenya natural
resource assessment, Michigan State University, viewed 1 May 2005,
<http://www.fao.org/documents/show_cdr.asp?url_file=/docrep/T4590E/t4590e0
9.htm>.
107
Dent, D & Young, A 1981, Soil survey and land evaluation, Soil surveys and landuse
planning, George Allen and Unwin, London.
Detlefsen, NK & Jensen, AL 2004, 'A stochastic model for crop variety selection',
Agricultural Systems, vol. 81, no. 1, pp. 55-72.
Diepen, vCA, Keulen, VH, Wolf, J & Berkhout, JAA 1991, 'Land evaluation: From
intuition to quantification', in BA Stewart (ed.), Advances in soil science, Springer,
New York, pp. 139-204.
Donovan, G & Case, F, 1998, Soil Fertility Management in Sub-Saharan Africa,
International Bank for Reconstruction and Development/The World Bank,
Washington, DC.Duda, J, Gaschnig, J & Hart, P 1979, 'Model design in the
prospector consultant system for mineral exploration', in M D (ed.), Expert system
in the microelectronic age, 9th
Edn, Edinburgh University Press, Edinburgh UK,
pp. 153-167.
Dutt, R 2001, A history of civilisation in ancient India, vol. 1, Taylor and Francis Group,
London UK.
DWLBC 2003a, Guidelines for assessing crop potential, Department of Water, Land and
Biodiversity Conservation, Adelaide, South Australia.
---- 2003b, Land use / land cover information spatial data, 2003 Edn, CD-ROM,
Department of Water, Land and Biodiversity Conservation (DWLBC), Adelaide,
South Australia.
---- 2003c, Crop suitability maps based on physical resources, 2003 Edn, CD-ROM,
Department of Water, Land and Biodiversity Conservation (DWLBC), Adelaide,
South Australia.
ESRI 2005, ArcGIS and ArcINFO, ESRI, Redlands CA.
FAO 1976, A framework for land evaluation, vol. 32, FAO soils bulletins, Food and
Agriculture Organization (FAO), Rome, Italy.
---- 1980, Land evaluation for development, vol. U1980/E, Food and Agriculture
Organization (FAO), Rome, Italy.
---- 1983, Guidelines: Land evaluation for rainfed agriculture, S590 .F68 no. 52, FAO,
Rome, Italy.
---- 1984, Land evaluation for forestry, FAO Forestry Paper 48, Food and Agriculture
Organization (FAO), Rome, Italy.

108
---- 1985, Guidelines: Land evaluation for irrigated agriculture, vol. 55, FAO soils
bulletins, Food and Agriculture Organization (FAO), Rome, Italy.
---- 1993, Guidelines for land-use planning, Soil Resources, Management and
Conservation Service, Rome, Italy.
---- 1994, 'Recent developments in land use planning, with special reference to FAO', in
LO Fresco, L Stroosnijder, J Bouma & H Keulen van (eds), The future of the land:
Mobilising and integrating knowledge for land use options, John Wiley & Sons
Ltd, Chichester, UK.
---- 2006, FAO statistics, FAO Statistics Division, viewed 12 October 2006,
<http://faostat.fao.org/site/351/default.aspx>.
Fresco, LO 1994, 'Imaginable futures: A contribution to thinking about land use planning',
in LO Fresco, L Stroosnijder, J Bouma & H Keulen van (eds), The future of the
land: Mobilising and integrating knowledge for land use options, John Wiley &
Sons Ltd, Chichester, UK.
Garret, KB 1993, Whole farm planning: Principles and options, 0 7306 2961 9,
Department of Conservation and Natural Resources Victoria, Melbourne.
Geertman, S, Openshaw, S & Stillwell, JCH (eds) 1999, Geographical information and
planning, Advances in spatial science, Springer, St. Petersburg, Russia.
Hale, R & Whitlam, P 1997, Practical problem solving and decision making: An
integrated approach Kogan Page, London.
Harsh, SB 1998, Agricultural information systems: Current applications and future
prospects, The Asian Federation for Information Technology in Agriculture,
viewed on 24 January 1998, <http://www.jsai.or.jp/afita/afita-conf/1998/S02.pdf>.
Highsmith, RM & Northam, RM 1968, World economic activities, Harcourt Brace, New
York.
Homer-Dixon, TF 1999, Environment, scarcity, and violence, Princeton University Press,
Princeton, NJ.
Hubner, M & Moudon, AV (eds) 2000, Monitoring land supply with geographic
information systems theory, practice, and parcel-based approaches, 1st Edn,
Wiley-Interscience, Indianapolis IN.
Huddleston, JH 1984, 'Development and use of soil productivity ratings in the United
States', Geoderma, vol. 32, pp. 297-317.

109
IUCN-UNEP-WWF 1980, World conservation strategy, IUCN - International Union for
the Conservation of Nature and Natural Resources (Now renamed as, The World
Conservation Union), UNEP - United Nations Environment Programme and
World Wide Fund for Nature, Gland, Switzerland.
Jackson, P 1999, Introduction to expert systems, 3rd
Edn, International computer science
series, Addison Wesley Longman, Harlow, England.
Kalogirou, S 2002, 'Expert systems and GIS: An application of land suitability
evaluation', Computers, Environment and Urban Systems, vol. 26, no. 2-3, pp. 89-
112.
Kent, A, Hall, CM & Williams, JG (eds) 2000, Encyclopedia of computer science and
technology, Marcel Dekker Inc, New York.
Lancaster, J 2003, Village kiosks bridge India’s digital divide, The Washington Post
Company, viewed 14 July 2005, <http://www.washingtonpost.com/ac2/wp-
dyn?pagename=article&contentId=A13442-2003Oct11¬Found=true>.
Laaribi, A, Chevallier, JJ & Martel, JM 1996, 'A spatial decision aid: A multi-criterion
evaluation approach', Computers, Environment and Urban Systems, vol. 20, no. 6,
pp. 351-366.
Leung, HL 2003, Land use planning made plain, 2nd
Edn, University of Toronto Press,
Toronto, Canada.
Lucas, HCJ 1973, Computer based information systems in organizations, 1st Edn, Science
Research Associates Inc., Chicago IL.
Luger, GF & Stubblefield, WA 1989, Artificial intelligence and the design of expert
systems, The Benjamin/Cummings Publishing Company Inc, Redwood City, CA.
Malczewski, J 1996, 'A GIS-based approach to multiple criteria group decision-making',
International Journal of Geographical Information Systems, vol. 10, no. 8, pp.
955-971.
Malczewski, J 1999, GIS and multi-criteria decision analysis, John Wiley and Sons
New York.
Maru, A 2003, Information and communications technology use in agricultural extension
in India, Technical Centre for Agricultural and Rural Cooperation ACP-EU
(CTA), Wageningen, The Netherlands, 23 - 25 September 2003,
<http://www.cta.int/observatory2003/case_studies/Case_study_India.pdf>.
Mather, AS 1986, Land use, Longman, New York.

110
Matthews, KB, Sibbald, AR & Craw, S 1999, 'Implementation of a spatial decision
support system for rural land use planning: Integrating geographic information
system and environmental models with search and optimisation algorithms',
Computers and Electronics in Agriculture, vol. 23, no. 1, pp. 9-26.
McClean, CJ, Watson, PM, Wadsworth, RA, Blaiklock, J & O’Callaghan, JR 1995, 'Land
use planning: A decision support system', Journal of Environmental Planning and
Management, vol. 38, no. 1, pp. 77-92.
McKenzie, NJ 1991, A strategy for coordinating soil survey and land evaluation in
Australia, 114, Division of Soils, CSIRO, Glen Osmond, South Australia.
McRae, SG & Burnham, CP 1981, Land evaluation, Monographs in soil survey,
Clarendon Press, Oxford, UK.
Microsoft 2002, Microsoft access 2002, 2002 Edn, Microsoft Corporation, Redmond,
Database Management Software.
---- 2005, Visual studio 2005, 2005 Edn, Microsoft, Redmond, Development Software.
Mintzberg, H, Raisinghani, D & Theoret, A 1976, 'The structure of ‘‘unstructured’’
decision processes', Administrative Science, vol. 21, pp. 246-275.
Nikolopoulos, C 1997, Expert systems: Introduction to first and second generation and
hybrid knowledge based systems, Marcel Dekker, New York.
Norton, JP 1855, Elements of scientific agriculture or the connection between science
and the art of practical farming., Michigan historical reprint series, C. M. Saxton
& co. ,1855, Reprint by Scholarly Publishing Office, University of Michigan
Library, 2006, New York.
Ochola, WO & Kerkides, P 2004, 'An integrated indicator-based spatial decision support
system for land quality assessment in Kenya', Computers and Electronics in
Agriculture, vol. 45, no. 1-3, pp. 3-26.
Osvald, H 1966, The Earth can feed us, 1st Edn, George Allen & Unwin Ltd, London.
Pearsall, J (ed.) 1998, The new oxford dictionary of English, Oxford University Press,
New York.
Pereira, JMC & Duckstein, L 1993, 'A multiple criteria decision-making approach to
GIS-based land suitability evaluation', International Journal of Geographical
Information Systems, vol. 7, no. 5, pp. 407-424.
Piper, JK & Soule, JD 1992, Farming in nature's image: An ecological approach to
agriculture, Island Press, Washington DC.

111
PIRSA 2003, Spatial database of South Australia, CDROM, Primary Industries and
Resources South Australia (PIRSA), Adelaide, South Australia.
Ponnusamy, T 2005, Web-based expert system for supporting precision agriculture, GIS
Development Pt Ltd, Jakarta, Indonesia, 22-25, August 2005.
Ponnusamy, T & Gowda, HH 2002, Remote sensing and GIS for natural resources
management in Karnataka, India: A new perspective, ESRI, San Diego, CA, July
8-12, <http://gis.esri.com/library/userconf/proc02/abstracts/a1350.html>.
Power, DJ 2005, A brief history of decision support systems, PowerEnterprises.net,
viewed 18 August 2005 <http://DSSResources.COM/history/dsshistory.html>.
ProFarmer Australia, 2006, Profarmer newsletters, ProFarmer Advisory Services Pty Ltd
Mosman Park, Western Australia.
Rafea, A 1998, 'Agriculture', in J Liebowitz (ed.), The handbook of applied expert
systems, CRC Press, New York.
Ramharacksingh, R 2000, Caribbean primary agriculture book 4, Jun 30, 2000 Edn, vol.
4, 4 vols., Nelson Thornes.
Randolph, J 2004, Environmental land use planning and management, Island Press
Washington, DC.
Reddy, KP & Ankaiah, R 2005, 'A framework of information technology-based
agriculture information dissemination system to improve crop productivity',
Current Science, vol. 88, no. 12, pp. 1905-1913.
Rosa, DDl 2004, 'A land evaluation decision support system (MicroLEIS DSS) for
agricultural soil protection with special reference to the Mediterranean region',
Environmental Modelling & Software, vol. 19, pp. 929–942.
Rossiter, DG 1996, 'A theoretical framework for land evaluation (with discussion)',
Geoderma, vol. 72, pp. 165-202.
Roy, R 2001, Industrial knowledge management, 1st Edn, Springer-Verlag London
Limited, London UK.
Runquist, S, Zhang, N & Taylor, RK 2001, 'Development of a field-level geographic
information system', Computers and Electronics in Agriculture, vol. 31, no. 2, pp.
201-209.
Ruud, H, Huirne, BM & Anderson, JR 2004, Coping with risk in agriculture, 2nd
Edn,
CABI Publishing, Cambridge, MA.

112
Shields, PG, Smith, CD & McDonald, WS 1996, Agricultural land evaluation in
Australia: A review, Australian Collaborative Land Evaluation Program (ACLEP),
Australian Collaborative Land Evaluation Programme, Canberra.
Shortliffe, EH, Davis, R, Axline, SG, Buchanan, BG, Green, CC & Cohen, SN 1975,
'Computer-based consultations in clinical therapeutics: Explanation and rule
acquisition capabilities of the Mycin system', Computers and Biomedical
Research, vol. 8, no. 4, pp. 303-320.
Shu-Hsien Liao 2005, 'Expert system methodologies and applications--a decade review
from 1995 to 2004', Expert Systems with Applications, vol. 28, no. 1, pp. 93-103.
Somrang, A, Chuenpichai, K & Chuenpichai, S 2002, 'GIS and expert system integration
for sub-district's land & agriculture development, Thailand', paper presented to
Twenty-second Annual ESRI International User Conference, San Diego, CA, July
8-12.
Spender, J 2005, 'What's new and important about knowledge management? Building
new bridges between managers and academics', in T Ray, S Little & SE Little
(eds), Managing knowledge: An essential reader, 2nd
Edn, Sage Publications,
London, pp. 127-154.
Stair, MR 1996, Principles of information systems: A managerial approach, 2nd
Edn,
Course Technology (International Thomson Publishing Inc.,), Cambridge.
Turban, E 1988, Decision support and expert systems: Managerial perspectives,
Macmillan series in information systems, Macmillan, New York.
United Nations 1992, Results of the world conference on environment and development:
Agenda 21, UNCED United Nations Conference on Environment and
Development, New York.
van de Graaf, R (ed.) 1988, Australian soil and land survey handbook, vol. 2, Guidelines
for conducting surveys, Inkata Press, Melbourne Victoria.
Venema, JH & Daink, F 1992, Papua new guinea land evaluation systems (PNGLES),
Papua New Guinea Department of Agriculture and Livestock, viewed 1 May 2005,
<http://www.css.cornell.edu/landeval/bibl.htm>.
Ventura, S, Miller, T & Barry, G 2003, 'Community engagement in land use planning
through web-based technologies', in JCH Stillwell & S Geertman (eds), Planning
support systems in practice Springer, Berlin.

113
Wei, Z, Jianbang, H & Tianhe, C 1992, 'Application of expert systems in land resources
research', Computers, Environment and Urban Systems, vol. 16, no. 4, pp. 321-
327.
Wong, CD 2004, Chinese steles: Pre-Buddhist and Buddhist use of a symbolic form,
University of Hawaii Press, Honolulu HI.
World-Bank 1997, 'Rural well-being: From vision to action: Proceedings of the fourth
annual world bank conference on environmentally sustainable development',
paper presented to Fourth Annual World Bank Conference on Environmentally
Sustainable Development, Washington, D.C., 1 December 1997.
Yizengaw, T & Verheye, W 1995, 'Application of computer captured knowledge in land
evaluation, using ales in Central Ethiopia', Geoderma, vol. 66, no. 3-4, pp. 297-
311.
Zhu, X & Dale, AP 2001, 'JavaAHP: A web-based decision analysis tool for natural
resource and environmental management', Environmental Modelling & Software,
vol. 16, no. 3, pp. 251-262.
Zhu, X, Aspinall, RJ & Healey, RG 1996, 'ILUDSS: A knowledge-based spatial decision
support system for strategic land-use planning', Computers and Electronics in
Agriculture, vol. 15, no. 4, pp. 279-301.
Zhu, X, Healey, RG & Aspinall, RJ 1998, 'A knowledge-based systems approach to
design of spatial decision support systems for environmental management',
Environmental Management, vol. 22, no. 1, pp. 35-48.
Zijp, W 1994, Improving the transfer and use of agricultural information: A guide to
information technology, World Bank, Washington, D.C.

114
Appendix I
Appendix I: Factors used in Physical Land Evaluation by DWLBC
Attribute category Attribute Symbol
Topography Steepness
Surface rockiness
Exposure
e
r
y
Waterlogging / salinity / drainage Susceptibility to waterlogging
Depth to water table
Salinity (induced by water table)
Deep drainage
Recharge potential
Susceptibility to flooding
w
o
s
b
q
f
Soil fertility Inherent fertility
Susceptibility to acidity
Surface carbonate
Subsoil carbonate
n
h
ka
kb
Chemical barriers to root growth Alkalinity
Dry saline land
Boron toxicity
Sodium toxicity (sodicity)
Aluminium toxicity
Acid sulfate potential
I
v
tb
tNa
tAl
j
Soil depth / water storage Available water holding capacity
Depth to hard rock
Depth to hardpan
Potential root zone depth
Sensitive perennial horticultural crops
Intermediate perennial horticultural crops
Hardy perennial horticultural crops
Annual root crops
Annual above ground horticultural crops
m
xr
xp
da
db
dc
dd
de
Soil physical conditions Surface soil condition
Surface texture
Susceptibility to water repellence
Subsoil structure
c
-
u
p
Erosion potential Water erosion potential
Wind erosion potential
Susceptibility to water repellence
Scalding
Gully erosion
Mass movement (landslip)
e
a
u
z
g
l

115
Appendix II
Appendix II: Factors used in a typical land evaluation and crop suitability analysis process (Maschmedt, D 2006, pers. comm., May 2006)
Factors used in a typical land evaluation and crop suitability assessment process
Topography
Steepness Steepness or the slope gradient is major limiting factor in hilly regions. As agriculture machinery may not negotiate a slope more than 30%, this is an important factor in evaluating farm units that use agriculture machinery in farm operations.
Surface rockiness
Surface rockiness and rock outcrops make the land non-arable. They further prevent smooth movement of machinery and cause interference and damage to equipment.
Exposure
Exposure to wind reduces productivity through desiccation, foliar damage and root disturbance. Coastal exposure is a greater limitation than inland exposure because of the additional problem of salt spray.
Waterlogging / salinity / drainage
Susceptibility to waterlogging
Waterlogging affects most crops by reducing or eliminating oxygen supply to the root system, creating favourable conditions for root-rotting anaerobic micro-organisms, and contributing to nitrogen loss. For example, a slowly permeable soil in a dry location may be assessed as well-drained because the rainfall is insufficient to saturate the soil in most seasons. The same soil under irrigation may be susceptible to waterlogging.
Depth to water table
Depth to water table is estimated as the “shallowest depth maintained for at least two weeks in most years”. On a regional scale, this assessment is generally an estimate, and as such can only be used as an indication of a possible limitation in land evaluation. A water table present within the potential root zone affects plant productivity in the same way as waterlogging. Saline water tables are clearly a more severe limitation than those which are non-saline.
Salinity (induced by water table)
Salinity inhibits capacity of water absorption from the soil. Salt affected plants are often moisture-stressed. Salinity also affects some plants through the toxic effects of sodium and / or chloride. One remedy to this problem is to use salt tolerant crop varieties. This severely restricts cropping options.
Deep drainage Deep drainage is the capacity of the deep subsoil and the material immediately underlying the soil profile to transmit water away from the root zone. The situation is complicated where shallow water tables occur, as

116
these also restrict downward water movement.
Restricted deep drainage prevents leaching of salts, and can thus have an indirect effect on limiting the growth of dryland crops and pastures. However, the main impact of a deep drainage limitation is on irrigated land where the hydrology of the soil profile is significantly altered.
Soil depth / water storage
Available water holding capacity
The water holding capacity of a crop is determined by the amount of water stored in the root zone. It signals the duration that a crop can survive between rain events. In South Australia's climate where rainfall, especially at the opening and the close of the season is erratic, this attribute is critical for the success of dryland crops and pastures. On irrigated land, irrigation scheduling largely overcomes this limitation.
Depth to hard rock or hardpan
Hard rocks or hardpans are defined as materials that are not penetrable with hand tools, and as such does not support a crop‟s root growth. Depth to hard rock or hardpan is not used as criteria per se in the land evaluation, but is incorporated into „available water holding capacity‟ and „potential root zone depth‟ factors.
Potential rootzone depth
This attribute indicates the "irrigable depth" of the soil profile. It is determined by the depth to restrictive layers such as poorly structured clays, carbonate accumulations and hard rock or pans. Potential root zone depth varies between species, depending on their capacity to penetrate various materials.
Chemical barriers to root growth
Alkalinity Like acidity, alkalinity affects nutrient availability and uptake. Unlike acidity, alkalinity cannot be corrected (in a commercial situation).
Dry saline land
Salts which have accumulated in the soil in the absence of water tables have the potential to restrict root growth and hence the efficiency of water-use. In irrigated situations, initial water applications may be used to flush the salts out of the potential root zone, but this can only occur if deep drainage is unrestricted.
Toxic elements Toxic elements in the potential root zone effectively limit the depth to which plants can extract moisture and nutrients. In South Australia‟s agricultural districts, boron and sodium toxicity are widespread, while aluminium toxicity is a problem in acidic soils (invariably in higher rainfall areas). Data on critical concentrations of boron and sodium for crops (other than boron in cereals) is sparse. In the attribute data base linked to the soil landscape mapping, boron toxicity is determined by the depth to concentrations exceeding 15 mg/kg, while sodium toxicity is determined by the depth to exchangeable sodium percentages (ESP) exceeding 25. Aluminium toxicity is determined by the concentration of extractable

117
aluminium in the potential root zone.
Soil Fertility
Inherent fertility This is a subjective assessment of a soil's capacity to store and release nutrients. It is judged by exchangeable cat ion characteristics, clay and organic matter content, leaching capacity, acidification potential, and carbonate and ironstone content. Different species vary in their nutrient requirements - those with lower requirements or more efficient uptake mechanisms perform better on soils of inherently low fertility
Susceptibility to acidity Acidity affects the availability of nutrients in the soil, reduces the nutrient retention capacity of the soil, and inhibits the activity of some micro-organisms essential for healthy plant growth. The capacity of root hairs to take up nutrients may also be reduced in acidic soils, partly due to damage caused by aluminium, the solubility of which increases at lower pH (see aluminium toxicity). Susceptibility to acidity is determined through a combination of actual measurements and extrapolation between similar soil landscape environments.
Soil carbonates Fine earth carbonates at shallow depth in the soil affect nutrient availability and uptake. Carbonate effects become significant when concentrations exceed more than 10%.
Soil physical conditions
Surface soil condition The condition or strength of the soil surface affects water infiltration, workability, seedling emergence and erodability. Loose to friable surface soils present few problems for any crop. Hard setting soils are more susceptible to problems, while dispersive soils are highly susceptible to damage and restrict plant growth.
Surface texture Surface texture is used in some crop potential assessments either as an additional means of downgrading low fertility sandy soils, or to downgrade clayey surfaces which are undesirable for root crops.
Susceptibility to water repellence
Water repellence affects crop establishment and increases the risk of both wind and water erosion, and sand blasting. It is less of a limitation in irrigated crops than in rain fed situations because amelioration is simpler.
Subsoil structure The nature of the subsoil affects water movement and root growth. Structural characteristics, strength and depth are the determinants of the degree to which subsoil materials impact on root growth and permeability. The effects of unfavourable subsoil structure are reflected in other attributes, mainly 'susceptibility to waterlogging', 'available water holding capacity' and 'potential root zone depth'.
Water erosion potential In hilly country, slope gradient is a key determinant of land class. Any uses involving cultivation are not possible on slopes steeper than 30%. In reality, the risk of erosion generally sets the upper slope limit at 20%

118
for cultivated land uses, but slopes steeper than 8-12% (depending on soil erodibility) require very high levels of conservation management. Perennial crops and pastures can be managed on steeper slopes, but erosion potential and practicability / safety issues cause steep slopes to be down-graded for all uses. Unchecked erosion causes loss of nutrients and organic matter (which are concentrated in the upper few cm), and loss of soil depth and structure. Consequently sloping land has a higher degree of limitation for annual crops than it does for perennial crops and pastures.
Erosion potential
Wind erosion potential The potential for wind erosion is a critical determinant of land class in sandy regions. Wind erosion is responsible for substantial losses of nutrients and organic matter, and loss of soil depth. Consequently, wind erosion-prone land has a higher degree of limitation for annual crops than it does for perennial crops and pastures.
Scalding Scalding is the exposure of inhospitable subsoils by erosion in the past. It reduces productive potential by reducing arable area. Land susceptible to scalding is fragile and requires conservative management.
Gully erosion
Apart from their land degradation aspects, erosion gullies affect accessibility and hinder the installation and use of irrigation systems. Land is assessed according to the proportion affected by gullying - all crop types are affected to similar degree.
Mass movement (landslip)
Land affected by or prone to mass movement is usually too steep for cropping, but generally has some potential for grazing or perennial horticulture.
Water quality
Quality and quantity of water supplies are essential considerations when assessing potential for irrigated crops. Although strictly not a soil or landscape attribute, water resource data, where available, are generally incorporated into an assessment of potential for irrigated crops. If the water quality is severely low, the land is classified according to the water quality class rather than any limitations imposed by soil or landscape features.
Climate and rainfall
The daily temperature, evaporation rate and rainfall affect the crop decision widely. The amount of rainfall, number of rainy days and the season of rainfall are the crucial factors for dryland crops. Both the historical averages as well as future forecasts should be consulted before a crop decision is made.
Size and nature of land
The size and shape of a farm unit may affect what crop can be grown there. Large farms are most suitable for mechanized farming. The size of the farm should be

119
large enough to compensate the investment in the farm machinery.
Profitability (Costs/Returns)
The return from the crop yield must exceed the cost of cultivating the crop, if not it would be a loss for a cultivator.
Market Price and Demand for a crop
The price of crop produce at markets is an essential element that drives the choice of crop. Also, the seasonal demand for the particular produce should be considered before selecting a crop. The selection of crops, which prices of the crop produces are highly fluctuating in the market place, tend to be risky.
Access to Market
The access to transport network, nearest grain storage points, freezer plants and railway stations influence crop decisions as they indicate the possibility of transporting and storing crop produces in a much easier way.
Access to Water / Water Price
The water required for irrigation has to be purchased in some regions. Hence, the price of water needs be too taken into account.
Suitability based on other factors
Crop Rotation
The previous year‟s crop affects the productivity of a farm unit. Growing same crop year-after-year not only robs the productivity of the soil, but also it does not break the pests‟ life cycle. Crop rotation is successful alteration of crops preferable from two dissimilar families of crops.
Equipment & Labour
Some crops can be seeded, harvested with the help of farm machineries but others don‟t permit. Horticultural crops usually involve labour-intensive farming methods. On the other hand, with the help of machineries, large fields of wheat or canola can be managed with ease.
Government policies and restrictions
The government indirectly controls agricultural crops grown in a certain region by providing favourable subsidies, offering fare prices and establishing procurement prices for certain crops. On the other hand, it also restricts the growth of certain crops by the method of licensing, water restrictions and imposing zoning regulations.
Environmental factors
Sometimes, environmental factors such as the geographical location of a farm unit may influence farmer to choose or not to choose a crop.

120
Appendix III Appendix III: List of Crop Choices (Maschmedt, D 2006, pers. comm.)
S.No. Crop Code Crop Family
1. Almond ALMONDS Horticulture
2. Apple APPLES Horticulture
3. Barley BARLEY Cereal
4. Brassicas BRASSICAS Annual horticulture
5. Canola CANOLA Oilseeds
6. Carrot CARROTS Root crops
7. Cherry CHERRIES Horticulture
8. Chickpea CHICKPEAS Grain legume
9. Citrus CITRUS Horticulture
10. Field Pea FIELDPEAS Grain legume
11. Faba Beans FABABEANS Grain legume
12. Grapevine GRAPES Horticulture
13. Grapevine Medium GRAPESMH Horticulture
14. Grasses GRASSESDR Pasture
15. Grazing GRAZINGDR Pasture grass
16. Lavender LAVENDER Flower
17. Lentil LENTILS Grain legume
18. Legumes LEGUMESDR Pasture legume
19. Lucerne Dryland LUCERENEDR Pasture legume
20. Lucerne Irrigated LUCERENEIR Pasture legume
21. Lupin LUPINS Grain legume
22. Maize MAIZE Forage
23. Oats OATS Cereal
24. Olive OLIVES Horticulture
25. Onion ONIONS Root crops
26. Summer Fodder PASTURE Forage
27. Pear PEARS Horticulture
28. Phalaris Dryland PHALARISD Pasture grass
29. Potato POTATOES Root crops
30. Pyrethrum PYRETHRUM Specialty crop
31. Perennial Rye Grass Dryland RYEGRASSD Pasture grass
32. Perennial Rye Grass Irrigated RYEGRASSH Pasture grass
33. Strawberry Clover STCOLVER Pasture legume
34. Subterranean Clover SUBCLOVER Pasture legume
35. Triticale TRITICALE Cereal
36. Wheat WHEAT Cereal
37. White Clover Irrigated WHITECLOV Pasture legume
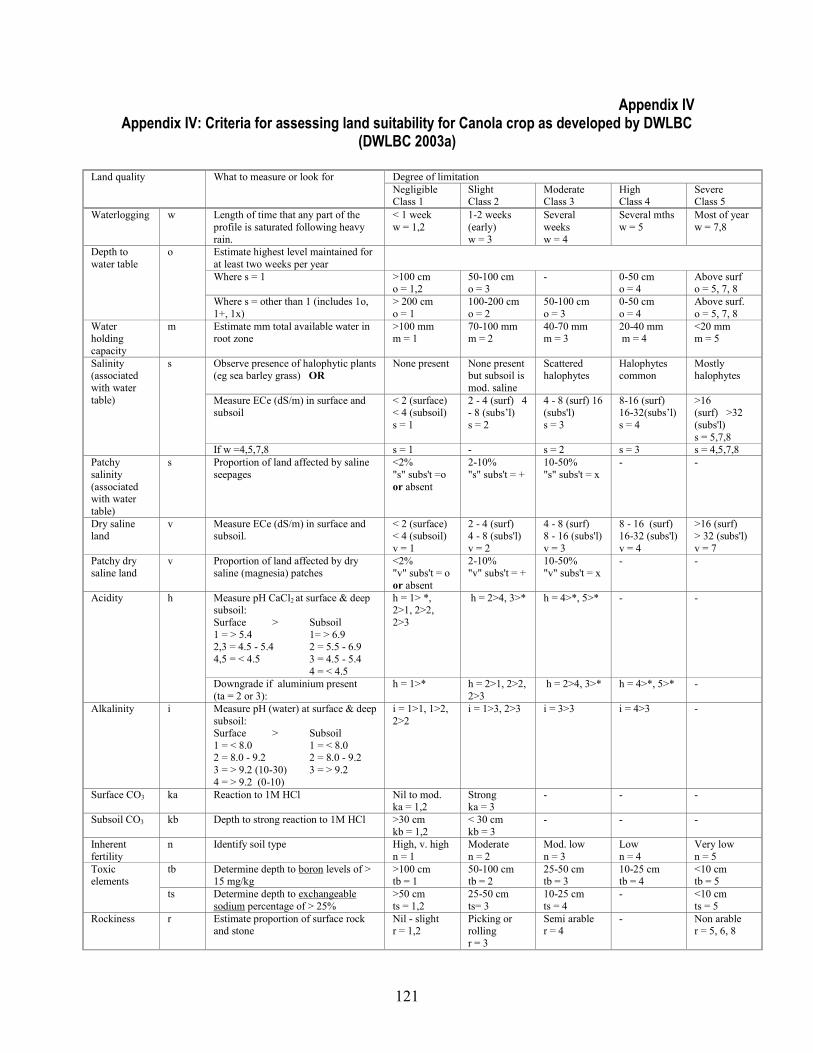
121
Appendix IV Appendix IV: Criteria for assessing land suitability for Canola crop as developed by DWLBC
(DWLBC 2003a)
Land quality
What to measure or look for Degree of limitation
Negligible Class 1
Slight Class 2
Moderate Class 3
High Class 4
Severe Class 5
Waterlogging
w Length of time that any part of the
profile is saturated following heavy
rain.
< 1 week
w = 1,2
1-2 weeks
(early)
w = 3
Several
weeks
w = 4
Several mths
w = 5
Most of year
w = 7,8
Depth to
water table
o Estimate highest level maintained for
at least two weeks per year
Where s = 1 >100 cm o = 1,2
50-100 cm o = 3
- 0-50 cm o = 4
Above surf o = 5, 7, 8
Where s = other than 1 (includes 1o,
1+, 1x)
> 200 cm
o = 1
100-200 cm
o = 2
50-100 cm
o = 3
0-50 cm
o = 4
Above surf.
o = 5, 7, 8
Water holding
capacity
m Estimate mm total available water in root zone
>100 mm m = 1
70-100 mm m = 2
40-70 mm m = 3
20-40 mm m = 4
<20 mm m = 5
Salinity (associated
with water
table)
s Observe presence of halophytic plants (eg sea barley grass) OR
None present None present but subsoil is
mod. saline
Scattered halophytes
Halophytes common
Mostly halophytes
Measure ECe (dS/m) in surface and subsoil
< 2 (surface) < 4 (subsoil)
s = 1
2 - 4 (surf) 4 - 8 (subs’l)
s = 2
4 - 8 (surf) 16 (subs'l)
s = 3
8-16 (surf) 16-32(subs’l)
s = 4
>16 (surf) >32
(subs'l)
s = 5,7,8
If w =4,5,7,8 s = 1 - s = 2 s = 3 s = 4,5,7,8
Patchy
salinity
(associated with water
table)
s Proportion of land affected by saline
seepages
<2%
"s" subs't =o
or absent
2-10%
"s" subs't = +
10-50%
"s" subs't = x
- -
Dry saline land
v Measure ECe (dS/m) in surface and subsoil.
< 2 (surface) < 4 (subsoil)
v = 1
2 - 4 (surf) 4 - 8 (subs'l)
v = 2
4 - 8 (surf) 8 - 16 (subs'l)
v = 3
8 - 16 (surf) 16-32 (subs'l)
v = 4
>16 (surf) > 32 (subs'l)
v = 7
Patchy dry saline land
v Proportion of land affected by dry saline (magnesia) patches
<2% "v" subs't = o
or absent
2-10% "v" subs't = +
10-50% "v" subs't = x
- -
Acidity h Measure pH CaCl2 at surface & deep subsoil:
Surface > Subsoil
1 = > 5.4 1= > 6.9 2,3 = 4.5 - 5.4 2 = 5.5 - 6.9
4,5 = < 4.5 3 = 4.5 - 5.4
4 = < 4.5
h = 1> *, 2>1, 2>2,
2>3
h = 2>4, 3>* h = 4>*, 5>* - -
Downgrade if aluminium present
(ta = 2 or 3):
h = 1>* h = 2>1, 2>2,
2>3
h = 2>4, 3>* h = 4>*, 5>* -
Alkalinity i Measure pH (water) at surface & deep
subsoil: Surface > Subsoil
1 = < 8.0 1 = < 8.0 2 = 8.0 - 9.2 2 = 8.0 - 9.2
3 = > 9.2 (10-30) 3 = > 9.2
4 = > 9.2 (0-10)
i = 1>1, 1>2,
2>2
i = 1>3, 2>3 i = 3>3 i = 4>3 -
Surface CO3 ka Reaction to 1M HCl Nil to mod. ka = 1,2
Strong ka = 3
- - -
Subsoil CO3 kb Depth to strong reaction to 1M HCl >30 cm
kb = 1,2
< 30 cm
kb = 3
- - -
Inherent
fertility
n Identify soil type High, v. high
n = 1
Moderate
n = 2
Mod. low
n = 3
Low
n = 4
Very low
n = 5
Toxic elements
tb Determine depth to boron levels of > 15 mg/kg
>100 cm tb = 1
50-100 cm tb = 2
25-50 cm tb = 3
10-25 cm tb = 4
<10 cm tb = 5
ts Determine depth to exchangeable
sodium percentage of > 25%
>50 cm
ts = 1,2
25-50 cm
ts= 3
10-25 cm
ts = 4
- <10 cm
ts = 5
Rockiness r Estimate proportion of surface rock and stone
Nil - slight r = 1,2
Picking or rolling
r = 3
Semi arable r = 4
- Non arable r = 5, 6, 8
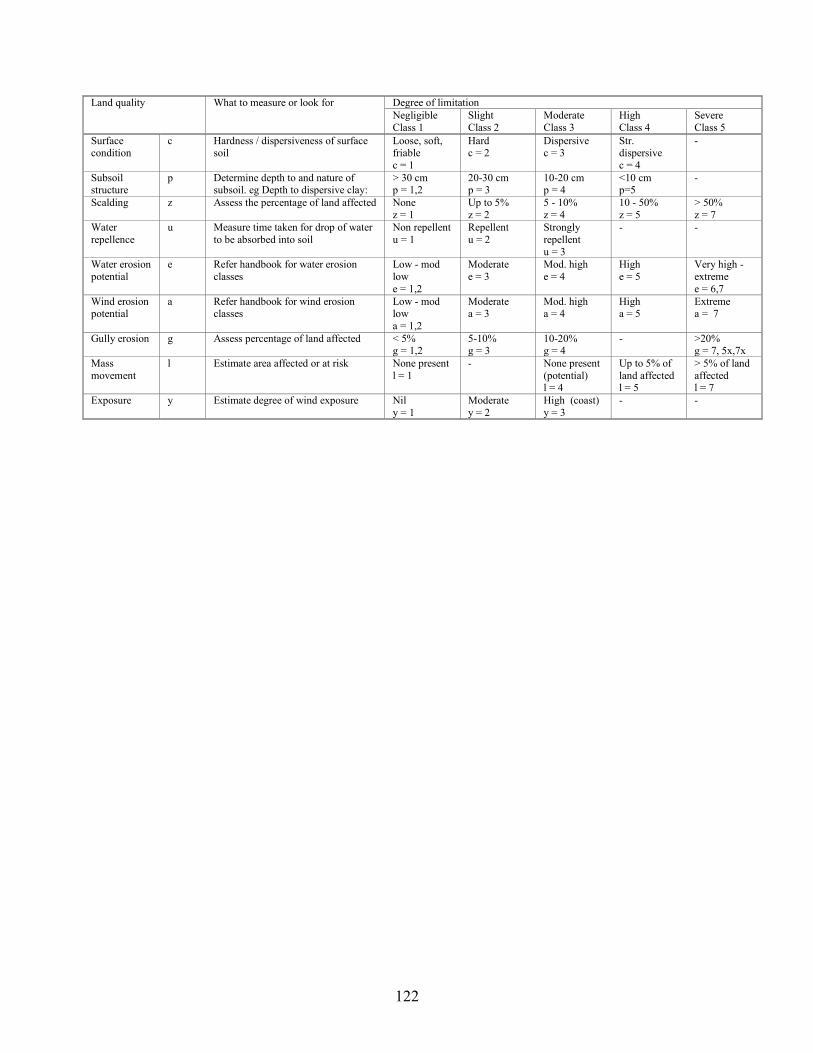
122
Land quality
What to measure or look for Degree of limitation
Negligible
Class 1
Slight
Class 2
Moderate
Class 3
High
Class 4
Severe
Class 5
Surface condition
c Hardness / dispersiveness of surface soil
Loose, soft, friable
c = 1
Hard c = 2
Dispersive c = 3
Str. dispersive
c = 4
-
Subsoil structure
p Determine depth to and nature of subsoil. eg Depth to dispersive clay:
> 30 cm p = 1,2
20-30 cm p = 3
10-20 cm p = 4
<10 cm p=5
-
Scalding z Assess the percentage of land affected None
z = 1
Up to 5%
z = 2
5 - 10%
z = 4
10 - 50%
z = 5
> 50%
z = 7
Water
repellence
u Measure time taken for drop of water
to be absorbed into soil
Non repellent
u = 1
Repellent
u = 2
Strongly
repellent
u = 3
- -
Water erosion
potential
e Refer handbook for water erosion
classes
Low - mod
low
e = 1,2
Moderate
e = 3
Mod. high
e = 4
High
e = 5
Very high -
extreme
e = 6,7
Wind erosion potential
a Refer handbook for wind erosion classes
Low - mod low
a = 1,2
Moderate a = 3
Mod. high a = 4
High a = 5
Extreme a = 7
Gully erosion g Assess percentage of land affected < 5% g = 1,2
5-10% g = 3
10-20% g = 4
- >20% g = 7, 5x,7x
Mass
movement
l Estimate area affected or at risk None present
l = 1
- None present
(potential) l = 4
Up to 5% of
land affected l = 5
> 5% of land
affected l = 7
Exposure y Estimate degree of wind exposure Nil
y = 1
Moderate
y = 2
High (coast)
y = 3
- -

123
Appendix V Appendix V: Source code of the “Crop Advisor” Expert System
1 Code for main screen of “Crop Advisor” (frmMain)
Option Explicit Dim Conn1 As New ADODB.Connection Dim Cmd1 As New ADODB.Command Dim Errs1 As Errors Dim Rs1 As New ADODB.Recordset Dim str1, str2, str3, str4 As String Dim previous_crop As String Dim AccessConnect As String ' Error Handling Variables Dim couter_loop As Integer Dim strTmp As String Dim maincrop As Variant Dim afterwater As Variant Dim afterlab As Variant Dim aftermach As Variant

124
Dim aftergov As Variant Dim crops_name As Variant Dim rainfed_data As Variant Dim Irrigated_data As Variant Dim lab_high_data As Variant Dim farm_crops As Variant Dim lab_med_data As Variant Dim lab_low_data As Variant Dim mach_yes_data As Variant Dim mach_no_data As Variant Dim gov_fav_data As Variant Dim gov_Unfav_data As Variant Dim crops_limit As Integer Dim crops_manipulation() As String Dim temp_str() As String Dim errLoop As Error Private Sub c1_Click() Dim survey As String survey = c1.Text Dim i As Integer AccessConnect = "PROVIDER=Microsoft.Jet.OLEDB.4.0; Data Source= " & _ App.Path & "\data.MDB" Set Conn1 = New ADODB.Connection Conn1.Open AccessConnect ' Conn1.ConnectionString = AccessConnect ' Conn1.Open AccessConnect Set Rs1 = Conn1.Execute("SELECT *From farm WHERE DCDB_ID= '" & c1.Text & "' ") crops_limit = (Rs1.Fields.Count - 2) l1.Clear Do Until Rs1.EOF ' Rs1.MoveFirst For i = 1 To (Rs1.Fields.Count - 1) l1.AddItem "" & Rs1(i) Next i Rs1.MoveNext Loop Rs1.MoveFirst maincrop = Rs1.GetRows

125
ReDim temp_str(crops_limit) As String For i = 1 To crops_limit temp_str(i) = maincrop(i, 0) & "" Next i farm_crops = temp_str Rs1.Close Conn1.Close End Sub Private Sub Combo1_Click() previous_crop = Combo1.Text End Sub Private Sub Command1_Click() results.Clear couter_loop = 0 Dim i, j As Integer usedcrop.Caption = "" AccessConnect = "PROVIDER=Microsoft.Jet.OLEDB.4.0; Data Source= " & _ App.Path & "\data.MDB" Set Conn1 = New ADODB.Connection Conn1.Open AccessConnect If mrkp.Value = 1 Then Dim Rs2 As New ADODB.Recordset Set Rs2 = Conn1.Execute("SELECT Crop, Code FROM crop ORDER BY price DESC") Do Until Rs2.EOF couter_loop = couter_loop + 1 Rs2.MoveNext Loop Rs2.MoveFirst crops_name = Rs2.GetRows Rs2.Close Dim mesage As String mesage = " You have recently grown this crop - " For i = 0 To couter_loop - 1 For j = 0 To crops_limit - 1
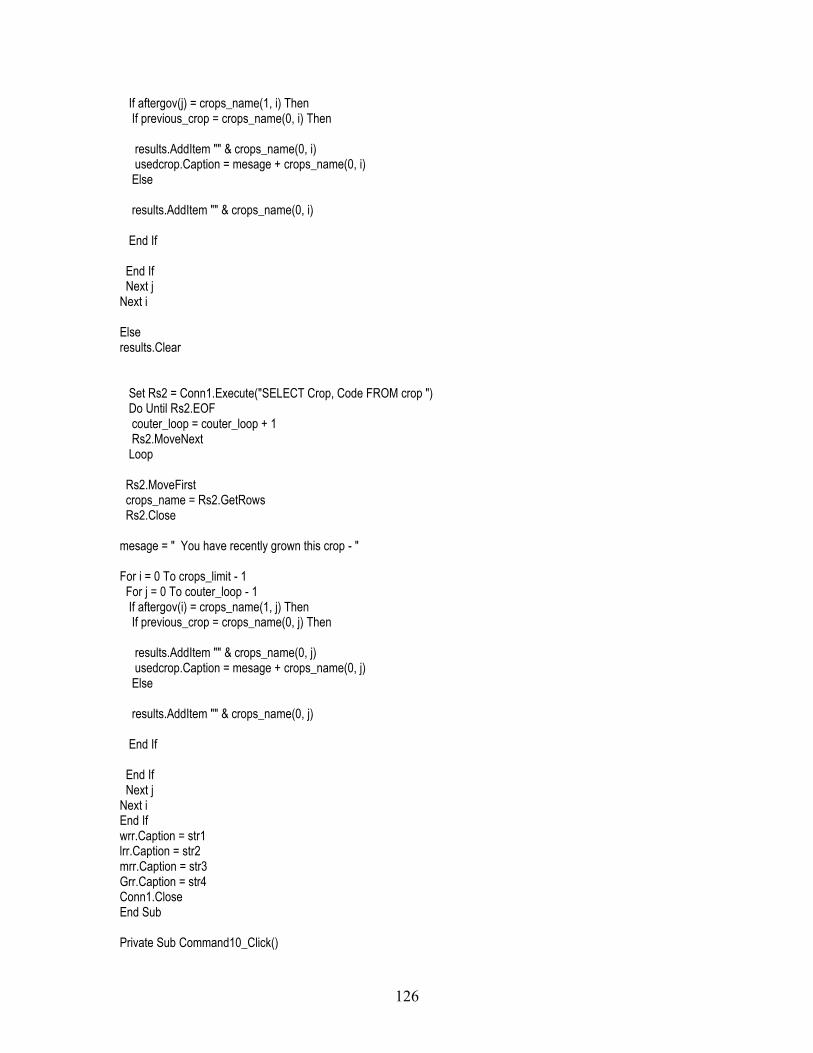
126
If aftergov(j) = crops_name(1, i) Then If previous_crop = crops_name(0, i) Then results.AddItem "" & crops_name(0, i) usedcrop.Caption = mesage + crops_name(0, i) Else results.AddItem "" & crops_name(0, i) End If End If Next j Next i Else results.Clear Set Rs2 = Conn1.Execute("SELECT Crop, Code FROM crop ") Do Until Rs2.EOF couter_loop = couter_loop + 1 Rs2.MoveNext Loop Rs2.MoveFirst crops_name = Rs2.GetRows Rs2.Close mesage = " You have recently grown this crop - " For i = 0 To crops_limit - 1 For j = 0 To couter_loop - 1 If aftergov(i) = crops_name(1, j) Then If previous_crop = crops_name(0, j) Then results.AddItem "" & crops_name(0, j) usedcrop.Caption = mesage + crops_name(0, j) Else results.AddItem "" & crops_name(0, j) End If End If Next j Next i End If wrr.Caption = str1 lrr.Caption = str2 mrr.Caption = str3 Grr.Caption = str4 Conn1.Close End Sub Private Sub Command10_Click()

127
MsgBox "If the previous or current crop shows up in the Suitable Crops list, a message will appear.", vbExclamation, "Warning" End Sub Private Sub Command11_Click() MsgBox "As you select / change the factors and options, the crop choices will change automatically", vbExclamation, "Live Choices" End Sub Private Sub Command12_Click() MsgBox "The crop which was grown last year in the farm you selected. Or the current crop", vbExclamation, "Previous Crop" End Sub Private Sub Command13_Click() Load frmAbout frmAbout.Show End Sub Private Sub Command2_Click() MsgBox "Choose whether your farm depends on Rainwater or Irrigated water crop for raising crops. Some crops require irrigation!", vbExclamation, "Water Availability" End Sub Private Sub Command3_Click() MsgBox "Choose the amount of labour available or how much labour you can supply", vbExclamation, "Labour Availability" End Sub Private Sub Command4_Click() MsgBox "Choose if you have available Machinery or if you can hire Machinery", vbExclamation, "Machinery Availability" End Sub Private Sub Command5_Click() MsgBox "Choose if want to include Government induced factors in the Crop Suitability analysis", vbExclamation, "Govt. Regulations" End Sub Private Sub Command6_Click() MsgBox "Choose if you would like to consider current Market Price and Market Demand for making cropping decisions", vbExclamation, "Market Factors" End Sub Private Sub Command7_Click() MsgBox "Suitable crops for your farm unit based on the factors you chose to analyze.Most suitable crop is listed on Top", vbExclamation, "Suitable Crops" End Sub Private Sub Command8_Click() MsgBox "The factors chosen by you that are considered for Evaluation", vbExclamation, "Analysed Factors" End Sub Private Sub Command9_Click() MsgBox "A message will be displayed below if the Expert System ran out of choices", vbExclamation, "Message" End Sub

128
Private Sub Form_Load() AccessConnect = "PROVIDER=Microsoft.Jet.OLEDB.4.0; Data Source= " & _ App.Path & "\data.MDB" Set Conn1 = New ADODB.Connection Conn1.Open AccessConnect Dim Rs2 As New ADODB.Recordset Set Rs2 = Conn1.Execute("SELECT DCDB_ID FROM farm") Do Until Rs2.EOF c1.AddItem "" & Rs2("DCDB_ID") Rs2.MoveNext Loop Rs2.Close Set Rs2 = Conn1.Execute("SELECT Crop FROM crop") Do Until Rs2.EOF Combo1.AddItem "" & Rs2("Crop") Rs2.MoveNext Loop Rs2.Close Conn1.Close End Sub Private Sub Help_Click() Unload fMainForm End Sub Private Sub irrigated_Click() Dim Rs_irrigated As New ADODB.Recordset couter_loop = 0 str1 = "Irrigated" AccessConnect = "PROVIDER=Microsoft.Jet.OLEDB.4.0; Data Source= " & _ App.Path & "\data.MDB" Set Conn1 = New ADODB.Connection Conn1.Open AccessConnect Set Rs_irrigated = Conn1.Execute("select Code from crop where Water ='Irrigated'") Do Until Rs_irrigated.EOF couter_loop = couter_loop + 1 Rs_irrigated.MoveNext Loop

129
Rs_irrigated.MoveFirst Irrigated_data = Rs_irrigated.GetRows Rs_irrigated.Close Conn1.Close Call crops_compare(farm_crops, Irrigated_data) afterwater = crops_manipulation Call display_crops_listbox(afterwater) End Sub Private Sub labhigh_Click() Dim Rs_labhigh As New ADODB.Recordset couter_loop = 0 str2 = "Labour High" AccessConnect = "PROVIDER=Microsoft.Jet.OLEDB.4.0; Data Source= " & _ App.Path & "\data.MDB" Set Conn1 = New ADODB.Connection Conn1.Open AccessConnect Set Rs_labhigh = Conn1.Execute("select Code from crop where Labour ='Low' or Labour ='Medium' or Labour ='High' ") ' Do Until Rs_labhigh.EOF couter_loop = couter_loop + 1 Rs_labhigh.MoveNext Loop Rs_labhigh.MoveFirst lab_high_data = Rs_labhigh.GetRows Rs_labhigh.Close Conn1.Close Call crops_compare(afterwater, lab_high_data) afterlab = crops_manipulation Call display_crops_listbox(afterlab) End Sub Private Sub labignore_Click() afterlab = afterwater Call display_crops_listbox(afterlab) str2 = " The Labour Factor is Ignored" End Sub Private Sub lablow_Click() Dim Rs_lablow As New ADODB.Recordset

130
couter_loop = 0 str2 = "Labour Low" AccessConnect = "PROVIDER=Microsoft.Jet.OLEDB.4.0; Data Source= " & _ App.Path & "\data.MDB" Set Conn1 = New ADODB.Connection Conn1.Open AccessConnect Set Rs_lablow = Conn1.Execute("select Code from crop where Labour ='Low' ") Do Until Rs_lablow.EOF couter_loop = couter_loop + 1 Rs_lablow.MoveNext Loop Rs_lablow.MoveFirst lab_low_data = Rs_lablow.GetRows Rs_lablow.Close Conn1.Close Call crops_compare(afterwater, lab_low_data) afterlab = crops_manipulation Call display_crops_listbox(afterlab) End Sub Private Sub labmed_Click() Dim Rs_labmed As New ADODB.Recordset couter_loop = 0 str2 = "Labour Medium" AccessConnect = "PROVIDER=Microsoft.Jet.OLEDB.4.0; Data Source= " & _ App.Path & "\data.MDB" Set Conn1 = New ADODB.Connection Conn1.Open AccessConnect Set Rs_labmed = Conn1.Execute("select Code from crop where Labour ='Low' or Labour ='Medium' ") Do Until Rs_labmed.EOF couter_loop = couter_loop + 1 Rs_labmed.MoveNext Loop Rs_labmed.MoveFirst lab_med_data = Rs_labmed.GetRows Rs_labmed.Close Conn1.Close Call crops_compare(afterwater, lab_med_data) afterlab = crops_manipulation Call display_crops_listbox(afterlab) End Sub

131
Private Sub mach_ignore_Click() aftermach = afterlab Call display_crops_listbox(aftermach) str3 = "Factor ignored" End Sub Private Sub mach_no_Click() Dim Rs_machno As New ADODB.Recordset couter_loop = 0 str3 = "No" AccessConnect = "PROVIDER=Microsoft.Jet.OLEDB.4.0; Data Source= " & _ App.Path & "\data.MDB" Set Conn1 = New ADODB.Connection Conn1.Open AccessConnect Set Rs_machno = Conn1.Execute("select Code from crop where Machinery ='No' ") Do Until Rs_machno.EOF couter_loop = couter_loop + 1 Rs_machno.MoveNext Loop Rs_machno.MoveFirst mach_no_data = Rs_machno.GetRows Rs_machno.Close Conn1.Close Call crops_compare(afterlab, mach_no_data) aftermach = crops_manipulation Call display_crops_listbox(aftermach) End Sub Private Sub mach_yes_Click() Dim Rs_machyes As New ADODB.Recordset couter_loop = 0 str3 = "Yes" AccessConnect = "PROVIDER=Microsoft.Jet.OLEDB.4.0; Data Source= " & _ App.Path & "\data.MDB" Set Conn1 = New ADODB.Connection Conn1.Open AccessConnect Set Rs_machyes = Conn1.Execute("select Code from crop where Machinery ='Yes' ") Do Until Rs_machyes.EOF couter_loop = couter_loop + 1 Rs_machyes.MoveNext Loop Rs_machyes.MoveFirst mach_yes_data = Rs_machyes.GetRows Rs_machyes.Close Conn1.Close Call crops_compare(afterlab, mach_yes_data)
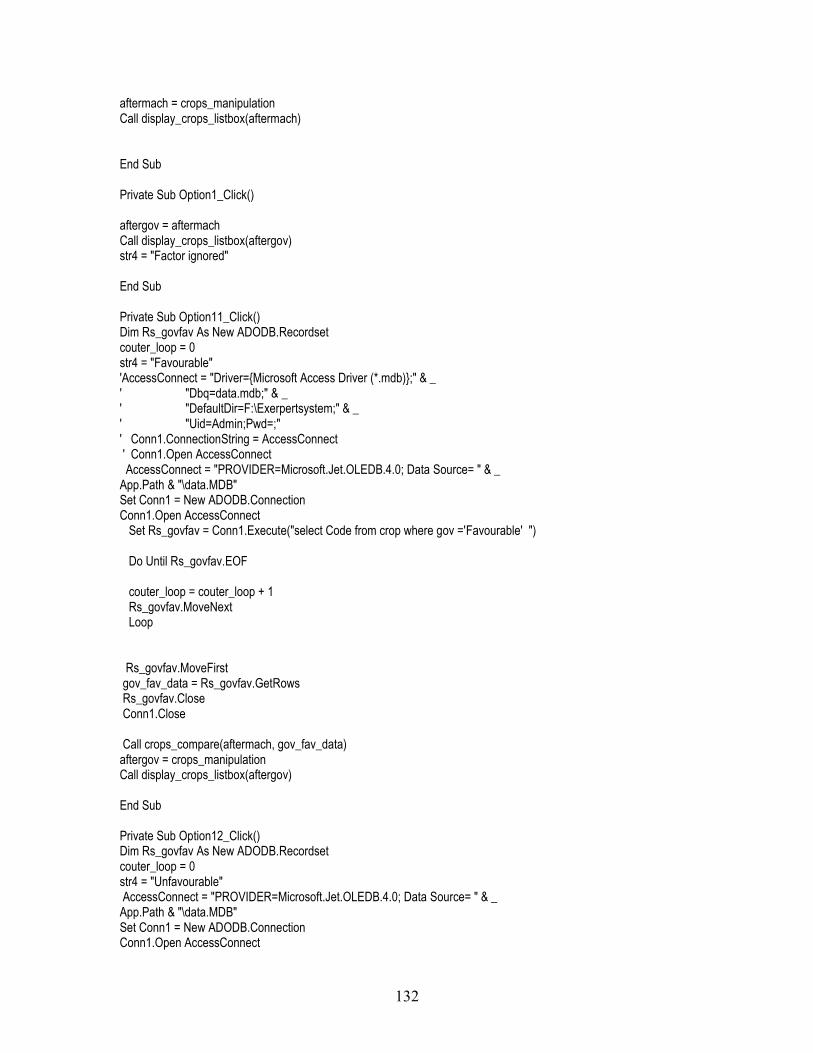
132
aftermach = crops_manipulation Call display_crops_listbox(aftermach) End Sub Private Sub Option1_Click() aftergov = aftermach Call display_crops_listbox(aftergov) str4 = "Factor ignored" End Sub Private Sub Option11_Click() Dim Rs_govfav As New ADODB.Recordset couter_loop = 0 str4 = "Favourable" 'AccessConnect = "Driver={Microsoft Access Driver (*.mdb)};" & _ ' "Dbq=data.mdb;" & _ ' "DefaultDir=F:\Exerpertsystem;" & _ ' "Uid=Admin;Pwd=;" ' Conn1.ConnectionString = AccessConnect ' Conn1.Open AccessConnect AccessConnect = "PROVIDER=Microsoft.Jet.OLEDB.4.0; Data Source= " & _ App.Path & "\data.MDB" Set Conn1 = New ADODB.Connection Conn1.Open AccessConnect Set Rs_govfav = Conn1.Execute("select Code from crop where gov ='Favourable' ") Do Until Rs_govfav.EOF couter_loop = couter_loop + 1 Rs_govfav.MoveNext Loop Rs_govfav.MoveFirst gov_fav_data = Rs_govfav.GetRows Rs_govfav.Close Conn1.Close Call crops_compare(aftermach, gov_fav_data) aftergov = crops_manipulation Call display_crops_listbox(aftergov) End Sub Private Sub Option12_Click() Dim Rs_govfav As New ADODB.Recordset couter_loop = 0 str4 = "Unfavourable" AccessConnect = "PROVIDER=Microsoft.Jet.OLEDB.4.0; Data Source= " & _ App.Path & "\data.MDB" Set Conn1 = New ADODB.Connection Conn1.Open AccessConnect

133
Set Rs_govfav = Conn1.Execute("select Code from crop where gov ='Unfavourable' ") Do Until Rs_govfav.EOF couter_loop = couter_loop + 1 Rs_govfav.MoveNext Loop Rs_govfav.MoveFirst gov_Unfav_data = Rs_govfav.GetRows Rs_govfav.Close Conn1.Close Call crops_compare(aftermach, gov_Unfav_data) aftergov = crops_manipulation Call display_crops_listbox(aftergov) End Sub Private Sub rainfed_Click() Dim Rs_rainfed As New ADODB.Recordset couter_loop = 0 str1 = " Rainfed" AccessConnect = "PROVIDER=Microsoft.Jet.OLEDB.4.0; Data Source= " & _ App.Path & "\data.MDB" Set Conn1 = New ADODB.Connection Conn1.Open AccessConnect Set Rs_rainfed = Conn1.Execute("select Code from crop where Water ='Rainfed'") Do Until Rs_rainfed.EOF couter_loop = couter_loop + 1 Rs_rainfed.MoveNext Loop Rs_rainfed.MoveFirst rainfed_data = Rs_rainfed.GetRows Rs_rainfed.Close Conn1.Close Call crops_compare(farm_crops, rainfed_data) afterwater = crops_manipulation Call display_crops_listbox(afterwater) End Sub Private Sub crops_compare(var1 As Variant, var2 As Variant) Dim i As Integer

134
Dim j As Integer Dim counter As Integer ReDim crops_manipulation(crops_limit) As String counter = 0 For i = 0 To couter_loop - 1 For j = 0 To crops_limit If var1(j) = var2(0, i) Then crops_manipulation(counter) = var1(j) counter = counter + 1 End If Next j Next i If counter = 0 Then warning.Caption = " Please reconsider your options because the system has run out of crop choices" Else warning.Caption = "" End If End Sub Private Sub display_crops_listbox(var1 As Variant) l1.Clear Dim i As Integer For i = 0 To crops_limit l1.AddItem "" & var1(i) Next i End Sub Private Sub waterignore_Click() str1 = "Water factor is ignored" ReDim temp_str(crops_limit) As String Dim i As Integer For i = 1 To crops_limit temp_str(i) = maincrop(i, 0) & "" Next i afterwater = temp_str Call display_crops_listbox(afterwater) End Sub

135
2 frmAbout (About Screen of “Crop Advisor” Expert System)
Option Explicit Private Sub cmdOK_Click() Unload Me End Sub
3 frmSplash (Splash Screen for “Crop Advisor” Expert System)
Option Explicit 'Set timer to unload splash screen after a certain time frame. Private Sub Timer1_Timer() Unload Me fMainForm.Enabled = True End Sub
4 Module1 (Startup module)
Public fMainForm As Form1
Sub Main() frmSplash.Show frmSplash.Refresh Set fMainForm = New Form1 Load fMainForm Unload frmSplash fMainForm.Show End Sub

136
Appendix VI
Appendix VI: Screenshots of the “Crop Advisor” Expert System version 1.0
Main screen of “Crop Advisor” 1.0
Executing “Crop Advisor” 1.0
Recommended