JnNURM
City Development Plan Pune Cantonment Board
DRAFT REPORT, NOVEMBER 2013
CREATIONS ENGINEER’S PRIVATE LIMITED

City Development Plan – Pune Cantonment Board JnNURM
2 Draft Final Report
Abbreviations
WORDS
ARV Annual Rental Value
CDP City Development Plan
CEO Chief Executive Officer
CIP City Investment Plan
CPHEEO Central Public Health and Environmental Engineering Organisation
FOP Financial Operating Plan
JNNURM Jawaharlal Nehru National Urban Renewal Mission
KDMC Kalyan‐Dombivali Municipal Corporation
LBT Local Body Tax
MoUD Ministry of Urban Development
MSW Municipal Solid Waste
O&M Operation and Maintenance
PCB Pune Cantonment Board
PCMC Pimpri‐Chinchwad Municipal Corporation
PCNTDA Pimpri‐Chinchwad New Town Development Authority
PMC Pune Municipal Corporation
PMPML Pune MahanagarParivahanMahamandal Limited
PPP Public Private Partnership
SLB Service Level Benchmarks
STP Sewerage Treatment Plant
SWM Solid Waste Management
WTP Water Treatment Plant UNITS

City Development Plan – Pune Cantonment Board JnNURM
3 Draft Final Report
Km Kilometer
KW Kilo Watt
LPCD Liter Per Capita Per Day
M Meter
MM Millimeter
MLD Million Litres Per Day
Rmt Running Meter
Rs Rupees
Sq. Km Square Kilometer
Tn Tonne

City Development Plan – Pune Cantonment Board JnNURM
4 Draft Final Report
Contents
ABBREVIATIONS .................................................................................................................................... 2
LIST OF TABLES ...................................................................................................................................... 8
LIST OF FIGURES .................................................................................................................................. 10
1. EXECUTIVE SUMMARY ............................................................................................................... 11
2. BACKGROUND ............................................................................................................................... 18
2.1 Objectives: ........................................................................................................................................... 19
2.2 CDP‐A Process ...................................................................................................................................... 19 2.2.1 City Assessment: Analysis of Existing Situation .......................................................................................... 19 2.2.2 Development of Strategic Agenda and a Vision for the City ...................................................................... 20 2.2.3 Structure of the Report .............................................................................................................................. 21
3. CDP FOR PUNE CANTONMENT ................................................................................................ 22
3.1 Need for CDP for Pune Cantonment Board ............................................................................................ 22
3.2 Approach and Methodology ................................................................................................................. 22
4. PUNE & PUNE CANTONMENT .................................................................................................. 25
4.1 About Pune .......................................................................................................................................... 25 4.1.1 Pune District ............................................................................................................................................... 25 4.1.2 Pune Metropolitan Region ......................................................................................................................... 25 4.1.3 Pune ........................................................................................................................................................... 26 4.1.4 Physiography and Geography .................................................................................................................... 28 4.1.5 Climate ....................................................................................................................................................... 28 4.1.6 Linkages and Connectivity .......................................................................................................................... 29 4.1.7 Rail Connectivity ......................................................................................................................................... 29 4.1.8 Air Connectivity .......................................................................................................................................... 29 4.1.9 Administration ........................................................................................................................................... 30
4.2 Cantonments ........................................................................................................................................ 30 4.2.1 History ............................................................................................................................................................ 30 4.2.2 Development of Cantonments ....................................................................................................................... 31 4.2.3 History of Pune Cantonment Board ............................................................................................................... 32 4.2.4 Major Obligatory Functions of Pune Cantonment Board ............................................................................... 32
City Development Plan – Pune Cantonment Board JnNURM
5 Draft Final Report
4.2.5 Major Discretionary Functions ....................................................................................................................... 33
4.3 Demographic Profile of Pune Cantonment Board .................................................................................. 33
4.4 Other Demographic Indicators ..................................................................................................................... 34 4.4.1 Sex Ratio ......................................................................................................................................................... 34 4.4.2 Literacy Rate ................................................................................................................................................... 34 4.4.3 Spatial Distribution ......................................................................................................................................... 34 4.4.4 Landuse Planning ........................................................................................................................................... 35
5. GOVERNANCE &INSTITUTIONAL FRAMEWORK ............................................................... 36
5.1 Institutional Structure of PCB ................................................................................................................ 39 5.1.1 Public Works Department .......................................................................................................................... 39 5.1.2 Revenue Section ......................................................................................................................................... 40 5.1.3 Health Department .................................................................................................................................... 41 5.1.4 Accounts Department ................................................................................................................................ 43 5.1.5 Central Stores ............................................................................................................................................. 44 5.1.6 Fire Brigade ................................................................................................................................................ 44 5.1.7 Electrical Department ................................................................................................................................ 45
6. INFRASTRUCTURE ASSESSMENT ........................................................................................... 46
6.1 Water Supply ........................................................................................................................................ 46 6.1.1 Source of Water Supply .............................................................................................................................. 46 6.1.2 Primary Storage, Treatment, Transmission and Distribution ..................................................................... 47 6.1.3 Issues .......................................................................................................................................................... 48 6.1.4 Strategies ................................................................................................................................................... 48
6.2 Sewerage and Sanitation ...................................................................................................................... 49 6.2.1 Sewerage generation and treatment ......................................................................................................... 49 6.2.2 Existing Sewerage Conveyance System ...................................................................................................... 49 6.2.3 Issues: ......................................................................................................................................................... 50 6.2.4 Strategies: .................................................................................................................................................. 50
6.3 Solid Waste Management ..................................................................................................................... 51 6.3.1 Quantity of Waste Generated: ................................................................................................................... 51 6.3.2 Waste Segregation: .................................................................................................................................... 51 6.3.3 Waste Collection and Transportation ........................................................................................................ 51 6.3.4 Processing and Disposal of Waste: ............................................................................................................. 52 6.3.5 Bio‐Medical Waste: .................................................................................................................................... 53 6.3.6 Issues: ......................................................................................................................................................... 53 6.3.7 Strategies: .................................................................................................................................................. 53
6.4 Storm Water Drainage .......................................................................................................................... 54 6.4.1 Issues .......................................................................................................................................................... 55
City Development Plan – Pune Cantonment Board JnNURM
6 Draft Final Report
6.4.2 Strategies ................................................................................................................................................... 55
6.5 Urban Roads, Traffic & Transportation .................................................................................................. 56 6.5.1 Road Network ............................................................................................................................................ 56 6.5.2 Public Transportation: ................................................................................................................................ 56 6.5.3 Key issues in traffic and transportation ..................................................................................................... 57
6.6 Street Lighting ...................................................................................................................................... 58
6.7 Fire Fighting .......................................................................................................................................... 59
6.8 Social Infrastructure ............................................................................................................................. 59 6.8.1 Educational Facilities: ................................................................................................................................. 59 6.8.2 Health Facilities: ......................................................................................................................................... 61 6.8.3 Recreational and Other Facilities: .............................................................................................................. 63
6.9 Urban Environment: ............................................................................................................................. 65
7. CAPITAL INVESTMENT PLAN .................................................................................................. 68
7.1 Total Investment Requirement ............................................................................................................. 69
7.2 Sewerage .............................................................................................................................................. 70
7.3 Storm Water Drainage .......................................................................................................................... 71
7.4 Solid Waste Management ..................................................................................................................... 71
7.5 Road Improvements ............................................................................................................................. 72
PRINCE OF WALES DRIVE ................................................................................................................................... 74
7.6 Streetlighting ........................................................................................................................................ 74
7.7 Urban Greenery .................................................................................................................................... 75
7.8 Reforms ................................................................................................................................................ 75
7.9 Hospitals & Schools .............................................................................................................................. 75
7.10 Modern Slaughter House ...................................................................................................................... 76
7.11 Fire‐fighting .......................................................................................................................................... 76
7.12 Vacant Land Development for Infrastructure Facilities .......................................................................... 77
8. FINANCIAL ASSESSMENT & FINANCIAL OPERATING PLAN ........................................... 78

City Development Plan – Pune Cantonment Board JnNURM
7 Draft Final Report
8.1 Financial Planning and Accounting System ............................................................................................ 78
8.2 Status of Finance .................................................................................................................................. 78
8.3 Revenue Account .................................................................................................................................. 79 8.3.1 Revenue Receipts ....................................................................................................................................... 79 8.3.2 Revenue Expenditure ................................................................................................................................. 83
8.4 Capital Account .................................................................................................................................... 86 8.4.1 Capital Income ........................................................................................................................................... 86 8.4.2 Capital Expenditure .................................................................................................................................... 87
8.5 Financial Indicator ................................................................................................................................ 87
8.6 Financial Operating Plan ....................................................................................................................... 87
9. REFORM IMPLEMENTATION STATUS AND ROAD MAP ................................................ 92
9.1 Status of Reforms at PCB ...................................................................................................................... 93
9.2 Migration to Double Entry Accounting System ...................................................................................... 94
9.3 E‐governance ........................................................................................................................................ 95
10. STAKEHOLDER CONSULTATION ........................................................................................ 97
11. ANNEXURE – RECAST ACCOUNTS ....................................................................................... 99
City Development Plan – Pune Cantonment Board JnNURM
8 Draft Final Report
List of Tables
Table 1: Population, Area and Density ........................................................................................................ 33 Table 2: Area‐wise Break‐up ...................................................................................................................... 34 Table 3: Broad Landuse ............................................................................................................................... 35 Table 4: Staff Strength – Actual vs Sanctioned ........................................................................................... 39 Table 5: Staff Strength – Public Works Department (Engineering Department) ........................................ 40 Table 6: Staff Strength – Revenue Section .................................................................................................. 41 Table 7: Staff Strength – Health Department ............................................................................................. 42 Table 8: Staff Strength – Fire Department .................................................................................................. 44 Table 9: Staff Strength – Electrical Department ......................................................................................... 45 Table 10: Source of Water Supply ............................................................................................................... 47 Table 11: Treatment Facility ....................................................................................................................... 48 Table 12: Status of Sewerage Network ....................................................................................................... 50 Table 13: Vehicular Fleet ‐ SWM ................................................................................................................. 52 Table 14: Details of Drains .......................................................................................................................... 54 Table 15: Water Logging Areas ................................................................................................................... 54 Table 16: Public Transportation ‐ Fleet ....................................................................................................... 56 Table 17: Streetlighting – No. of Poles and Fixtures ................................................................................... 58 Table 18: Streetlighting ‐ Load .................................................................................................................... 58 Table 19: Educational Institutes in PCB Area .............................................................................................. 60 Table 20: Recreational Spaces .................................................................................................................... 63 Table 21: Proposed Plantation .................................................................................................................... 66 Table 22: Total Investment Requirement (Rs in lakhs) ............................................................................... 69 Table 23: Investment Requirement ‐ Sewerage ......................................................................................... 70 Table 24: Investment Requirement ‐ Sanitation ......................................................................................... 70 Table 25: Investment Requirement – Storm Water Drainage .................................................................... 71 Table 26: Investment Requirement – SWM ................................................................................................ 71 Table 27: Investment Requirement – Roads ............................................................................................... 72 Table 28: Investment Requirement – Streetlight ....................................................................................... 74 Table 29: Land Development ...................................................................................................................... 77 Table 30: Financial Status at a Glance (Rs in Lakhs) .................................................................................... 79 Table 31: Details of Revenue Receipts (Rs in Lakhs) .................................................................................. 79 Table 32: Break‐up of Tax Receipts (Rs in Lakhs) ........................................................................................ 80 Table 33: Property Taxation ........................................................................................................................ 81 Table 34: Total No. of Properties ................................................................................................................ 81 Table 35: Demand‐Collection – Property Tax (Rs in Lakhs) ........................................................................ 82 Table 36: Vehicle Entry Tax ......................................................................................................................... 82 Table 37: Non‐Tax Revenue ........................................................................................................................ 83 Table 38: Revenue Expenditure (Rs in Lakhs) ............................................................................................. 84 Table 39: O&M Expenditure (Rs in Lakhs) .................................................................................................. 86 Table 40: Capital Income (Rs in Lakhs) ........................................................................................................ 86

City Development Plan – Pune Cantonment Board JnNURM
9 Draft Final Report
Table 41: Capital Expenditure (Rs in Lakhs) ................................................................................................ 87 Table 42: Financial Indicators (Rs in Lakhs)................................................................................................. 87 Table 43: Financial Assumptions (Rs in Lakhs) ............................................................................................ 89 Table 44: Projected Cash‐flow Statement .................................................................................................. 89 Table 45: Detail Projections ........................................................................................................................ 90

City Development Plan – Pune Cantonment Board JnNURM
10 Draft Final Report
List of Figures
Figure 1: Multi‐Stage Process ..................................................................................................................... 24 Figure 2: Pune Metropolitan Region ........................................................................................................... 26 Figure 3: Dumping of Solid Waste ............................................................................................................... 52 Figure 4: Vermi‐Composting Facility ........................................................................................................... 53 Figure 5: Road Side Pay and Park Facility.................................................................................................... 57 Figure 6: Medical Facilities in Cantonment Area ........................................................................................ 61 Figure 7: Market Place Maintained by Cantonment Board ........................................................................ 65 Figure 8: Urban Greenery ........................................................................................................................... 65 Figure 9: Composition of Revenue Expenditure ......................................................................................... 84 Figure 10: Composition of Establishment Expenditure .............................................................................. 85 Figure 11: Composition of O&M Expenditure ............................................................................................ 85
City Development Plan – Pune Cantonment Board JnNURM
11 Draft Final Report
1. EXECUTIVE SUMMARY
Jawaharlal Nehru National Urban Renewal Mission (JNNURM) focuses on (i) improving and augmenting the economic and social infrastructure of cities; (ii) ensuring basic services to the urban poor including security of tenure at affordable prices; (iii) initiating wide‐ranging urban sector reforms whose primary aim is to eliminate legal, institutional and financial constraints that have impeded management of, and investment in, urban infrastructure and services; and (iv) strengthening municipal governments and their functioning in accordance with the provisions of the 74th Constitution Amendment Act, 1992.
JNNURM comprises of two sub‐missions, namely
(i) Sub‐Mission for Urban Infrastructure and Governance, including water supply, sewerage and sanitation, solid waste management, urban transport, redevelopment of core areas, development of heritage, and environment.
(ii) Sub‐Mission for Basic Services to the Urban Poor, including shelter, infrastructure services and related civic amenities
Need for CDP for Pune Cantonment Board
There is a general perspective that Cantonments are purely defence area for military purpose. Looking back into the history of formation of Cantonment Area, one would reveal that although Cantonment Area started for military support purpose, however, over the years and based on the provisions in the Cantonment Act, Cantonment Area are equally civil area with people habitating along with commercial and social activities. The military area under the Cantonment Area is required to have restricted usage. The Cantonments are administered by the Cantonment Board which is responsible for providing all the infrastructure services within this jurisdiction including water supply, sewerage, solid waste management, roads, streetlights, health & educational facilities etc. The Cantonment Board itself comprises of Elected Members from the different wards. In nutshell, Cantonments except the military area within it work largely like any Urban Local Body in the country.
Providing support for infrastructure development in Cantonment Area has been duly recognized under the revised guidelines of JNNURM.
Ministry of Defence has thus stated that the Cantonment Boards should take into account the next phase of City Development Plan and should prepare a document for

City Development Plan – Pune Cantonment Board JnNURM
12 Draft Final Report
development of the area. While Pune Municipal Corporation and Pimpri Chinchwad Municipal Corporation initiated preparing the CDP for their jurisdiction, PCB decided to prepare its planning through a CDP process and explore opportunities of integrating with the CDP of PMC as it falls within the jurisdiction of PMC.
This CDP is based on an assessment of the existing situation, and outlines a vision for development, strategies for achieving this; indicative investment requirements and financial operating plans, indicating how investments made are to be sustained. The CDP will facilitate identification of projects. Pune Cantonment Board will then prepare DPR for the projects. The current status of sectors covered under JNNURM for Pune Cantonment Board is presented below.
City Assessment: Urban Infrastructure and Governance
The British Indian Army had a small encampment west of the Mula River in Khadki. As more troops were required to be accommodated, a larger area was occupied to the west of the Mutha River, leading to the establishment of the Pune Cantonment in 1817 for accommodating troops of the British Indian Army. The villages of Mali, Munjeri, Wanowrie and Ghorpuri (Ghorpadi) were selected for this purpose. Initially, a garrison for 4,620 troops was planned for the cantonment. This included two European regiments, a mountain battery, a native cavalry and three native regiments. A central belt of 130 acres (0.53 km2) was designated for training and drills. The firing ranges were located at Golibar Maidan. Soon a large number of civilians began settling in the area. This was encouraged since civilians provided services to troops garrisoned in the cantonment. The limit of the cantonment was extended in 1822. In 1963, Ghorpuri Village (Ghorpadi) and Fatima Nagar were merged into cantonment area. The limit of the cantonment was again extended in the same year when Mundhwa village was included in the cantonment.
Pune Cantonment Board is the administrative body for the region of Pune Cantonment in the state of Maharashtra in India. It was established in the year 1817. This cantonment is a Class I Cantonment as per the Cantonments Act, 2006 by the Government of India.
Pune Cantonment is a part of the Pune Lok Sabha constituency. Pune Cantonment is a separate constituency of the Maharashtra Legislative Assembly (Vidhan Sabha).
City Development Plan – Pune Cantonment Board JnNURM
13 Draft Final Report
Demographic Profile
The population of Pune Cantonment Board area as per 2011 Census is recorded as 71,781 persons. Over the years the population of Cantonment decreased due to shift from residential to commercial activity. Also the area of Cantonment Board is fixed and most of the areas of the Cantonment Board are already developed and there is no horizontal expansion possible.
Landuse and Urban Growth
Due to non‐availability of documentation with respect to physical master plan and policies, many areas as per discussion with officials have changed their landuse especially converting from residential to mixed‐use owning to commercial potential. The PCB authority has recently initiated the survey of each parcel of land to identify the existing land use pattern; the survey is on‐going. Based on the discussion, the broad landuse pattern of the entire area of PCB can be classified as pure residential, which is the Bungalow area with certain areas developed for institutional purpose and in total constitutes about 81% of the total area; Mundhwa area which is predominantly industrial area comprise of 9%, mix use of residential cum commercial activity comprise of 10%.
Governance and Institutional Framework
The Cantonments are governed by the Cantonments Act 2006. All policies and powers to plan and provide services and levy of taxes and charges are governed by the Cantonments Act. Cantonments Act, 2006 came into effect on 18‐12‐2006 replacing the old Cantonments Act of 1924. Pune Cantonment is categorized as Category I Cantonment. Like any other Municipality and Corporation Act, this Act also outlines the functions, powers and duties of the Cantonment Board for all the Development activities to take place. The Board has general power of taxation, supervision and provision of all sanitation activities, supply of water and drainage and sewage collection. The Board also has provisions for preparation of spatial plan for Land use under Town Planning and Control over Buildings. There are eight Departments which are responsible for all the developmental works in the Cantonment Board, maintenance of infrastructure, collection of taxes, preparation of Developmental Plans and Budgets which are Public Works Department, Revenue Section, Health Department, Accounts Department, Central Stores, Fire Brigade and Electrical Department.

City Development Plan – Pune Cantonment Board JnNURM
14 Draft Final Report
Water Supply
The water supply in the Cantonment Area is provided and managed by Pune Municipal Corporation. Specific information with respect to Cantonment Area for water supply is not available. Source of water supply to the city is through rivers, dams and lakes. Ground water is also another important source of water. The water is treated in the Water Treatment Plants. Cantonment Board area is served by the Cantonment area WTP which has an installed capacity of 380 MLD. Apart from serving the Cantonment area, it also serves, Solapur road, Kondhwa, Kharadi, Thackercy Hill and Wanowrie.
Issues:
• The Cantonment WTP is 120 years old and needs replacement and augmentation.
• There is substantial loss of water which is unaccounted for resulting in leakage and loss of water pressure
• Inequitable distribution of water
• No metered Connection
Sewerage and Sanitation
The total generation of sewerage as on date is in the range of about 20 MLD. Based on future projection, the estimated requirement for sewerage is about 30 MLD.At present there is no Sewerage Treatment Plan (STP) in the area and all the generated sewerage from kitchen and bathrooms is disposed in natural drains.PCB has already earmarked land for setting up STPs. It is possible to set up 2 STPs at two different locations to save on pumping cost. Of the total existing network, about 40% is about more than 20 years old and balance 60% is laid in the past 10 years. Wanorie bazaar, Ghorpadi Village, Fatimanagar and some parts of Civil area – all this area would require replacement of the old network. At present there is no network in Bungalow area. It is estimated that about about 35 kms would be the requirement of new conveyance network of varying diameter. Issues:
• No Sewerage Treatment Facility
• Only 48% of area covered with the network
Solid Waste Management
Pune Cantonment Board is responsible for collection, scientific segregation, transportation, processing and disposal of waste generated within its jurisdiction. Amount of Waste generated on daily basis is about 40 to 50 TPD considering the floating population. Based on the future population estimates, the waste generation would be
City Development Plan – Pune Cantonment Board JnNURM
15 Draft Final Report
to the tune of 65 TPD. PCB has banned use of Polythene in Cantonment Area. The move was published through various means to bring the awareness. PCB has appointed a private entity for door‐to‐door collection of garbage from civil area and hotel, eateries and restaurants.10 no. of hydraulic Hopper Tempos and three tipper vehicles are used for the same. The transportation of waste is done through compactor, tippers and skip loaders. The present total number of vehicle are adequate for waste collection and transportation, however, tipper and skip loader are more than 10 years old and need to be replaced. The present location of dumping of waste is at 120/298 Mauje Hadapsar Industrial Estate. There is also a vermin‐composting plant and screening machine facility available. Issues:
• The existing tipper and skip loader have lived their life and need replacement
• Need to create infrastructure for scientific landfill
• Segregation of waste at source needs to be introduced
• The present vermin‐composting facility need to be strengthen
Storm Water Drainage:
The Cantonment area has mixed of underground and surface drain system for collection and conveyance of rain water. A total of about 10 kms is the storm water drainage network comprising of 5.5 kms of underground pipe network and 4.5 kms of surface drains. The drainage system network in the Cantonment area has limited coverage, with covered roadside drain network available for selected and major roads. There are nine locations which are found to be water logging during heavy rains and monsoon. It is estimated that about 106 kms should be the total drain length in PCB area to cater to rain water and accordingly about 96 kms is the requirement of new drains. Issues:
• The topography of the city is supportive of the natural drainage system
• Low network coverage of Storm water drainage
• Absence of integrated network resulting in the rainwater being carried by roads, pathways etc.
Traffic & Transportation:
The total road length network in the PCB jurisdiction is about 75 kms. Of the total road length about 48 kms are managed by PCB, 22 kms by Military Engineering Services (MES) and 5 kms by Public Works Department (PWD). It is found that majority of the road network has bituminous surface, however, about 10 kms of road surface require refurbishment. Geographically being located centrally and having large scale commercial activity, there is need for foot over bridges/ underpass at few locations for safety of
City Development Plan – Pune Cantonment Board JnNURM
16 Draft Final Report
pedestrian movement and need for flyovers at critical junction of Golibar Maidan and at Gorpudi railway crossing. Also there is need for multilevel car parking facility which PCB desires to develop. In terms of public transport service Pune Mahanagar Parivahan Mahamandal Ltd. (PMPML) provides the public transport facility for in the Pune Cantonment Board.
Social Infrastructure:
The Pune Cantonment Board within its jurisdiction runs 3 high schools and 5 primary schools of Marathi medium and 1 English medium high school with total student strength of about 4560. As per discussions with the official’s one of the school i.e. Ambedkar School needs renovation to the present days requirement. In the Cantonment Area, the Board maintains a 100 bedded hospital with separate wards and surgical facilities. In addition, there are three dispensaries. A total of 2989 indoor patients and 95,414 outdoor patients were treated during 2011‐12. The 100 bedded hospital needs up‐gradation in terms of infrastructure and other facilities and developing it as a multispecialty hospital.
Vision and Strategies for Development:
The area under PCB is almost the heart of the Pune city and attracts the population from the entire city for various purposes. It is thus the Endeavour of PCB to provide adequate and quality infrastructure services in the area to the residents as well as the people visiting the area of job and recreational purposes.
Capital Investment Plan
To achieve this vision, the entire infrastructure assessment was carried out based on the existing situation and future gap. The total investment requirement of PCB is estimated to be
about Rs 235 crores. The identified investment would be made over a period of 2‐3 years. It may be noted that the project cost estimated is in constant prices, while during actual implementation the project cost would be higher considering inflation of materials and this is estimated to be Rs 288 crores.

City Development Plan – Pune Cantonment Board JnNURM
17 Draft Final Report
S. No.
Projects Base Cost Escalated Cost
1 Sewerage 9,130 11,1852 Solid Waste Management 920 1,1273 Storm Water Drainage 4,649 5,6964 Road upgradation 5,171 6,3345 Streetlighting 1,110 13606 Fire‐fighting 82 827 Urban Greenery 40 498 Reforms (Accounting and E‐Governance) 185 2279 Hospitals 1,500 1,838 Schools 250 306 Modern Slaughter House 500 613 Total Investment 23,538 28,816
Financial Operating Plan
To arrive at the financing plan, the income and expenditure trend of the past five years were studied and based on the past trends these were projected. Additionally the infrastructure requirements identified herein were assessed assuming the 70% grant availability under JNNURM and 30% PCB would contribute. The additional O&M cost as a result of new infrastructure were also captured in the projections. Based on the assessment carried out, PCB would be able to comfortable undertake this investment. Both the revenue account and the closing balance has been positive year on year basis in the projected scenario while the investments would be made.
Reform Implementation:
The JNNURM also envisages cities to improve efficiency by implementing reforms. In that context PCB has planned to migrate to Double Entry Accounting System. It is also planning to implement the e‐governance services at the Cantonment Board. In the area of Property tax, the collection efficiency is to the mark, the rates are revised on a regular basis. PCB also plans to improvise the user charges while undertaking new projects to ensure O&M cost recovery of services. The investment plan has identified investment towards reform implementation too.
City Development Plan – Pune Cantonment Board JnNURM
18 Draft Final Report
2. BACKGROUND
This chapter provides a complete overview of aims and objectives of preparation of a City Development Plan, the key areas of stress, elements of the study.
The Jawaharlal Nehru National Urban Renewal Mission (JNNURM) was conceptualized in 2005‐06 with a number of urban reforms highlighting the importance of City Development Plans for the selected mission cities. These were short‐term initiatives focusing on 6‐7 years plans and strategies, to translate the aspirations of the stakeholders into the vision of the city and to achieve the vision for the city strategies and projects are outlined. The core aim of the JNNURM is to:
1. Translate investments into effective service delivery outcomes
2. Introduce strong governance systems and
3. Make the cities financially sustainable.
The City Development Plan (CDP) is both a planning process and a product which promotes partnership among the various stakeholders in a city‐ the city government, the private business sector, civil society, academic and national government agencies‐ to jointly analyze growth issues, develop a vision for the future, formulate development strategies, design programmes, prioritize projects, mobilize resources, implement, monitor and evaluate implementation. The preparation of a City Development Plan can be understood as a consultative process where the municipality and parastatal agencies responsible for provision of services and overall development of the city play a pivotal role. The firms and institutions are required to work in partnership and close collaboration with municipal and other related institutions such as the Water Supply and Sewerage Boards, Development Authorities, together with other key stakeholders, civil society groups, and non‐governmental organizations. The CDP is anchored on the following principles of a sustainable city as envisaged by World Bank:
• Livability ‐ what can be done to ensure a healthy and dignified standard of
living for the city's residents?
• Competitiveness ‐ how can the cities be more competitive in the global
economy?
• Bankability ‐ how can the cities be more sustainable?
City Development Plan – Pune Cantonment Board JnNURM
19 Draft Final Report
• Good Governance ‐ how can a city’s management be improved? How can
accountability, integrity, and transparency are made an integral part of city's
management.
2.1 Objectives:
The goals of a City Development Plan include a collective city vision and action plan aimed at improving urban governance and management, increasing investment to expand employment and services, and systematic and sustained reductions in urban poverty. In order to achieve the above goals, the objectives of the CDP are to:
• Guide the city direction for economic development with the aim of creating
more employment opportunities;
• Develop a consensus building process to establish the city's priority,
strategies and actions;
• Assist local authorities outline their financing and investment strategies; and,
Build local capacity for more effective urban management.
2.2 CDP‐A Process
A City Development Plan is a perspective and a vision for the future development of a city. Essentially, it addresses following questions:
1. Where are we now?
2. Where do we want to go?
3. What do we need to address on priority basis?
4. What interventions do we make in order to attain the vision?
2.2.1 City Assessment: Analysis of Existing Situation
The Study and Analysis include the following:
• An analysis of the existing situation focusing on demographic analysis and
economic activity, land use, financial, urban infrastructure and urban
services (like transportation, water supply, and sanitation, sewerage and
solid waste management, drainage, transport parking spaces etc), physical
and environmental aspects including heritage areas, water bodies etc.
• The financial status of the institution dealing with the service provision
including an analysis of their credit worthiness, effectiveness and efficiency

City Development Plan – Pune Cantonment Board JnNURM
20 Draft Final Report
of the institutional frameworks.
• Critical assessment as well as projections of the population growth,
infrastructure needs and resource requirements in the short‐term, medium
term and long‐term perspective.
• Urban poverty, characteristics of slums e.g. social set up, availability of urban
basic and social services and on‐going slum improvement programmes etc.
• Areas of inner city (urban renewal), which needs to be redeveloped; an
analysis of present status of availability of urban basic services including the
condition of the infrastructure.
• Identification of existing nature of commercial and industrial establishments
and identification of those industries and commercial establishments which
are not in conformity to the existing land‐use planning and zoning
regulations in the inner city areas.
• Heritage areas which includes Archaeological Heritage, Architectural
Heritage, and Architectural Conservation Areas.
• "Strengths, Weaknesses, Opportunities and Threats" (SWOT) to provide an
understanding of the factors responsible for inefficient and inadequate
production and delivery of urban services, their managerial deficiencies and
financial constraints and to highlight critical factors calls urgent remedial
measures .
2.2.2 Development of Strategic Agenda and a Vision for the City
• Based on the outcome of the City Assessment, the next stage envisages
development of City Vision to guide the future development of the city
highlighting the direction of change and working out an Action agenda with a
specific time frame.
• Based on the Vision, strategies focus on growth management, urban
infrastructure
• Basic services, social services, slum improvement, housing for EWS, provision
of basic and social services for urban poor, protection of heritage areas,
preservation of water bodies, redevelopment of inner city areas etc for
development.
• Identification of key strategic issues, risks and opportunities facing the city
with focus on reform and reform priorities.
• An understanding on common Vision, defining outcome and milestones on
the Vision and ensure their measurability and time frame.

City Development Plan – Pune Cantonment Board JnNURM
21 Draft Final Report
2.2.3 Structure of the Report
This report presents the results of the above mentioned process carried out for Pune Cantonment Board. Since Pune city has a considerable bearing on processes in the Board area, aspects of development in the Pune Municipal Corporation(PMC) have been incorporated in the assessment of key sectors, particularly demography; economic planning; land and growth management and transportation.
The report is presented in the following chapters:
1. Executive Summary
2. Background
3. CDP for Pune Cantonment Board
4. Pune and Pune Cantonment Board
5. Governance & Institutional
6. Infrastructure Assessment
7. Capital Investment Plan
8. Financial Assessment & Financial Operating Plan
9. Reform Assessment: Status and Way Forward
10. Annexures

City Development Plan – Pune Cantonment Board JnNURM
22 Draft Final Report
3. CDP for PUNE CANTONMENT
This chapter provides an overview of need for preparation of CDP for Cantonment Area and the Approach and Methodology and key steps for preparation of CDP.
3.1 Need for CDP for Pune Cantonment Board
The JNNURM requires cities to prepare CDP and arrive at the key development agendas for the city in the long and short run. The CDP is a policy plan for an institution to plan and manage its activity on a continued basis. Since Pune region comprises of Pune and Pimpri‐Chinchwad Municipal Corporation and the 3 Cantonment boards and each of the institutions act and are responsible for service provisioning and management within its jurisdiction, the institutions are preparing CDP for their respective areas. It is however, imperative that the overall development goals of the region harmonize and the institutions should act in parallel and interact with each other on development issues irrespective of jurisdictional limitations. While PMC and PCMC initiated preparing the CDP for their jurisdiction, PCB decided to prepare its planning through a CDP process and explore opportunities of margining with the CDP of PMC as it falls within the jurisdiction of PMC. In that context, PCB through a tendered process appointed Creations Limited, who has adequate experience in preparation of similar CDP and its implementation.
3.2 Approach and Methodology
The following methodology was used for preparation of CDP:
1. Assessment of Pune Cantonment Board
• Secondary data collection for demographic, geographic and economic profile
• In‐depth analysis of the existing situation
• Present issues in the area
• Available Infrastructure and Level of Services
2. Demand Supply Gap Analysis Considering the existing rate of growth and expectation about the prioritized sector services, it is proposed to assess the future needs, which be helpful to work out project details in later stage.
City Development Plan – Pune Cantonment Board JnNURM
23 Draft Final Report
3. Development of Vision of the City Using the results of the first stage of analysis, combined with consultations with key stakeholders, service sectors were prioritizes that required immediate attention while simultaneously developing a vision for the future development.
4. Prioritization of Sector Review and analysis of the status of various services and prioritization of sectors in consultation with various stakeholders of the city
5. Formulation of Development Strategy In this stage the strategies and interventions were identified for attaining the vision and future development perspectives for specific sectors in consultation with the stakeholders.
6. Project Identification
Based on the sector specific priorities and strategies, details of projects for various sectors were worked out. Details like physical and financial aspects were worked out.
7. Stakeholder Involvement Based on the consecutive interactive sessions with beneficiaries/target groups and with all other stakeholders, necessary strategies were evolved.
8. Preparation of Financial Operation Plan An investment plan and a financing strategy are an integral part of the proposal. The focus is on Public‐Private Partnership as a part of different financial models to be used for successful implementation of the projects.

City Deve
24
Multi ‐StakeholdConsultat
ns
elopment Plan
O
der tio
n – Pune Can
CantonmAsse
Opportunitiess and Weakn
/
Future PerV
Directions Expe
Strategies fo
Options a
Link wit
Criteria for
City InvestFinancial O
Figure 1: Mu
ntonment Boa
ment Area essment
s, Strengths, Rnesses. Dema/Gap
rspective andision
of Chane andctations
or Developme
nd Strategies
th Reforms
r Prioritization
tment Plan &Operating Plan
ulti‐Stage Proce
ard
Risknd
d
d
ent
s
n
& n
ess
Para
Dem
Econ
FIna
Phy
Infra
Inst
Ph
So
Tr
Fi
ameters
mography
nomic Issues
ancial
sical and Env
astructure
itutions
Sectors/Co
hysical Infrast
ocial Infrastru
ransport and
nancial Resou
JnN
Draft Final R
ironment
mponents
tructure
ucture
Road Service
urces
URM
Report
e

City Development Plan – Pune Cantonment Board JnNURM
25 Draft Final Report
4. PUNE & PUNE CANTONMENT
This chapter present details about the overall Pune region and more specifically talks about the brief history of formation and emergence of Cantonment Areas, which is less known and thereafter presents the demographic profile of the Pune Cantonment Area.
4.1 About Pune
4.1.1 Pune District
Pune District is situated in Maharashtra state of India. Pune city is the district headquarters. In the most recent census on 2011, the total population of the district was 9,426,959, making it the fourth most populous district in India. Urban population comprises 58.08% of the total population. The current population of Pune urban agglomerate is over 5 million. Pune District is in the western region in Maharashtra in India. It is bounded by Thane District to the northwest, Raigad District to the west, Satara District to the south, Solapur District to the southeast, and Ahmednagar District to the north and northeast. Pune district lies in the Western Ghats or Sahyadri mountain range and it extends on to the Deccan Plateau on the east. Pune stands on the leeward side of the Western Ghats. Pune is at an altitude of 559m(1863 ft.). Pune district is located between 17.5° to 19.2° North and 73.2° to 75.1° East. In Pune district, there are two municipal corporations, namely Pune Municipal Corporation (PMC) and Pimpri‐Chinchawad Municipal Corporation (PCMC). Pimpri‐Chinchwad is located at the West of Pune city, touching the Pune‐ Mumbai National highway. The corporation covers the area of Nigdi, Akurdi, Pimpri, Chinchwad and Bhosari. The said area is developed by MIDC as an industrial zone.
4.1.2 Pune Metropolitan Region
Urban development in Pune Cantonment Board Area is greatly interlinked and supported by its surrounding agglomerations. Considering this, boundaries of Pune Metropolitan Region (PMR) were defined in early 1967. Spread out over an area of approximately 1,340 Sq.Km in Haveli Taluka of Pune District.
City Development Plan – Pune Cantonment Board JnNURM
26 Draft Final Report
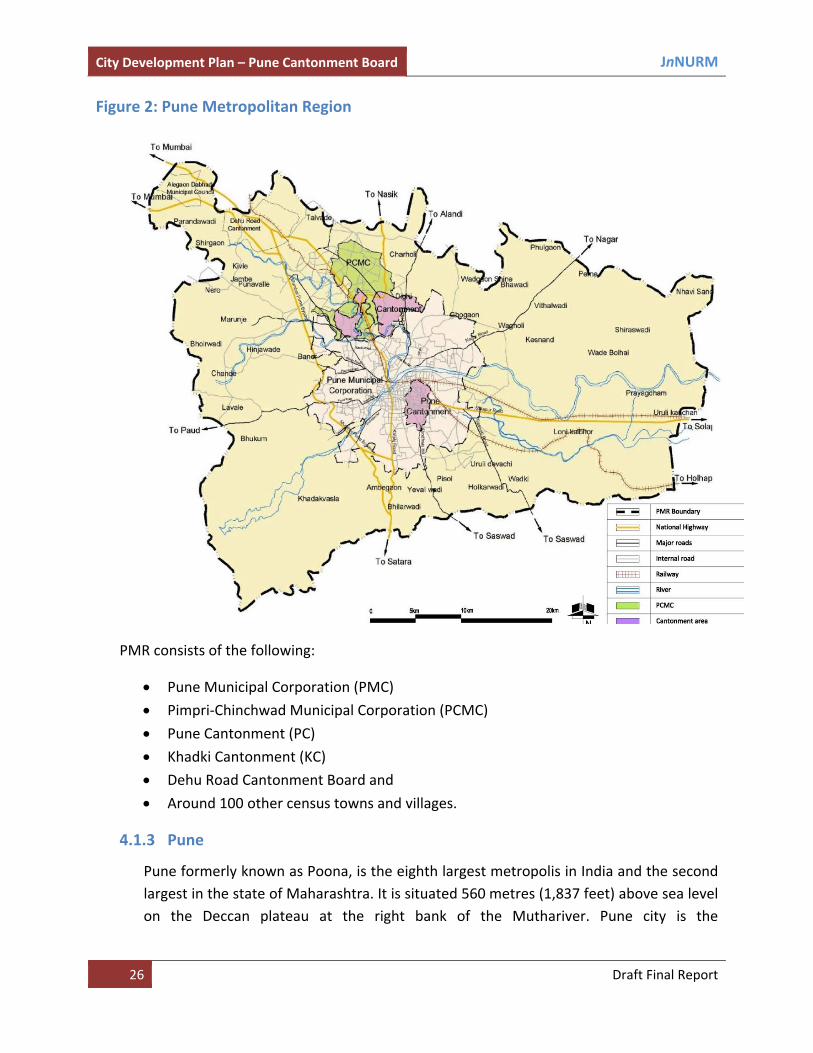
Figure 2: Pune Metropolitan Region
PMR consists of the following:
• Pune Municipal Corporation (PMC)
• Pimpri‐Chinchwad Municipal Corporation (PCMC)
• Pune Cantonment (PC)
• Khadki Cantonment (KC)
• Dehu Road Cantonment Board and
• Around 100 other census towns and villages.
4.1.3 Pune
Pune formerly known as Poona, is the eighth largest metropolis in India and the second largest in the state of Maharashtra. It is situated 560 metres (1,837 feet) above sea level on the Deccan plateau at the right bank of the Muthariver. Pune city is the

City Development Plan – Pune Cantonment Board JnNURM
27 Draft Final Report
administrative headquarters of Pune district and was once the centre of power of the Maratha Empire. Pune is known to have existed as a town since 847 AD. It was the first capital of the Maratha Empire under Shivaji. In the 18th century, Pune became the political centre of Indian subcontinent, as the seat of Peshwas, the Maratha Empire’s prime ministers. Pune is the cultural capital of Maharashtra.Since the 1950‐60s, Pune has had traditional old‐economy industries which continue to grow. The city is now also known for Manufacturing, Automobile, Government & Private sector Research Institutes, Information technology (IT) and Educational, Management, Training institutes that attract migrants, students and Professionals not only from India but also students from South east Asia, Middle East and African countries. Pune has emerged as a prominent location for manufacturing industries, and has now been recognized as the information technology hub and education hub of the country. The rapid growth of the city has transformed from its character as Pensioner’s city to Educational – Administrative Center and now to a bustling economic center. The city is famous as the Oxford of the East and the cultural capital of Maharashtra. Pune is also one of the most renowned places among tourists coming to Maharashtra. The educational institutions, presence of a number of industries and branches of virtually every array have made Pune a prosperous city. 1600: Pune city started from a small agriculture settlement called “Punnakka”. Later the settlement had grown to a small village called as Kasbe Pune or Punavadi. The whole region was located on the border, surrounded by the Mughals, Qutubshahi kingdom and Adilshahi kingdom. The settlement regenerated due to constant plundering and wars. 1600‐1818: Entire region was gifted as a “Jagir” to ShahjiBhonsle eventually, his son Shivaji founded the Maratha kingdom. It was made the administrative capital of Maratha Power by the Peshwas. Peshwas established various “Peths” which were the self‐sufficient urban settlement units (sectors). 1818‐1952: British came and developed new areas to the north of the old city, on the opposite bank of the river. They also established military cantonment to the east & north of the city. Many academic and research institutes like Pune College of Engineering were established during this period. The Kirloskar Group was the first to
City Development Plan – Pune Cantonment Board JnNURM
28 Draft Final Report
bring industry to Pune by setting up Kirloskar Oil Engines Ltd. in 1945 at Kirkee in Pune. The Pune Municipality was established in 1950. 1952‐Present: City grew rapidly due to establishment of various industrial areas‐mainly Pimpri‐Chinchwad Industrial Township. Industrial development started in the 1950s and '60s in Hadapsar, Bhosari, Pimpri, and Parvati. Telco started operations in 1961, which gave boost to the automobile sector. In 1961, the Panshet and Khadakwasla dams broke and their waters flooded the city, destroying most of the older sections of town. Consequently, by 1966, the city had expanded in all directions. In 1990, Pune began to attract foreign capital. The maximum growth came after the IT boom & two major IT parks‐ Hinjewadi and Magarpatta. In 1998, work on the six‐lane Mumbai‐Pune expressway began; the expressway was completed in 2001. In 2008, the Commonwealth Youth Games took place in Pune, which encouraged additional development in the north‐west region of the city. The city gradually changed into a dynamic place of academic, cultural and economic importance. Pune is today acknowledged as an IT hub, educational hub and cultural capital of Maharashtra.
4.1.4 Physiography and Geography
Pune is located 560 m (1,840 ft) above sea level on the western margin of the Deccan plateau. It is situated on the leeward side of the Sahyadri mountain range, which forms a barrier from the Arabian sea. It is a hilly city, with its tallest hill, Vetal Hill, rising to 800 m (2,600 ft) above sea level. Just outside the city, the Sinhagad fort is located at an altitude of 1300 m.It lies between 18° 32"North latitude and 73° 51"East longitude.Central Pune is located at the confluence of the Mula and Mutha rivers. The Pavana and Indrayani rivers, tributaries of the Bhima River, traverse the northwestern outskirts of metropolitan Pune.
4.1.5 Climate
Pune has a tropical wet and dry climate with average temperatures ranging between 20 to 28 °C (68 to 82 °F).Pune experiences three seasons: summer, monsoon and a winter. Typical summer months are from March to May, with maximum temperatures ranging from 30 to 38 °C (86 to 100 °F). The warmest month in Pune is April; although summer doesn't end until May, the city often receives heavy thundershowers in May (and humidity remains high). Even during the hottest months, the nights are usually cool due to Pune's high altitude. The highest temperature ever recorded was 43.3 °C (109.9 °F) on 30 April 1897.

City Development Plan – Pune Cantonment Board JnNURM
29 Draft Final Report
The monsoon lasts from June to October, with moderate rainfall and temperatures ranging from 22 to 28 °C (72 to 82 °F). Most of the 722 mm (28.43 in) of annual rainfall in the city fall between June and September, and July is the wettest month of the year. Hailstorms are also common in this region. Winter begins in November; November in particular is referred to as the Rosy Cold. The daytime temperature hovers around 28 °C (82 °F) while night temperature is below 10 °C (50 °F) for most of December and January, often dropping to 5 to 6 °C (41 to 43 °F). The lowest temperature ever recorded was 1.7 °C (35 °F) on 17 January 1935.
4.1.6 Linkages and Connectivity
Pune is well‐connected to other cities by Indian highways and state highways. National Highway 4 (NH 4) connects it to Mumbai, Bangalore and Kolhapur. NH‐9 to Hyderabad and NH‐50 to Nashik. State highways connect it to Ahmednagar, Aurangabad, and Alandi. The Mumbai‐Pune Expressway, India's first six‐lane high‐speed expressway, was built in 2002, and has reduced travel time between Pune and Mumbai to almost two hours. A ring road is being planned for the convenience of heavy traffic. Pune is served by two intra‐city highways: Old Pune‐Mumbai Highway and Katraj‐Dehu Road Bypass, a part of National Highway 4. The Nashik City‐Pune Highway NH 50 will be part of the golden triangle (Nashik‐Pune‐Mumbai). The NH‐9 which connects Pune to Machilipatnam via Solapur and Hyderabad passes through the cantonment.
4.1.7 Rail Connectivity
Pune has two main railway stations namely, Pune Junction and Shivajinagar Station; most trains halt at Pune Junction. Pune suburban trains run from Pune Junction to the industrial towns of Khadki, Pimpri, and Chinchwad etc. The nearest rail link to the cantonment is Pune Railway Station.
4.1.8 Air Connectivity
The city has an international airport at Lohegaon operated by the Airport Authority of India. It shares its runways with the neighboring Indian Air Force base. Apart from daily domestic flights to all major Indian cities, this airport serves two international direct flights to Singapore and Dubai. The airport handled 28.14 lakh passengers during 2010‐11 (financial year) as against 22.57 lakh in 2009‐10 as per Airport Authority of India (AAI)
City Development Plan – Pune Cantonment Board JnNURM
30 Draft Final Report
i.e. an increase of 24.64% if compared to 2009‐10. The nearest airport is the Lohegaon Airport.
4.1.9 Administration
Different institutions play a major role in planning and development of entire Pune region. The Divisional Commissioner Office of Pune is the overall in‐charge of looking into development aspects of Pune District and other districts in the division. The Pune Collector office looks into the development related policies and other matters within the Pune District which includes both urban and rural areas. Pune Municipal Corporation (PMC), Pimpri Chinchwad Municipal Corporation (PCMC), Pimpri‐Chinchwad New Town Development Authority (PCNTDA) and the Cantonment Boards of Pune, Khadki and Dehu Road looks into development aspects within their given jurisdiction. Apart from these institutions, Pune Mahanagar Parivahan Mahamandal Limited (PMPML) a public sector company jointly set up by PMC and PCMC provides public transport facility in the Pune Metropolitan Region. The Pune and Khadki Cantonment Board fall within PMC’s jurisdiction, while Dehu Road Cantonment Board lies in Pimpri‐Chinchwad Municipal Corporation’s jurisdiction.
4.2 Cantonments
4.2.1 History Cantonments were an institution as an instrument in building of the British Empire in India. In the post independence period, it serves an important role in our defence system. The word cantonment is derived from the word “Canton”, which is defined as “sub‐division of country”. The term when used as a verb means “Divide into cantons and quarters of soldiers.” A cantonment can thus be defined as “lodging assigned to troops.” With the decline of Mughal Empire, the East India Company in order to protect their trade started cantoning troops and establishing cantonments, which also protected the territory under its sway. Building of cantonments as a matter of policy was initiated by Lord Clive in 1765. During the period 1765 to 1800, cantonments were set up in places like Dinapore, Berhampur, Cossimbazar, Patna, Mongheer, Barrackpore.

City Development Plan – Pune Cantonment Board JnNURM
31 Draft Final Report
Till that period the term “Cantonment” was understood in its limited sense of an arrangement for quartering the troops. Wherever cantonments were set up immediate needs like sanitation and hygiene were catered for by the Army Authorities themselves in accordance with the rules and other promulgated in this behalf by the commanding officers. In cantonment stations, officers were encouraged to make their own arrangements for their accommodation by purchasing bungalows where available or by building them at their cost on land set aside for that purpose. In later years, even civilians were allowed to construct bungalows with the stipulation that they would let out to officers on reasonable rent. The victories achieved by the British in the early years of the 19thcentury by way of fall of Tipu, annexation of Carnatic, reduction of Nizam to a sub‐ordinate ally, defeat of Jaswant Rao Holkar etc. gave them confidence to consolidate and secure the territories won. This led to institutionalizing the cantonments. The cantonments stations, though primarily meant for army personnel, drew into them civilians essentially to provide services to them. The civilian elements included categories like bania, milk seller, vegetable and fruit vendor, cook, helper, syce, sweeper, ayah, butcher etc. All these categories were segregated in separate areas called bazaar area, now known as civil area. The other area was called bungalow area or outside civil area. Creation of bazaar area brought some problems in its wake like unhygienic and insanitary conditions leading to diseases like diarrhea, malaria, cholera and even venereal diseases. A need was therefore felt to regulate the social life as well as to set some municipal standards to regulate construction of roads, drains, latrines, residential buildings and quality of items of consumption. No deviation in land use was allowed except with the approval of the Government even in those times when land was not scarce.
4.2.2 Development of Cantonments Local self‐governance in the cantonment is multi‐faceted and is different in approach and style as normally understood in the context of municipalities. Maintenance of health, welfare and security of the troops underlies the administration in the cantonment and to keep this requirement uppermost, the military administration as well as the municipal administration in the Cantonment has been unified in the appointment of the Station Commander. The Central Government is further responsible to release grant‐in‐aid or special grant‐in‐aid to deficit Cantonment Boards so as to enable them to meet the establishment cost as well as take up maintenance or original works.

City Development Plan – Pune Cantonment Board JnNURM
32 Draft Final Report
The Cantonment is divided into civil area and outside civil area (Bungalow area) for the purposes of assigned roles and functions. Cantonment Board, though largely concerned with the civil area, is responsible for providing civic amenities of general nature to the civilian residents in the entire cantonment. Though the demarcation is done for respective roles of Cantonment Board and Military, there are certain common areas which affect all the residents like roads, common drains, street lighting, parks, gardens, markets etc.
4.2.3 History of Pune Cantonment Board The British Indian Army had a small encampment west of the Mula River in Khadki. As more troops were required to be accommodated, a larger area was occupied to the west of the Mutha River, leading to the establishment of the Pune Cantonment in 1817for accommodating troops of the British Indian Army. The villages of Mali, Munjeri, Wanowrie and Ghorpuri (Ghorpadi) were selected for this purpose. Initially, a garrison for 4,620 troops was planned for the cantonment. This included two European regiments, a mountain battery, a native cavalry and three native regiments. A central belt of 130 acres (0.53 km2) was designated for training and drills. The firing ranges were located at Golibar Maidan. Soon a large number of civilians began settling in the area. This was encouraged since civilians provided services to troops garrisoned in the cantonment. The limit of the cantonment was extended in 1822. In 1963, Ghorpuri Village (Ghorpadi) and Fatima Nagar were merged into cantonment area. The limit of the cantonment was again extended in the same year when Mundhwa village was included in the cantonment.
Pune Cantonment is a part of the Pune Lok Sabha constituency. Pune Cantonment is a separate constituency of the Maharashtra Legislative Assembly (Vidhan Sabha).
4.2.4 Major Obligatory Functions of Pune Cantonment Board
• Imposition and collection of Taxes and other fees / charges • Street Lighting • Sanitation • Water Supply • Maintenance of Roads, Buildings, Drains and other Public Property • Arboriculture • Registration of Births and Deaths • Health Services • Primary Education • Control Over Buildings and Streets etc. • Maintenance of Markets, Slaughter Houses • Regulation of Trades and Occupations

City Development Plan – Pune Cantonment Board JnNURM
33 Draft Final Report
4.2.5 Major Discretionary Functions • Constructing & Maintaining Public Parks, Gardens, Offices, Dairies, Bathing or Washing
Places, Fountains, Tanks, Wells and other Public Utility Services. • Welfare Services and Houses for up‐liftment of those dwelling in Slum Area. • Conducting Census and collecting vital Statistics and also carry out a survey. • Reclaiming Unhealthy localities. • Furthering Educational Facilities other than Primary School. • Relief Measures in case of Occurrence of Local Epidemic, Floods and other Natural
Calamities by the Establishment or Maintenance of relief works etc.
4.3 Demographic Profile of Pune Cantonment Board
The population of Pune Cantonment Board area as per 2011 Census is recorded as 71,781 persons. The population figures are available since 1991. It can be observed that over the years the population of the Cantonment area has decreased. The growth rate has also reduced considerably compared to the 1991‐11 decade.
Table 1: Population, Area and Density
S. No.
Year Total Population
Decadal Change
Growth Rate
Area (sq. kms)
Density (Persons/ sq. km)
1 1991 81,978 11.90 6,8892 2001 79,965 ‐ 2013 ‐2% 11.90 6,7203 2011 71,781 ‐ 8184 ‐10% 11.90 6,032
One of the key reasons for drop in population in the Cantonment area is the conversion of landuse from residential to commercial due to high demand of commercial properties. Cantonment area being heart of the city host high end commercial real estate and hence the gains are more in commercial real estate. It may also be noted that the Cantonment jurisdiction boundary is fixed and most of the areas of the Cantonment Board are already development and there is no horizontal expansion possible; the only increase in future population would be now because of increase in Floor Space Index (FSI) if any. Although, the population addition in PCB area is limited and kind of freeze, however, more than 50,000 is a broad estimate of the floating population. This floating population comprises of working population who works in the commercial zone in Pune and also population from Pune Region visiting for administrative, commercial and recreational purpose.

City Development Plan – Pune Cantonment Board JnNURM
34 Draft Final Report
4.4 Other Demographic Indicators
4.4.1 Sex Ratio Sex Ratio is one of the instruments that helps analyze the gender balance in the city. Sex ratio is defined as “the number of females per 1000 males”. As per provisional figures 2011, Census of India, the Sex ratio of Pune Municipal Corporation is 945 females per thousand males which is higher than the district, state and national level figures with an improvement from 921 females per 1000 males in 2001 to 945 females per 1000 males in 2011.
4.4.2 Literacy Rate Literacy rate reflects the socio‐ economic development of any region. Pune city has the highest literacy rate of 91.61% when compared to the district, state and urban India literacy rate. The high literacy rate can be attributed to Pune city being one of the leading centers of higher education in the country.
The literacy rate of Pune city has increase from 77% in 2001 to 91.61% in 2011 Census. Males have a higher literacy rate at 95.13% compared to 87.91% for females. However, the gap between literacy rates for males and females has narrowed, compared to that prevailing in 2001. The highest literacy rate is in Dankawadi ward with 94% while the lowest is found in Dhole Patil ward with 89%.
4.4.3 Spatial Distribution The table below provides the area details of the key areas in the Pune Cantonment jurisdiction. It may be observed that majority (80%) of the area is known as Bungalow area which is majorly residential and has parcels of institutional development such as schools, hospitals, auditoriums etc.
Table 2: Area‐wise Break‐up
S. No.
Location Area (in acres) Area (in sq.km) Share
1 Civil Area 199.75 0.81 6.8%2 Wanorie Bazaar 14.62 0.06 0.5%3 Ghorpadi Bazaar 4.97 0.02 0.2%4 WanowrieTannary 4.96 0.02 0.2%5 Fatimanagar and Ghorpadi Village 44.88 0.18 1.5%6 72‐76 Mundhwa Industrial Area 243.99 0.99 8.3%7 Bungalow Area 2428.02 9.83 80.6% Total 2941.19 11.90 100.0%

City Development Plan – Pune Cantonment Board JnNURM
35 Draft Final Report
4.4.4 Landuse Planning As such, the area planning or master planning for Cantonment area was conceived way back during. The present land use pattern is a result of policies decided at that point of time. However, any documentation with respect to physical master plan and policies are not available. Many areas as per discussion with officials have changed their landuse especially converting from residential to mix use owning to commercial potential. The PCB authority has recently initiated the survey of each parcel of land to identify the existing land use pattern; the survey is on‐going. Based on the discussion, the broad landuse pattern of the entire area of PCB can be classified as pure residential, which is the Bungalow area with certain areas develop for institutional purpose and in total constitutes about 81% of the total area; Mundhwa area which is predominantly industrial area comprise of 9%, mix use of residential cum commercial activity comprise of 10%.
Table 3: Broad Landuse
S. No.
Location Landuse Share
1 Sadar Bazaar, Civil Area, Ghorpadi Village, Ghorpadi Bazaar, Wanorie Village, Fatimanagar
Residential cum Commercial 10%
2 Bungalow Area Residential and Institutional 81% 3 72‐76 Mundhwa Industrial Area 9%

City Development Plan – Pune Cantonment Board JnNURM
36 Draft Final Report
5. GOVERNANCE &INSTITUTIONAL FRAMEWORK
This chapter discusses the governance and institutional framework of the Cantonment Boards. The Cantonments are governed by the Cantonments Act 2006. All policies and powers to plan and provide services and levy of taxes and charges are governed by the Cantonments Act. The chapter further discusses the institutional structure of Pune Cantonment Board in terms of different departments, their staffing pattern, roles and responsibilities. As per the Cantonment Act, for every cantonment there shall be a Cantonment Board. Every Board shall be deemed to be a municipality under clause(e) of article 243‐P of the Constitution for the purpose of‐
(a) Receiving grants and allocations; or (b) Implementing the Central Government schemes of social welfare, public
health, hygiene, safety, water supply, sanitation, urban renewal and education.
Pune Cantonment Board was established in the year 1817 for accommodation of military troops, fresh troops, regiments, battalions including cavalry settled in Pune. In 1819, the limits of Pune Cantonment were fixed. With lapse of time, large number of civilians had come to reside in Cantonments. They were in fact encouraged to do so in order to provide amenities to Officers, soldiers and retainers of the Army / Military Stations. Besides, accommodation was needed for Military Officers, and the Civilians invested their Capital in building Bungalows and Houses. In 1822, the area further expanded to include other areas. The boundaries of Pune Cantonment were finally settled in the year 1827. The policy of the Military authorities was to preserve the Cantonment Area purely for the residence of their Officers and Camp followers. Cantonments Act, 2006 came into effect on 18‐12‐2006 replacing the old Cantonments Act of 1924. Pune Cantonment is categorized as Category I Cantonment. The Board comprises of 16 members as per the Section 12 of the Cantonments Act, 2006 as follows:
• The Officer Commanding the station ‐ Ex‐Officio • District Magistrate or an Executive Magistrate not below the rank of
Additional District Magistrate nominated by him • Chief Executive Officer

City Development Plan – Pune Cantonment Board JnNURM
37 Draft Final Report
• Health Officer ‐ Ex‐Officio • Executive Engineer ‐ Ex‐Officio • Three Military Officers nominated by name by the Officer Commanding the
Station. • Eight members elected one for each ward under this Act
The Board has the general power of taxation, with the previous sanction of Central Government; impose the following taxes for the purpose of this Act:
a) Property Tax and b) Tax on trades, professions, callings and employments.
In addition to the taxes specified above, the Board may, for the purposes of this Act, impose any tax which under any enactment for the time being in force may be imposed in any municipality in the State in which Cantonment is situated.
a) Provided that the Board shall revise every five years the rates of taxes imposed
b) Provided further that the Board shall not abolish any tax imposed under this section or vary it to the Board’s financial advantage without prior sanction of the Central Government and the tax mentioned above shall not exceed the ceiling prescribed.
Octroi, Terminal tax and toll:
Every person bringing or receiving any goods, vehicles or animals within limits of any cantonment in which octroi or terminal tax or toll is leviable shall, when so required by an officer duly authorized by the Chief Executive Officer.
Sanitation
The Health Officer shall be the Advisor to the Board in all matters relating to sanitation and exercise a general supervision over the cantonment and shall periodically submit a sanitary report along with his recommendations at least once in every month to the Board. Public Latrines, urinals and conservancy establishments: All public latrines and urinals provided or maintained by a Board shall so constructed as to provide separate toilets for the sexes.
Water Supply, Drainage and Sewage Collection
In every Cantonment, where a sufficient supply of potable water for domestic use does not exist, the Board provides or arranges for provision of such supply. The Act also

City Development Plan – Pune Cantonment Board JnNURM
38 Draft Final Report
details out the duty of the Board to practice and propagate the scientific methods of water harvesting and make arrangement for recharging the sources of ground water and other natural resources of water in the vicinity of the Cantonment. The Act states that Board can carry out survey of the existing consumption of and demand for water supply in the area, prepare an estimate and formulate proposals for water supply as well as sewage collection.
Town Planning and Control over Buildings, etc:
The Cantonment Act, 2006 has provision for preparation of a spatial plan for land use by earmarking of zones for residential, institutional, commercial and other activities. Also, improvement schemes for areas considered sub‐standard on account of narrowness of streets, poor lighting, poor ventilation or irregular line of buildings in a street. Bye‐laws and rules have been prepared in accordance with the provisions made in the Cantonments Act, 2006. According to which, no person shall erect or re‐erect a building without the permission of the concerned Board. The bye‐laws mentioned in the Act are similar to those of Municipal Bye‐laws, i.e Power of the Board to sanction building erections, giving completion notice, restrictions on use of buildings, power to stop illegal construction, power to seal unauthorized constructions, etc.
A meeting was been held with Shri. J P Dange, Chairman, Maharashtra Finance Commission on 07.11.20I3 in the office of Pune Cantonment Board along with Elected & Nominated Members of the Board regarding various issues for receiving grants and allocations from Central / State Government. The basic submission of the Pune Cantonment Board to the State Finance Commission is as under:
• The Cantonment Board may have share in the basic tax assignments • All public welfare schemes of Central and State Government may also be
extended within cantonment limits under the control of cantonment Board. • Vice Presidents of the Cantonment Boards may be Member of Development,
Planning Committee. • Emoluments and allowances of Elected Members may be as that of Elected
Municipal Corporation Members • Vice Presidents of Cantonment Boards may hove the some status as that of
Mayor in the Municipal Corporation • Schemes for Below Poverty Line people may also be implemented within
Cantonment limit through Cantonment Board. • State Population Women Commission may be extended within Cantonment
limits.

City Development Plan – Pune Cantonment Board JnNURM
39 Draft Final Report
5.1 Institutional Structure of PCB
There are eight Departments which are responsible for all the developmental works in the Cantonment Board, maintenance of infrastructure, collection of taxes, preparation of Developmental Plans and Budgets. The table below provides the sanctioned and actual staff across each of these departments. As can be noted from the table below, the largest department is the health department which caters to management of hospitals and waste management in the Cantonment Area. Public works or engineering department is the second largest department which looks into all the development and engineering especially infrastructure related works.
Table 4: Staff Strength – Actual vs Sanctioned
S. No.
Department Sanctioned Strength
Actual No. of Employees
Vacant Post Vacancy Ratio
1. Public Works 60 52 8 0.132. Revenue Section 16 15 1 0.063. Health Department 623 556 67 0.114. Fire Brigade 36 34 2 0.065. Electrical 32 25 7 0.02 TOTAL 767 682 85 0.11
It terms of sanctioned and actual staff, the maximum vacancy rate is in the electrical department, followed by health and Public works. The section below, further discusses in detail each of the department in terms of their roles, responsibilities and staff strength.
5.1.1 Public Works Department
This department is headed by the Cantonment Executive Engineer. The functions of the department are as follows:
• Attend to Public works • Operation and Maintenance of Water Stand Posts • Operation and Maintenance of drains and drain chambers • Maintenance of Public Utilities • Maintenance of Roads • Repairs and maintenance of Cantonment fund buildings, inspection buildings and
construction sites

City Deve
40
Te
Table 5: S
S.No.
1. 2. 3. 4. 5. 6. 7.
5.1.2
T
Tsa
elopment Plan
• Corre• Remo
he staff strmployees is
Staff Strength
Name of t
CEE AEE SE Jr. EngineSub‐OversJr. Clerk Others TOTAL
2 Revenue
his departm
he functionanitary cess,
n – Pune Can
spondence ooval of unaut
rength of tas follows:
h – Public Wo
the post
er(Civil) seer
e Section
ment is heade
s of the de, hoardings,
Poun
ntonment Boa
on building pthorized con
he departm
orks Departm
ed by the Ch
epartment avehicle entr
d Keeper
ard
plans and thnstructions/e
ment with t
ment (Enginee
Sanct
hief Revenue
are collectiory tax, groun
Chief RSu
RevSu
Sr.C
Pe
heir sanctionencroachme
the number
ering Departm
tioned Streng
01 01 01 05 01 01 50 60
e Superinten
on of revenund rent tax,
Revenue pdt.
enue pdt.
Clerks
eon
ent on gover
r of sanctio
ment)
gth A
dent.
ue by way leasing of ha
Jr. Cle
JnN
Draft Final R
nment lands
oned and a
Actual No. ofEmployees
01 01 01 04 01 01 43 52
of propertyalls etc. The
erks
URM
Report
s.
actual
f
y tax, staff

City Deve
41
stfod
Table 6: S
S.No.
1. 2. 3. 4. 5. 6.
5.1.3
T
T
elopment Plan
trength of thollows. It maiscussion wi
Staff Strength
Name of t
Chief ReveRevenue SSr. Clerks Jr. Clerks Peons TOTAL
3 Health D
his departm
he functions
• Efficie• Ensur• Ensur
Dog Shooter
n – Pune Can
he departmay be noted th departme
h – Revenue S
the post
enue Supdt. Supdt.
Department
ment is heade
s of the depa
ent garbage e Health ande Health and
Chaukidars
ntonment Boa
ent with thethat the keyent is affecti
Section
t
ed by the Ch
artment are
disposal d hygiene and hygiene of
HeaInspe
Asst. MktSupdt
SafaiKaramcharis
ard
e number ofy post of Ching day to da
Sanct
hief Health S
as follows:
nd sanitary cf hotels and
alth ectors
Mukadams
Mulla
f sanctionedhief Revenueay performa
tioned Streng
01 01 03 08 03 16
uperintende
conditions restaurants
Rat Trapper
d and actuale Officer is vance.
gth A
ent.
Chief Health Supdt.
Health Supdt.
Disinfector
JnN
Draft Final R
employeesvacant and a
Actual No. ofEmployees
‐ 01 03 08 03 15
Dog Catcher
URM
Report
is as as per
f
Garden Supervisor
Agriculture Asst.
Head Maali
Maalies

City Development Plan – Pune Cantonment Board JnNURM
42 Draft Final Report
• Verifying trade establishments and prosecution for unauthorized trades • Prevention of stray dogs and cattle nuisance
The staff strength of the department with the number of sanctioned and actual employees is as follows:
Table 7: Staff Strength – Health Department
S.No. Name of the post Sanctioned Strength Actual No. of Employees
1. Cattle Pound‐ Pound Keeper 01 TOTAL 01 00 2. Market & Slaughter House Health Inspector 01 01 Mukadams 02 02 Chowkidars 05 ‐ Safaikaramcharies 28 28 Lorry Drivers 02 02 Mulla 02 02 Asst. Mkt. Supdt.(JC) 01 01 TOTAL 41 36 3. Hospitals & Dispensaries RMO 01 01 AMO 11 10 Steward 01 01 Sister‐in‐charge 04 04 Matron 01 ‐ Asst. Matron 01 01 Pharmacist 06 06 Staff Nurse 30 24 Ayah 21 19 Mali 01 ‐ Watchman 03 ‐ Jr.Clerks 04 04 Sr.Clerks 01 01 X‐ray Technician 01 01 Lab Tech. 03 03 Lab Attendant 01 01 Auxiliary Nurse 04 04 Nursing Orderly 17 17 Dressers 06 03 Peons 01 ‐ Typist 01 01 Safaikaramcharies 22 22 Store Coolie 01 ‐ Driver 01 01 TOTAL 143 124

City Development Plan – Pune Cantonment Board JnNURM
43 Draft Final Report
Health Supervisor 01 01 Peon 01 01 TOTAL 02 02 4. Conservancy Staff Dog Shooter(Mukadam) 01 01 Dog Catcher(S/K) 03 03 TOTAL 04 04 Muktidham Watchman 01 ‐ Mali 01 01 TOTAL 02 01 Water Supply Plumber cum fitter 02 01 Mazdoor(S/K) 01 01 Drivers 04 04 TOTAL 07 06 Watering of roads Driver 01 01 Filler 01 01 TOTAL 02 02 Anti Malaria Measures Mukadams 02 01 Mazdoor(S/K) 13 13 Rat Trapper(S/K) 03 01 Disinfector(S/K) 04 ‐ TOTAL 22 15 Chief Health Supdt. 01 ‐ Health Supdt. 01 01 Health Inspector 05 05 Mukadams 15 13 Safaikarmacharies 348 320 Ledger Clerks 01 01 Workshop Supdt. 01 01 Workshop Inspector 01 01 Automechanic 02 02 Fitter(workshop)/welder 01 01 Asst. Blacksmith 02 ‐ Drivers 15 15 Mazdoor 06 06 TOTAL 399 366
5.1.4 Accounts Department
This department is headed by the Chief Accountant. The functions of the department are as follows:
• Maintain income and expenditure of the Board

City Development Plan – Pune Cantonment Board JnNURM
44 Draft Final Report
• Pay Clerks assigned the work of drawing salary of employees and maintenance of respective records
• Pension clerks are assigned the work of drawing pension of 705 pensioners along with maintenance of respective records
• Provident fund section is assigned the work of drawing PF employees and maintains the PF record.
5.1.5 Central Stores
This department is headed by the Stores Superintendent. The functions of the department are as follows:
• Procurement of stores : • Yearly demand/requirement from various sections. • Tendering process of giving advt. in newspaper, doing the comparative
statement, choosing the lowest rate and then seeking approval of Board. • Issue of store items. • Requisition from various sections as per indent • Recommendations on indent • Approval of CEO • Issue as per approval
5.1.6 Fire Brigade
This Department is headed by the Fire Brigade Superintendent. The functions of the department are as follows:
• Attending fire/Emergency Calls in PCB limit as well as adjoining PMC limit • Inspection of Hazardous places • Miscellaneous Calls
The staff strength of the department with the number of sanctioned and actual employees is as follows:
Table 8: Staff Strength – Fire Department
S.No. Name of the post Sanctioned Strength Actual No. of Employees
1. Fire Brigade Supdt. 01 01 2. Drivers 07 07 3. Fire Brigade Tandels 03 03 4. Fire Brigade Lascars 25 23 TOTAL 36 34
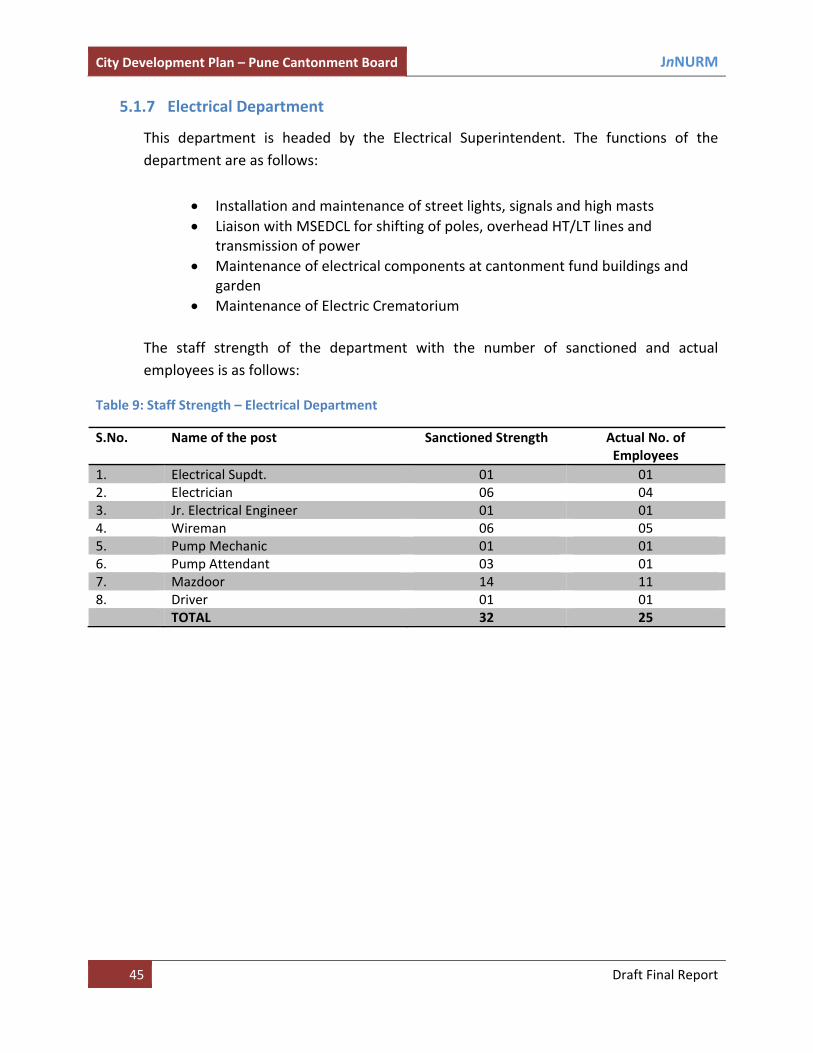
City Development Plan – Pune Cantonment Board JnNURM
45 Draft Final Report
5.1.7 Electrical Department
This department is headed by the Electrical Superintendent. The functions of the department are as follows:
• Installation and maintenance of street lights, signals and high masts • Liaison with MSEDCL for shifting of poles, overhead HT/LT lines and
transmission of power • Maintenance of electrical components at cantonment fund buildings and
garden • Maintenance of Electric Crematorium
The staff strength of the department with the number of sanctioned and actual employees is as follows:
Table 9: Staff Strength – Electrical Department
S.No. Name of the post Sanctioned Strength Actual No. of Employees
1. Electrical Supdt. 01 01 2. Electrician 06 04 3. Jr. Electrical Engineer 01 01 4. Wireman 06 05 5. Pump Mechanic 01 01 6. Pump Attendant 03 01 7. Mazdoor 14 11 8. Driver 01 01 TOTAL 32 25

City Development Plan – Pune Cantonment Board JnNURM
46 Draft Final Report
6. INFRASTRUCTURE ASSESSMENT
This chapter discusses the status of urban service provisioning in the Cantonment area. These services include water supply, sewerage & sanitation, solid waste management, storm water drainage system, streetlighting, roads, public transportation; social infrastructure services such as schools, hospitals/ dispensaries, auditoriums, parks and playgrounds etc. Except water supply, all other services in the Cantonment Area are managed by PCB.
6.1 Water Supply
Water has constantly been deemed as a basic resource necessary to sustain life and as such should be made accessible to all. The water supply in the Cantonment Area is provided and managed by Pune Municipal Corporation. Specific information with respect to Cantonment Area for water supply is not specifically available.
6.1.1 Source of Water Supply
Surface Water The surface water is the prime source of water supply in Pune city which include rivers Mula and Mutha, Dams Khadakwasla, Panshet, Warasgaon and Temghar dams and lakes Pashan and Katraj. Khadakwasla dam is located at a distance of 20 Kms from the city, in North‐West direction on Mutha River. Panshet, Warasgaon and Temghar dams are located on the upstream of the Mutha River.
Ground Water Ground water is also another important source for meeting the water supply demand of Pune. There are around 399 dug wells and 4,820 bore wells.Depth of bore wells in Pune city is of approximately 10.5‐13.0 meters. Pre‐monsoon level of ground water table is 6.2 meters while after monsoon it becomes 4 meters.

City Development Plan – Pune Cantonment Board JnNURM
47 Draft Final Report
Table 10: Source of Water Supply
Source and Type of water
Rivers Mula, Mutha, Pavna Natural
Dams Khadakwasla, Panshet, Warasgaon, Temghar
Natural
Lakes Pashan lake, Katraj lake Natural Ground water 399 dug wells, 4,820 bore
wells. Man made
Storage capacity of different sources
Dam Storage Capacity (Thousand Million Cubic Feet)
Panshet 10.64 Varasgaon 12.81 Temghar 03.71 Khadakwasla 01.96 TOTAL 29.12
Water coverage Number of water Distribution Zones
48
Coverage of water supply Tap connections (in %)
94.19
Per capita average water supply (in LPCD)
194
Water losses Transmission and distribution losses (in %)
25
6.1.2 Primary Storage, Treatment, Transmission and Distribution
The water extracted from the surface and subsurface sources like intake wells, infiltration wells and bore wells is treated in the Water Treatment Plants (WTPs). At treatment plant, the raw water is made potable up to the standards of safe drinking water by pre‐chlorination, primary treatment and filtration. Quality control is assured through laboratory testing at the WTPs. Presently, there are 9 Water Treatment Plants under Pune Municipal Corporation (PMC). Table below shows the status of water treatment plants, areas and population served by treatment plants, method of treatment and their current installed treatment capacity in the cantonment area.
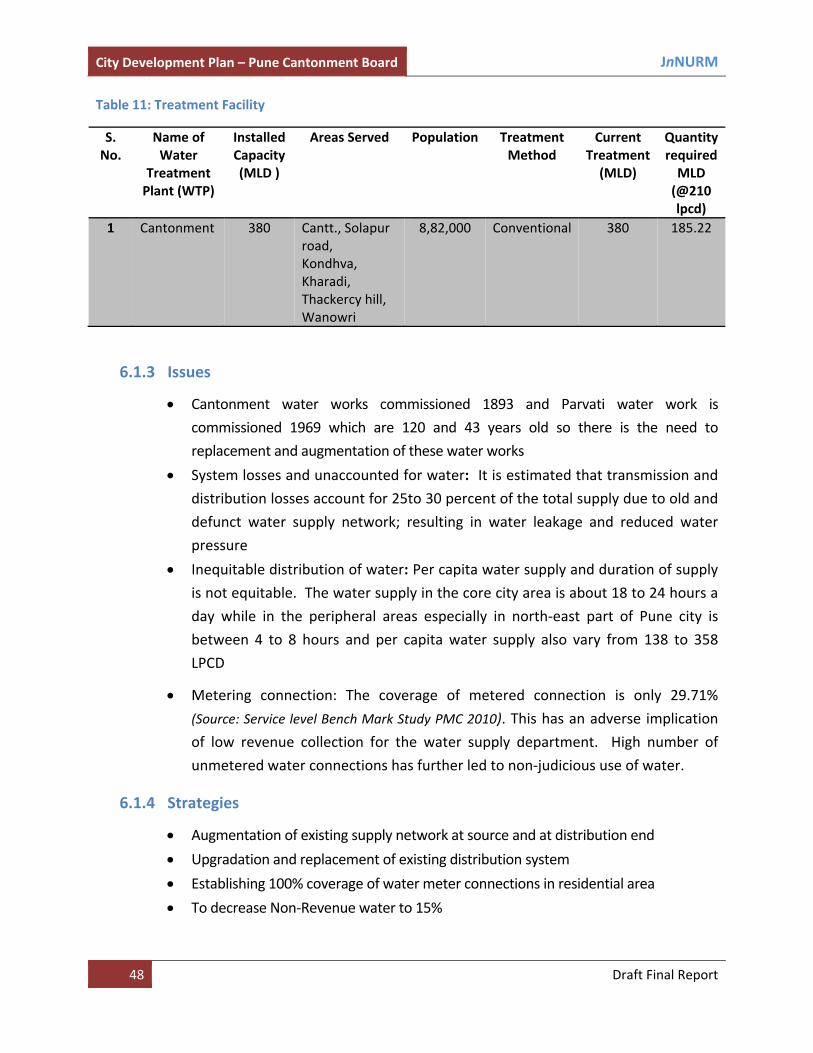
City Development Plan – Pune Cantonment Board JnNURM
48 Draft Final Report
Table 11: Treatment Facility
S. No.
Name of Water
Treatment Plant (WTP)
Installed Capacity (MLD )
Areas Served Population Treatment Method
Current Treatment (MLD)
Quantity required MLD (@210 lpcd)
1 Cantonment 380 Cantt., Solapur road, Kondhva, Kharadi, Thackercy hill, Wanowri
8,82,000 Conventional 380 185.22
6.1.3 Issues
• Cantonment water works commissioned 1893 and Parvati water work is
commissioned 1969 which are 120 and 43 years old so there is the need to
replacement and augmentation of these water works
• System losses and unaccounted for water: It is estimated that transmission and
distribution losses account for 25to 30 percent of the total supply due to old and
defunct water supply network; resulting in water leakage and reduced water
pressure
• Inequitable distribution of water: Per capita water supply and duration of supply
is not equitable. The water supply in the core city area is about 18 to 24 hours a
day while in the peripheral areas especially in north‐east part of Pune city is
between 4 to 8 hours and per capita water supply also vary from 138 to 358
LPCD
• Metering connection: The coverage of metered connection is only 29.71%
(Source: Service level Bench Mark Study PMC 2010). This has an adverse implication
of low revenue collection for the water supply department. High number of
unmetered water connections has further led to non‐judicious use of water.
6.1.4 Strategies
• Augmentation of existing supply network at source and at distribution end
• Upgradation and replacement of existing distribution system
• Establishing 100% coverage of water meter connections in residential area
• To decrease Non‐Revenue water to 15%

City Development Plan – Pune Cantonment Board JnNURM
49 Draft Final Report
6.2 Sewerage and Sanitation
Sanitation refers to the safe management and disposal of human excreta and it’s a basic component for city development. Proper sanitation facilities for citizens are a major challenge for civic authorities. It is not only the problem of keeping city clean, it is also an economic and social problem of raising production and promoting good life. Sewerage treatment is one of the key processes in promoting improvement of sanitation and environment of a community. It involves process of taking impurities out of the wastewater through physical, chemical and biological means of treatment.
6.2.1 Sewerage generation and treatment
The present population of PCB area is about 71,781 persons (2011 census). A significant amount of population is the Cantonment area is floating, broadly estimated to be in the range of 50‐60,000 per day. The resident population in the PCB area may not exceed beyond a lakh as majority of the area is already developed. The total generation of sewerage is estimated to be about 20 MLD considering population growth. At present there is no Sewerage Treatment Plan (STP) in the area and all the generated sewerage from kitchen and bathrooms is disposed in natural drains. PCB has already earmarked land for setting up STPs at two different locations to save on pumping cost.
6.2.2 Existing Sewerage Conveyance System
The total Under Ground Drainage (UGD) network in the city is of about 23 kms. As compared to road length of about 48 kms, the conveyance network covers only 48% of the area.
Of the total existing network, about 40% is about more than 20 years old and balance 60% is laid in the past 10 years. The detail of the underground sewerage network is provided in the table below.

City Development Plan – Pune Cantonment Board JnNURM
50 Draft Final Report
Table 12: Status of Sewerage Network
S.No. Name of the Area and Diameter of the pipe
Length of the pipe(In m.)
Age of the pipe(In years)
1. Civil Area (Dia. In mm) 200 mm 1075 > 25 200 mm 1709 5 250 mm 101 5 300 mm 4917 5 450 mm 3851 5 600 mm 650 5 800 mm 322 52. Wanorie Bazaar 250 mm 700 >20 300 mm 200 >203. Ghorpadi Bazaar 250 mm 400 >10 300 mm 150 >104. Ghorpadi Village 250 mm 300 >20 300 mm 300 55. Fatimanagar 450 mm 500 >25 300 mm 1200 >15
Wanorie bazaar, Ghorpadi Village, Fatimanagar and some parts of Civil area – all this area would require replacement of the old network. At present there is no network in Bungalow area. It is estimated that about about 35 kms would be the requirement of new conveyance network of varying diameter.
6.2.3 Issues:
• No sewerage treatment facility; the collected sewerage is discharged in the natural drains creating water pollution and unpleasant and un‐hygienic conditions.
• Only 48% of the area covered with conveyance network
6.2.4 Strategies:
• Undertake a detail survey of the locations where the sewerage network needs to be replaced
• Undertake contour study of the overall area to study the gradient
• Plan sewerage network for peak capacity and considering floating population
• Explore decentralized system in the Bungalow area
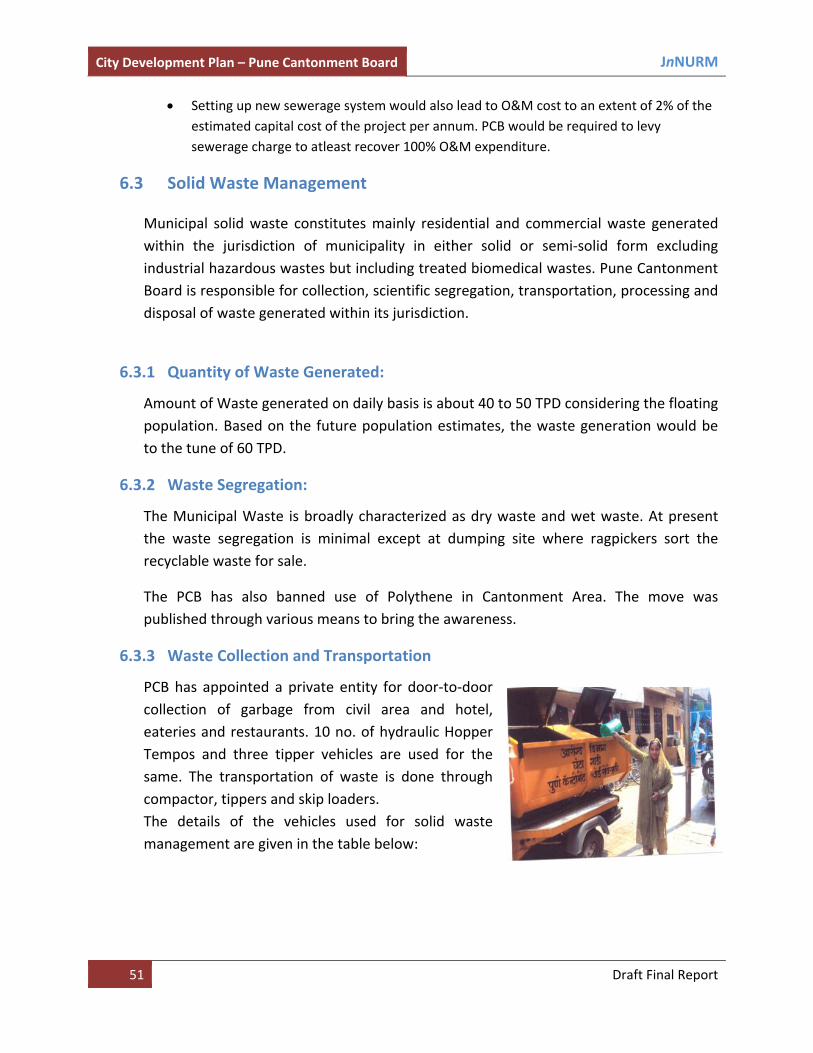
City Development Plan – Pune Cantonment Board JnNURM
51 Draft Final Report
• Setting up new sewerage system would also lead to O&M cost to an extent of 2% of the estimated capital cost of the project per annum. PCB would be required to levy sewerage charge to atleast recover 100% O&M expenditure.
6.3 Solid Waste Management
Municipal solid waste constitutes mainly residential and commercial waste generated within the jurisdiction of municipality in either solid or semi‐solid form excluding industrial hazardous wastes but including treated biomedical wastes. Pune Cantonment Board is responsible for collection, scientific segregation, transportation, processing and disposal of waste generated within its jurisdiction.
6.3.1 Quantity of Waste Generated:
Amount of Waste generated on daily basis is about 40 to 50 TPD considering the floating population. Based on the future population estimates, the waste generation would be to the tune of 60 TPD.
6.3.2 Waste Segregation:
The Municipal Waste is broadly characterized as dry waste and wet waste. At present the waste segregation is minimal except at dumping site where ragpickers sort the recyclable waste for sale.
The PCB has also banned use of Polythene in Cantonment Area. The move was published through various means to bring the awareness.
6.3.3 Waste Collection and Transportation
PCB has appointed a private entity for door‐to‐door collection of garbage from civil area and hotel, eateries and restaurants. 10 no. of hydraulic Hopper Tempos and three tipper vehicles are used for the same. The transportation of waste is done through compactor, tippers and skip loaders. The details of the vehicles used for solid waste management are given in the table below:

City Development Plan – Pune Cantonment Board JnNURM
52 Draft Final Report
Table 13: Vehicular Fleet ‐ SWM
Type of Vehicle No. of such vehicles Approximate age (In yrs.)
Carrying Capacity (in tons)
Compactor 2 5 6 Tipper 2 12 2 to 3 Skip Loader 5 10 2 JCB Machine 1 8 ‐
The present total number of vehicle are adequate for waste collection and transportation, however, tipper and skip loader are more than 10 years old and need to be replaced. With the growing waste quantity, PCB would require to procure new vehicles to undertake 100% collection and transporting the waste on‐time at landfill site.
6.3.4 Processing and Disposal of Waste:
The present location of dumping of waste is at 120/298 MaujeHadapsar Industrial Estate. There is also a vermin‐composting plant and screening machine facility available. As per the MSW Rules 2000, PCB would require to comply with scientific disposal of waste and create necessary infrastructure going forward.
Figure 3: Dumping of Solid Waste

City Development Plan – Pune Cantonment Board JnNURM
53 Draft Final Report
Figure 4: Vermi‐Composting Facility
6.3.5 Bio‐Medical Waste:
Biomedical Waste (Management and Handling) Rules 1998 makes it mandatory to all hospitals and dispensaries to segregate the biomedical waste from other solid waste and to set up an effective collection, treatment and disposal infrastructure for managing the waste. PCB has a separate management for collection and disposal of Bio‐Medical Waste and is not mixed with MSW.
6.3.6 Issues:
• The existing tipper and skip loader have lived their life and need replacement
• Need to create infrastructure for scientific landfill
• Segregation of waste at source needs to be introduced
• The present vermin‐composting facility need to be strengthen
6.3.7 Strategies:
• IEC campaigns may inculcate the practice of segregation of waste.
• Schools as a medium should be used to also increase the knowledge of the new generation towards better waste management practices
• Street vendors should also be brought in the ambit of waste management through IEC campaign
• Bio‐degradable waste from vegetable and fruit markets areas can be collected separately for vermi‐composting
• Maintaining the continuity of door to door collection
• Prepare robust waste management contracts with private operators
• 100% adherence of MSW Rules 2000
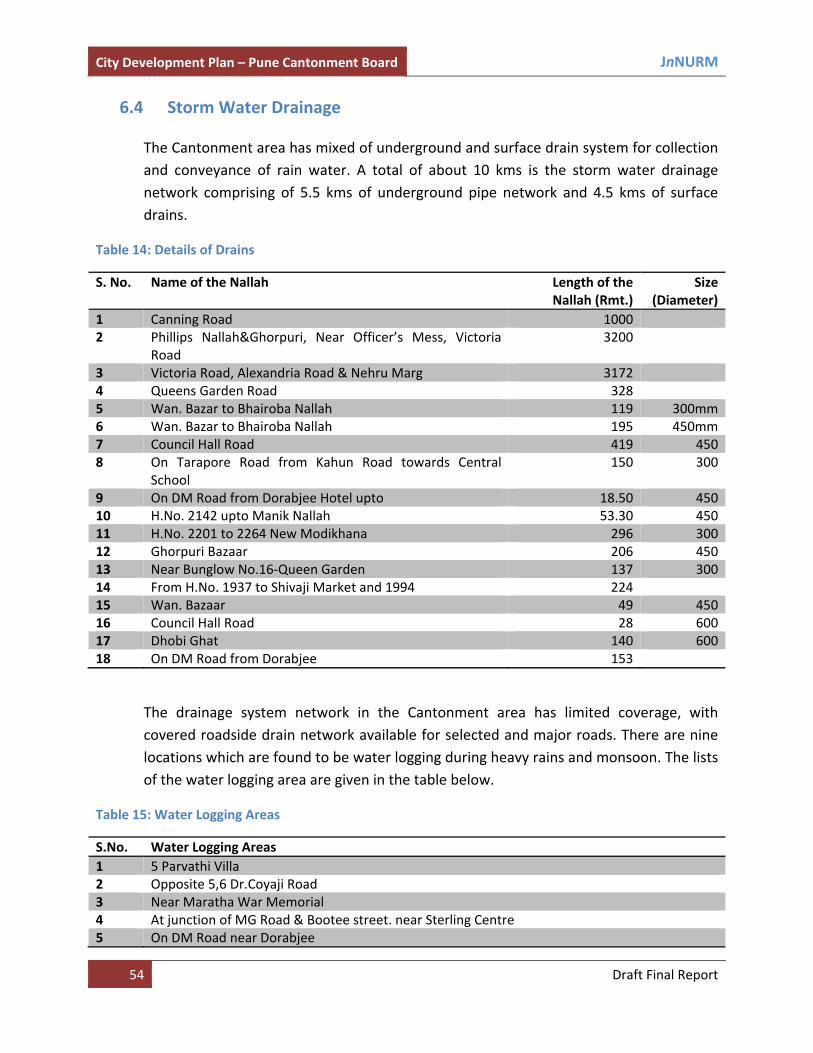
City Development Plan – Pune Cantonment Board JnNURM
54 Draft Final Report
6.4 Storm Water Drainage
The Cantonment area has mixed of underground and surface drain system for collection and conveyance of rain water. A total of about 10 kms is the storm water drainage network comprising of 5.5 kms of underground pipe network and 4.5 kms of surface drains.
Table 14: Details of Drains
S. No. Name of the Nallah Length of the Nallah (Rmt.)
Size (Diameter)
1 Canning Road 1000 2 Phillips Nallah&Ghorpuri, Near Officer’s Mess, Victoria
Road 3200
3 Victoria Road, Alexandria Road & Nehru Marg 3172 4 Queens Garden Road 328 5 Wan. Bazar to Bhairoba Nallah 119 300mm6 Wan. Bazar to Bhairoba Nallah 195 450mm7 Council Hall Road 419 4508 On Tarapore Road from Kahun Road towards Central
School 150 300
9 On DM Road from Dorabjee Hotel upto 18.50 45010 H.No. 2142 upto Manik Nallah 53.30 45011 H.No. 2201 to 2264 New Modikhana 296 30012 Ghorpuri Bazaar 206 45013 Near Bunglow No.16‐Queen Garden 137 30014 From H.No. 1937 to Shivaji Market and 1994 224 15 Wan. Bazaar 49 45016 Council Hall Road 28 60017 Dhobi Ghat 140 60018 On DM Road from Dorabjee 153
The drainage system network in the Cantonment area has limited coverage, with covered roadside drain network available for selected and major roads. There are nine locations which are found to be water logging during heavy rains and monsoon. The lists of the water logging area are given in the table below.
Table 15: Water Logging Areas
S.No. Water Logging Areas 1 5 Parvathi Villa 2 Opposite 5,6 Dr.Coyaji Road 3 Near Maratha War Memorial 4 At junction of MG Road & Bootee street. near Sterling Centre 5 On DM Road near Dorabjee
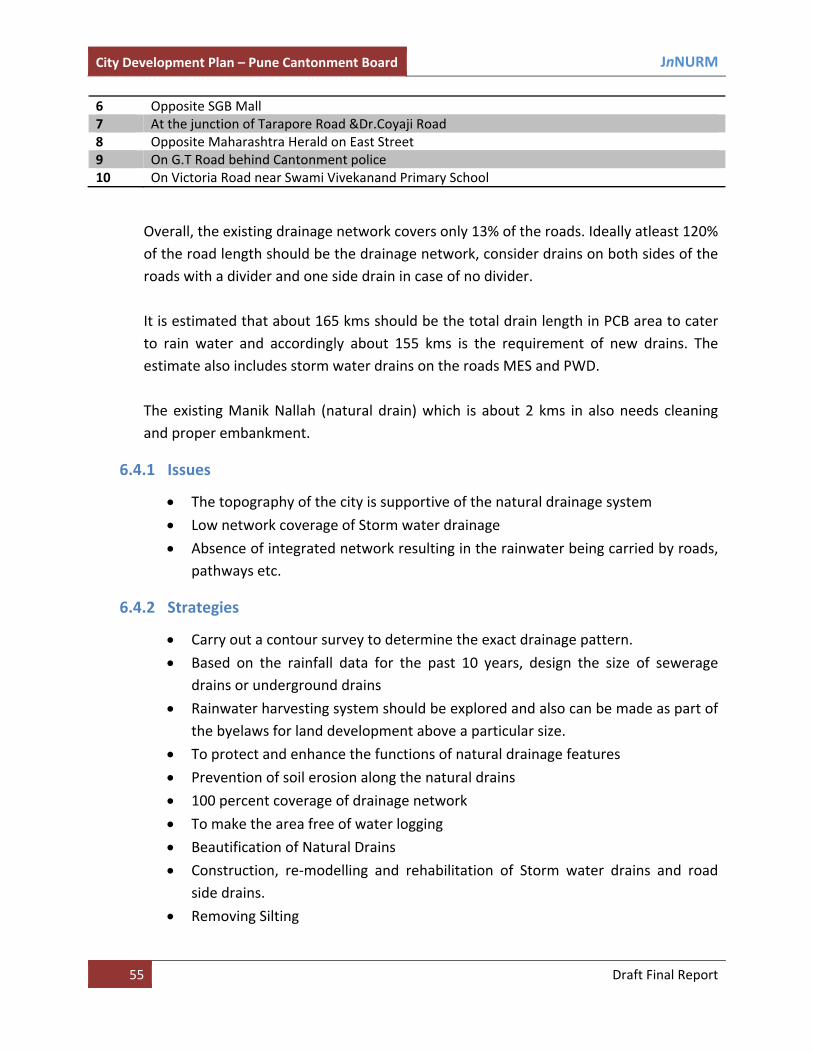
City Development Plan – Pune Cantonment Board JnNURM
55 Draft Final Report
6 Opposite SGB Mall 7 At the junction of Tarapore Road &Dr.Coyaji Road 8 Opposite Maharashtra Herald on East Street 9 On G.T Road behind Cantonment police 10 On Victoria Road near Swami Vivekanand Primary School
Overall, the existing drainage network covers only 13% of the roads. Ideally atleast 120% of the road length should be the drainage network, consider drains on both sides of the roads with a divider and one side drain in case of no divider. It is estimated that about 165 kms should be the total drain length in PCB area to cater to rain water and accordingly about 155 kms is the requirement of new drains. The estimate also includes storm water drains on the roads MES and PWD. The existing Manik Nallah (natural drain) which is about 2 kms in also needs cleaning and proper embankment.
6.4.1 Issues
• The topography of the city is supportive of the natural drainage system
• Low network coverage of Storm water drainage
• Absence of integrated network resulting in the rainwater being carried by roads, pathways etc.
6.4.2 Strategies
• Carry out a contour survey to determine the exact drainage pattern.
• Based on the rainfall data for the past 10 years, design the size of sewerage drains or underground drains
• Rainwater harvesting system should be explored and also can be made as part of the byelaws for land development above a particular size.
• To protect and enhance the functions of natural drainage features
• Prevention of soil erosion along the natural drains
• 100 percent coverage of drainage network
• To make the area free of water logging
• Beautification of Natural Drains
• Construction, re‐modelling and rehabilitation of Storm water drains and road side drains.
• Removing Silting
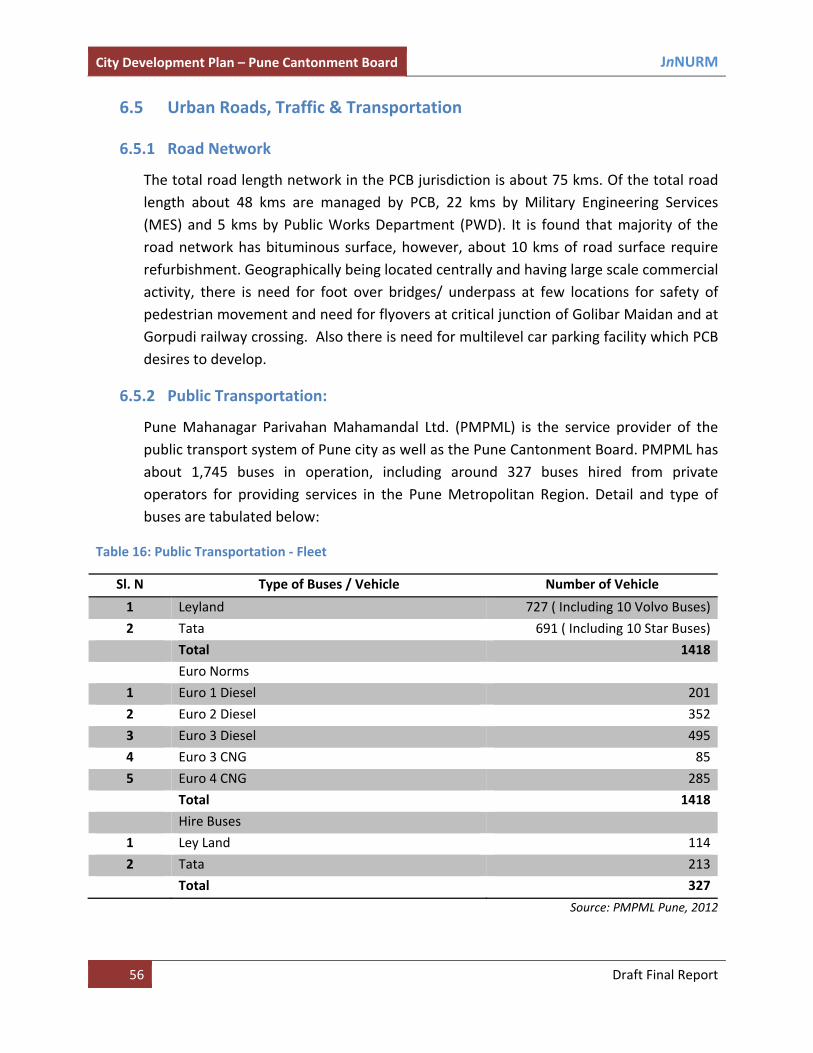
City Development Plan – Pune Cantonment Board JnNURM
56 Draft Final Report
6.5 Urban Roads, Traffic & Transportation
6.5.1 Road Network
The total road length network in the PCB jurisdiction is about 75 kms. Of the total road length about 48 kms are managed by PCB, 22 kms by Military Engineering Services (MES) and 5 kms by Public Works Department (PWD). It is found that majority of the road network has bituminous surface, however, about 10 kms of road surface require refurbishment. Geographically being located centrally and having large scale commercial activity, there is need for foot over bridges/ underpass at few locations for safety of pedestrian movement and need for flyovers at critical junction of Golibar Maidan and at Gorpudi railway crossing. Also there is need for multilevel car parking facility which PCB desires to develop.
6.5.2 Public Transportation:
Pune Mahanagar Parivahan Mahamandal Ltd. (PMPML) is the service provider of the public transport system of Pune city as well as the Pune Cantonment Board. PMPML has about 1,745 buses in operation, including around 327 buses hired from private operators for providing services in the Pune Metropolitan Region. Detail and type of buses are tabulated below:
Table 16: Public Transportation ‐ Fleet
Sl. N Type of Buses / Vehicle Number of Vehicle
1 Leyland 727 ( Including 10 Volvo Buses)
2 Tata 691 ( Including 10 Star Buses)
Total 1418
Euro Norms
1 Euro 1 Diesel 201
2 Euro 2 Diesel 352
3 Euro 3 Diesel 495
4 Euro 3 CNG 85
5 Euro 4 CNG 285
Total 1418
Hire Buses
1 Ley Land 114
2 Tata 213
Total 327
Source: PMPML Pune, 2012

City Development Plan – Pune Cantonment Board JnNURM
57 Draft Final Report
6.5.3 Key issues in traffic and transportation
The location of Cantonment is the central in Pune map and because of presence of famous shopping locations such as Camp attracts majority of people from all over Pune. At present the parking facility in the area is that of road side parking. There is no multilevel parking facility in the Cantonment Area.
Figure 5: Road Side Pay and Park Facility
The Pune Cantonment Area also witness heavy vehicular traffic flowing towards the Sholapur. The Sholapur road passing through Cantonment Area thus remains congested and with growing vehicular population the traffic situation on this corridor would lead to more traffic issues. Junctions such as at Golibar Maidan needs immediate solutions in terms of flyover or underpass, however, options needs to be explored as the road width on the corridor is limited. This would require meticulous planning with the traffic authority.
Further as per discussion with PCB officials, about 14 kms of roads in the Cantonment Area required strengthening through concrete surfacing. The key important roads are –
• Richardson Road – 0.5 km
• Canning Road – 1 km
• Prince of Wales Road ‐ 3 kms
• Other Roads – 4.5 kms
• PWD Roads – 5 kms
The infrastructure below these roads would also need to be refurbished while the roads are resurfaced. Also infrastructure in terms of conduits on both sides of roads would be required for laying electricity and telecommunication cables.

City Development Plan – Pune Cantonment Board JnNURM
58 Draft Final Report
6.6 Street Lighting
Street lighting and fire fighting are one of the key facilities required for any town or city. Street Lighting helps prevent accidents properly guiding the movement of vehicles and pedestrians. Moreover, street lighting has an aesthetic value as it adds to the attractiveness and effervescence of the city. The value of street lighting comes from its relationship with the crime prevention as it helps wards off criminals from perpetrating any unlawful act. There are about 2446 street light poles in the PCB jurisdiction. Given the total road length of 48 kms, the spacing between the street lights works out to be about 20 meters, which is below the said norm of 30 meters indicating adequate streetlight poles.
Table 17: Streetlighting – No. of Poles and Fixtures
Particulars Nos. Total No. of Street Poles 2446 Total No. of fixtures with sodium vapour lamps 3920
The present street lighting infrastructure comprise of sodium vapour lamps. The Electricity consumption for the street lights is around 800 KW. The average electricity bill per month amounts to Rs.11 lakhs. However, going forward, PCB can economize on energy through use of better light fixtures that consumes less energy as compared to sodium vapour lamps.
Table 18: Streetlighting ‐ Load
# Location for Street light fittings
Wattage wise Description Area wise load KW
Total fitting Nos.
Total load in KW
PCB Pole Nos.
40 100 150 250 400 500 1000
1. Bazaar Area
2 0 655 707 101 0 6 321.48
1471 321.48 833
2. Wanorie Area
20 13 466 807 199 1 2 355.85
1508 355.85 946
3. Ghorpuri Area
8 18 394 435 85 0 1 204.97
941 204.97 667
Load in WATT
1200 3100 227250
487250 154000
500 9000
882300
3920 0 2446
Load in KW
1.2 3.1 227.25 487.25 154 0.5 9 882.3 3920 882.3 2446
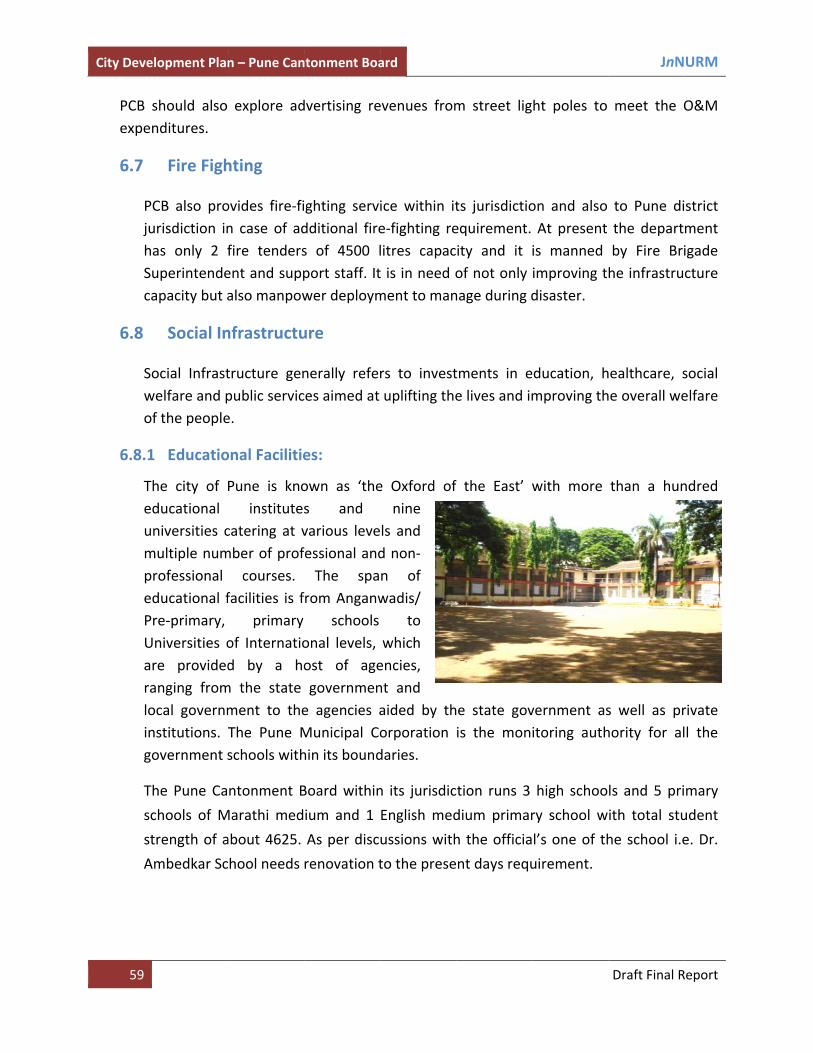
City Deve
59
PCB expen
6.7
PjuhSca
6.8
Sowo
6.8.1
TeumpePUaraloingo
T
sc
st
A
elopment Plan
should also nditures.
Fire Figh
CB also prourisdiction inas only 2 fuperintendeapacity but a
Social In
ocial Infrastwelfare and pf the people
1 Educatio
he city of Pducational niversities c
multiple numrofessional ducational fre‐primary,
Universities ore providedanging fromocal governmnstitutions. Tovernment s
he Pune Ca
chools of M
trength of a
Ambedkar Sc
n – Pune Can
explore ad
hting
ovides fire‐fin case of adfire tendersent and suppalso manpow
nfrastructu
tructure genpublic service.
onal Facilitie
Pune is knoinstitutes
catering at vmber of prof
courses. facilities is f
primary of Internatiod by a hom the state ment to theThe Pune Mschools with
ntonment B
Marathi med
about 4625.
hool needs
ntonment Boa
dvertising re
ghting servidditional fires of 4500 lport staff. Itwer deploym
ure
nerally referces aimed at
es:
own as ‘thes and various levefessional andThe spa
from Anganwschools
onal levels, ost of agegovernmen
e agencies aMunicipal Cohin its bound
Board within
ium and 1
As per disc
renovation t
ard
evenues from
ice within ite‐fighting relitres capact is in need oment to man
rs to investuplifting the
e Oxford of nine
ls and d non‐n of wadis/
to which encies, nt and aided by thorporation daries.
n its jurisdic
English med
ussions with
to the prese
m street lig
ts jurisdictioequirement. ity and it of not only nage during d
tments in ee lives and im
f the East’ w
e state govis the mon
tion runs 3
dium primar
h the officia
nt days requ
ht poles to
on and also At present is manned improving tdisaster.
ducation, hmproving th
with more
vernment asitoring auth
high schoo
ry school w
l’s one of th
uirement.
JnN
Draft Final R
meet the O
to Pune dithe departby Fire Brihe infrastru
healthcare, she overall we
than a hun
s well as prhority for al
ls and 5 pri
ith total stu
he school i.e
URM
Report
O&M
strict ment igade cture
social elfare
ndred
rivate l the
mary
udent
e. Dr.

City Deve
60
Table 19:
S.
No.
1 Dr.
2 Dr.
3 Ma
4 Ma
5 Ma
6 Gho
7 Sha
8 Swa
9 Ma
Sch
10 Rav
M
elopment Plan
Educational
Ambedkar M
Ambedkar M
hadji Shinde
hadji Shinde
hadji Shinde J
orpuri Village
heed Bhagat
ami Vivekana
harashi An
ool
vindra Nath T
MAHADJI SH
n – Pune Can
Institutes in
Particulars
Memorial Prim
Memorial High
Primary Scho
High School
Jr. College
High School
Singh Primar
nd Primary Sc
nasaheb Sh
Tagore Schoo
INDE HIGH S
ntonment Boa
PCB Area
mary School
h School
ool
ry School
chool
hinde Prim
l
SCHOOL
ard
Mediu
Marat
Marat
Marat
Marat
Marat
Marat
Marat
Marat
ary Marat
Englis
SHAH
um Clas
thi Balwad
thi V –
thi Balwad
thi V –
thi XI –
thi V –
thi Balwad
thi Balwad
thi Nurse
Balwad
sh Nurser
HEED BHAGA
ses To
Stud
di ‐ IV
– X
di – IV
– X
XII
– X
di – IV
di – IV
ery ‐
di ‐VII
ry – IX
AT SINGH PR
JnN
Draft Final R
otal
dents
No
Teac
155
523
308
668
175
1235
282
155
186
938
RIMARY SCH
URM
Report
o. of
chers
06
19
13
27
02
45
08
06
09
20
HOOL

City Deve
61
A
6.8.2
Inwin
Figure 6:
elopment Plan
AMBEDKAR PR
2 Health Fa
n the Cantowards and sundoor patien
Medical Facil
n – Pune Can
RIMARY SCHO
acilities:
onment Areaurgical facilitnts and 95,4
lities in Canto
ntonment Boa
OOL
a, the Boardties. In addi14 outdoor
onment Area
ard
d maintainsition, there patients we
a
DR.BABA
MEMO
s a 100 bedare three dre treated d
ASAHEB AMBE
ORIAL HIGH SC
dded hospitadispensaries.uring 2011‐1
JnN
Draft Final R
EDKAR
CHOOL
al with sep. A total of 12.
URM
Report
arate 2989

City Deve
62
Tafaet TattesefaICpasuin Inahap
elopment Plan
he existing 1nd secondaacilities for ttc. This hosp
he diagnostt present inerms of equecondary caacilities for CU etc. Patierovided in Ere almost nurgeries is pnfant stage a
n terms of stre about 40ospital has dministrativrovide effici
n – Pune Can
100 bedded ry care to tertiary carepital mainly s
ic facilities snadequate. uipments & are stage anpatients neeents requirinENT, ophthanegligible. Aperformed. Tand needs at
taffing, the nurses to sother suppove staff etc. Hent patient
ntonment Boa
hospital wapatients. The like hi‐techstarted as m
such as x‐rayThe physiotskilled man
nd needs reeding criticang critical arealmology, orAll these areThe present ttention.
hospital hassupport the ort staff viz.,However, thcare manag
ard
s establishehis is mainlh equipmenmaternity hos
y, sonographtherapy depnpower. Theenovation. Aal care like Ie transferredrthopedics, pe surgical bstatus of ca
s 15 doctorspatient care, x‐ray technhe existing stement as co
d in the yeay because tnts, skilled stspital.
hy and pathpartment nee operationAt present, ICU, traumad to other hpediatrics, granches butasualty and
of which 5 e on a regulnician, healttaff in the hompared to p
r 1928 and cthe hospitataff, super s
ology lab ofeeds drastic theater cothe hospitaa unit, neonospitals. At general surgt very minimemergency
are on contar basis. Apth supervisoospital is noprivate hosp
JnN
Draft Final R
caters to pril does not specialty ser
f the hospitac upgradatioomplex is alsal does not atal and surpresent, serery departmmum numbdepartment
tract basis. Tart from thir, lab assistaot in a positiopitals.
URM
Report
mary have rvices
al are on in so of have rgical rvices ments er of t is in
There is the ance, on to

City Development Plan – Pune Cantonment Board JnNURM
63 Draft Final Report
6.8.3 Recreational and Other Facilities:
Recreation involves engaging in activities engaging for enjoyment and relaxation. Recreational facilities are important in giving citizens options for their leisure. The fast moving city which is influenced by technological advancement and industrial development, still places due importance to culture and tradition. One finds that even though the mall and multiplex culture has set in, people, young and old still visit theaters to watch Marathi plays.
Table 20: Recreational Spaces
S.No. Facility Number
1. Gardens 7
2. Open Playgrounds 3
3. Auditorium Facilities ‐
Out of the many number of gardens and open playgrounds, seven gardens and three open playgrounds are situated in the Cantonment Board.
MUREDHA NALLA GARDEN
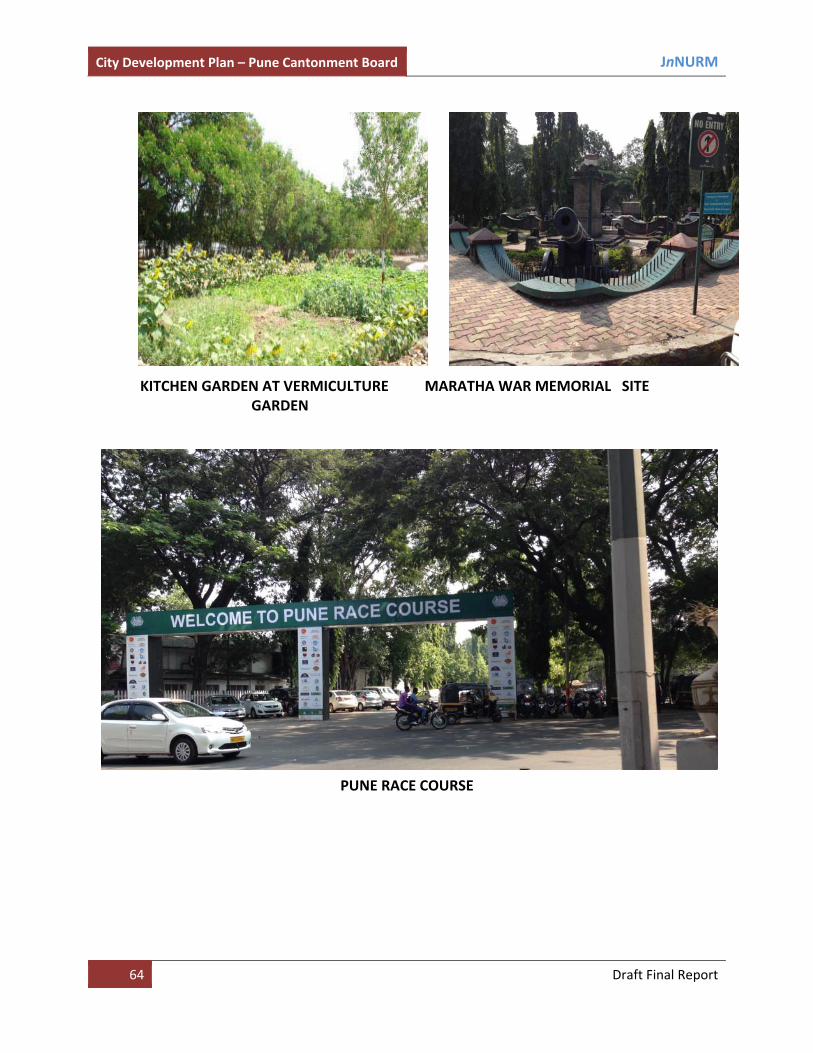
City Development Plan – Pune Cantonment Board JnNURM
64 Draft Final Report
KITCHEN GARDEN AT VERMICULTURE MARATHA WAR MEMORIAL SITE GARDEN
PUNE RACE COURSE

City Development Plan – Pune Cantonment Board JnNURM
65 Draft Final Report
Figure 7: Market Place Maintained by Cantonment Board
The Cantonment Board maintains 4 pubic markets having a total of 545 stalls.
6.9 Urban Environment:
Earlier during 2011‐12, PCB planted about 2343 saplings in the Cantonment Area. PCB proposes to take up plantation programme for the year 2013‐14 at various places to enhance the greenery and ambience of the Cantonment Area.
Figure 8: Urban Greenery

City Development Plan – Pune Cantonment Board JnNURM
66 Draft Final Report
PLANTATION ON MANECKJI MEHATA ROAD
EMPRESS GARDEN
The list of places along with the nature of tree is provided in the table below.
Table 21: Proposed Plantation
S.No. Name of the road/Site Approximate No. of
plantation can be
carries out
Proposed
plants/kind of
plants selected
1 Pune Solapur road along periphery of race course 25 Undi
2 Pune Solapur road along Hindustani Church & along 10 Undi
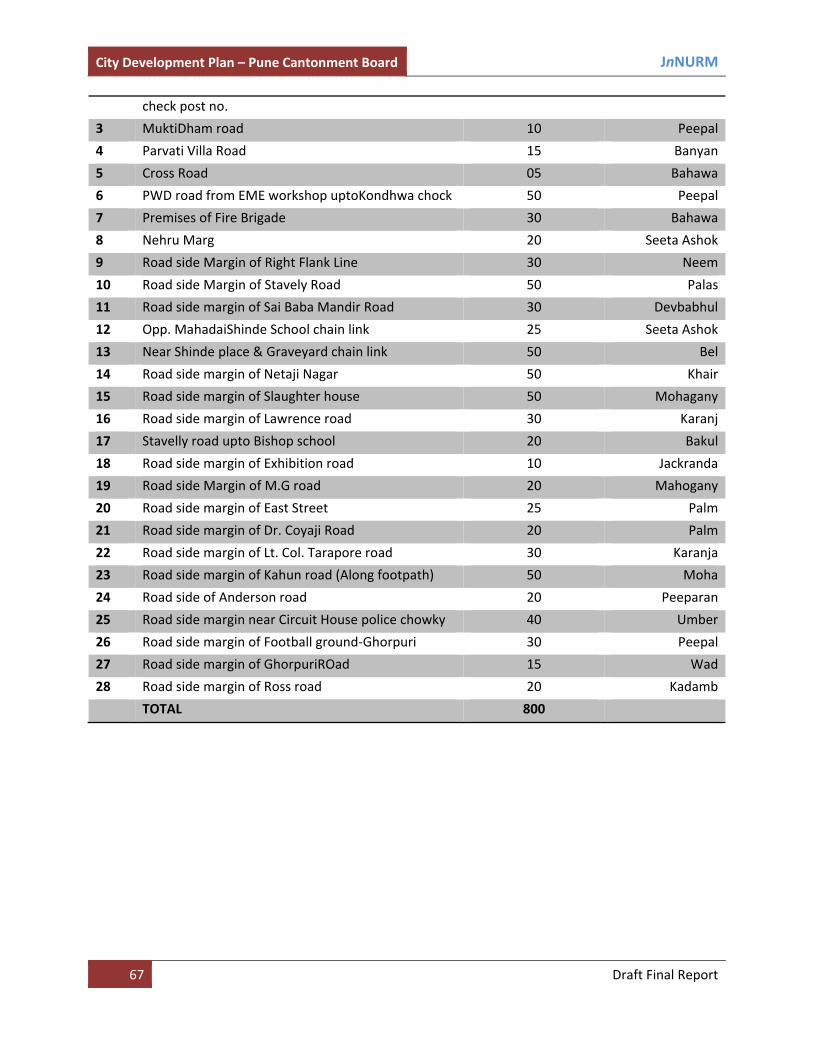
City Development Plan – Pune Cantonment Board JnNURM
67 Draft Final Report
check post no.
3 MuktiDham road 10 Peepal
4 Parvati Villa Road 15 Banyan
5 Cross Road 05 Bahawa
6 PWD road from EME workshop uptoKondhwa chock 50 Peepal
7 Premises of Fire Brigade 30 Bahawa
8 Nehru Marg 20 Seeta Ashok
9 Road side Margin of Right Flank Line 30 Neem
10 Road side Margin of Stavely Road 50 Palas
11 Road side margin of Sai Baba Mandir Road 30 Devbabhul
12 Opp. MahadaiShinde School chain link 25 Seeta Ashok
13 Near Shinde place & Graveyard chain link 50 Bel
14 Road side margin of Netaji Nagar 50 Khair
15 Road side margin of Slaughter house 50 Mohagany
16 Road side margin of Lawrence road 30 Karanj
17 Stavelly road upto Bishop school 20 Bakul
18 Road side margin of Exhibition road 10 Jackranda
19 Road side Margin of M.G road 20 Mahogany
20 Road side margin of East Street 25 Palm
21 Road side margin of Dr. Coyaji Road 20 Palm
22 Road side margin of Lt. Col. Tarapore road 30 Karanja
23 Road side margin of Kahun road (Along footpath) 50 Moha
24 Road side of Anderson road 20 Peeparan
25 Road side margin near Circuit House police chowky 40 Umber
26 Road side margin of Football ground‐Ghorpuri 30 Peepal
27 Road side margin of GhorpuriROad 15 Wad
28 Road side margin of Ross road 20 Kadamb
TOTAL 800

City Development Plan – Pune Cantonment Board JnNURM
68 Draft Final Report
7. CAPITAL INVESTMENT PLAN
This chapter discuss the investment requirement of PCB to meet the infrastructure requirement of the population for the mid and long term period. The section details the investment required across each of the sector and further discuss each of the infrastructure area in detail.
The Capital Investment Plan (CIP) is an institution planning to plan the infrastructure development for meeting present and future needs of the population. After detailed assessment of each of the infrastructure sector and the present and future gaps the investment needs based on broad cost estimates has been arrived.
As discussed above the development of most of the vacant land parcels in Cantonment Area has already taken place barring some, hence the population increase would not be significant as incase of other cities. Further due to conversion of landuse to commercial use the population has shown a decline. Hence it is assumed that the population in the Cantonment Area wont increase significantly and we have assumed a marginal growth of 0.5% per annum to project the ultimate population. Further a population of about 60,000 is floating in the area due to intense commercial activities which use infrastructure. The total population for future infrastructure requirement is hence being planned for about 1.4 lakhs population.
The standards for estimating infrastructure needs Central Public Health and Environment Engineering Organisation (CPHEEO) and Service Level Benchmarks (SLB) of Ministry of Urban Development (MoUD) have been adopted. Where ever, standards are not available, industry standards are adopted. The key standards adopted are
Water Supply
• Supply level – 135 lpcd
• Coverage –100%
• Treatment – 100%
• Supply hours – 24 hours
• Non‐Revenue‐Water – 15%
• Metering – 100%
• Complaint Redressal – 100%
Sewerage
• Generation – 80% of water supplied
• Coverage – 100%
• Treatment – 100%
• Complaint Redressal – 100%
• Reuse of treated waste water
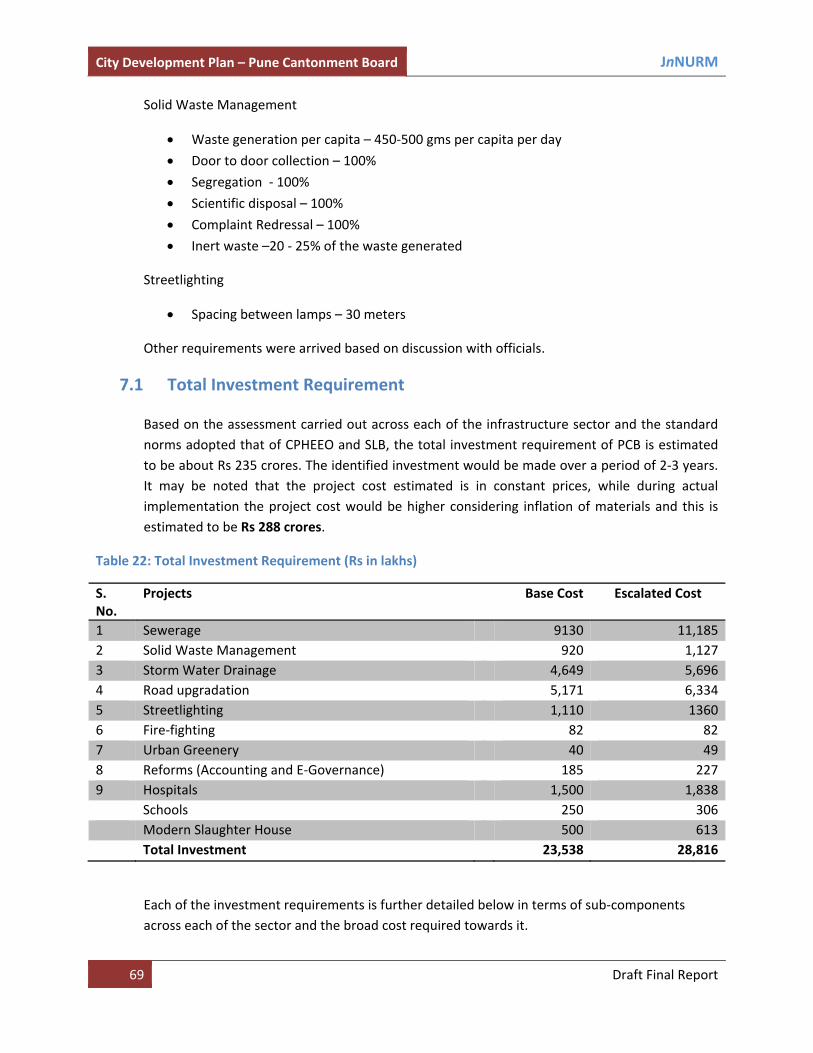
City Development Plan – Pune Cantonment Board JnNURM
69 Draft Final Report
Solid Waste Management
• Waste generation per capita – 450‐500 gms per capita per day
• Door to door collection – 100%
• Segregation ‐ 100%
• Scientific disposal – 100%
• Complaint Redressal – 100%
• Inert waste –20 ‐ 25% of the waste generated
Streetlighting
• Spacing between lamps – 30 meters
Other requirements were arrived based on discussion with officials.
7.1 Total Investment Requirement
Based on the assessment carried out across each of the infrastructure sector and the standard norms adopted that of CPHEEO and SLB, the total investment requirement of PCB is estimated to be about Rs 235 crores. The identified investment would be made over a period of 2‐3 years. It may be noted that the project cost estimated is in constant prices, while during actual implementation the project cost would be higher considering inflation of materials and this is estimated to be Rs 288 crores.
Table 22: Total Investment Requirement (Rs in lakhs)
S. No.
Projects Base Cost Escalated Cost
1 Sewerage 9130 11,1852 Solid Waste Management 920 1,1273 Storm Water Drainage 4,649 5,6964 Road upgradation 5,171 6,3345 Streetlighting 1,110 13606 Fire‐fighting 82 827 Urban Greenery 40 498 Reforms (Accounting and E‐Governance) 185 2279 Hospitals 1,500 1,838 Schools 250 306 Modern Slaughter House 500 613 Total Investment 23,538 28,816
Each of the investment requirements is further detailed below in terms of sub‐components across each of the sector and the broad cost required towards it.
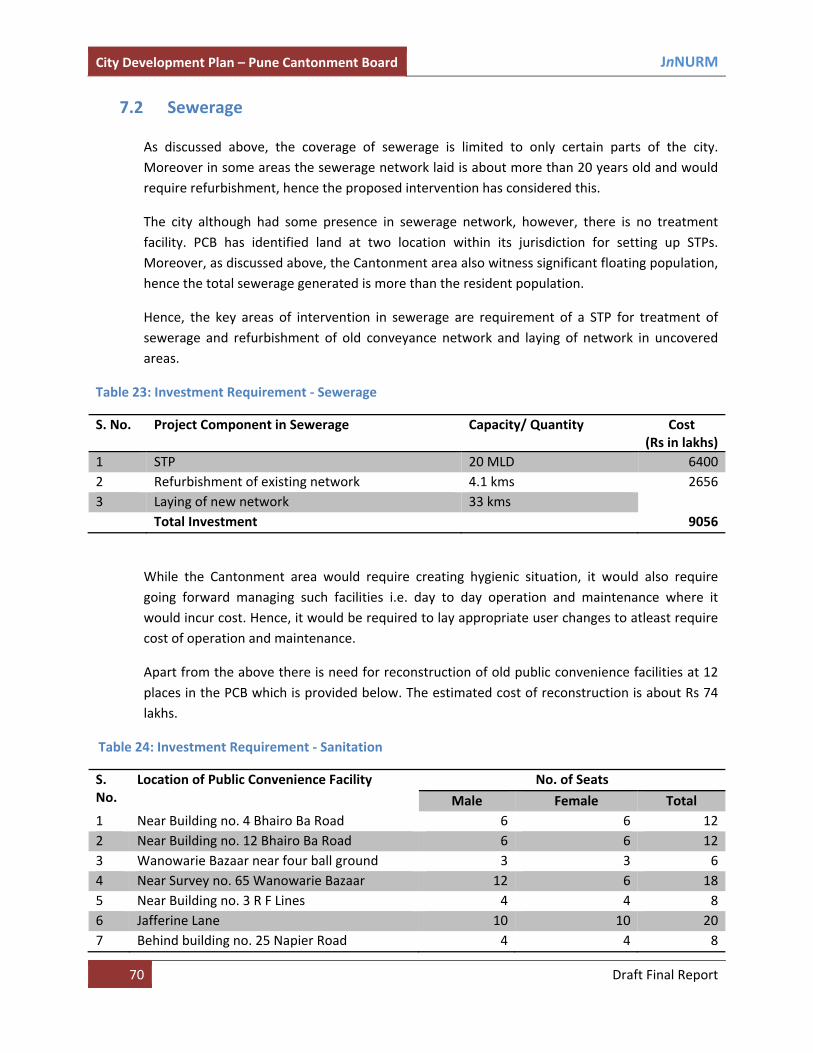
City Development Plan – Pune Cantonment Board JnNURM
70 Draft Final Report
7.2 Sewerage
As discussed above, the coverage of sewerage is limited to only certain parts of the city. Moreover in some areas the sewerage network laid is about more than 20 years old and would require refurbishment, hence the proposed intervention has considered this.
The city although had some presence in sewerage network, however, there is no treatment facility. PCB has identified land at two location within its jurisdiction for setting up STPs. Moreover, as discussed above, the Cantonment area also witness significant floating population, hence the total sewerage generated is more than the resident population.
Hence, the key areas of intervention in sewerage are requirement of a STP for treatment of sewerage and refurbishment of old conveyance network and laying of network in uncovered areas.
Table 23: Investment Requirement ‐ Sewerage
S. No. Project Component in Sewerage Capacity/ Quantity Cost (Rs in lakhs)
1 STP 20 MLD 64002 Refurbishment of existing network 4.1 kms 26563 Laying of new network 33 kms Total Investment 9056
While the Cantonment area would require creating hygienic situation, it would also require going forward managing such facilities i.e. day to day operation and maintenance where it would incur cost. Hence, it would be required to lay appropriate user changes to atleast require cost of operation and maintenance.
Apart from the above there is need for reconstruction of old public convenience facilities at 12 places in the PCB which is provided below. The estimated cost of reconstruction is about Rs 74 lakhs.
Table 24: Investment Requirement ‐ Sanitation
S. No.
Location of Public Convenience Facility No. of Seats
Male Female Total 1 Near Building no. 4 Bhairo Ba Road 6 6 122 Near Building no. 12 Bhairo Ba Road 6 6 123 Wanowarie Bazaar near four ball ground 3 3 64 Near Survey no. 65 Wanowarie Bazaar 12 6 185 Near Building no. 3 R F Lines 4 4 86 Jafferine Lane 10 10 207 Behind building no. 25 Napier Road 4 4 8
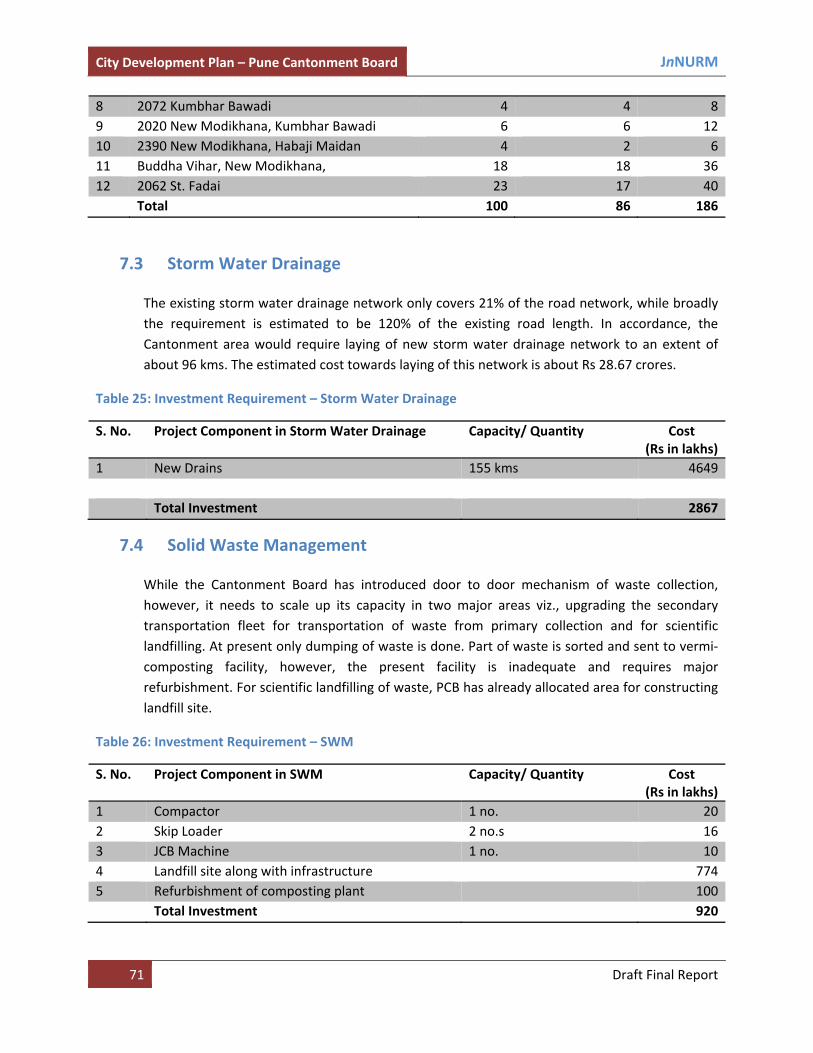
City Development Plan – Pune Cantonment Board JnNURM
71 Draft Final Report
8 2072 Kumbhar Bawadi 4 4 89 2020 New Modikhana, Kumbhar Bawadi 6 6 1210 2390 New Modikhana, Habaji Maidan 4 2 611 Buddha Vihar, New Modikhana, 18 18 3612 2062 St. Fadai 23 17 40 Total 100 86 186
7.3 Storm Water Drainage
The existing storm water drainage network only covers 21% of the road network, while broadly the requirement is estimated to be 120% of the existing road length. In accordance, the Cantonment area would require laying of new storm water drainage network to an extent of about 96 kms. The estimated cost towards laying of this network is about Rs 28.67 crores.
Table 25: Investment Requirement – Storm Water Drainage
S. No. Project Component in Storm Water Drainage Capacity/ Quantity Cost (Rs in lakhs)
1 New Drains 155 kms 4649 Total Investment 2867
7.4 Solid Waste Management
While the Cantonment Board has introduced door to door mechanism of waste collection, however, it needs to scale up its capacity in two major areas viz., upgrading the secondary transportation fleet for transportation of waste from primary collection and for scientific landfilling. At present only dumping of waste is done. Part of waste is sorted and sent to vermi‐composting facility, however, the present facility is inadequate and requires major refurbishment. For scientific landfilling of waste, PCB has already allocated area for constructing landfill site.
Table 26: Investment Requirement – SWM
S. No. Project Component in SWM Capacity/ Quantity Cost (Rs in lakhs)
1 Compactor 1 no. 202 Skip Loader 2 no.s 163 JCB Machine 1 no. 104 Landfill site along with infrastructure 7745 Refurbishment of composting plant 100 Total Investment 920

City Development Plan – Pune Cantonment Board JnNURM
72 Draft Final Report
The total investment requirement overall in this sector is thus estimated to be about Rs 9.2 crores. The above listed requirements have been estimated considering, the future resident and floating population in the Cantonment area.
7.5 Road Improvements
The infrastructure improvement requirement in this sector is based on discussion with department officials. Although majority of the roads in the area are bituminous; however, as per discussion, 4‐5 major roads in the area require re‐carpeting i.e. making them concrete roads for long term sustainability.
Table 27: Investment Requirement – Roads
S. No. Project Component in Roads Capacity/ Quantity Cost (Rs in lakhs)
1 Road Strengthening ‐ (Canning Road, Prince of Wales Road, Richardson Road Other Roads in PCB and PWD roads)
14 kms 280
2 Water supply lines to the improved roads 1403 Sewerage lines to the improved roads 11204 Conduits for electricity cables and telephone etc. 285 Under pass/ Pedestrian foot over bridge – 3 no.s 6006 Signage System 2.57 Flyover at Golibar Maidan 3000 Total Investment 5171
While it is intended that the roads would be concretized, it is also required that the infrastructure beneath this road is also upgraded to avoid digging of newly constructed roads. Hence, accordingly, PCB desires to upgrade the water, sewerage infrastructure and also construct conduits on the road site so as to facilitate laying of electricity and telecommunication cables.
Apart from above, the city witness high volume of intra and inter city traffic and the existing junction at Golibar Maidan needs to made free flow. Given the width of the road, either a flyover or an underpass should be explored along with other traffic planning to smoothen traffic on this junction and corridor.

City Development Plan – Pune Cantonment Board JnNURM
73 Draft Final Report
MAHATMA GANDHI ROAD

City Development Plan – Pune Cantonment Board JnNURM
74 Draft Final Report
EAST STREET
PRINCE OF WALES DRIVE
7.6 Streetlighting
While the department is managing the infrastructure efficiently, however, it has identified the following key interventions going forward to benefit services to citizens and to the floating population.
Table 28: Investment Requirement – Streetlight
S. No. Proposed Intervention Cost (Rs in lakhs)
1 Solar photo volatic power plant – 50 KW 1202 Solar street lights in gardens – 130 no.s 503 Centralized connectivity of traffic signals 2504 City surveillance system 1005 Improvement of streetlighting 2006 Incinerator at Shivaji Park & Cantt. Hospital 390
Total Investment 1,110

City Development Plan – Pune Cantonment Board JnNURM
75 Draft Final Report
7.7 Urban Greenery
To continue its efforts to environment upgradation, PCB desires to undertake massive plantation on various roads within its jurisdiction. It plans to plant about 800 saplings across various places. A list of such saplings along with the area is provided in the chapter above. PCB’s garden department would maintain this facility on a day to day basis.
7.8 Reforms
PCB is planning to undertake internal reforms to bring efficiency in the system. PCB is planning to introduce computerization i.e. e‐governance in various services. Also as part of reforms under JNNURM it is keen on developing other useful modules. At present following modules are in place ‐ land records, pay bills, hospital stock management, birth and death and establishment module is in place.
E‐Governance – Following are the other areas where PCB is aiming to introduce e‐governance viz.,
• Property tax
• Applications for GRT charges and trade license
• Central stores
• Building Application
• E‐Tendering
• SWM Vehicle tracking system
• Website development
Migration to double entry accrual based accounting system ‐ Although PCB is planning to adopt a system developed elsewhere, it would however require appointing a professional chartered accountancy firm who would provide day to day support for migration and creating balance sheets. It would also require procuring computers and other hardware.
It is estimated that PCB would require about Rs 1.8 crores towards e‐governance and double entry accounting system.
7.9 Hospitals & Schools
Hospital
PCB also desires to upgrade the existing 100 bedded hospital to multi‐specialty in the 1st phase and super specialty branches in next phases. The upgradation is intended in totality and requires upgradation of
• Hi‐tech equipments
• Services and facilities
City Development Plan – Pune Cantonment Board JnNURM
76 Draft Final Report
• Building and interiors along with air‐conditioning, adequate power supply etc.
• Upgradation in terms of skilled staff such as ICU consultant, intensivist, super specialty consultants, trained technicians to handle latest equipments etc.
• Training of existing paramedical and medical staff.
• Augmentation of staff
• Due attention to basic departments like ENT, ophthalmology, orthopedics, general surgery etc
This facility would be available for general public and urban poor and below poverty line population. The multispecialty facility would require an investment of about Rs 15 crores.
School
PCB also desires to develop two schools to present day’s requirement to make the structure safe and create a conducive environment for students. It is broadly estimated that it would require about Rs 2.5 crores of investment to upgrade this facility.
7.10 Modern Slaughter House
PCB also desires to re‐develop the existing old slaughter house as per the modern format. The existing slaughter house was set up in the year 1885. At present about 150 animals and 30 big animals are slaughtered per day. The present capacity is inadequate and the requirement is double that of the present. The existing infrastructure at the slaughter house is also not conducive to the requirements. The existing flooring of Shahabad stone is non‐impervious and needs to be replaced; Poles needs to be replaced; Carcass hanging bars needs to be scrubbed and polished, broken windows/ doors, roof, walls, open electrical wiring etc.
It is proposed to construct a modern slaughter house of 300 small animals and 60 big animals per day capacity. The proposed slaughter house should also have incineration facility.
7.11 Fire‐fighting
As mentioned earlier the fire brigade department has limited infrastructure and is need of up‐gradation to cater to the changing needs. The following are the limited infrastructure addition needs to be made to the existing fleet
• Hydraulic Platform/ Sky Lift
• Ambulance
• Cargo Jeep
• Water tanker with 10,000 litres capacity with fire pump
• Rescue tender

City Development Plan – Pune Cantonment Board JnNURM
77 Draft Final Report
7.12 Vacant Land Development for Infrastructure Facilities
PCB has also identified about 5‐6 locations for developing the vacant land parcels for various social infrastructure (sports complex, convention centre), multilevel car parking and for generating revenues through land development by constructing commercial complexes.
PCB may explore implementing these facilities through PPP route. For each of the project it would require to carry out a feasibility study and arrive at a project structure for developing it on a PPP mode.
Table 29: Land Development
S. No. Proposed Project Area
1 Commercial Complex at Dhobi Ghat 7.38 acres (survey no. 544) 2 Sports Complex at Golibar Maidan 2.75 acres (survey no. 724 – C) 3 Convention Centre Ghorpuri Village 5.43 acres (survey no. 42 B) 4 Multilevel Parking 0.5 acres (survey no. 264) 5 Relocation of Cattle Shed 6 Commercial Complex at MG Road 0.32 acres (survey no. 390/843)
It also desires to relocate the existing cattle shed situated at Bachhu Adda to survey no. 813 & 815 Wanowie Tennary. Along with relocation it intends to promote livelihood activities on the said location by inviting interested players to set up allied activities. PCB may conduct a separate feasibility study and stakeholder consultation and explore it.
City Development Plan – Pune Cantonment Board JnNURM
78 Draft Final Report
8. FINANCIAL ASSESSMENT & FINANCIAL OPERATING PLAN
8.1 Financial Planning and Accounting System
The financial planning procedure at Cantonment is similar to those in municipal institutions. Every year estimates are prepared by the department for receipts and expenditures along with the list of works that need to be taken. The budget is at the first level scrutinized by the Head of the Accounting Section and then by the CEO of Cantonment and later on presented for approval and acceptance to the Board which comprise of elected members. All works approved by the board are then implemented during the year with due procedure and audit of accounts. Pune Cantonment Board at present follows the single entry cash based accounting system. The accounts are maintained in ledgers and are computerized. The PCB plans to introduce Double Entry Accrual Based Accounting System; it is in the process of adopting the system prepared in one of the other Cantonment Board. The detail planning and implementation plan to roll‐out the new system is under discussion and should be in place in a period of one year.
8.2 Status of Finance
This section of the report discusses the status of finances of PCB. The actual accounts statements of the past 5 years were analyzed. At present, the Cantonment’s Finances are structured in two broad heads viz., Total Receipts and Total Expenditure. To analyze the finances of PCB, the actual accounts were first reclassified into revenue and capital based on their nature to arrive at the correct picture and to also ensure that the forecast of finance is in a correct manner. As may be noted from the table below, the growth in revenue expenditure has exceeded the receipts. The revenue accounts itself was in deficit in the previous fiscal year and given the growth rate of expenditure and receipts the deficit may continue.

City Development Plan – Pune Cantonment Board JnNURM
79 Draft Final Report
Table 30: Financial Status at a Glance (Rs in Lakhs)
Particular 2008‐09 2009‐10 2010‐11 2011‐12 2012‐13 CAGR Opening Balance 367 365 1317 563 678 Revenue Receipts 4416 4700 3782 5975 6149 9%
Revenue Expenditure 4091 4252 5119 5745 6718 13%
Surplus/ Deficit 325 448 (1338) 230 (570)
Capital Receipts 71 44 148 164 84 4%
Capital Expenditure 537 496 314 2 11 (62%)Surplus/ Deficit (466) (452) (167) 162 73
Closing Balance 365 1317 563 678 800
On the capital account side, the account has been in deficit in the first three financial years and the capital works were also funded from the revenue surplus generated. Due to support of capital grants and revenue grants and investments made by PCB, the overall status i.e. the opening balance is positive.
8.3 Revenue Account
The revenue account comprise of revenue receipts and revenue expenditure.
8.3.1 Revenue Receipts
The revenue receipt is further categorized as per the source of the revenue i.e. own source and grants. Own sources of income comprise of taxes and charges levied by the PCB as per the provisions in the Cantonment Act and grants comprise of the revenue grant provided by Central Defence Ministry on a regular basis to PCB.
Own Sources of Revenue
Tax Revenues
On an average own sources of revenues comprise of 91% of the total revenue receipts, indicating lesser dependency on grants.
Table 31: Details of Revenue Receipts (Rs in Lakhs)
Particular 2008‐09 2009‐10 2010‐11 2011‐12 2012‐13 CAGROwn Sources 4416 4129 3538 5618 5625 10%
Tax 3386 3320 2463 4506 4281 6%Non‐Tax 1030 809 1076 1112 1344 6%
Grants 0 571 243 357 524 (3%)
Revenue Receipts 4416 4700 3782 5975 6149 9%

City Development Plan – Pune Cantonment Board JnNURM
80 Draft Final Report
Own sources of revenues is further categorized as tax and non‐tax source of revenue. The tax revenues of PCB comprise of Octroi, Property Tax, Water Tax, Vehicle Entry Tax, Sanitary Cess, Tax on trade and profession and other miscellaneous taxes.
Table 32: Break‐up of Tax Receipts (Rs in Lakhs)
Tax Receipts 2008‐09 2009‐10 2010‐11 2011‐12 2012‐13 CAGR
Total Tax Receipts 3386 3320 2463 4506 4281 6%Octroi 1648 1617 1385 2285 1536 (2)%Property Tax 1060 1096 514 1532 1892 16%Vehicle Entry Tax 547 491 424 332 377 (9)%Water Tax 8 4 3 7 6 (5)%Sanitary Cess 112 99 120 342 443 41%Tax on trade and profession 6 3 4 2 0 (88)%Others 5 10 12 6 27 55%
Octroi/ Local Body Tax (LBT)
Octroi has been the major source of revenues, however, recently from April 2013, Octroi is abolished in the state of Maharashtra and is replaced by Local Body Tax (LBT). The Octroi tax on goods and articles was collected by Pune Municipal Corporation and was shared on per capita basis with the Cantonment Board. With the introduction of LBT, PCB would now be entitled to levy the tax in its area. It is estimated that the revenues from LBT would be in the range of Rs 130 crores per year against an Octroi sharing by Pune Corporation of Rs 15 lakhs only. The significant increase in this tax is because of the fact that PCB was losing revenues as this was shared on per capita basis, owning to less population the share was less; however, while levying the same tax directly in the form of LBT the volume would increase and given that PCB area has significant presence of some large industries and commercial activity the revenue realization will the higher. The Cantonment Board has sought permission from Ministry of Defence for levy of Octroi, which is expected soon. Perhaps as per the Cantonment Act, Cantonments are empowered to levy such taxes within its area.
Property Tax
The second major source of tax revenue for PCB is the property tax. Property tax is levied as per the Annual Rental Value (ARV) system which is as per SRO Part III Sec Gazette Notification & Sec 66 of Cantonment Act 2006. The tax rate is revised every three years; last such revision was in the year 2008. The tax rate across different slabs is provided in the table below.
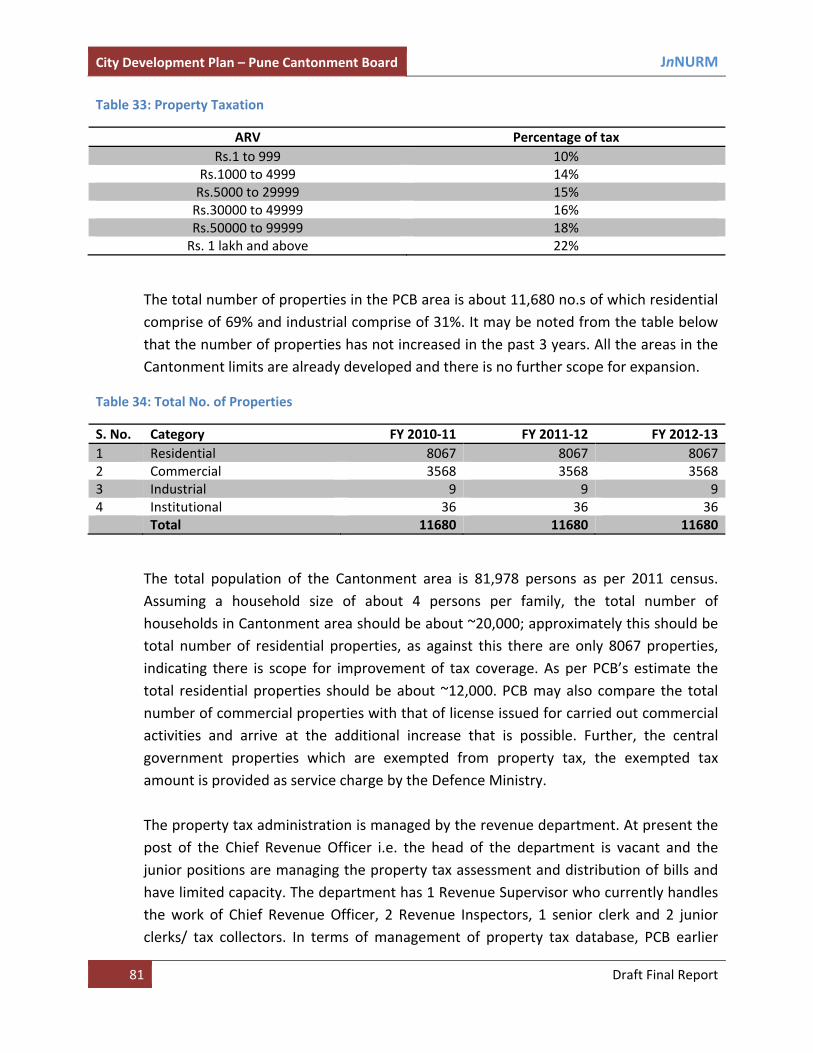
City Development Plan – Pune Cantonment Board JnNURM
81 Draft Final Report
Table 33: Property Taxation
ARV Percentage of tax Rs.1 to 999 10%
Rs.1000 to 4999 14% Rs.5000 to 29999 15% Rs.30000 to 49999 16% Rs.50000 to 99999 18% Rs. 1 lakh and above 22%
The total number of properties in the PCB area is about 11,680 no.s of which residential comprise of 69% and industrial comprise of 31%. It may be noted from the table below that the number of properties has not increased in the past 3 years. All the areas in the Cantonment limits are already developed and there is no further scope for expansion.
Table 34: Total No. of Properties
S. No. Category FY 2010‐11 FY 2011‐12 FY 2012‐131 Residential 8067 8067 80672 Commercial 3568 3568 35683 Industrial 9 9 94 Institutional 36 36 36 Total 11680 11680 11680
The total population of the Cantonment area is 81,978 persons as per 2011 census. Assuming a household size of about 4 persons per family, the total number of households in Cantonment area should be about ~20,000; approximately this should be total number of residential properties, as against this there are only 8067 properties, indicating there is scope for improvement of tax coverage. As per PCB’s estimate the total residential properties should be about ~12,000. PCB may also compare the total number of commercial properties with that of license issued for carried out commercial activities and arrive at the additional increase that is possible. Further, the central government properties which are exempted from property tax, the exempted tax amount is provided as service charge by the Defence Ministry. The property tax administration is managed by the revenue department. At present the post of the Chief Revenue Officer i.e. the head of the department is vacant and the junior positions are managing the property tax assessment and distribution of bills and have limited capacity. The department has 1 Revenue Supervisor who currently handles the work of Chief Revenue Officer, 2 Revenue Inspectors, 1 senior clerk and 2 junior clerks/ tax collectors. In terms of management of property tax database, PCB earlier

City Development Plan – Pune Cantonment Board JnNURM
82 Draft Final Report
adopted, Kalyan Dombivali Municipal Corporation’s (KDMC) property tax module, however, due to lack of proper support and system inefficiency, the module is discontinued and bills are prepared manually. The table below provides the status of arrears and current demand and collection. The per capita property tax current demand is about ~Rs 1315 which is comparatively good compared to other municipal corporations.
Table 35: Demand‐Collection – Property Tax (Rs in Lakhs)
Particular FY 2010‐11 FY 2011‐12 FY 2012‐13Demand 2529 2723 3444
Arrears 1144 1338 2135
Current 1385 1385 1309
Collection 556 1881 2212
Arrears 189 844 1134
Current 366 1037 1078Collection Efficiency 22% 69% 64%
Arrears 17% 63% 53%
Current 26% 75% 82%
As can be noted from the table above, the current collection efficiency has improved significantly in the last three years from 26% to 82%. In FY 2012‐13, arrears accounted for about ~60% of the total demand which is significant. As per discussion with officials, of the total arrears of Rs 21 crores, about Rs 5.5 crores is under litigation from a single commercial property.
Vehicle entry tax
The Cantonment Board also levies tax on commercial vehicles entering in the Cantonment’s jurisdiction. The tax is collected at various check points and PCB has appointed private operator to collect tax on its behalf and provide fixed revenue; the amount over and above the fixed revenue is retained by the private operator. The tax rates are determined by PCB and the prevailing tax rate is provided in the table below.
Table 36: Vehicle Entry Tax
Type of vehicle entry Tax Per Vehicle(in Rs.) Motor Bus carrying passengers of hire 20 Truck for carrying goods 20 Advertisement car/Light commercial vehicle carrying passengers 15 Three wheeler, auto‐rickshaws, tempo for carrying goods 15
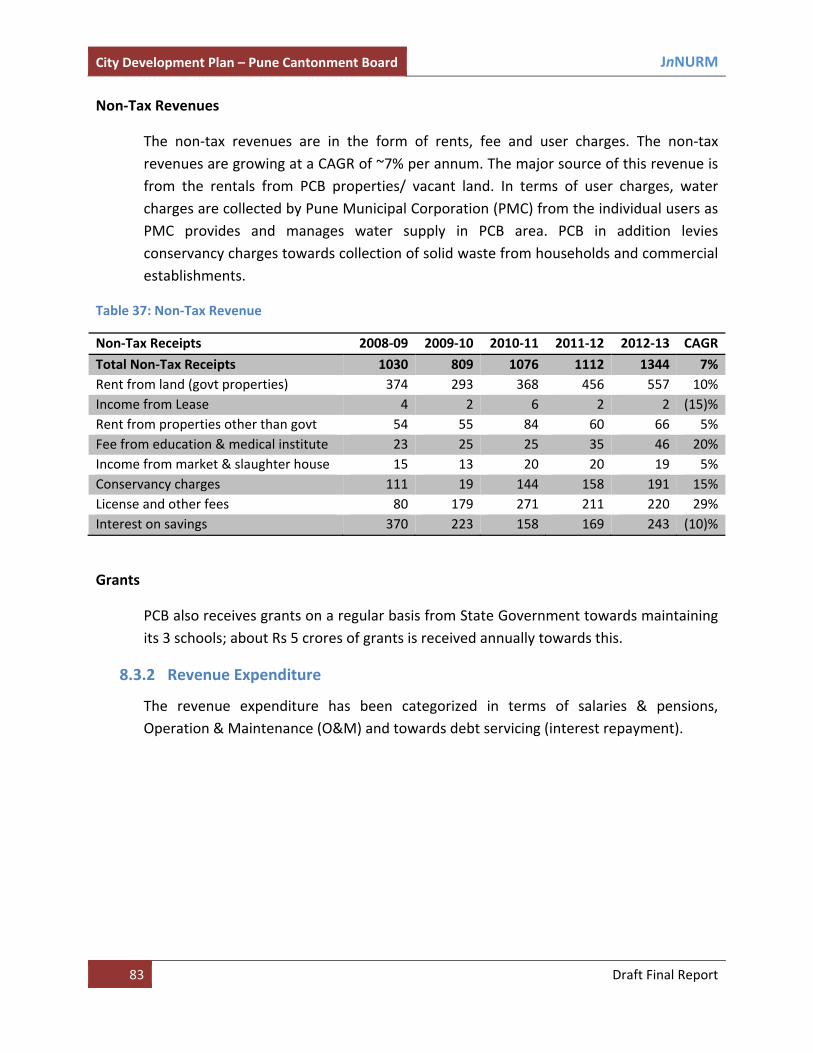
City Development Plan – Pune Cantonment Board JnNURM
83 Draft Final Report
Non‐Tax Revenues
The non‐tax revenues are in the form of rents, fee and user charges. The non‐tax revenues are growing at a CAGR of ~7% per annum. The major source of this revenue is from the rentals from PCB properties/ vacant land. In terms of user charges, water charges are collected by Pune Municipal Corporation (PMC) from the individual users as PMC provides and manages water supply in PCB area. PCB in addition levies conservancy charges towards collection of solid waste from households and commercial establishments.
Table 37: Non‐Tax Revenue
Non‐Tax Receipts 2008‐09 2009‐10 2010‐11 2011‐12 2012‐13 CAGR
Total Non‐Tax Receipts 1030 809 1076 1112 1344 7%Rent from land (govt properties) 374 293 368 456 557 10%Income from Lease 4 2 6 2 2 (15)%Rent from properties other than govt 54 55 84 60 66 5%Fee from education & medical institute 23 25 25 35 46 20%Income from market & slaughter house 15 13 20 20 19 5%Conservancy charges 111 19 144 158 191 15%License and other fees 80 179 271 211 220 29%Interest on savings 370 223 158 169 243 (10)%
Grants
PCB also receives grants on a regular basis from State Government towards maintaining its 3 schools; about Rs 5 crores of grants is received annually towards this.
8.3.2 Revenue Expenditure
The revenue expenditure has been categorized in terms of salaries & pensions, Operation & Maintenance (O&M) and towards debt servicing (interest repayment).

City Development Plan – Pune Cantonment Board JnNURM
84 Draft Final Report
Figure 9: Composition of Revenue Expenditure
As can be noted from the table below, about ~60% of the expenditure is towards salaries & pensions and balance towards O&M. PCB does not has any debt liability, hence there is no interest repayment. Ideally, expenditure on salaries should be in the range of 40% as sufficient funds should be available for O&M of services.
Table 38: Revenue Expenditure (Rs in Lakhs)
Particular 2008‐09 2009‐10 2010‐11 2011‐12 2012‐13 CAGR Salary & Pensions 2056 2587 3543 3514 3774 16%O&M Expenditure 2036 1665 1576 2231 2945 10%
Debt Servicing ‐ ‐ ‐ ‐ ‐ ‐
Revenue Expenditure 4091 4252 5119 5745 6718 13%
Salary & Pension Expenditure
As apparent from the graph, ~38% of the salary expenditure is towards health and sanitation, followed by salary of staff for schools. Pensions and gratuities accounts for about 24% of the expenditure.
Salaries, 60%
O&M, 40%
Debt Servicing,
0%
Composition of Revenue Expenditure
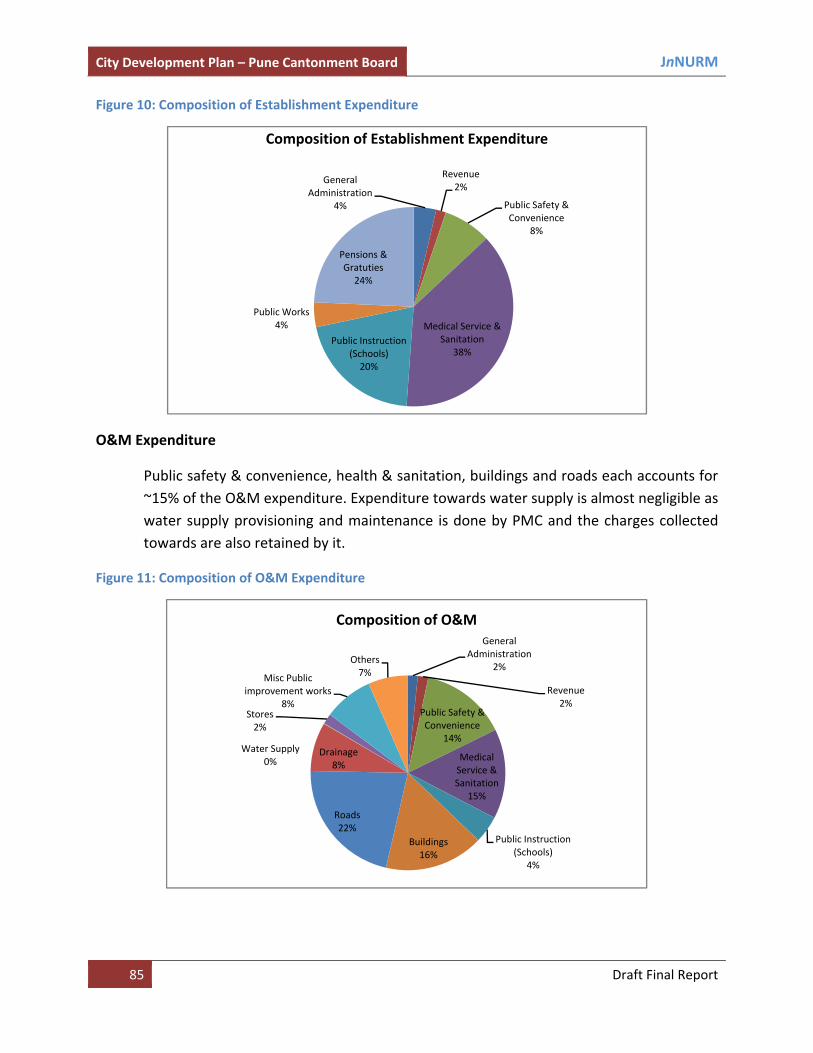
City Development Plan – Pune Cantonment Board JnNURM
85 Draft Final Report
Figure 10: Composition of Establishment Expenditure
O&M Expenditure
Public safety & convenience, health & sanitation, buildings and roads each accounts for ~15% of the O&M expenditure. Expenditure towards water supply is almost negligible as water supply provisioning and maintenance is done by PMC and the charges collected towards are also retained by it.
Figure 11: Composition of O&M Expenditure
General Administration
4%
Revenue2%
Public Safety & Convenience
8%
Medical Service & Sanitation
38%Public Instruction
(Schools)20%
Public Works4%
Pensions & Gratuties
24%
Composition of Establishment Expenditure
General Administration
2%
Revenue2%
Public Safety & Convenience
14%
Medical Service & Sanitation
15%
Public Instruction (Schools)
4%
Buildings16%
Roads22%
Drainage 8%
Water Supply0%
Stores2%
Misc Public improvement works
8%
Others 7%
Composition of O&M

City Development Plan – Pune Cantonment Board JnNURM
86 Draft Final Report
The other areas of O&M expenditure are provided in the table below.
Table 39: O&M Expenditure (Rs in Lakhs)
Particular 2008‐09 2009‐10 2010‐11 2011‐12 2012‐13 CAGR General Administration 21 19 34 35 60 30%
Revenue 31 67 40 30 15 (17%)
Public Safety & Convenience
209 273 267 312 441 20%
Medical Service & Sanitation
297 185 313 312 450 11%
Education 29 44 74 117 210 64%
Buildings 439 220 148 360 557 6%Roads 428 518 359 466 494 4%
Drainage 148 104 92 216 286 18%
Water Supply 2 1 5 ‐ 2 0%
Stores 55 29 21 32 41 (7%)
Misc Public Improvement 269 105 116 170 197 (7%)Others (office exp, legal,stationary, printing, postage, etc)
110 101 108 182 191 15%
Total O&M Expenditure 2036 1665 1576 2231 2945 10%
8.4 Capital Account
The capital account of PCB has been reclassified as capital income and expenditure.
8.4.1 Capital Income
The major capital income of PCB is from development charges which is a one‐time charge collected while a vacant plot is developed/ redeveloped. The other source of capital income for PCB is grants from Defence Ministry. During the review period, PCB has received grants towards IDES Guest House development. During the previous financial year, PCB has also received grants towards internal computerization.
Table 40: Capital Income (Rs in Lakhs)
CAPITAL RECEIPTS 2008‐09 2009‐10 2010‐11 2011‐12 2012‐13
Total 71 44 148 164 84 Own sources 71 44 44 44 48 Sale of proceeds from conservancy 0.3 0.1 0.1 0.3 0.4 Development charges 70 44 44 43 48 Loans Grants 0 0 104 120 36

City Development Plan – Pune Cantonment Board JnNURM
87 Draft Final Report
8.4.2 Capital Expenditure
As can be observed from the table below, the major area of the capital expenditure is towards drainage works. Apart from this there are various miscellaneous works in the Cantonment Area which PCB undertakes. Construction of premises (buildings) for various purposes is one of the only works where PCB has been spending on year on year basis. In the past two years, the PCB has not made any significant expenditure of creation of any assets. The average capital expenditure of PCB during 2008‐11 has been to the tune of Rs 3‐4 crores annually.
Table 41: Capital Expenditure (Rs in Lakhs)
Particular 2008‐09 2009‐10 2010‐11 2011‐12 2012‐13 Buildings 5 9 3 2 4
Roads ‐ ‐ ‐ ‐ ‐Drainage 364 441 295 ‐ ‐
Water Supply ‐ ‐ ‐ ‐ ‐
Stores ‐ ‐ 8 ‐ 7
Misc Public Improvement 168 46 8 ‐ ‐
Total Capital Expenditure 537 496 314 2 11
8.5 Financial Indicator
Table 42: Financial Indicators (Rs in Lakhs)
Financial Indicators Value (FY 2012‐13)
Per capita total revenues receipts Rs 8566
Per capita total revenue expenditure Rs 9360
Own sources of revenue to total revenues 91%Per capita own sources of revenue Rs 7836
Per capita O&M expenditure Rs 4103
Salary as share of revenue receipts 61%
Salary as share of revenue expenditure 56%
Per capita property tax demand Rs 1502Coverage of property tax ~70%
Collection efficiency property tax 82%
8.6 Financial Operating Plan
The investment capacity of PCB is assessed through a Financial Operating Plan (FOP) which gives a multi‐year forecast of finances for a medium term. In line with the phasing of identified investment from 2008‐09 to 2012‐13, the FOP has been generated for the same period for BMC. A salient feature of the FOP is that all outstanding dues, including debt and non‐debt liabilities if any, have been taken into account.

City Development Plan – Pune Cantonment Board JnNURM
88 Draft Final Report
The accounts data of PCB between the years 2008‐09 to 2012‐13 are used as the basis for determining past trends in revenue and expenditure and arriving at appropriate growth assumptions for each of the income and expense items. After forecasting the revenue account, the capital investments proposed under the CIP are added to the forecast. The FOP is generated to assess the investment‐sustaining capacity of PCB. The project funding structure comprises grants under the JNNURM framework (accounting for 70% of the funding); internal resources and loans accounting for the rest. The level of investment that PCB can sustain is determined by studying the overall surpluses/ year‐to‐year opening balance and debt service coverage ratio. If the debt service coverage ratio ‐ DSCR (amount of surplus available to pay interest and to repay principal that is due) falls below 1.25 (i.e. less than 25% cushion), then the investments are reduced gradually till the DSCR exceeds 1.25 in all the years in the forecast period. The main items of income and expenditure, classified into the revenue account and the capital account, are projected in the FOP under the following categories.
o Revenue Account Receipts:
Taxes, Non Tax Sources, and
Grants, Contribution and Subsidies
o Revenue Account Expenditure:
Establishment
Operation and Maintenance
Debt Servicing‐ Existing and New Loans
Phasing of non debt liabilities, and
Additional O&M
o Capital Income and
o Capital Expenditure
Current revenue sources are projected under built‐in growth assumptions for income and expenditure items, to assess the impact of each such revenue enhancement measure being suggested. The projections also aim at estimating the surplus that will be available for servicing new debt. Part of the surplus, after meeting the additional O&M expenses on newly created assets and infrastructure, is translated into debt size and project size (grant component plus debt component) based on certain assumptions regarding interest rate, repayment method and loan‐grant mix. A spreadsheet FOP model has been customised to depict the financial position of BMC, the investment sustaining capacity of BMC is assessed based on the FOP assumptions. The model was used to calculate future surpluses under various scenarios involving combinations of internal revenue improvement, state support, financing terms, etc.

City Development Plan – Pune Cantonment Board JnNURM
89 Draft Final Report
Table 43: Financial Assumptions (Rs in Lakhs)
Head Assumptions Guiding Factor for Assessing the Sustaining Capacity Surplus Positive surplus ‐ year on year basis DSCR Greater than 1.25 Project Financing – for admissible Components under JNNURM Project Costing Unit Cost, with 7% price contingency New/Additional O&M and from second year of investment 7% growth is considered for the additional O&M
Sewerage : 5% of Capital cost Roads : 3% of Capital cost Drains : 2% of Capital cost Urban poor/ Slums : 2% of Capital cost Solid waste management : 2% of Capital cost Others : 2% of Capital cost
Grant from GoI 50% of Proposed Projects Grant from GoM 20% of Proposed Projects If Loan for Balance funding Repayment in 20 years, with 5 year principal moratorium @ 8
% interest rate Old Outstanding loans As per existing terms and conditions Revenue Expenditure Growth in Expenditure Actual average growth with a ceiling of minimum 8% and
maximum of 10% (based on last five years trend) Income Items Growth in revenue income Actual average growth with a ceiling of minimum 8% and
maximum of 15% (based on last five years trend) Local Body Tax Rs 30 crores and increase of 10% per annum Revision of Property Tax As per PCB policy Collection Performance 85% Based on the assumptions, the future cash flow was projected which is presented below Table 44: Projected Cash‐flow Statement
Particuar 2013‐14 2014‐15 2015‐16 2016‐17 2017‐18 2018‐19 2019‐20Opening Balance 800 2583 3896 3448 2954 6441 10463Revenue Receipts 8408 9323 10346 11805 13136 14631 16827Revenue Expenditure 6448 7093 7803 8586 9450 10403 11455Surplus/ Deficit 1960 2230 2543 3219 3686 4228 5372Capital Receipt 101 1818 6648 8318 104 105 105Capital Expenditure 277 2734 9639 12031 302 310 319Surplus/ Deficit ‐176 ‐917 ‐2992 ‐3713 ‐198 ‐206 ‐213Closing Balance 2583 3896 3448 2954 6441 10463 15622

City Development Plan – Pune Cantonment Board JnNURM
90 Draft Final Report
It has been estimated that PCB will be able to sustain the entire investment with the support of 70% grants under JNNUM. Both the revenue and capital account are in surplus between the projection periods. The detail projections are provided below. Table 45: Detail Projections
Projected (Rs in Lakhs) 2013‐14
2014‐15
2015‐16
2016‐17
2017‐18
2018‐19
2019‐20
Opening Balance 800 2583 3896 3448 2954 6441 10463REVENUE RECEIPTS 8408 9323 10346 11805 13136 14631 16827Own Sources 7858 8745 9740 11168 12468 13929 16090Tax 6356 7068 7865 9072 10124 11307 13156Local Body Tax 3000 3270 3564 3885 4235 4616 5031Property Tax 2365 2719 3127 3909 4495 5170 6462Vehicle Entry Tax 456 479 503 528 554 582 611Water Tax 6 6 7 7 7 8 8Sanitary Cess 497 556 623 698 781 875 980Tax on trade and profession 3 3 4 4 4 4 4Others 30 34 38 42 47 53 59Non‐Tax 1502 1678 1875 2096 2343 2621 2934Rent from land (govt properties) 624 699 783 877 982 1100 1232Income from Lease 4 4 5 5 6 6 7Rent from properties other than govt 73 80 88 97 106 117 129Fee from education & medical institute 55 67 80 96 115 138 166Income from market & slaughter house 21 24 28 32 37 43 49Conservancy charges 214 240 268 300 337 377 422License and other fees 246 276 309 346 387 434 486Interest on savings 265 288 314 343 374 407 444Grants 550 577 606 637 668 702 737Ordinary grant 5 5 5 5 6 6 6School Grant 545 572 601 631 663 696 731
REVENUE EXPENDITURE 6448 7093 7803 8586 9450 10403 11455
Establishment (salaries) 4151 4566 5023 5525 6077 6685 7354General Administration 127 140 154 169 186 205 225Revenue 71 78 85 94 103 114 125
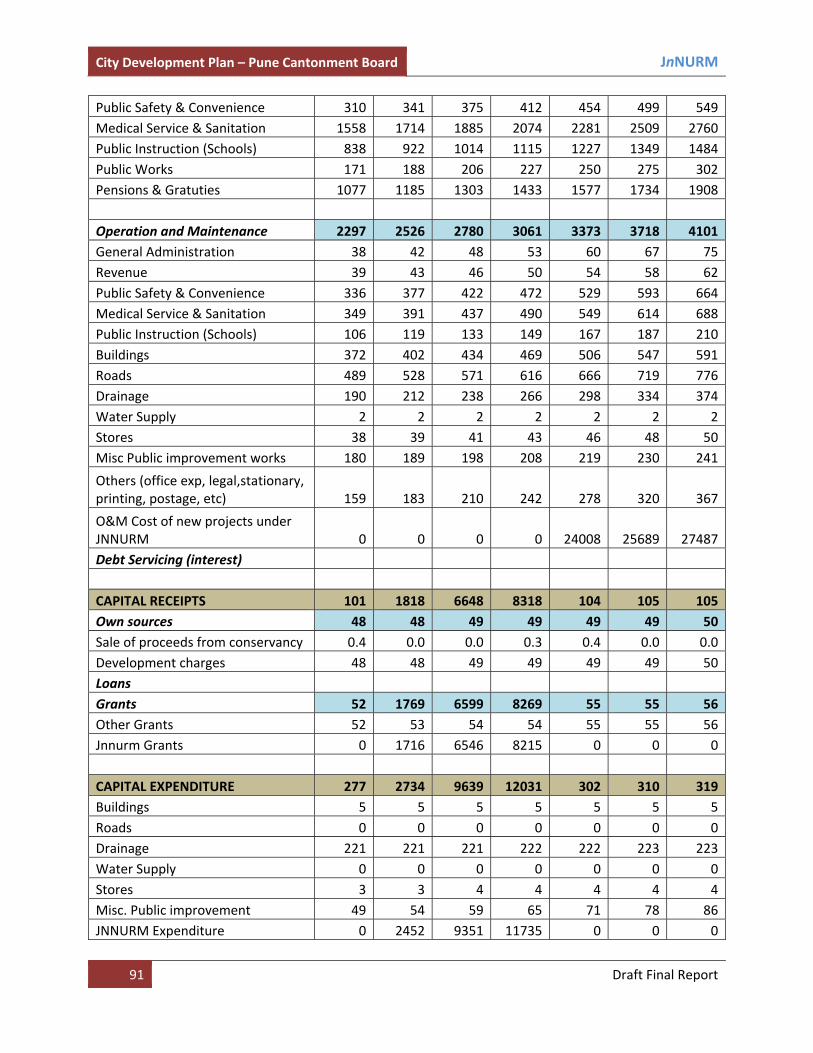
City Development Plan – Pune Cantonment Board JnNURM
91 Draft Final Report
Public Safety & Convenience 310 341 375 412 454 499 549Medical Service & Sanitation 1558 1714 1885 2074 2281 2509 2760Public Instruction (Schools) 838 922 1014 1115 1227 1349 1484Public Works 171 188 206 227 250 275 302Pensions & Gratuties 1077 1185 1303 1433 1577 1734 1908
Operation and Maintenance 2297 2526 2780 3061 3373 3718 4101General Administration 38 42 48 53 60 67 75Revenue 39 43 46 50 54 58 62Public Safety & Convenience 336 377 422 472 529 593 664Medical Service & Sanitation 349 391 437 490 549 614 688Public Instruction (Schools) 106 119 133 149 167 187 210Buildings 372 402 434 469 506 547 591Roads 489 528 571 616 666 719 776Drainage 190 212 238 266 298 334 374Water Supply 2 2 2 2 2 2 2Stores 38 39 41 43 46 48 50Misc Public improvement works 180 189 198 208 219 230 241
Others (office exp, legal,stationary, printing, postage, etc) 159 183 210 242 278 320 367
O&M Cost of new projects under JNNURM 0 0 0 0 24008 25689 27487Debt Servicing (interest)
CAPITAL RECEIPTS 101 1818 6648 8318 104 105 105Own sources 48 48 49 49 49 49 50Sale of proceeds from conservancy 0.4 0.0 0.0 0.3 0.4 0.0 0.0Development charges 48 48 49 49 49 49 50Loans Grants 52 1769 6599 8269 55 55 56Other Grants 52 53 54 54 55 55 56Jnnurm Grants 0 1716 6546 8215 0 0 0
CAPITAL EXPENDITURE 277 2734 9639 12031 302 310 319Buildings 5 5 5 5 5 5 5Roads 0 0 0 0 0 0 0Drainage 221 221 221 222 222 223 223Water Supply 0 0 0 0 0 0 0Stores 3 3 4 4 4 4 4Misc. Public improvement 49 54 59 65 71 78 86JNNURM Expenditure 0 2452 9351 11735 0 0 0
City Development Plan – Pune Cantonment Board JnNURM
92 Draft Final Report
9. REFORM IMPLEMENTATION‐ STATUS and ROAD MAP
This chapter provides details of the objectives, status and action plan for undertaking reforms, which is a key requirement to avail funding under JNNURM. One of the objectives of JnNURM is to ensure improvement in urban governance and service delivery to facilitate ULBs become financially sound and sustainable. The CDP should also be linked to the Reform Agenda. The Reform Agenda would include the strategy to implement reforms in a phased manner. They have to be implemented both at state and ULB levels including parastatals. The optional reforms do not mean that the state governments and ULBs have the discretion to implement or not to implement them. They also need to be implemented during the Mission period, but the local governments have the option to choose any two reforms per year for implementation. In that sense they are also mandatory. Some of the reforms are to be enacted at state level and to be implemented at ULB/parastatal level. The Reforms under JnNURM are aimed at:
• Strengthening urban governments and to decentralize and devolve functions, finances and functionaries to them to enable them to function as self‐governing institutions providing services efficiently and effectively;
• Provide for an integrated governance framework with transparency and clear lines of authority and accountability to achieve the objectives of ‘good urban governance’;
• Facilitate and promote inclusiveness, civic engagement and effective participation of the civil society in city management;
• Contribute towards financial sustainability of cities ‐ strengthen the financial base of the cities and make them bankable;
• Enable the cities to work towards planned and integrated provision and operation and maintenance of infrastructure;
• Develop partnerships with public, private and other sectors for better provision and delivery of services;
• Extend the canvas of information technology and e–Governance to all aspects of city management for efficient, effective and timely service delivery;
• Promote pro‐poor urban governance and work towards slum free cities with universal, adequate and affordable housing and basic services;
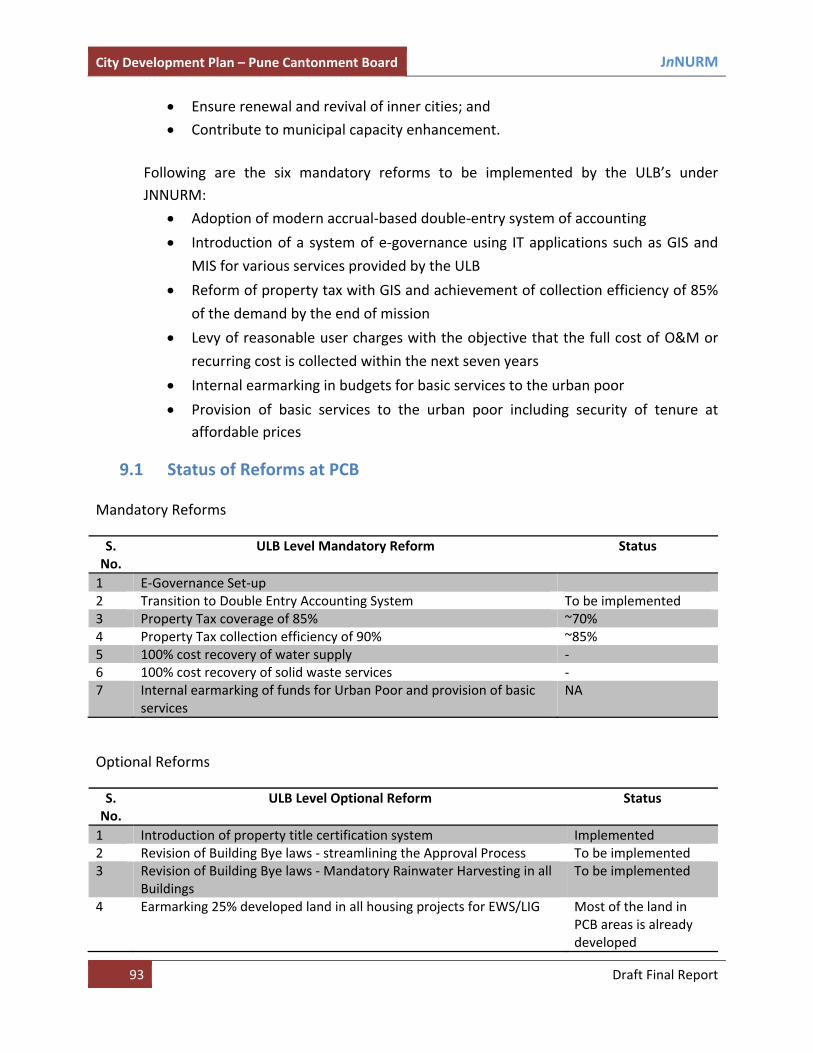
City Development Plan – Pune Cantonment Board JnNURM
93 Draft Final Report
• Ensure renewal and revival of inner cities; and
• Contribute to municipal capacity enhancement.
Following are the six mandatory reforms to be implemented by the ULB’s under JNNURM:
• Adoption of modern accrual‐based double‐entry system of accounting
• Introduction of a system of e‐governance using IT applications such as GIS and
MIS for various services provided by the ULB
• Reform of property tax with GIS and achievement of collection efficiency of 85%
of the demand by the end of mission
• Levy of reasonable user charges with the objective that the full cost of O&M or
recurring cost is collected within the next seven years
• Internal earmarking in budgets for basic services to the urban poor
• Provision of basic services to the urban poor including security of tenure at affordable prices
9.1 Status of Reforms at PCB
Mandatory Reforms
S. No.
ULB Level Mandatory Reform Status
1 E‐Governance Set‐up 2 Transition to Double Entry Accounting System To be implemented 3 Property Tax coverage of 85% ~70% 4 Property Tax collection efficiency of 90% ~85% 5 100% cost recovery of water supply ‐ 6 100% cost recovery of solid waste services ‐ 7 Internal earmarking of funds for Urban Poor and provision of basic
services NA
Optional Reforms
S. No.
ULB Level Optional Reform Status
1 Introduction of property title certification system Implemented 2 Revision of Building Bye laws ‐ streamlining the Approval Process To be implemented 3 Revision of Building Bye laws ‐ Mandatory Rainwater Harvesting in all
Buildings To be implemented
4 Earmarking 25% developed land in all housing projects for EWS/LIG Most of the land in PCB areas is already developed

City Development Plan – Pune Cantonment Board JnNURM
94 Draft Final Report
5 Simplification of Legal and Procedural framework for conversion of agricultural land for non‐agricultural purpose
Most of the land in PCB areas is already developed
6 Introduction of computerized process of Registration of land and property
Implemented
7 Byelaws on Reuse of Recycled Water To be implemented 8 Administrative Reforms To be implemented 9 Structural Reforms Implemented 10 Encouraging Public Private Partnership To be implemented
9.2 Migration to Double Entry Accounting System
The key objective of this reform is to bring discipline and undertake correct method of accounting. This system allows the decision makers to capture both the liabilities and receivables which are not maintained in single entry system. It is a more prudent system for financial planning. At any given point of time, this system provides the correct picture of the finances. PCB is currently maintaining the finances on single entry cash based accounting system. The database is also maintained in excel format in computers. PCB is in the process of adopting an already created module for migrating to double entry accrual based accounting system. Migration to the double entry system would require PCB for a step by step action.
• As mentioned above PCB would adopt the system already created elsewhere implies that the accounting codes would already be created. It would however, require preparing a manual which would contain principles for accounting, which can be referred on a day to day basis.
• PCB would further require training all the departments especially accounting department with respect to the accounting principles.
• All the assets would require listing, approving by head of departments and valuation of assets. In line with this PCB should also formulate a standard asset management register.
• PCBwould require appointing a chartered accountancy firm which shall provide support on a day to day basis to the staff for undertaking old data entry,

City Development Plan – Pune Cantonment Board JnNURM
95 Draft Final Report
reconciliation of accounts with its banks, ensuring all new entries are in the new system.
• Both the system would operate in parallel for sometime and before completely migrating to the new system as undertaking old data entry and valuation of assets would take substantial time.
• Balance sheets once prepared would require to be audited internally and externally.
9.3 E‐governance
As discussed earlier, e‐governance reforms are aimed at improving the efficiency of operations and bring‐in more transparency in the sytem. At present following moduels are in place –
• Computerisation of land records,
• Paybills,
• Hospital Stock entries,
• Birth and Death records and
• Establishment module PCB intends to undertake following additonal modules
• Dak application in progress
• Revenue section pertaining to tax bills, GRT Charges,
• Trade licenses
• Central Stores
• Building Application in progress
• Property tax
• Liscenses
• E‐tendering
• SWM Vehicle tracking system
• Website upgradation
To ensure the successful implementation and long term sustenance of the e‐governance modules, it may ponder on the following aspects
• Deploy experts to implement the module
• Trainings and handholding support should be mandate of the deployed consultant
• Preparation of training manuals

City Development Plan – Pune Cantonment Board JnNURM
96 Draft Final Report
• Regular trainings of employees
• Policy for upgrdation of modules from time to time
• Deployment of team of professionals to address technical issues on a day to day basis
• Integration of various modules
• Ensure data back and recovery system

City Development Plan – Pune Cantonment Board JnNURM
97 Draft Final Report
10. Stakeholder Consultation
The key element and essence of preparation of CDP is stakeholder’s participation and views on how they would like to see their city developing as. In that context, a stakeholder consultation was organized on by PCB, __/11/2013 with all the elected members of the Cantonment Board. Before the consultation, the draft report containing the entire assessment of demography, infrastructure, financial situation, reforms, issues etc., was provided to the stakeholders. The following were the key points of discussion –
• The CEO PCB welcomed all the members and provided the following details –
o He mentioned the need for preparation of the CDP, the support provided by JNNURM to cities for developing infrastructure and improving efficiency of utilities in service delivery.
o He mentioned that CDP is a comprehensive and strategic planning exercise. To enable development of Infrastructure in cities, the GoI in 2005 launched the JNNURM mission and preparation of CDP was the key aspect.
o He mentioned that PCB was not much aware of such exercise; however, the revised guidelines of JNNURM laid special emphasis for preparation of CDP of Cantonment Areas too. As a result, further to the directives of the Defence Ministry and discussions with Pune Municipal Corporation, it was decided that PCB would prepare a comprehensive CDP for its jurisdiction and would look forward for integration with the CDP of Pune Corporation.
o He further mentioned that the appointed consultant has carried out the entire assessment as per the revised guidelines and in today’s meeting the key findings would be shared and the outlook in terms of what are the priorities and strategic measures, the view on the same would be obtained from the stakeholders.
• The entire assessment and issues and challenges were further discussed with the stakeholders and following were the key suggestions of the stakeholders
o It was suggested that sewerage, sanitation and waste management should be given priority. There is an urgent need of treatment of waste water as this is leading to pollution of natural drains which have turned nallahs. The Cantonment area caters to a large amount of floating population due to job and being an important area, hence, the polluted area creates unhygienic conditions for people.
o The public toilets facilities should be provided ample importance and better hygiene facility

City Development Plan – Pune Cantonment Board JnNURM
98 Draft Final Report
o Scientific treatment of waste should be done instead of dumping which is creating environmental pollution. The PCB has moved ahead in door to door collection and this should be further supported with improved fleet
o Pedestrian movement with respect to crossing of roads should be looked into. Traffic issue at Golibar Maidan should be taken care; a flyover would be useful to deal with this problem.
o The slaughter house needs to be redeveloped, as the existing condition is not hygienic
o The hospital also requires up‐gradation to meet the present days requirement
o Renovation of PCB schools also requires adequate attention. o Parking facilities need to be put in place and the existing land of PCB should
be used for the same for multilevel car parking facility. o It was discussed that cattle shed should be relocated with adequate space
and allied activities
Overall there was lot of enthusiasm in the meeting with respect to JNNURM and the planning initiative. The meeting further ended with a vote of thanks to all members.
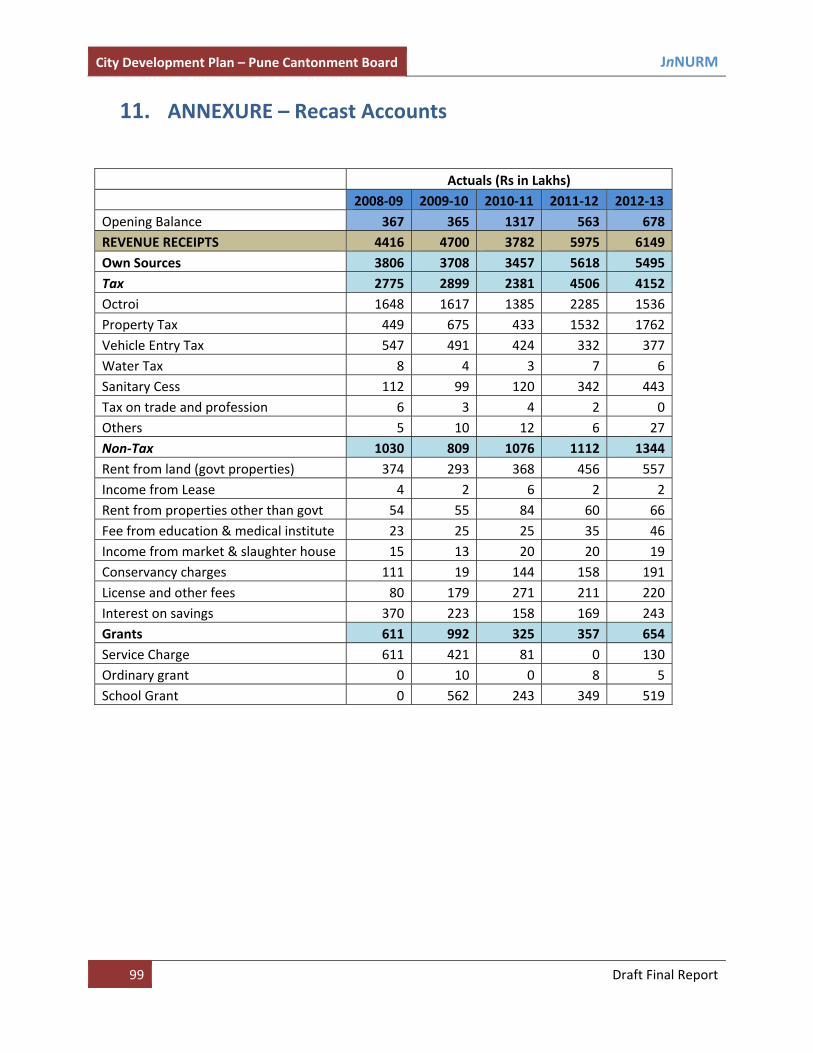
City Development Plan – Pune Cantonment Board JnNURM
99 Draft Final Report
11. ANNEXURE – Recast Accounts
Actuals (Rs in Lakhs) 2008‐09 2009‐10 2010‐11 2011‐12 2012‐13
Opening Balance 367 365 1317 563 678REVENUE RECEIPTS 4416 4700 3782 5975 6149Own Sources 3806 3708 3457 5618 5495Tax 2775 2899 2381 4506 4152Octroi 1648 1617 1385 2285 1536Property Tax 449 675 433 1532 1762Vehicle Entry Tax 547 491 424 332 377Water Tax 8 4 3 7 6Sanitary Cess 112 99 120 342 443Tax on trade and profession 6 3 4 2 0Others 5 10 12 6 27Non‐Tax 1030 809 1076 1112 1344Rent from land (govt properties) 374 293 368 456 557Income from Lease 4 2 6 2 2Rent from properties other than govt 54 55 84 60 66Fee from education & medical institute 23 25 25 35 46Income from market & slaughter house 15 13 20 20 19Conservancy charges 111 19 144 158 191License and other fees 80 179 271 211 220Interest on savings 370 223 158 169 243Grants 611 992 325 357 654Service Charge 611 421 81 0 130Ordinary grant 0 10 0 8 5School Grant 0 562 243 349 519

City Development Plan – Pune Cantonment Board JnNURM
100 Draft Final Report
Actuals (Rs in Lakhs) 2008‐09 2009‐10 2010‐11 2011‐12 2012‐13
REVENUE EXPENDITURE 4091 4252 5119 5745 6718
Establishment (salaries) 2056 2587 3543 3514 3774General Administration 82 114 124 128 116Revenue 33 41 54 57 64Public Safety & Convenience 185 202 261 271 282Medical Service & Sanitation 813 1001 1325 1343 1417Public Instruction (Schools) 437 540 721 722 762Public Works 96 106 139 126 155Pensions & Gratuities 409 582 919 868 979
Operation and Maintenance 2036 1665 1576 2231 2945General Administration 21 19 34 35 60Revenue 31 67 40 30 15Public Safety & Convenience 209 273 267 312 441Medical Service & Sanitation 297 185 313 312 450Public Instruction (Schools) 29 44 74 117 210Buildings 439 220 148 360 557Roads 428 518 359 466 494Drainage 148 104 92 216 286Water Supply 2 1 5 0 2Stores 55 29 21 32 41Misc Public improvement works 269 105 116 170 197
Others (office exp, legal,stationary, printing, postage, etc) 110 101 108 182 191Debt Servicing (interest)
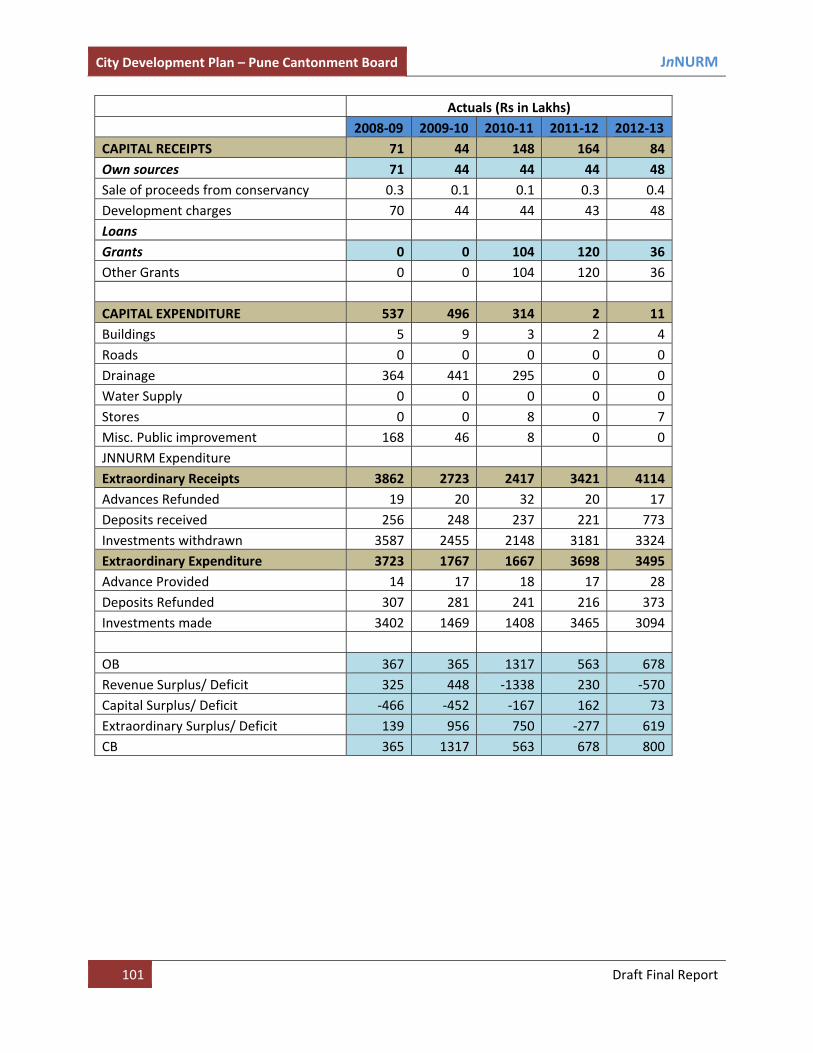
City Development Plan – Pune Cantonment Board JnNURM
101 Draft Final Report
Actuals (Rs in Lakhs) 2008‐09 2009‐10 2010‐11 2011‐12 2012‐13
CAPITAL RECEIPTS 71 44 148 164 84Own sources 71 44 44 44 48Sale of proceeds from conservancy 0.3 0.1 0.1 0.3 0.4Development charges 70 44 44 43 48Loans Grants 0 0 104 120 36Other Grants 0 0 104 120 36
CAPITAL EXPENDITURE 537 496 314 2 11Buildings 5 9 3 2 4Roads 0 0 0 0 0Drainage 364 441 295 0 0Water Supply 0 0 0 0 0Stores 0 0 8 0 7Misc. Public improvement 168 46 8 0 0JNNURM Expenditure Extraordinary Receipts 3862 2723 2417 3421 4114Advances Refunded 19 20 32 20 17Deposits received 256 248 237 221 773Investments withdrawn 3587 2455 2148 3181 3324Extraordinary Expenditure 3723 1767 1667 3698 3495Advance Provided 14 17 18 17 28Deposits Refunded 307 281 241 216 373Investments made 3402 1469 1408 3465 3094
OB 367 365 1317 563 678Revenue Surplus/ Deficit 325 448 ‐1338 230 ‐570Capital Surplus/ Deficit ‐466 ‐452 ‐167 162 73Extraordinary Surplus/ Deficit 139 956 750 ‐277 619CB 365 1317 563 678 800
City Development Plan – Pune Cantonment Board JnNURM
102 Draft Final Report
MAPS

City Development Plan – Pune Cantonment Board JnNURM
103 Draft Final Report
WARD – I WARD – II WARD – III WARD – IV

City Development Plan – Pune Cantonment Board JnNURM
104 Draft Final Report
WARD – V WARD – VI WARD – VII WARD – VIII
Recommended