Japan AirlinesAnnual Report 2004
Year ended March 31, 2004
Aiming to Be the World’s No. 1 Airline Group����������������������������������������������������������������������������������������������������������������������������������������������������������������������������������������������������������������������������������������������������������������������������� �����������������������������������������������������������������������������������������������������������������������������������������������������������������������������������������������������������������������������������������������������������������������������������������������������������������������������������������������������������������������������
����������������������������������������������������������� ��������������������������������������������������������������������������������������������������������������������������������������������������������������������������������������������������������������������������
����������������������������������������������������������������������������������������������������������������������������������������������������������������������������������������������������������������������������������������������������
������������������������������������������������������������������������������������������������������������������������������������������������������������������������������������������������������������������������������������������������������������������������
��������
�������������������������������������� ���������������������������������������� ���������������������������������� ������������������������������������������������ ���������������������������������� ���������������������������������������������� �������������������������������������������������������������������������������� ����������������������������� ���������������������������������������������������� ��������������������������������������������� �������������������������������������������������������������������������� ���������������������������������������������������������������� �������������������������������������������������� ������������������������ ������������������������������������������������������������������ ����������������������������������������������������������������������������������� ��
��������������������������������������������������������������������������� ������������������������������������������������� ���������������������� ��������������������������������������� ������������������������������������ �������������������������������������������� ������������������������������ �������������������������������� ������������������������������������������������ ��������������������������� ���������������������������������������������������������� ����������������������������������������� ���������������������������������������� ����������� ������������������������������������������������������������������������������������ ����������������������������������������������������������������������������������� �������������������� ���������������������������������������������������������������������� ������������������������������������������������������������������������������������������ ��
���������������������������������������������������������������������������������������������������������������������������������
��������������������������������������

International Passenger
Domestic Passenger
Cargo
Airline-related business
Travel service
Hotel and resort business
Credit card and leasing business
Commercial, distribution and other business
The JAL Group’s operations include: air passenger services and baggage handling; air cargo services; maintenance of aircraft and parts, and painting of aircraft exte-riors; seat reservation and information on passenger services; supplying electricity, cool/warm air and compressed air to stationary aircraft; in-flight catering service; sale of fuel for aircraft; and management of aviation fuel supply facilities. Air transportation business is conducted by 10 subsidiaries, all of which are con-solidated, and 1 affiliate. In this field the Group has created a large-scale network that includes not only JAL International and JAL Domestic, but also Japan Asia Airways Co., Ltd., Japan Trans Ocean Air Co., Ltd., JALways Co., Ltd., JAL Express Co., Ltd., Japan Air Commuter Co., Ltd., J Air Co., Ltd., Harlequin Air Co., Ltd., and Hokkaido Air System Co., Ltd.
Airline-related business includes passenger services and cargo handling, in-flight catering businesses, the maintenance of aircraft and ground equipment, and the supply of aviation fuel. These activities are conducted by a total of 97 subsidiaries, including 58 consolidated companies and 68 affiliated companies.
In the field of travel services, 62 subsidiaries and 7 affiliates (including 43 consoli-dated companies) engage in the sale of airplane tickets for JAL Group airline com-panies, as well as the planning and production of travel goods, utilizing those airline companies.
Management of hotels, outsourced provision of hotel operations, and management of golf courses are conducted by 25 subsidiaries and 6 affiliated companies: of these, 18 are consolidated subsidiaries.
In the credit card and leasing businesses, 59 subsidiaries conduct: management and operation of credit cards and PassAge cards, which are issued by JAL; pooling of funds within the JAL Group; agency payment services; paperwork for intercorporate account settlements within the JAL Group; financing for Group companies; leasing and installment sale of aircraft and parts, industrial machinery, transportation equip-ment, information equipment, and office equipment for the JAL Group; and nonlife insurance services for Group companies. Of these, 2 companies are consolidated.
In this segment, 42 subsidiaries and 16 affiliates, of which 14 are consolidated, en-gage in activities that include: sale of aircraft and parts, and aviation fuel; operation of airport shops; mail-order sales; in-flight sales and sale of cabin goods; printing service; and temporary personnel service.
Overview of the JAL GroupThe JAL Group is composed of 295 subsidiaries and 98 affiliates, and engages in air transportation business, airline-related business, travel services, and other business activities. Japan Airlines System Corporation, the holding company, formulates Group-wide targets and strategies, and ensures the optimum allocation of management resources so as to maximize corporate value.
1
Thousands of Millions of yen U.S. dollars
2002 Years ended March 31, 2004 2003 (Pro forma) 2004For the Year:
Operating Revenues ¥ 1,931,742 ¥2,083,480 ¥2,029,481 $18,397,543
Operating Expenses 1,999,387 2,072,891 2,030,522 19,041,780
Operating (loss) Income (67,645) 10,589 (1,041) (644,238)
Net (loss) Income (88,619) 11,645 (35,797) (843,990)
Net (loss) Income Per Share (yen and dollars) ¥ (45.19) ¥ 5.92 — $ (0.430)
At Year-End:
Long-Term Debt ¥ 1,170,156 ¥1,094,285 ¥1,132,238 $11,144,342
Stockholders’ Equity 159,273 254,256 254,803 1,516,885
Total Assets 2,113,418 2,172,284 2,294,836 20,127,790
Shares Issued (thousands) 1,980,465 1,980,465 —
Note: The U.S. dollar amounts in this annual report are translated from yen amounts, solely for convenience, at ¥105=U.S.$1.00, the exchange rate prevailing on March 31, 2004 (see Note 2 to the Consolidated Financial Statements).
Years ended March 31, 2004 2003 Change (%)Revenue passengers carried (number of passengers): Domestic 46,496,195 46,520,059 -0.1
International 11,745,032 14,640,627 -19.8
Total 58,241,227 61,160,686 -4.8
Revenue passenger-km (1,000 passenger-km): Domestic 34,687,452 34,820,104 -0.4
International 59,159,861 69,959,085 -15.4
Total 93,847,313 104,779,189 -10.4
Revenue passenger-load factor (%; percentage point change): Domestic 64.0 65.3 -1.3
International 64.6 69.0 -4.4
Total 64.3 67.8 -3.5
Revenue ton-km performed (1,000 ton-km): Domestic 3,054,722 3,069,027 -0.5
International 10,032,252 11,052,885 -9.2
Total 13,086,974 14,121,912 -7.3
Revenue weight-load factor (%; percentage point change): Domestic 47.8 48.8 -1.0
International 64.8 66.3 -1.5
Total 59.8 61.5 -1.7
Notes: 1. Ratios and percentages have been rounded to the nearest tenth of a percent.2. Other figures less than one thousand, except for passengers carried, have been discarded.
Note: Figures shown in this report for 2002 are simple addition of the figures for the Japan Airlines Group and the Japan Air System Group.
Consolidated Operating Highlights Japan Airlines Corporation and Consolidated SubsidiariesFor the Years Ended March 31, 2004 and 2003
2 Japan Airlines Corporation
Consolidated Financial Highlights Japan Airlines Corporation and Consolidated SubsidiariesFor the Years Ended March 31, 2004, 2003 and 2002
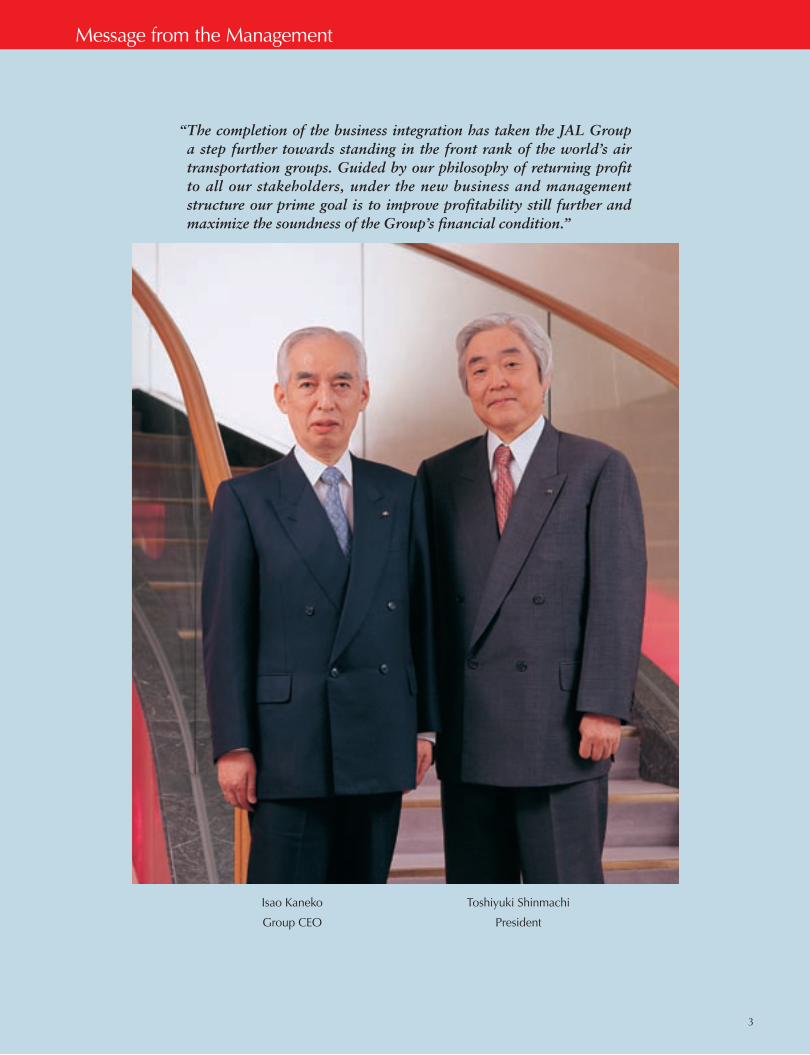
“ The completion of the business integration has taken the JAL Group a step further towards standing in the front rank of the world’s air transportation groups. Guided by our philosophy of returning profit to all our stakeholders, under the new business and management structure our prime goal is to improve profitability still further and maximize the soundness of the Group’s financial condition.”
Isao Kaneko
Group CEO
Toshiyuki Shinmachi
President
2 Japan Airlines Corporation 3
Message from the Management
Business performance
A very harsh operating environment prevailed during the
fiscal 2003, impacted by factors such as a succession of
serious international events, including the Iraq war and
the outbreaks of new infectious diseases in the form of
SARS and then of avian influenza, and by a steep in-
crease in the price of aviation fuel.
In domestic passenger operations, we implemented
vigorous sales promotion measures and strengthened
competitiveness by steady implementation of the in-
tegration plan, including network reorganization. As
a result, yield improved and there was a substantial
increase in revenues. In international passenger opera-
tions, however, the impact on passenger psychology of
the external factors referred to above was more serious
than anticipated, and we were unable to avoid a decline
in revenue caused by the resultant slump in demand.
We accelerated the integration plan vigorously,
implementing a total of ¥45.5 billion of Group-wide
emergency countermeasures to improve the financial
position. These resulted in consolidated operating reve-
nues of ¥1,931.7 billion (US$18,397 million), an operat-
ing loss of ¥67.6 billion (US$644 million), and a net loss
of ¥88.6 billion (US$843 million).
Complete integration
On April 1, 2004, the JAL Group achieved complete in-
tegration — under the unified “JAL-Japan Airlines” brand
— through the reorganization of Japan Airlines Co., Ltd.
and Japan Air System Co., Ltd. into Japan Airlines Inter-
national Co., Ltd., which handles international passenger
and cargo operations, and Japan Airlines Domestic Co.,
Ltd., which handles domestic passenger operations.
This reborn JAL Group possesses the largest interna-
tional network originating in Japan and also the largest
domestic network, offering customers greater-then-ever
convenience. In addition, since April 2004, all products
have been unified under the JAL brand in line with the
keywords “easy-to-use, easy-to-understand.” All JAL
and JAS flight numbers have been unified with the JAL
prefix plus four digits, and ticket issuance and airport
systems have been integrated, so that all dialing in for
reservations has been unified into the existing JAL toll-
free system.
As a result of the integration, the ratio of the domestic
and international networks has been improved from 2:5
to 1:1 in terms of revenues. This has rectified the depen-
dence on international routes that was a major pre-inte-
gration issue facing the management of the former Japan
Airlines. What is more, we have achieved a more even
geographical balance of revenues from international
routes, 35% coming from Transpacific, 20% from routes
to Europe, and 30% from China and other Southeast
Asia routes. Provided situations of similar magnitude to
the Iraq conflict and SARS do not arise, we believe we
are firmly on course to move back into profitability in
fiscal 2004. An added factor is that the strengthening of
our operations on domestic routes has increased the ra-
tio of passengers traveling as individuals. The rise in the
number of individual passengers raises strong expecta-
tions of an improvement in earnings.
The outlook, and issues to address
The airline industry is likely to see a widening of new
business opportunities, driven by factors such as growth
in airline demand in China and other parts of Southeast
Asia and the opening of the Central Japan International
4 Japan Airlines Corporation 5

Airport. Nevertheless, this is likely to be accompanied
by increasingly fierce competition. At the same time
it will be essential, given the ongoing instability in
the international situation, to continue to ensure that
flight safety and all other aspects of safety are pursued
painstakingly.
Amid these circumstances, the JAL Group will con-
tinue to be guided by its philosophy of returning profit
to all its stakeholders under its new business and man-
agement structure, the prime goal being to improve
profitability still further and to maximize the soundness
of the Group’s financial condition. Its key management
indicators are return on equity (ROE) and the payback
period of interest-bearing debt as a multiple of operat-
ing cash flows, the targets being to raise ROE to at least
10%, and the payback period of interest-bearing debt
divided by operating cash flows to within 10 years.
The JAL Group FY2003-05 Medium-Term Business
Plan was formulated with the aim of improving profit-
ability and enhancing the soundness of the Group’s
financial condition. To add depth to the plan, the JAL
Group FY2004-06 Medium-Term Business Plan was
formulated in March 2004. This new plan lays down
targets in individual categories aimed at ensuring an
overall integrated impact, including for the fundamental
aspects of safety and corporate social responsibility; for
Group management strategy in the categories of ensur-
ing deep-rooted customer orientation, the optimization
of business processes, and human-resource measures;
and for function-specific business planning. The overall
aim is to maximize customer value and establish an ef-
ficient operating structure.
For the JAL Group to achieve sustained growth, it is of
the utmost importance for it to fulfill its responsibilities
as a corporate citizen and to gain the unshakable trust
of society. To fulfill the Group’s corporate social respon-
sibility (CSR), the Corporate Social Responsibility Com-
mittee has been newly established, and Group-wide
efforts will be made in this sphere.
The Group will work in unison to take maximum
advantage of the benefits of the integration and to
strengthen the two fundamental components of qual-
ity: safety and service. In this way it will aim to be “the
world’s No.1 airline group in terms of both service qual-
ity and business volume.” For these endeavors we hope
to receive the continuing understanding and support of
all stakeholders.
Isao Kaneko
Group CEO
Toshiyuki Shinmachi
President
4 Japan Airlines Corporation 5
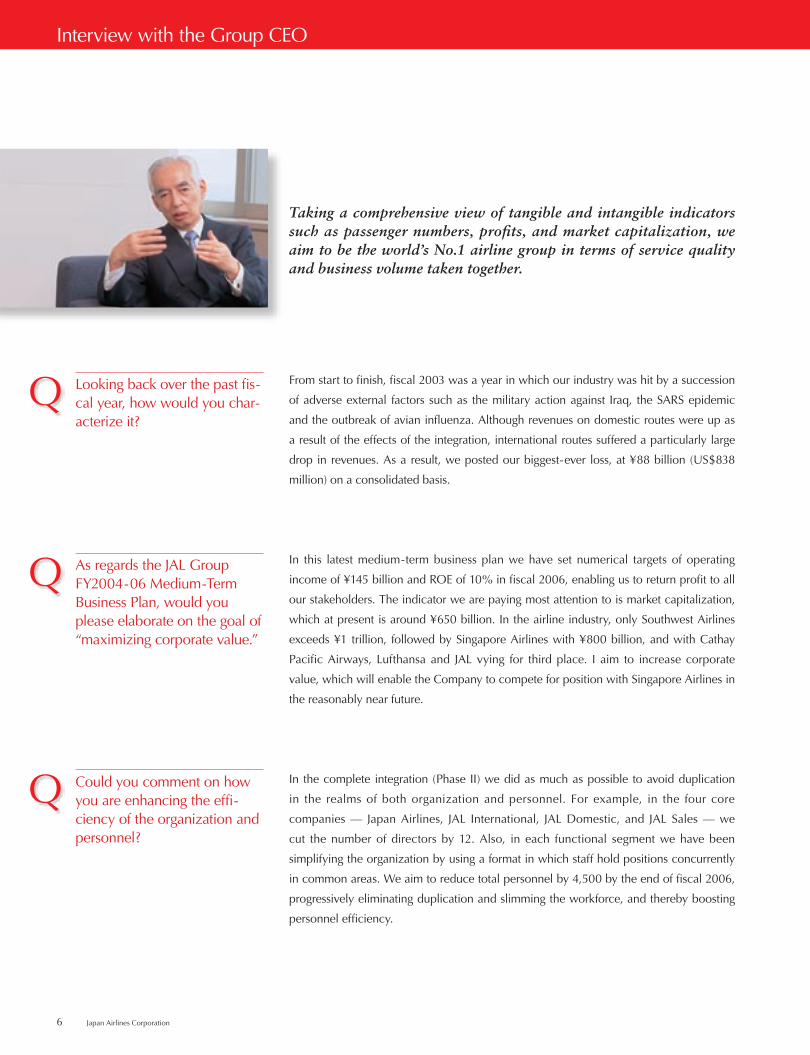
Taking a comprehensive view of tangible and intangible indicators such as passenger numbers, profits, and market capitalization, we aim to be the world’s No.1 airline group in terms of service quality and business volume taken together.
From start to finish, fiscal 2003 was a year in which our industry was hit by a succession
of adverse external factors such as the military action against Iraq, the SARS epidemic
and the outbreak of avian influenza. Although revenues on domestic routes were up as
a result of the effects of the integration, international routes suffered a particularly large
drop in revenues. As a result, we posted our biggest-ever loss, at ¥88 billion (US$838
million) on a consolidated basis.
In this latest medium-term business plan we have set numerical targets of operating
income of ¥145 billion and ROE of 10% in fiscal 2006, enabling us to return profit to all
our stakeholders. The indicator we are paying most attention to is market capitalization,
which at present is around ¥650 billion. In the airline industry, only Southwest Airlines
exceeds ¥1 trillion, followed by Singapore Airlines with ¥800 billion, and with Cathay
Pacific Airways, Lufthansa and JAL vying for third place. I aim to increase corporate
value, which will enable the Company to compete for position with Singapore Airlines in
the reasonably near future.
In the complete integration (Phase II) we did as much as possible to avoid duplication
in the realms of both organization and personnel. For example, in the four core
companies — Japan Airlines, JAL International, JAL Domestic, and JAL Sales — we
cut the number of directors by 12. Also, in each functional segment we have been
simplifying the organization by using a format in which staff hold positions concurrently
in common areas. We aim to reduce total personnel by 4,500 by the end of fiscal 2006,
progressively eliminating duplication and slimming the workforce, and thereby boosting
personnel efficiency.
Looking back over the past fis-cal year, how would you char-acterize it?
As regards the JAL Group FY2004-06 Medium-Term Business Plan, would you please elaborate on the goal of “maximizing corporate value.”
Could you comment on how you are enhancing the effi-ciency of the organization and personnel?
6 Japan Airlines Corporation 7
Interview with the Group CEO
First, we are reforming our pension scheme. The new retirement benefit scheme includes
the existing scheme but also incorporates components such as a defined contribution
pension and a pension prepayment scheme, enabling each individual employee to
choose a method of participation to suit their own lifestyle. We project that, compared
with the scheme as it stood in fiscal 2003, this system will enable us to reduce retirement
benefit costs by ¥32 billion in fiscal 2004, ¥14 billion in fiscal 2005, and ¥11 billion in
fiscal 2006: a total of ¥57 billion. That will also enable us to reduce retirement benefit
obligations.
A priority issue is to expedite the beneficial effects of the integration, so as build a solid financial condition. We will also persist with our cost-cutting and enhancement of competitiveness.
In fiscal 2003, the impact of the integration was already measured at ¥18.0 billion in
earnings, and we are predicting further improvements in earnings as a result of cost-
cutting in such areas as personnel and facilities and aircraft and other equipment, as
well as through enhanced competitiveness. Even after deducting declines in revenues
resulting from the integration and adding the costs of installation of IT systems, we hope
to see a ¥68 billion improvement on an operating income/loss account basis in fiscal
2005. From fiscal 2006, the effect of the integration is projected at ¥74.5 billion as the
additional expenses are not expected to exceed ¥6 billion.
Internet reservations in fiscal 2003 accounted for 36% of personal bookings on domestic
routes and for 8% of personal bookings on international routes originating in Japan.
Promoting the use of e-commerce makes things more convenient for passengers
traveling as individuals, and at the same time it cuts our costs, so we want to increase
these ratios still further.
What measures are you employing to cut personnel costs, a key component of the improvement of efficiency?
Efficiency is improving as a result of the integration, but what degree of improvement in the Group’s earnings struc-ture are you projecting?
You are fostering the use of e-business methods, in part to bolster competitiveness. What is the status of progress in that area, including the use of Internet reservations?
6 Japan Airlines Corporation 7
Excluding aircraft on regional routes, we operate 11 types of aircraft in the three
categories of wide-bodied jets and medium and small aircraft. That number will be
reduced to eight types by the end of fiscal 2006. At the same time, we will also reduce
the asset value of our fleet.
Guided by a Group management strategy that emphasizes deep-rooted customer orientation, the optimization of business processes, and human-resource measures, our goal is to maximize corporate value.
Low-cost carriers are eating away at network carriers in Europe and North America. This
is due to the availability of inexpensive suburban airports and the existence of a labor
market for pilots. In Japan, by contrast, all slots are taken at Haneda, the only airport in
the Tokyo area used by domestic flights. What is more, there is virtually no labor market
for pilots in Japan. Low-cost carriers have emerged in Southeast Asia, but are confined
to regional operations in countries such as Thailand, Malaysia, and Singapore. I think it
will be some time yet before the dawning of an era in which European, U.S., and other
low-cost carriers are competing in the Japanese market. I would add that within the
JAL Group we already have two models for low-cost carriers: JALways on international
routes and JAL Express on domestic routes. The cost per flight of those two carriers is
around 10% lower than our network carrier flights, and by making skillful use of low-
cost operations, we expect to make still further reductions in costs.
Safety is the very foundation of everything we do, and is also a social responsibility.
Staff throughout the Group, not only the personnel directly involved in flight operations
and maintenance, but also those indirectly linked, must look at every single flight with
the same attitude. For example, the JAL Group Safety Charter is printed on cards and
distributed to each and every employee so as to firmly imprint safety-consciousness
into them. In ways such as this, we strengthen the Group-wide safety management
structure and ensure a uniform safety level. As for safety measures, I consider it to be
of the utmost importance to maintain a posture of disclosing and sharing information
constantly on our website.
What of your fleet plan?
For the airline industry, the most important thing is safety management. What are your policies on safety?
The rapid progress being made by low-cost carriers is attract-ing considerable attention overseas. As a network carrier, how are you countering this?
8 Japan Airlines Corporation 9

In our current medium-term business plan, safety and CSR are pivotal. If you break
down CSR you can see that the biggest issue is the approach to the environment. The
airline industry imposes a considerable burden on the environment, consuming fossil
fuels and producing carbon dioxide and noise. It is incumbent on us to consider how
to reduce that burden efficiently. Another important component is investor-relations
activity. It is crucial for us to engage in sound and transparent corporate activity, and to
disclose it to all our stakeholders. The same applies to activities for the sake of society.
If you look at things such as CSR ratings, you will immediately find an array of social
responsibilities that are not confined to the environmental sphere but also include issues
such as fair employment practices. In April 2004 the JAL Group established the CSR
Committee, which I chair. The committee does not limit its attention to the existing
framework of CSR issues. Rather, we engage in a broad debate about what we should
do, and to what extent we should do it.
For a company to compete, it must ensure it is complete on both the hardware and
software sides, that is, its equipment and facilities and its services. On the hardware
side we can compete to the extent that we spend money on hardware, but in the
final analysis, the deciding factor lies on the other side, namely personnel. Personnel
constitute a particularly important resource for us in the airline industry. During
periods of cost-cutting through structural reforms, personnel development tends to be
inadequate, but we have learnt from that, and in October 2003 I inaugurated a career-
development program for middle-ranking employees in their thirties and forties. I attend
all the sessions and take questions, as I think that for human-resource development it is
important for senior management to engage in direct dialogue with employees in this
way.
Please share your thoughts on how you address the issue of corporate social responsibility (CSR).
What is your approach to personnel training and development?
8 Japan Airlines Corporation 9

Airlines worldwide are plunging into international mergers and amalgamations beyond the confines of alliances. Therefore, it is important to build the ability to deal with international reorganization.
The airline industry has been damaged by a variety of factors, but it is basically an
industry that will continue to grow. As regards international passenger and cargo
movements, growth of around 5% is expected in overseas markets. Moreover, larger
growth is likely in the Southeast Asian region. But we cannot expect to see strong growth
within Japan, where I think we may see a gradual increase in demand of 1% to 2% per
annum. I believe we will definitely triumph in this market if we improve the fabric of the
Group by strengthening cost competitiveness and pursuing structural reform. In addition,
the integration has opened up the way towards our being the world’s leading airline,
and that is the position we will be aiming for. The airline industry is heavily regulated
internationally, but I expect to see it being opened up more and liberalized. It may take
10 or even 20 years, but when the industry is fully deregulated internationally we must
ensure we have the corporate makeup and essence to triumph over any competitor.
Finally, what is your personal outlook for the Japanese and global airline industry?
10 Japan Airlines Corporation

Aiming for a V-shaped recovery now that full integration has been accomplishedFormulation of the FY2004-06 Medium-Term Business Plan for maxi-mizing corporate value
In March 2004 the JAL Group took an additional step to add depth to its FY2003-05
Medium-Term Business Plan, which was formulated in March 2003 with the aim of improv-
ing profitability and enhancing the soundness of the Group’s financial condition. This was
the formulation of a new plan: the JAL Group FY2004-06 Medium-Term Business Plan.
Today the JAL Group is taking maximum advantage of the effects of the recently completed
business integration, proceeding step-by-step along the path towards being the world’s No.1
airline group in terms of service quality and business volume taken together.
In the 2003 fiscal year, external factors such as the Iraq conflict and SARS had a significantly adverse impact on demand and revenues, com-pelling the Company to post a net loss. The harsh environment for the airline industry is likely to persist from fiscal 2004 onwards, but as we move into an age of international exchange and interaction, there can be no doubt that the airline industry will continue to grow.
Approximately a year and a half after the initial integration of JAL and JAS, the JAL Group completed the integration process in April 2004 af-ter making successful progress with the necessary operations, including the integration of flight names and information systems and of airport
counters. In addition to the structural reform measures already being implemented, there is projected to be an integration effect of ¥68 billion in fiscal 2005, and that effect is projected to increase still further from fiscal 2006 onwards, aided by a reduction in the supplementary costs of the integration. The FY2004-06 Medium-Term Business Plan was drawn up with the goal of maximizing corporate value by positioning the Group to enjoy the benefits of the complete integration to the maxi-mum extent. We will increase the soundness of the Company’s financial condition, and achieve higher profitability, aiming for a V-shaped recov-ery in fiscal 2006 with consolidated operating income of ¥145 billion and ROE of at least 10%.
10 Japan Airlines Corporation
Dream Skyward II: Stepping-stone to become “the world’s No.1 airline group”
11

The Company’s financial condition has deteriorated considerably in recent years under the severe impact of external fac-tors such as the terrorist attacks on the United States and the SARS outbreak. Since the early 1990s, the JAL Group has been implementing structural reforms that have included the cutting of personnel costs, and these have been producing steady results. In addition to these existing structural reforms, the current FY2004-06 Medium-Term Business Plan in-cludes exhaustive measures for cutting costs. Among these are measures to reduce personnel costs, including making a start on the reform of the retirement benefit scheme, and the reduction of investment.
Business portfolio
By fiscal 2006 the overall scale of assets will be reduced
by 4%, and ROA will be raised to 6%. In international
passenger business the scale of operations will be op-
timized through a downsizing program involving the
reduction of assets. In domestic passenger operations,
ongoing steps will be taken to increase competitiveness
and ensure effective use of assets through the integra-
tion, so as to enhance profitability still further. In inter-
national cargo operations, investment will continue to
be made for the purpose of steadily securing demand in
growth markets.
Measures to address personnel costs
Given the present operating environment characterized
by dramatic fluctuations in demand, there is an urgent
need to decrease fixed costs. Accordingly, to acceler-
ate cost reductions the Group is taking a series of cost-
cutting measures that include taking advantage of the
integration to boost efficiency, promoting e-business
methods, switching to low-cost aircraft and equipment,
and expanding the operations of its low-cost carriers.
In parallel with these, steps are being taken to enhance
organizational and staff efficiency, including through the
introduction of a new retirement benefit scheme and a
program to optimize employee efficiency. The revision
of the pension scheme will cut retirement benefit obli-
gations throughout the Group, the aim being to achieve
a decrease of ¥57 billion over the three years from fiscal
2004 to 2006.
Organizational improvements are directed at creating
a structure that will facilitate rapid decision-making by
eliminating organizational duplication. This will build
an efficient operational structure combined with a rapid
decision-making structure. The intention is to utilize
these changes to streamline the workforce by 4,500
ground staff by the end of fiscal 2006 relative to fiscal
2002. In addition, to maximize the corporate value of
Group companies there will be programs designed to
educate and enhance the qualities of personnel, includ-
ing by stepping up personnel exchanges and expanding
education and training for Group employees, including
staff hired locally by Group companies. Also, to respond
flexibly to fluctuations in demand, the Group will ex-
pand its flexible system of hiring cabin crew at overseas
bases and for part-time employment.
Other cost-cutting measures
The operation of domestic routes was concentrated
on JAL Domestic in April 2004, and through that the
Company will be able to make steady progress in
benefiting from the integration to reduce costs, in
particular the reduction of charges for the leasing of
facilities within Japan. With respect to the aircraft fleet,
MD11s, DC10s, and A300s will be replaced by B767s
and B777s, which offer lower operating costs, and the
reduction in the total number of aircraft types will help
to lower maintenance costs. Another field that needs
to be strengthened is that of e-business. The target is to
reduce distribution costs related to domestic passengers
by ¥5 billion by fiscal 2006, including by reducing staff
at call centers and airports and cutting commissions on
passenger sales. Costs will also be reduced by speed-
ing up the expansion of the scale of low-cost operating
companies within the Group, in particular JALways (in-
ternational routes) and JAL Express (domestic routes).
Making deeper cuts in costsConcrete measures in the medium-term business plan 1
12 Japan Airlines Corporation
Dream Skyward II: Stepping-stone to become “the world’s No.1 airline group”

Introduction of B747 -400F
Business Portfolio
roaroa
Averageroa 3%
DomesticPassenger
InternationalPassenger
Cargo
Others
Averageroa 6%
Property Scale
2004 2006Improvement of Asset efficiency
-9% -9%-3%+31%Adjustment of Supply
Reduction of B747-400 Introduction of B777
Total Property Scale decreasesby 4% compared with FY2004
CurbInvestment
Strengthening ofearning capacity
Strengthening ofearning capacity
Operating Income by Business Segment
Domestic PassengerInternational PassengerCargoOthers
2004 2005 20060
1020304050607080
Billion yen
12 Japan Airlines Corporation 13

New mileage strategy
A new mileage strategy has been established as a means
of increasing revenues. This mileage program is the
largest of its kind in Japan, its decisive strongpoint be-
ing the base formed by the JAL Group’s domestic and
international networks. It has been reorganized in a
way that better reflects customer needs and that will
help to strengthen competitiveness still further. JAL
Mileage Bank (JMB) members currently number some
15.9 million, among which JAL Card members, whose
cards function as credit cards, number approximately 1.2
million. The Group is endeavoring to increase the num-
ber of JMB members still further by making the program
an attractive, high-value-added product. Additionally, it
is expected that a tie-up with East Japan Railway Com-
pany on the Suica Card, an electronic cash card, will
have a direct impact on boosting passenger numbers by
increasing the frequency with which JAL’s service is used.
Domestic passenger operations
For domestic passengers the Group has been taking a
number of steps in line with the keywords “easy-to-
use,” “easy-to-understand,” and “reasonably priced
but a high-class feel,” including the standardization of
flight names by using the JAL prefix, the strengthening
of e-business, and the introduction of the luxury Class-J
seat. These are aimed at further increasing the prefer-
ence for JAL among individual passengers, for whom
the unit price is relatively high. The targeted ratio of
individual passengers in fiscal 2004 is 64%, for which a
3.4% increase in average unit price is being aimed for.
This would bring an increase in revenues of ¥21 billion
relative to fiscal 2003. In addition, the ratio of passen-
gers currently using the Internet and other e-business
methods to book seats is 40%, and that will grow to
more than 50% by fiscal 2006.
International passenger operations
For international passengers, separate strategies have
been formulated for Pacific routes, European routes,
China routes, and Southeast Asia routes, and on these
the goal is to optimize supply by means of the downsiz-
ing of aircraft, and thereby increase load factors. For
example, on routes to China and other parts of East
Asia, operations using medium-bodied aircraft (B767,
B777) will be stepped up, and the routes will be devel-
oped vigorously. In this segment the sales strategy is to
gain more high-yield passengers by reinforcing direct
marketing, including through the use of the Mileage
Bank, fitting the new high-grade SHELL FLAT SEAT, and
stimulating tourism demand among individuals by of-
fering tickets available only on the Web. The target for
revenue growth in fiscal 2004 is ¥145 billion relative to
fiscal 2003, and ¥27 billion relative to fiscal 2002.
International cargo operations
International cargo operations are encountering very
strong demand, and buoyed by an increase in China
routes and the start of operations at the new hub airport
for international routes near Nagoya (the Central Japan
International Airport), revenues in fiscal 2004 are pro-
jected to rise by ¥9 billion from fiscal 2003. To ensure
product differentiation from competitors, the JAL Group
will offer its high-value-added J-PRODUCTS service,
the goal being to increase the proportion of total inter-
national cargo revenues accounted for by revenue from
J-PRODUCTS from 10% in fiscal 2003 to at least 30%
in fiscal 2006. In addition, by such means as introducing
the B747-400F, with its large freight-transportation ca-
pacity, and strengthening the operating structure for the
rapidly growing Chinese sector, we will achieve steady
growth in the cargo market, with its strong growth
potential.
To augment operating cash flow, the JAL Group is devoting considerable efforts to raising profitability. Providing high-quality services conceived from the customer’s standpoint forms a key part of measures to increase revenue. Each such measure, be it the enhancement of competitiveness by means of a new mileage strategy or the deployment of high-quality services and sales strategies in each business segment, constitutes a step towards enabling the JAL Group to declare proud-ly that for the traveler, it is always the airline group of choice.
Measures to enhance profitabilityConcrete measures in the medium-term business plan 2
14 Japan Airlines Corporation
Dream Skyward II: Stepping-stone to become “the world’s No.1 airline group”
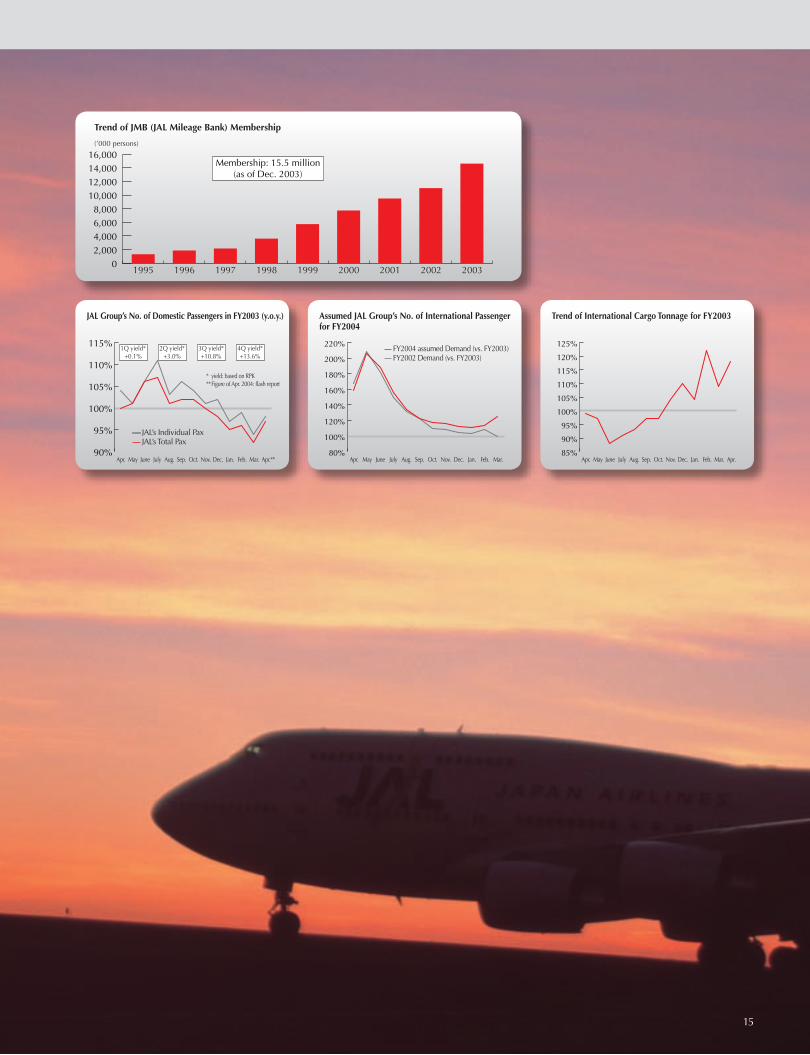
JAL Group’s No. of Domestic Passengers in FY2003 (y.o.y.)
Apr. May June July Aug. Sep. Oct. Nov. Dec. Jan. Feb. Mar. Apr.**90%
95%
100%
105%
110%
115%
JAL’s Individual Pax JAL’s Total Pax
1Q yield*+0.1%
2Q yield*+3.0%
3Q yield*+10.8%
4Q yield*+13.6%
* yield: based on RPK**Figure of Apr. 2004: flash report
Assumed JAL Group’s No. of International Passengerfor FY2004
Apr. May June July Aug. Sep. Oct. Nov. Dec. Jan. Feb. Mar.80%
100%
120%
140%
160%
180%
200%
220% FY2004 assumed Demand (vs. FY2003) FY2002 Demand (vs. FY2003)
Trend of International Cargo Tonnage for FY2003
Apr. May June July Aug. Sep. Oct. Nov. Dec. Jan. Feb. Mar. Apr.85%
90%
95%
100%
105%
110%
115%
120%
125%
Trend of JMB (JAL Mileage Bank) Membership
1995 1996 1997 1998 1999 2000 2001 2002 20030
2,0004,0006,0008,000
10,00012,00014,00016,000
(’000 persons)
Membership: 15.5 million(as of Dec. 2003)
14 Japan Airlines Corporation 15

Restriction of Investment
2003 2004 2005 20060
100
200
300Billion yen
cut 100 billion yen
cut 48 billion yen
The restoration of the Group’s financial soundness is a pressing issue for ensuring that corporate value is maximized. This entails securing better returns on investment, reducing investment, and cutting interest-bearing liabilities, and it is on these three points that the JAL Group will focus the improvement of its balance sheet. In the medium-term business plan, concrete measures are set out under such categories as increasing aircraft operating efficiency, restricting investment, and reducing unrecognized retirement benefit obligations, and corporate value will be maximized by achieving the targets in these areas.
Increasing the soundness of the Group’s financial conditionConcrete measures in the medium-term business plan 3
Increase in aircraft operating efficiency
In domestic passenger operations, by enhancing the ef-
ficiency of crew training and aircraft maintenance, the
operation of aircraft will be increased substantially, with
the aim of increasing operating efficiency in fiscal 2006
by 5% compared with fiscal 2003.
Restriction of investment
The amount of investment will be reduced substantially,
including a ¥100 billion reduction in fiscal 2004, a ¥48
billion reduction in fiscal 2005, and the minimization of
investment in aircraft. However, investment in items that
will enhance competitiveness, such as Class-J seats, and
in IT, is planned to be continued.
Reduction of unrecognized retirement benefit
obligations
The revision of the JAL International discount rate from
3.5% to 2.7% caused unrecognized retirement benefit
obligations at the end of fiscal 2003 to rise by ¥78 bil-
lion. To improve that situation, a new retirement benefit
scheme is to be introduced in fiscal 2004, cutting un-
recognized retirement benefit obligations by ¥33 billion.
Reduction of Unrecognized Retirement Benefit Obligations
2003 2004 2005 20060
50100150200250300350400450
Billion yenAdjustment of Discount Rate3.5% –› 2.7% +78 billion yen
Further possible reductionfor substitute portion ofemployees pensionprograms
New Retirement BenefitScheme (33) billion yen
Increase in Aircraft Operating Efficiency
Annual Operating Flights per Aircraft* in Domestic Passenger Segment
2006: increase by 5%compared with 2003
2003 2004 2005 20061,900
1,950
2,000
2,050
2,100No. of Flights
*Aircraft in operation + non-operational aircraft for maintenance/ training
16 Japan Airlines Corporation
Dream Skyward II: Stepping-stone to become “the world’s No.1 airline group”

“Class-J, More space for more passengers for a more relaxing flight”
16 Japan Airlines Corporation 17

International PassengerOperations
Demand slumped as a result of factors such as the situation in Iraq and the outbreak of SARS. A variety of measures were formulated to minimize the impact of these factors, including a reduction in the number of flights and the use of smaller air-craft, as well as cuts in operating expenses. With the increase of customer satisfaction the primary focus, the Group will devote its efforts to enhancing service quality and building a more efficient operating structure.
MEASURES TAKEN AND RESULTS FOR THE TERM
Route operation
During the first half the Company formulated a plan for routes
and numbers of flights that included increases in flights on
the Nagoya–Beijing, Nagoya–Tianjin, Fukuoka–Shanghai, and
Tokyo–Hanoi routes. In the event, however, the provision of
flights had to be adjusted carefully to deal with the effects of cir-
cumstances such as the situation in Iraq and the SARS outbreak,
with the result that operations were scaled down to 84% of the
initial projections.
The second half brought a recovery, particularly in busi-
ness demand originating from Japan, enabling the Company
to expand its route network. Taking advantage of the increase
in transportation capacity permitted as a result of the aviation
talks between Japan and China in July, it increased the number
of flights, including on the routes between Osaka and Dalian,
Shanghai, and Guangzhou, and on the Tokyo–Dalian route. In
parallel with this it increased flights on the Tokyo–London route
from one to two daily.
Marketing
Promotional campaigns were used to stimulate demand by al-
leviating the anxieties about overseas travel that people had
been feeling as a result of the Iraq situation and events such as
the SARS outbreaks. Among these was the “Fly JAL! — Over the
Ocean!” campaign, which for a one-year period featured popu-
lar stars in advertising literature and sales-promotion activities.
Steps were also taken to develop new products to meet the
expansion of routes to China. For example, in cooperation with
the China National Tourism Administration, JAL inaugurated the
JAL “Dynasty Express Bus,” for which the stretch of the Yellow
River Valley from Xian to Zhengzhou in Henan Province was
named the “Dynasty Road,” and marketed this in a tour package.
Other measures were implemented to broaden the range of
travel products and cultivate new demand. These included the
proactive promotion of a “Silver Wedding Trip” traveling style
targeted at older people: age-groups in which there is a rela-
tively healthy degree of wanderlust.
Other positive measures to cultivate demand included the
operation of services using late-night arrival/departure slots at
Haneda Airport, and an increase in the operation of daytime
charter flights on international routes. Efforts to promote visits
to Japan by overseas travelers included vigorous participation
in the “Visit Japan” campaign, which is being conducted in line
with the Japanese government’s policy of making Japan a “nation
built on tourism.” Plans were also drawn up for tours for indi-
vidual travelers interested in Japanese culture and for collabora-
tion with East Japan Railway Company, all as part of efforts to
enhance promotional schemes for stimulating inward tourism. In
these, the priority target regions were the United States, China,
Korea, Hong Kong, and Taiwan.
In addition, rapidly growing market needs were addressed
by means of a number of innovations. These included the insti-
tution of Web discount fares available for purchase on JAL Web
sites, the offering of paperless air tickets (the JAL e-Ticket), and
the promotion of the use of automatic check-in machines on
18 Japan Airlines Corporation 19
Review of Operations
international routes. “Web Goku,” the fare available exclusively
through the Internet, has matched the increasing reluctance of
customers to travel as members of large groups, with the result
that its use has spread through the market and sales have grown
strongly. Also, the two latest types of seat, the NEW SKYSLEEP-
ER SOLO and the SHELL FLAT SEAT, were introduced on the
London and New York routes, where they have received an ex-
cellent reception from passengers for their feel of heartfelt hospi-
tality and comfort.
These Group efforts achieved a recovery of demand on
routes to Europe, America, Hawaii, Micronesia, and Oceania,
but the recovery in tourism demand on routes to China and
Southeast Asia lagged behind. As a result, the JAL Group’s total
passenger numbers on international routes fell by 19.8% from
the previous year, to 11.74 million, and revenues declined by
17.8%, to ¥549.7 billion.
FUTURE OUTLOOK AND STRATEGY: MEDIUM-TERM BUSI-
NESS PLAN
The Group will develop the foundation of its business in a way
that increases service quality and also ensures the flexibility to
build a lower-cost operating structure to respond promptly to
changes in the market. At the same time it will endeavor to
maintain yields and increase seat load factors by being thorough
in allocating resources to high-revenue, fast-growing routes, and
by restructuring the network in a manner tailored to customer
needs and to market characteristics. Specifically, routes with air-
craft fitted with the new SHELL FLAT SEAT for business class will
be expanded, the scale of operations of JALways, the Group’s
low-cost carrier, will be increased, and administrative processes
will be reformed by greater use of e-business. In ways such as
these, the Group will continue its efforts to create a more effi-
cient operating structure.
International routes mark their
50th anniversaryOn February 2, 1954, JAL inaugurated Japan’s first
postwar international scheduled flights on the Tokyo
(Haneda)–Honolulu–San Francisco route with a DC-
6B aircraft seating 36 passengers. Over the ensuing 50
years, aircraft types have progressed to the B747 and
others, and the JAL Group’s overseas network has to-
day spread to encompass 30 countries and territories,
118 airports, and 245 routes. In fiscal 2004 a promo-
tional campaign to celebrate the 50th anniversary
will be conducted with the aim of generating greater
demand.
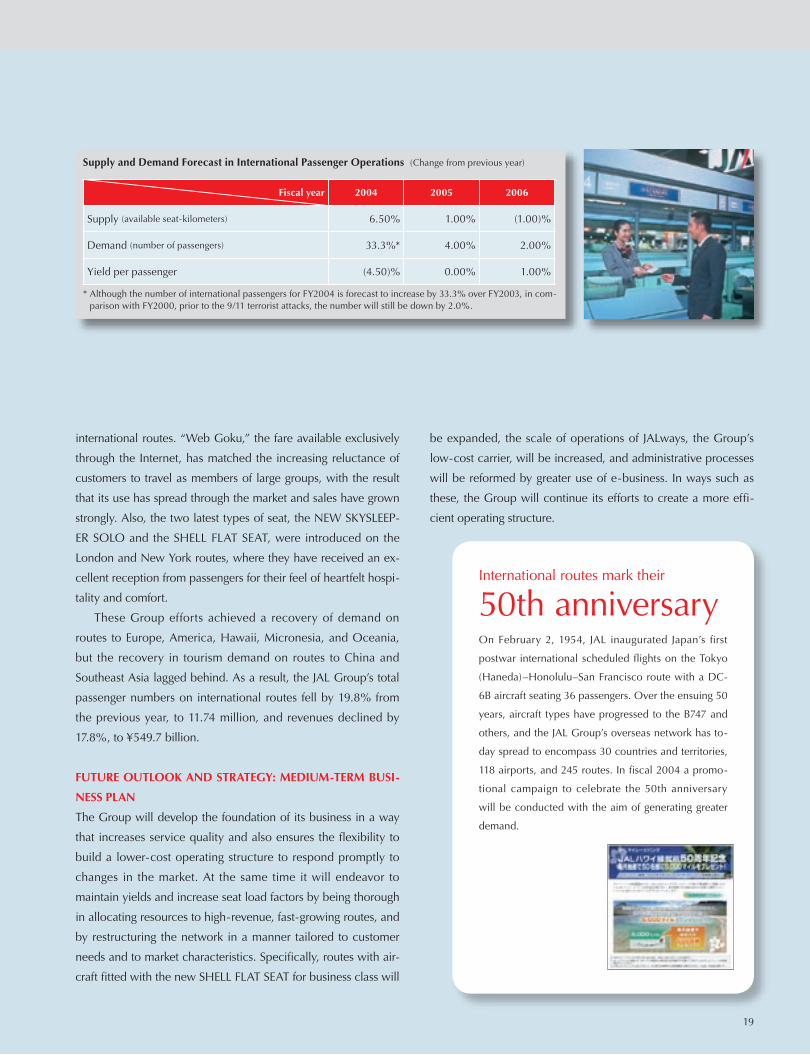
Supply and Demand Forecast in International Passenger Operations (Change from previous year)
Fiscal year 2004 2005 2006
Supply (available seat-kilometers) 6.50% 1.00% (1.00)%
Demand (number of passengers) 33.3%* 4.00% 2.00%
Yield per passenger (4.50)% 0.00% 1.00%
* Although the number of international passengers for FY2004 is forecast to increase by 33.3% over FY2003, in com-parison with FY2000, prior to the 9/11 terrorist attacks, the number will still be down by 2.0%.
18 Japan Airlines Corporation 19
MEASURES TAKEN AND RESULTS FOR THE TERM
Route operation
Wide-bodied jets have been assigned to serve most principal
routes uniformly under the JAL name, while on regional routes
the flights have been standardized under the JAS name, oper-
ated by medium-scale and small aircraft. This has maximized
revenues and ensured greater operating efficiency. In addition,
to give customers timetables that are easy and convenient to
use, overlapping JAL and JAS departure schedules have been
eliminated.
In addition, to minimize the impact of the surrender of slots
at Haneda Airport at the time of the integration and the de-
crease in the number of flights on trunk routes from Haneda, the
Company has increased fleet utilization, establishing new routes
such as the Tokyo–Yamagata and Osaka–Memanbetsu routes,
and increasing the number of flights on the Nagoya–Fukuoka,
Nagoya–Kagoshima, and other routes. These form part of its ef-
forts to ensure that the benefits of the integration are felt as early
as possible.
Marketing
As in the previous year, the Company set easy-to-use, com-
petitive fares, and fares were made increasingly varied so as
to satisfy individual customer needs. For example the “Time
Discount” and “Special Flight-Specific 7-Day Advance Book-
ing Discount” were newly introduced. Upon the opening of the
Shinagawa Station (Tokyo) of the Tokaido Shinkansen, the Compa-
ny put itself on a more competitive footing by reducing fares for
multiple-ticket coupons on the routes from Tokyo to Osaka,
Okayama, and Hiroshima.
Sales promotion measures included continuations of
existing schemes such as the Okinawa Campaign and the
Hokkaido Campaign, which were joined by the Kyushu Cam-
paign in October 2003. The dual aim of these was to generate
tourism demand and to draw attention to the JAL Group’s en-
hanced network.
There was also an active program of product development.
Based on the concept of warmth and friendliness, services for
passengers in need of assistance were combined systematically
into the “JAL Smile Support” package, in which a coherent ser-
vice is provided from the booking stage right through to getting
to the airport and into the cabin. Another highlight has been the
introduction of a new class — “Class-J” — in June 2004, provid-
ing passengers with a “new style of relaxation.” (Please see the
News item below.)
In the sphere of reservations and information services, since
April 2003 it has been possible to make bookings for both JAL
and JAS flights at either JAL or JAS reservation centers. That facil-
ity was supplemented in July of that year by the installation of
automated voice response systems at both companies’ reserva-
tion centers, enabling them to provide round-the-clock service.
Efforts were also focused on e-business. To enhance the
convenience of the “JAL e-Style” service accessible through
Web sites, cell phones, and JAL ONLINE (a domestic busi-
ness-trip support system for companies), the JAL and JAS
Web sites were amalgamated into a single site, creating an
Domestic PassengerOperations
Since April 2003 the JAL and JAS networks have been reor-ganized so that domestic operations could take maximum advantage of the increase in the number of flights. To combat the increasing intensity of competition in domestic airline busi-ness, the JAL Group is pledged to stabilize the foundations of its business by enhancing competitiveness and cost efficiency.
20 Japan Airlines Corporation 21
easy-to-understand and easy-to-use site. As a result, in March
2004 the proportion of individual passengers on domestic routes
who used e-channels to make their reservations and check in
reached more than 40%. JAL also provided other new added
value that takes advantage of information technologies, for ex-
ample by the launch in July 2003 of Japan’s first check-in proce-
dure able to be completed by cell phone: the “Keitai Check-in.”
Marketing measures such as these led to a substantial 6.7%
year-on-year improvement in passenger unit revenue. The to-
tal number of passengers on the JAL Group’s domestic routes
slipped slightly, by 0.1% from the previous term, to 46.49 mil-
lion, but revenues grew by 6.3%, to ¥668.8 billion.
FUTURE OUTLOOK AND STRATEGY: MEDIUM-TERM BUSI-
NESS PLAN
The Group will endeavor to increase profitability, gain customer
loyalty, and improve the domestic route network. This is in line
with the principal theme of establishing solid business founda-
tions by strengthening competitiveness and enhancing cost
efficiency in its operations. Specifically, marketability will be
enhanced by such means as strengthening the mileage program,
boosting customer convenience by fostering e-business, and
introducing the new “Class-J” service. As part of steps to ensure
greater operating efficiency, the scale of operations of the low-
cost carrier JAL Express will be expanded, costs will be reduced
through the use of e-business methods, and the benefits of the
business integration will be realized to the maxim extent.
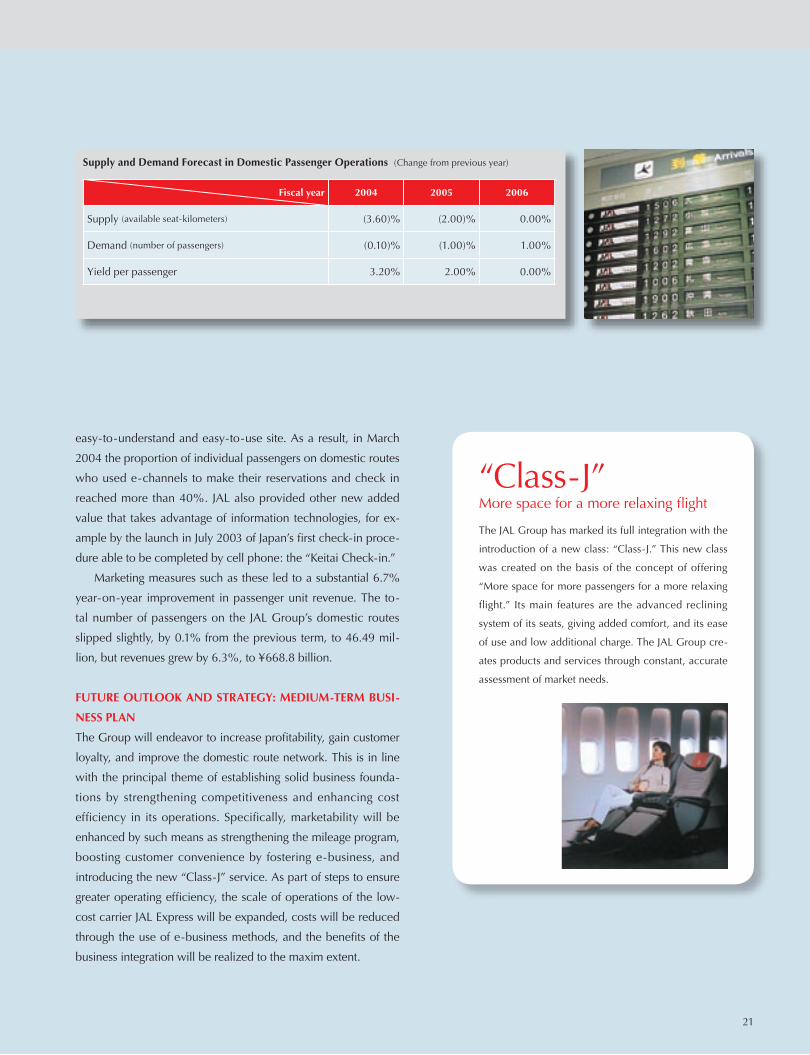
“Class-J”More space for a more relaxing flight
The JAL Group has marked its full integration with the
introduction of a new class: “Class-J.” This new class
was created on the basis of the concept of offering
“More space for more passengers for a more relaxing
flight.” Its main features are the advanced reclining
system of its seats, giving added comfort, and its ease
of use and low additional charge. The JAL Group cre-
ates products and services through constant, accurate
assessment of market needs.
Supply and Demand Forecast in Domestic Passenger Operations (Change from previous year)
Fiscal year 2004 2005 2006
Supply (available seat-kilometers) (3.60)% (2.00)% 0.00%
Demand (number of passengers) (0.10)% (1.00)% 1.00%
Yield per passenger 3.20% 2.00% 0.00%
20 Japan Airlines Corporation 21

Cargo Operations
Shipments were weak during the first half as a result of factors such as a decline in cargo space caused by cuts in the num-ber of passenger flights, but they were firm in the second half. There was remarkably strong growth in shipments of digital consumer-electronics products such as digital cameras and DVD-related equipment, which became one of the principal types of merchandise transported in cargo services on JAL’s international routes.
MEASURES TAKEN AND RESULTS FOR THE TERM
Route operation
On international routes, cargo space on passenger flights was re-
duced in the first half of the year under review. Since the second
half, however, there has been robust demand on Asian routes,
particularly to mainland China and Hong Kong, and on Euro-
pean routes, and it has also been picking up on Pacific routes. In
consequence, demand through the year as a whole remained at
around its year-earlier level. JAL strengthened its routes to China,
where there is massive demand for cargo, including by starting
cargo flights on the Tokyo–Xiamen route, opened in April, and
by increasing the number of flights to Hong Kong in September
and on the Shanghai route in November.
On domestic routes, demand was buoyed by the recovery
trend in the domestic economy during the second half of the
term. As a result, total domestic cargo shipments showed a year-
on-year increase for the first time in three years.
Marketing
On international routes the Group made use of the expanded
network created through its alliance strategy in the field of inter-
national cargo business. For example, in July 2003, it substantially
increased customer convenience by offering high-value-added
cargo products — J-PRODUCTS — that pledged the fastest and
highest-priority handling. It also applied information technology
to enhance the efficiency of international air cargo operations and
to accelerate the processing of transactions. In February 2004, for
example, it started operation of its “Ezycargo” site, which enables
customers to make international cargo reservations and to track
cargo movements through the Internet.
Total cargo transportation volume fell by 9.2%, to 10,032.25
million ton-km. Revenues slipped by 2.6%, to ¥161.3 billion, in
part because of a fall in unit revenue owing to factors such as
the appreciation of the yen.
Domestic cargo operations were impacted positively by
the expansion of the network resulting from the integration. In
consequence, revenues remained around their year-earlier level,
in spite of the reduction of cargo space on high-demand routes
that resulted from the reorganization of the domestic flights of
the Group. The JAL Group’s total transportation volume fell by
0.5% from the previous year, to 3,054.72 million ton-km, but
revenues rose by 1.1%, to ¥42.6 billion.
FUTURE OUTLOOK AND STRATEGY: MEDIUM-TERM BUSI-
NESS PLAN
In international cargo operations the opening of the Central
Japan International Airport is expected to change the competitive
environment. With respect to routes to China, where demand is
expected to continue to grow strongly, the Group will continue to
build its operating foundations and increase transportation qual-
ity through the development of its organizational and operating
structure and through personnel recruitment and training. Steps
to increase revenues and cut costs include establishing cargo
space supply capacity to meet the growth in international cargo
demand, providing high-value-added products and services
tailored to meet increasingly sophisticated and diverse needs,
and using alliances with other companies, for example through
the WOW alliance — a four-way agreement among Lufthansa
Cargo, SAS Cargo, Singapore Airlines, and JAL Cargo — in paral-
lel with the enhancement of the Group’s own network.
22 Japan Airlines Corporation 23
Other Operations
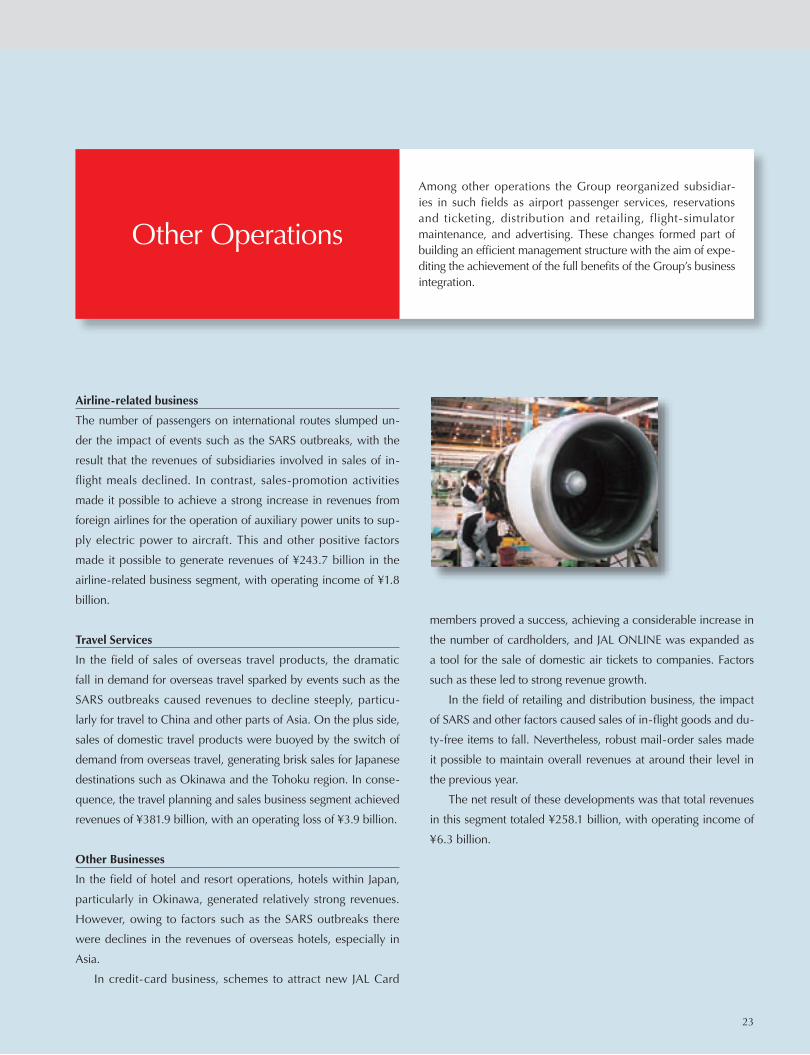
Among other operations the Group reorganized subsidiar-ies in such fields as airport passenger services, reservations and ticketing, distribution and retailing, flight-simulator maintenance, and advertising. These changes formed part of building an efficient management structure with the aim of expe-diting the achievement of the full benefits of the Group’s business integration.
Airline-related business
The number of passengers on international routes slumped un-
der the impact of events such as the SARS outbreaks, with the
result that the revenues of subsidiaries involved in sales of in-
flight meals declined. In contrast, sales-promotion activities
made it possible to achieve a strong increase in revenues from
foreign airlines for the operation of auxiliary power units to sup-
ply electric power to aircraft. This and other positive factors
made it possible to generate revenues of ¥243.7 billion in the
airline-related business segment, with operating income of ¥1.8
billion.
Travel Services
In the field of sales of overseas travel products, the dramatic
fall in demand for overseas travel sparked by events such as the
SARS outbreaks caused revenues to decline steeply, particu-
larly for travel to China and other parts of Asia. On the plus side,
sales of domestic travel products were buoyed by the switch of
demand from overseas travel, generating brisk sales for Japanese
destinations such as Okinawa and the Tohoku region. In conse-
quence, the travel planning and sales business segment achieved
revenues of ¥381.9 billion, with an operating loss of ¥3.9 billion.
Other Businesses
In the field of hotel and resort operations, hotels within Japan,
particularly in Okinawa, generated relatively strong revenues.
However, owing to factors such as the SARS outbreaks there
were declines in the revenues of overseas hotels, especially in
Asia.
In credit-card business, schemes to attract new JAL Card
members proved a success, achieving a considerable increase in
the number of cardholders, and JAL ONLINE was expanded as
a tool for the sale of domestic air tickets to companies. Factors
such as these led to strong revenue growth.
In the field of retailing and distribution business, the impact
of SARS and other factors caused sales of in-flight goods and du-
ty-free items to fall. Nevertheless, robust mail-order sales made
it possible to maintain overall revenues at around their level in
the previous year.
The net result of these developments was that total revenues
in this segment totaled ¥258.1 billion, with operating income of
¥6.3 billion.
22 Japan Airlines Corporation 23

General meetingof Stockholders
Corporate Auditor CommitteeCorporate Auditor of the Board
Office of theCorporate Auditor
JAL GroupManagement Board
Board of Directors
Chief Executive Officerthe Chairman
Strategy PolicyCommittee
CSR Committee
President
Environmental Affairs EnvironmentalSub-committee
EnvironmentTask Force 1(aircraft operational issues)
EnvironmentTask Force 2(cabin & marketing issues)
JAL Sales Co., Ltd.
Japan Airlines International Co., Ltd.
Japan Airlines Domestic Co., Ltd.
Environmental Affairs
Environmental Affairs
Corporate Planning & Administration
The JAL Group remains at all times a corporate group for
which safety constitutes its very foundation, and which
fulfills its obligations as a corporate citizen and contrib-
utes to society at large. To that end it has established its
Corporate Social Responsibility (CSR) Committee, which
is dedicated to addressing issues such as environmental
preservation activities, compliance, investor relations, and
corporate philanthropy.
The JAL Group is committed to playing its role as a corporate
citizen by engaging in activities that contribute to the healthy
development of society. Efforts to help protect the earth’s en-
vironment constitute a prime example. In fulfilling our mission
as an institution providing public transportation we impose a
burden on the environment in such ways as the consumption of
fossil fuels and the creation of noise, and we therefore recognize
environmental preservation as an important management issue.
Accordingly, at the time of the business integration in October
2002, a common Group Basic Environmental Policy and Envi-
ronmental Action Guidelines were instituted. At the same time,
Japan Airline System Corporation established the JAL Group
Environmental Committee, which formulates Group environ-
mental policies and has guided the conduct and thorough
implementation of environmental activities. Since fiscal 2004 its
status has been changed to that of the environmental subcom-
mittee of the CSR Committee, and in that capacity it has stepped
up its activities on behalf of the environment.
The Group strives constantly to contribute to both the lo-
cal and international communities as a good corporate citizen.
Examples are its efforts to assist the creation of a barrier-free
society by making increased efforts in the configuration of fix-
tures within airliners and by enhancing its services tailored to the
needs of handicapped passengers. Another example is its phil-
anthropic activities designed to make use of the characteristics
of air transportation and related businesses.
The Group’s corporate activities are global in scope and are
built on relations with customers, people with whom it does
business, and large numbers of other people with whom it inter-
acts, such as regulatory bodies and government agencies. In the
conduct of its corporate activities within Japan and overseas, the
Group is highly conscientious in the observance of all relevant
laws and other social rules. In the sphere of disclosure the Group
is scrupulous in disclosing information that is of use to society,
and is in constant communication with society. In addition, it at-
taches great importance to relations with its shareholders and in-
vestors. To ensure constant understanding of what it is doing, by
such means as regular publications for shareholders it discloses
information concerning corporate management and business op-
erations quickly and accurately.
The mission of the JAL Group is to be liked by its customers,
to give them satisfaction, and to earn their loyalty. To achieve
these goals, in all companies throughout the Group we will main-
tain our dedication to acting constantly with the good of society
as a whole in mind, and of fulfilling our social responsibilities.
24 Japan Airlines Corporation
Corporate Social Responsibility (CSR) Activities

Management’s Review and Analysis of Financial Position
25
Japan Airlines Corporation and Consolidated Subsidiaries Years Ended March 31, 2003 and 2004
Operating Environment and Financial Strategy
Signs of improvement began to emerge gradually in the Japanese econ-omy during the year under review, highlighted by a strong recovery inequity prices and an increase in the number of companies postingrecord-high profits. Nevertheless, the recovery has been a patchy one,since consumer spending and housing investment remained flat, andthe employment situation continued to be difficult.
In the aviation industry, a very severe operating environment prevailed.Key adverse factors included the succession of serious events withinternational consequences, such as the military action in Iraq and theoutbreaks of SARS and avian influenza, as well as the steep increase inthe price of aviation fuel.
To counter these difficult business conditions, in domestic passengeroperations JAL implemented vigorous sales promotion measures andenhanced competitiveness through the steady implementation of itsintegration plan, including the reorganization of its route network. As aresult, unit prices improved and a substantial increase in revenues wasachieved. In international passenger operations, however, the impact onpassenger psychology of the external factors referred to above was
0
600
1200
1800
2400
2002 2003 2004
(Billions of yen)
Consolidated operating revenues
-80
-60
-40
-20
0
20
40
2002 2003 2004
(Billions of yen)
Consolidated operatingincome
JAL Fleet (Consolidated)
March 31, 2004
Type of aircraft Capacity Owned Leased TotalBoeing 747-400 303-568 seats 38 4 42Boeing 747LR 350-483 seats 18 4 22Boeing 747SR 533,563 seats 3 0 3Boeing 747F 115 tons(max) 7 3 10Boeing 777 268-470 seats 10 16 26Douglas MD-11 233-264 seats 3 0 3Douglas DC-10 264-318 seats 10 0 10Airbus A300-600R 239-292 seats 12 10 22Airbus A300 283-298 seats 8 2 10Boeing 767 213-270 seats 17 16 33Douglas MD-90 166 seats 13 3 16Douglas MD-81 163 seats 9 9 18Douglas MD-87 134 seats 6 2 8Boeing 737 150-167 seats 10 13 23CRJ200 50 seats 0 6 6YS-11 60,64 seats 9 0 9DASH8-400 74 seats 1 2 3SAAB340 36 seats 7 7 14Total 181 97 278
Employee Statistics for Japan Airlines and Consolidated Subsidiaries
March 31, 2004
Operations by business segment Number of employees
Air-transportation 24,510Airline-related business 18,302Travel services 5,398Other 5,843Total 54,053
Note: These figures represent employees in the actual workforce.
26 Japan Airlines Corporation
greater than anticipated. This inevitably resulted in a significant slumpin demand and a consequent decline in revenue.
In response to these increasingly difficult operating circumstances, theJAL Group aims to maximize the soundness of its financial condition. Itsyardsticks for achieving that are to meet the targets of achieving areturn on equity (ROE) of least 10% on a consolidated basis and ofreducing the payback period for interest-bearing debt from operatingcash flows to within 10 years. For the year under review, we recorded aratio of net loss to shareholders’ equity, and the payback period forinterest-bearing debt was 22 years, but the Group plan is to attain itstargets from fiscal 2004 onwards by cutting costs through business inte-gration and measures to boost revenues.
Results of Operations (consolidated basis)
Operating Revenues
Operating revenues in the fiscal 2004, fell by 7.3% year-on-year, to¥1,931.7 billion (US$18,397 million). A major factor in this revenuedecline was the substantial fall in the number of passengers on interna-tional routes because of the Iraq situation and the SARS epidemic.
The criteria for categorizing business segments have changed as of theyear under review. Previously, airline-related business, credit card andleasing business, and retailing and distribution business were combinedtogether and presented as “Air Transport-Related Business (“Other” seg-ment).” Beginning with the term under review, however, airline-relatedbusiness is presented independently as “Airline-Related Business” inline with our new segmentation strategy, under which these operationsare clearly labeled as fulfilling functions auxiliary to our mainstay airtransportation business. This change enables segment information to bepresented more clearly. In addition, hotel and resort operations, previ-ously presented separately, have been scaled down as the Company hasswitched to development based on operations on a commissioned basis.As a result, from the standpoint of importance they are from now on tobe presented as part of “Other Business,” together with the credit-cardand leasing business, the retailing and distribution business, and otherbusinesses.
On a segment basis, the revenues of the air transportation businesstotaled ¥1,548.8 billion (US$14,750 million), down 6.2% from the previ-ous year; those of airline-related business were ¥243.7 billion (US$2,321million), down 0.9%; those of travel services fell by 12.4% to ¥381.9 bil-lion (US$3,637 million); and those of other business slipped by 1.5% to¥258.1 billion (US$2,458 million). Revenues in all segments were down,and the decline in air transportation business revenues, which accountfor the majority of total revenues, was instrumental in accelerating the fallin revenues in the travel services segment, given the close direct linkagebetween the two segments.
-90
-60
-30
0
30
2002 2003 2004
(Billions of yen)
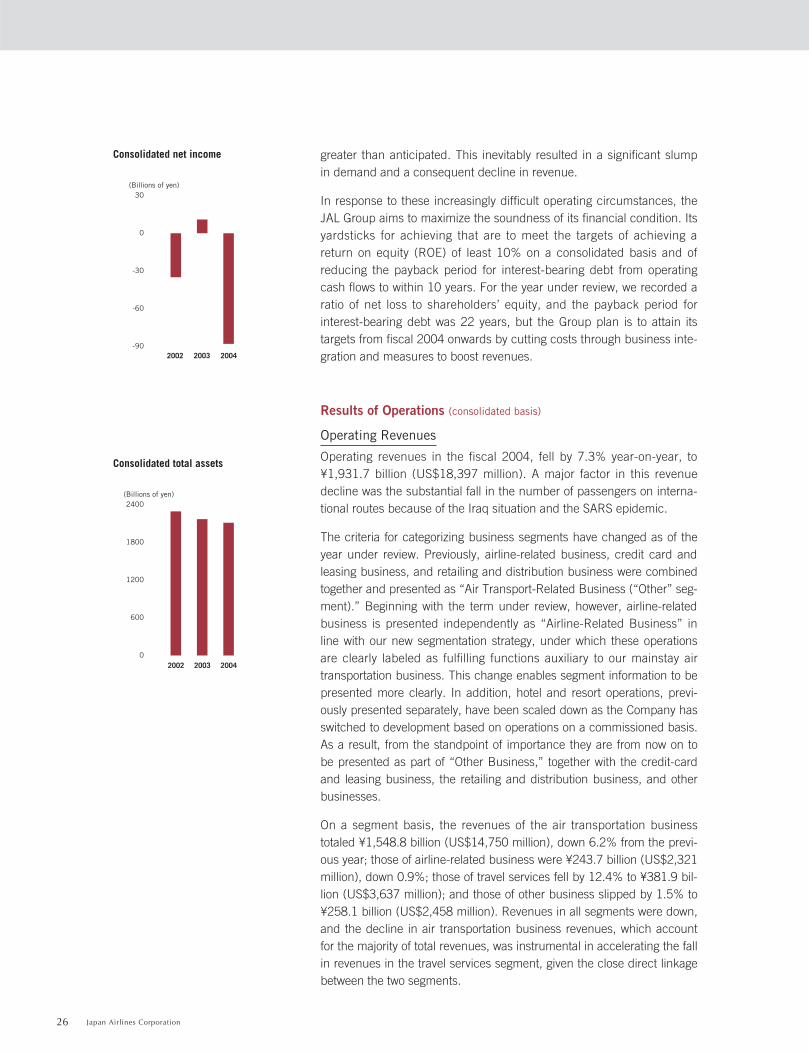
Consolidated net income
0
600
1200
1800
2400(Billions of yen)
2002 2003 2004
Consolidated total assets
27
However, within the air transportation business segment, operating rev-enues from international passenger operations declined by 17.8% fromthe previous year, to ¥549.7 billion, while those from domestic passen-ger operations rose 6.3% to ¥668.8 billion. This is a graphic illustrationof how the integration is impacting the domestic market. In addition,whereas domestic revenues were ¥1,093.0 billion, down just 1.8%year-on-year, the fall was greater on international routes. Revenues onAmerican were down 7.1% at ¥302.2 billion; on European they fell11.2% to ¥187.9 billion; and on Asia and Oceania they were down19.6% at ¥348.4 billion. The fall was particularly marked on Asia andOceania, which were severely impacted by the outbreaks of SARS andavian influenza.
Operating expenses fell by ¥73.5 billion from the previous year, to¥1,999.3 billion (US$19,041 million). In spite of the rise in the unitprice of Singapore Kerosene, fuel costs declined by ¥1.5 billion overall,as the number of flights was reduced substantially. The yen’s apprecia-tion also contributed to the decline in expenses.
Earnings
The implementation of the integration plan was accelerated, and ¥45.5billion in emergency remedial measures for income were also imple-mented Group-wide. Nevertheless, the decline in revenues was sub-stantial, and an operating loss was posted in the amount of ¥67.6 billion(US$644 million), compared with an operating income of ¥10.6 billionfor the previous term.
An analysis of operating profit and loss by segment reveals that in theair transportation segment, domestic routes performed relatively well,but the slump on international routes gave rise to a ¥72.1 billion(US$687 million) operating loss. The travel services segment wasadversely affected by factors that tended to depress demand, such asanxiety about the international situation, and these resulted in an oper-ating loss of ¥3.9 billion (US$37 million).
In the airline-related business segment there was a substantial fall inthe number of passengers on international routes, which led to adecline in the revenues of subsidiaries engaging in the sale of in-flightmeals, but there were strong increases in revenues from the supply ofelectric power to aircraft and the sale of auxiliary power units and food-service carts. As a result, this segment was able to post operatingincome of ¥1.8 billion (US$18 million). In the “other business” seg-ment, hotel and resort operations generated robust revenues from guestaccommodation, particularly within Japan, while in credit-card busi-ness, the initiatives to attract new card members were successful,resulting in a considerable increase in the number of cardholders.These and other factors enabled the generation of operating income of¥6.3 billion (US$60 million) in this segment, which was around the pre-vious year’s level.
0
80
160
240
320(Billions of yen)
2002 2003 2004
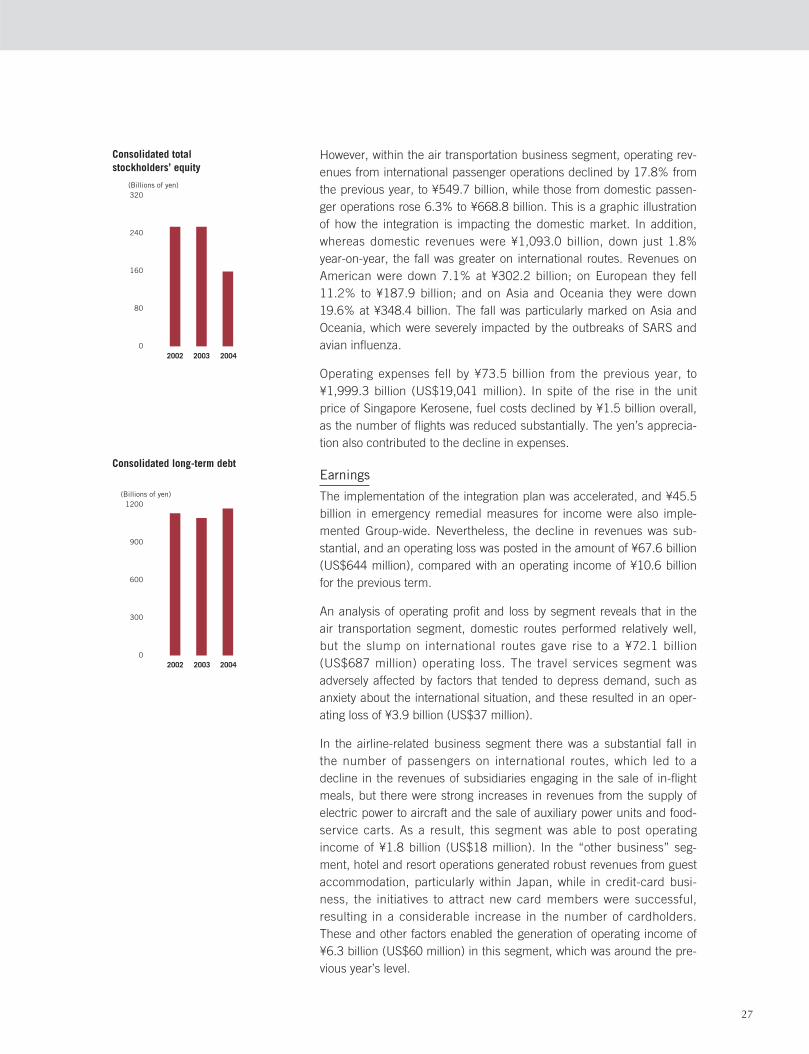
Consolidated total stockholders’ equity
0
300
600
900
1200(Billions of yen)
2002 2003 2004
Consolidated long-term debt

28 Japan Airlines Corporation
With regard to non-operating income and expenses, interest expense –the largest expense item — was cut by ¥6.1 billion as a result of refinanc-ing at lower interest rates, facilitated by the integration. However, a ¥12.8billion decline in flight equipment purchase incentives and the liquidationof affiliates were key factors that caused net non-operating expenses toincrease by ¥7.9 billion from the previous year, to ¥14.5 billion.
As a result of all of these factors, there was a net loss for the term of¥88.6 billion (US$843 million), representing a deterioration of ¥100.2billion.
Liquidity and Capital Resources
Financial Position
Total assets at the end of March 31, 2004 stood at ¥2,113.4 billion(US$20,127 million), representing a decline of ¥58.8 billion from theprevious year-end. A significant factor in this decrease was a fall of¥11.2 billion in current assets as a result of changes such as a declinein deferred income taxes. Total property and equipment, net, declinedby ¥60.3 billion, key factors in which included the depreciation of flightequipment and the sale of flight equipment.
On the liabilities side, there was a large decline in current liabilities of¥54.7 billion, and long-term interest-bearing debt increased by ¥75.8billion. The fall in current liabilities was attributable to repayments ofshort-term borrowings and redemption of bonds on maturity. In con-trast, the increase in long-term interest-bearing debt resulted from anincrease in long-term borrowings from the Development Bank of Japanunder the government-sponsored emergency airline support program.This shift from current liabilities to long-term interest-bearing debt wasaimed at addressing the opaque financial environment by increasingthe relative weight of long-term borrowings, thereby stabilizing theGroup’s fund-raising. As a result of these developments, the currentratio rose to 92.6% from 86.2% in the previous year, reflecting greaterliquidity.
Total stockholders’ equity recorded a decline of ¥94.9 billion, principallybecause of the substantial decrease in retained earnings resulting fromthe large net loss. Capital surplus also declined because of dividendpayments and a loss on disposal of shares in treasury. In consequence,the stockholders’ equity ratio declined to 7.5% from its year-earlier levelof 11.7%.
Cash Flows
Net cash provided by operating activities in the fiscal year under reviewtotaled ¥76.3 billion (US$727 million), down ¥79.0 billion from the pre-vious year. The principal cause of this was the posting of a loss beforeincome taxes and minority interests.
2003 2004
(Billions of yen)
-120
-80
-40
0
40
80
120
160
Net cash provided by operating activities
Net cash used in investing activitiesNet cash used infinancing activities
Consolidated cash flows
0
4
8
12
16(%)
2002 2003 2004
Consolidated stockholders’equity ratio

29
Net cash used in investing activities totaled ¥85.3 billion (US$813 mil-lion), approximately the same level as in the previous year. In spite of adecline in the cash outflow for the acquisition of aircraft and foradvance payments, there was also a fall in the inflow of cash from thecollection of long-term loans receivable.
Net cash provided by financing activities was ¥7.6 billion (US$72 mil-lion), compared with a ¥108 billion net cash outflow in the previousyear. The principal components of this were outflows for repayments ofloans and redemption of bonds, and an inflow from fund-raising bymeans of long-term loans.
As a result, cash and cash equivalents at the end of the year declinedby ¥2.9 billion from the previous year, to ¥143.3 billion (US$1,365 mil-lion). The payback period for interest-bearing debt from operating cashflows was 22 years.
Outlook for Current Term
The operating environment for the JAL Group will remain harsh, but inair transportation operations, the benefits of the complete business inte-gration will be felt to the maximum. Also, in international and domesticpassenger as well as cargo operations, the Group will provide high-value-added products tailored to meet customer needs in each segment, andongoing efforts will be made to enhance competitiveness. In addition,greater emphasis will be placed on the measures to achieve cost reduc-tions that are already being implemented, with the aim of improving theGroup’s balance of revenue and expenditure. Steps will also be taken toimprove profitability in fields other than air transportation.
The latest forecasts of results for the current fiscal year are as follows,premised on an exchange rate of ¥110 against the U.S. dollar,Singapore Kerosene at a market price of US$34/barrel, and the CIFprice of crude oil at US$29/barrel.
(1) Operating revenues: ¥2,190 billion
(2) Operating income: ¥81 billion
(3) Net income: ¥36 billion

30 Japan Airlines Corporation
Japan Airlines Corporation and Consolidated Subsidiaries
Consolidated Balance Sheets
Thousands ofU.S. dollars
Millions of yen (Note 2)
As of March 31, 2004 2003 2004
AssetsCurrent assets:
Cash and time deposits (Note 3) ¥ 143,775 ¥ 133,145 $ 1,369,285
Short-term investments in securities (Notes 3 and 4) 656 14,621 6,247
Accounts receivable (Note 14):
Trade 205,524 197,528 1,957,371
Unconsolidated subsidiaries and affiliates 5,982 6,935 56,971
Allowance for doubtful accounts (3,231) (3,117) (30,771)
Flight equipment spare parts, at cost (Note 5) 75,784 78,424 721,752
Deferred income taxes (Note 7) 8,690 16,597 82,761
Prepaid expenses and other 81,892 86,186 779,923
Total current assets 519,076 530,322 4,943,580
Investments and advances (Note 5):
Unconsolidated subsidiaries and affiliates 36,358 40,992 346,266
Other (Note 4) 95,127 99,497 905,971
Total investments and advances 131,486 140,490 1,252,247
Property and equipment (Notes 5 and 10):
Flight equipment 2,080,078 2,143,242 19,810,266
Ground property and equipment 814,206 848,023 7,754,342
2,894,284 2,991,266 27,564,609
Accumulated depreciation (1,632,427) (1,661,854) (15,546,923)
1,261,857 1,329,411 12,017,685
Advances on flight equipment purchases and other (Note 14) 60,424 53,203 575,466
Total property and equipment, net 1,322,281 1,382,615 12,593,152
Software 64,551 49,820 614,771
Long-term loans 15,695 14,499 149,476
Deferred income taxes (Note 7) 49,645 41,503 472,809
Bond issuance expenses 123 — 1,171
Other assets 10,559 13,033 100,561
¥2,113,418 ¥2,172,284 $20,127,790
The accompanying notes are an integral part of these consolidated statements.

31
Thousands ofU.S. dollars
Millions of yen (Note 2)
2004 2003 2004
Liabilities and stockholders’ equityCurrent liabilities:
Short-term borrowings (Notes 3 and 5) ¥ 10,782 ¥ 23,035 $ 102,685
Current portion of long-term debt (Notes 5 and 14) 144,718 198,188 1,378,266
Accounts payable (Note 14):
Trade 198,530 197,227 1,890,761
Unconsolidated subsidiaries and affiliates 7,512 7,329 71,542
Accrued expenses 50,966 56,337 485,390
Accrued income taxes (Note 7) 6,572 5,320 62,590
Deferred income taxes (Note 7) 60 73 571
Other 141,416 127,833 1,346,819
Total current liabilities 560,559 615,346 5,338,657
Long-term debt (Notes 5 and 14) 1,170,156 1,094,285 11,144,342
Accrued pension and severance costs (Note 6) 163,128 143,670 1,553,600
Deferred income taxes (Note 7) 120 413 1,142
Other noncurrent liabilities 36,041 40,788 343,247
Minority interests 24,139 23,522 229,895
Commitments and contingent liabilities (Notes 10, 11 and 14)
Stockholders’ equity (Note 8):
Common stock:
Authorized: 7,000,000,000 shares
Issued: 1,980,465,250 shares in 2004 and 2003 100,000 100,000 952,380
Capital surplus 136,678 147,175 1,301,695
(Accumulated deficit) retained earnings (65,031) 23,481 (619,342)
Net unrealized gain (loss) on other securities, net of taxes (Note 4) 2,787 (780) 26,542
Translation adjustments (9,958) (7,451) (94,838)
Common stock in treasury, at cost: 18,448,160 shares in 2004
and 19,863,126 shares in 2003 (5,202) (8,168) (49,542)
Total stockholders’ equity 159,273 254,256 1,516,885
¥2,113,418 ¥2,172,284 $20,127,790

32 Japan Airlines Corporation
Japan Airlines Corporation and Consolidated Subsidiaries
Consolidated Statements of Operations
Thousands ofU.S. dollars
Millions of yen (Note 2)
2002Pro forma
Years ended March 31, 2004 2003 (Unaudited) 2004Operating revenues:Passenger:
Domestic ¥ 668,888 ¥ 629,358 ¥ 650,185 $ 6,370,362International 549,764 668,472 632,472 5,235,848
Cargo:Domestic 42,670 42,217 43,201 406,381International 161,331 165,613 145,846 1,536,486
Incidental and other revenues 509,086 577,818 557,775 4,848,4381,931,742 2,083,480 2,029,481 18,397,543
Operating expenses (Note 10):Wages, salaries and benefits 510,203 499,448 487,647 4,859,076Aircraft fuel 244,341 245,921 250,457 2,327,057Aircraft maintenance 82,206 81,139 72,385 782,914Aircraft rent 86,720 91,921 98,657 825,904Landing fees and other rent 233,230 231,835 222,354 2,221,238Purchased services 106,695 111,922 128,313 1,016,142Depreciation and amortization 119,388 118,187 113,519 1,137,028Commission 113,396 125,717 136,729 1,079,961Incidental and other expenses 503,203 566,796 520,458 4,792,409
1,999,387 2,072,891 2,030,522 19,041,780Operating (loss) income (67,645) 10,589 (1,041) (644,238)
Non-operating income (expenses):Interest and dividend income 2,928 2,932 3,814 27,885Interest expense (28,503) (34,657) (38,829) (271,457)Exchange gain (loss), net 424 (1,975) 3,800 4,038Flight equipment purchase incentives 29,260 42,075 — 278,666Gain on sales of ground property and equipment 1,330 4,446 5,933 12,666Gain on sales of investments in securities 1,235 4,623 14,337 11,761Subsidy received for purchases of aircraftfor isolated island routes 1,618 — — 15,409
Gain recognized upon separation of substitutional portionof benefit obligation of welfare pension fund plan 755 — — 7,190
Loss on sales and disposal of flight equipment (13,946) (10,637) (7,147) (132,819)Loss on sales and disposal of ground property and equipment (5,153) (9,852) (5,176) (49,076)Loss on investments in unconsolidated subsidiaries and affiliates (6,518) — (5,622) (62,076)Equity in earnings (losses) of affiliates 1,221 340 (155) 11,628Expenses arising from business combination — (7,304) — —Other, net 846 3,500 (1,116) 8,057
(14,503) (6,508) (30,163) (138,123)(Loss) income before income taxes and minority interests (82,148) 4,081 (31,205) (782,361)Income taxes (Note 7):Current 8,854 8,100 8,526 84,323Deferred (3,092) (16,468) (3,793) (29,447)
5,761 (8,368) 4,732 54,866Minority interests (709) (804) 140 (6,752)
Net (loss) income ¥ (88,619) ¥ 11,645 ¥ (35,797) $ (843,990)
In order to enhance comparability, supplemental unaudited pro forma financial statements for the year ended 2002 are presented above.
The accompanying notes are an integral part of these consolidated statements.

33
Japan Airlines Corporation and Consolidated Subsidiaries
Consolidated Statements of Stockholders’ Equity (Note 8)
Millions of yenNet unrealized
Number of (Accumulated gain (loss) on shares of deficit) other securities, Common
common stock Common Capital retained net of taxes Translation stock inissued stock surplus earnings (Note 4) adjustments treasury Total
Balance at April 1, 2002 1,980,465,250 ¥100,000 ¥158,529 ¥ 570 ¥2,095 ¥(4,717) ¥(7,467) ¥249,009Net income for the year ended
March 31, 2003 11,645 11,645Bonuses to directors and statutory
auditors (35) (35)Transfer from capital surplus to retained earnings (11,301) 11,301 —
Other (51) (2,875) (2,734) (701) (6,363)Balance at March 31, 2003 1,980,465,250 100,000 147,175 23,481 (780) (7,451) (8,168) 254,256Net loss for the year ended
March 31, 2004 (88,619) (88,619)Cash dividends (7,844) (7,844)Bonuses to directors and statutory
auditors (38) (38)Increase resulting from changein scope of consolidation 144 144
Other (2,652) 3,567 (2,506) 2,966 1,375Balance at March 31, 2004 1,980,465,250 ¥100,000 ¥136,678 ¥(65,031) ¥2,787 ¥(9,958) ¥(5,202) ¥159,273
Thousands of U.S. dollars (Note 2)Net unrealized
(Accumulated gain (loss) on deficit) other securities, Common
Common Capital retained net of taxes Translation stock in stock surplus earnings (Note 4) adjustments treasury Total
Balance at March 31, 2003 $ 952,380 $ 1,401,666 $ 223,628 $ (7,428) $ (70,961) $ (77,790) $ 2,421,485Net loss for the year ended
March 31, 2004 (843,990) (843,990)Cash dividends (74,704) (74,704)Bonuses to directors and statutoryauditors (361) (361)
Increase resulting from changein scope of consolidation 1,371 1,371
Other (25,257) 33,971 (23,866) 28,247 13,095Balance at March 31, 2004 $952,380 $1,301,695 $(619,342) $ 26,542 $(94,838) $(49,542) $1,516,885
The accompanying notes are an integral part of these consolidated statements.

34 Japan Airlines Corporation
Japan Airlines Corporation and Consolidated Subsidiaries
Consolidated Statements of Cash Flows
Thousands ofU.S. dollars
Millions of yen (Note 2)
2002Pro forma
Years ended March 31, 2004 2003 (Unaudited) 2004Operating activities:(Loss) income before income taxes and minority interests ¥ (82,148) ¥ 4,081 ¥ (31,205) $ (782,361)Adjustments to reconcile (loss) income before income taxesand minority interests to net cash provided by operating activities:Depreciation and amortization 119,388 118,187 113,517 1,137,028(Gain) loss on sales of, and loss on revaluation of,short-term investments in securities and investmentsin securities, net (569) (2,551) 7,402 (5,419)
Loss (gain) on sales and disposal of property andequipment, net 17,846 17,603 (10,968) 169,961
Net provision for accrued pension and severance costs 19,459 17,223 847 185,323Interest and dividend income (2,928) (2,932) (3,814) (27,885)Interest expense 28,503 34,657 38,829 271,457Exchange loss (gain) 547 141 (483) 5,209Equity in (earnings) losses of affiliates (1,221) (340) 155 (11,628)(Increase) decrease in notes and accounts receivable (7,215) 31,761 (6,645) (68,714)Decrease (increase) in flight equipment spare parts 2,387 (2,812) 27 22,733Increase (decrease) in accounts payable 2,608 7,778 (7,126) 24,838Other 14,366 (29,111) (11,767) 136,819
Subtotal 111,023 193,686 88,769 1,057,361Interest and dividends received 3,386 3,427 4,026 32,247Interest paid (29,003) (34,709) (38,254) (276,219)Income taxes paid (9,060) (6,991) (14,646) (86,285)
Net cash provided by operating activities 76,345 155,413 39,896 727,095
Investing activities:Purchases of time deposits (1,092) (101) (1,372) (10,400)Proceeds from maturity of time deposits 996 1,877 3,498 9,485Purchases of property and equipment (151,585) (195,575) (118,882) (1,443,666)Proceeds from sales of property and equipment 57,285 62,043 43,665 545,571Purchases of investments in securities (974) (11,540) (2,218) (9,276)Proceeds from sales and maturity of investments insecurities 3,615 12,400 18,520 34,428
Proceeds from sales of consolidated subsidiaries resultingin change in scope of consolidation 103 683 1,511 980
Long-term loans receivable made (2,853) (4,937) (42,279) (27,171)Collection of long-term loans receivable 8,875 42,887 22,892 84,523Other 247 7,074 7,491 2,352
Net cash used in investing activities (85,382) (85,187) (67,172) (813,161)

35
Thousands ofU.S. dollars
Millions of yen (Note 2)
2002Pro forma
Years ended March 31, 2004 2003 (Unaudited) 2004Financing activities:
(Decrease) increase in short-term borrowings, net ¥ (9,976) ¥ (36,196) ¥ 1,802 $ (95,009)Proceeds from long-term loans 200,882 214,804 266,607 1,913,161Repayment of long-term loans (134,638) (199,550) (145,433) (1,282,266)Proceeds from issuance of bonds 29,815 — — 283,952Redemption of bonds (67,495) (83,864) (60,000) (642,809)Dividends paid to stockholders (7,813) (50) (7,089) (74,409)Dividends paid to minority interests (334) (266) (379) (3,180)Other (2,825) (2,979) (474) (26,904)
Net cash provided by (used in) financing activities 7,615 (108,103) 55,032 72,523
Effect of exchange rate changes on cash and cash equivalents (1,568) (670) 1,713 (14,933)Net (decrease) increase in cash and cash equivalents (2,991) (38,548) 29,469 (28,485)Cash and cash equivalents at beginning of year 146,318 185,399 151,150 1,393,504Increase in cash and cash equivalents resulting from inclusion of subsidiaries in consolidation — 176 1,030 —
Decrease in cash and cash equivalents resulting from exclusion of subsidiaries from consolidation — (708) — —
Cash and cash equivalents at end of year (Note 3) ¥ 143,327 ¥ 146,318 ¥ 181,651 $ 1,365,019
In order to enhance comparability, supplemental unaudited pro forma financial statements for the year ended 2002 are presented above.
The accompanying notes are an integral part of these consolidated statements.

36 Japan Airlines Corporation
Japan Airlines Corporation and Consolidated SubsidiariesJapan Airlines System Corporation, the holding company of the JAL group, was renamed Japan Airlines Corporation on June 26, 2004.
Notes to Consolidated Financial Statements
1. Summary of Significant Accounting Policies
a. Basis of presentationJapan Airlines System Corporation (the “Company”) and its consoli-
dated domestic subsidiaries maintain their accounting records and
prepare their financial statements in accordance with accounting
principles generally accepted in Japan, which are different in cer-
tain respects as to the application and disclosure requirements of
International Financial Reporting Standards, and its consolidated
foreign subsidiaries, in conformity with those of their countries of
domicile. The accompanying consolidated financial statements
have been compiled from the consolidated financial statements
filed with the Financial Services Agency as required by the
Securities and Exchange Law of Japan and include certain addi-
tional financial information for the convenience of readers outside
Japan.
The Company is a holding company established on October 2,
2002 by Japan Airlines Company, Ltd. (“JAL”) and Japan Air
System Co., Ltd. (“JAS”) by means of a transfer of shares in accor-
dance with the Commercial Code of Japan. In order to enhance
comparability, supplemental pro forma financial information for the
year ended March 31, 2002 has been presented. The pro forma
financial information for the year then ended, which is unaudited, is
presented as the aggregate of the respective consolidated financial
statements of JAL and JAS and also reflects reclassifications of
each companies’ consolidated financial statements to conform
these to the presentation in the consolidated financial statements
for the years ended March 31, 2004 and 2003.
On April 1, 2004, JAL and JAS were renamed Japan Airlines
International Co., Ltd. and Japan Airlines Domestic Co., Ltd.,
respectively. Furthermore, at a meeting of the stockholders of the
Company held on June 25, 2004, it was resolved to change the
Company’s name to Japan Airlines Corporation effective June 26,
2004.
As permitted by the Securities and Exchange Law of Japan,
amounts of less than one million yen have been omitted. As a
result, the totals shown in the accompanying consolidated financial
statements (both in yen and U.S. dollars) do not necessarily agree
with the sum of the individual amounts.
Certain amounts previously reported have been reclassified to
conform to the current year’s classification.
The accounting policies stated hereinafter are applicable only to
the consolidated financial statements of the Company and its con-
solidated subsidiaries for the years ended March 31, 2004 and
2003 and are not necessarily applicable to the unaudited pro forma
financial information for the year ended March 31, 2002.
b. Principles of consolidation and accounting for investmentsin unconsolidated subsidiaries and affiliates
The consolidated financial statements include the accounts of the
Company and all significant companies controlled directly or indi-
rectly by the Company. Companies over which the Company exer-
cises significant influence in terms of their operating and financial
policies have been included in the consolidated financial state-
ments on an equity basis.
The balance sheet date of 26 of the consolidated subsidiaries is
December 31, for 2004 (25 for 2003), and for 1 consolidated sub-
sidiary, it is the end of February. Any significant differences in inter-
company accounts and transactions arising from intervening
intercompany transactions during the period from January 1 through
March 31 and the period from March 1 through March 31 have been
adjusted, if necessary.
The differences between the cost and the fair value of the net
assets at the dates of acquisition of the consolidated subsidiaries and
companies accounted for by the equity method are amortized by the
straight-line method over a period of 5 years.
All significant intercompany accounts and transactions and unre-
alized gain or loss on intercompany accounts and transactions have
been eliminated.
As to accounting for business combinations, the pooling-of-interest
method and the purchase method are permitted under accounting
practices generally accepted in Japan. The business combination of
JAL and JAS has been accounted for by the pooling-of-interest
method. The operating results of the consolidated subsidiaries have
been included in the consolidated financial statements of operations
and cash flows from April 1, 2002, regardless of the date of establish-
ment of the Company. In addition, the beginning balances for 2003 in
the consolidated statement of stockholders’ equity have been pre-
sented assuming that the Company had existed as of April 1, 2002.
c. SecuritiesSecurities, except for investments in unconsolidated subsidiaries
and affiliates, are classified as trading securities, held-to-maturity
securities or other securities. Trading securities are carried at fair
value. Held-to-maturity securities are carried at amortized cost.
Marketable securities classified as other securities are carried at fair
value with any unrealized gain or loss reported as a separate com-
ponent of stockholders’ equity, net of taxes. Non-marketable securi-
ties classified as other securities are carried at cost. Cost of
securities sold is determined principally by the moving average
method.

37
d. DerivativesDerivatives positions are stated at fair value.
Gain or loss on derivatives designated as hedging instruments is
deferred until the loss or gain on the underlying hedged items is
recognized. Foreign receivables and payables are translated at the
applicable forward foreign exchange rates if certain conditions are
met. In addition, the related interest differential paid or received
under interest-rate swaps used as hedging instruments is recog-
nized over the terms of the swap agreements as an adjustment to
the interest expense of the underlying hedged items if certain con-
ditions are met.
e. Property and equipmentProperty and equipment is stated at cost except as indicated in the
following paragraph.
Under Japanese tax legislation, it is permitted to defer certain
capital gains, principally those arising from insurance claims, by
crediting them to the cost of certain properties. Deferred capital
gains at March 31, 2004 and 2003 amounted to ¥15,236 million
($145,105 thousand) and ¥13,227 million, respectively.
Depreciation of property and equipment is computed as follows:
Flight equipment:
Aircraft and spare engines:
Boeing 747 —principally the declining-balance (with the exception method based on their estimated of Boeing 747-400) useful lives
Boeing 747-400 —the straight-line method based ontheir estimated useful lives
Boeing 767 —principally the straight-line methodbased on their estimated useful lives
Boeing 777 —the straight-line method based ontheir estimated useful lives
Boeing 737 —the straight-line method based ontheir estimated useful lives
Douglas DC-10 —principally the declining-balancemethod based on their estimateduseful lives
Douglas MD-11 —the straight-line method based ontheir estimated useful lives
Douglas MD 90 —the straight-line method based ontheir estimated useful lives
Douglas MD 87 —the straight-line method based ontheir estimated useful lives
Douglas MD 81 —the straight-line method based ontheir estimated useful lives
Airbus A300 —the straight-line method based ontheir estimated useful lives
Airbus A300-600 —the straight-line method based ontheir estimated useful lives
Spare parts contained in flight equipment:
—principally the declining-balancemethod based on each aircraft’s orengine’s estimated useful life
Ground property and equipment:
—principally the straight-line methodbased on the estimated useful lives ofthe respective assets
The estimated useful lives are as follows:
Flight equipment from 8 to 27 years
Ground property and equipment from 2 to 65 years
f. SoftwareComputer software intended for internal use is amortized by the
straight-line method based on its estimated useful life which range
from 5 to 7 years.
g. Bond issuance expensesBond issuance expenses are capitalized and are being amortized
over a period of 3 years.
h. Accrued pension and severance costsTo provide for employees’ severance indemnities, net period pen-
sion cost, which represents the amount recognized as the cost of a
pension plan for the year, is accounted for based on the projected
benefit obligation and the plan assets.
The unrecognized obligation at transition is being amortized by
the straight-line method over a period of principally fifteen years.
The adjustment for actuarial assumptions is being amortized by
the straight-line method over a period ranging from 5 to 15 years,
which is less than the average remaining years of service of the
active participants in the plans. Amortization is computed from the
fiscal year subsequent to the year in which the adjustment was
recorded.
Past service cost is principally charged to income as incurred.
However, at certain subsidiaries, past service cost is being amor-
tized by the straight-line method over a period which is less than
the average remaining years of service of the active participants in
the plans.
i. Foreign currency accountsForeign currency receivables and payables are translated into yen
at the applicable year-end exchange rates and any gain or loss on
translation is included in current earnings.
Translation adjustments arising from the translation of assets,
liabilities, revenues and expenses of the consolidated subsidiaries
and affiliates accounted for by the equity method into yen at the
applicable year-end exchange rates are presented as minority inter-
ests and as a separate component of stockholders’ equity.
j. Revenue recognitionPassenger and cargo revenues are recognized when the transporta-
tion services are rendered.
k. LeasesAs lessee
Certain consolidated subsidiaries lease certain equipment under
noncancelable lease agreements referred to as capital leases.
Capital leases, defined as leases which do not transfer the owner-
ship of the leased property to the lessee, are principally accounted
for as operating leases.
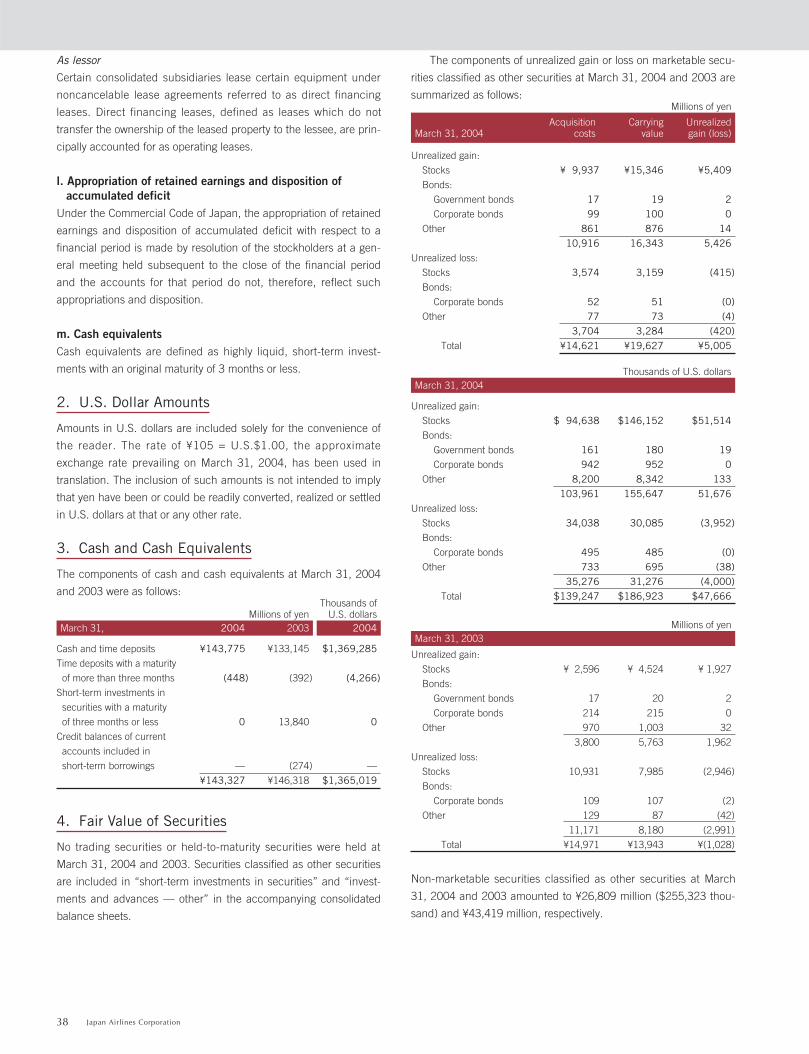
38 Japan Airlines Corporation
As lessor
Certain consolidated subsidiaries lease certain equipment under
noncancelable lease agreements referred to as direct financing
leases. Direct financing leases, defined as leases which do not
transfer the ownership of the leased property to the lessee, are prin-
cipally accounted for as operating leases.
l. Appropriation of retained earnings and disposition of accumulated deficit
Under the Commercial Code of Japan, the appropriation of retained
earnings and disposition of accumulated deficit with respect to a
financial period is made by resolution of the stockholders at a gen-
eral meeting held subsequent to the close of the financial period
and the accounts for that period do not, therefore, reflect such
appropriations and disposition.
m. Cash equivalentsCash equivalents are defined as highly liquid, short-term invest-
ments with an original maturity of 3 months or less.
2. U.S. Dollar Amounts
Amounts in U.S. dollars are included solely for the convenience of
the reader. The rate of ¥105 = U.S.$1.00, the approximate
exchange rate prevailing on March 31, 2004, has been used in
translation. The inclusion of such amounts is not intended to imply
that yen have been or could be readily converted, realized or settled
in U.S. dollars at that or any other rate.
3. Cash and Cash Equivalents
The components of cash and cash equivalents at March 31, 2004
and 2003 were as follows:Thousands of
Millions of yen U.S. dollars
Cash and time deposits ¥143,775 ¥133,145 $1,369,285Time deposits with a maturity
of more than three months (448) (392) (4,266)Short-term investments in
securities with a maturity
of three months or less 0 13,840 0Credit balances of current
accounts included in
short-term borrowings — (274) —¥143,327 ¥146,318 $1,365,019
4. Fair Value of Securities
No trading securities or held-to-maturity securities were held at
March 31, 2004 and 2003. Securities classified as other securities
are included in “short-term investments in securities” and “invest-
ments and advances — other” in the accompanying consolidated
balance sheets.
The components of unrealized gain or loss on marketable secu-
rities classified as other securities at March 31, 2004 and 2003 are
summarized as follows:Millions of yen
Unrealized gain:
Stocks ¥ 9,937 ¥15,346 ¥5,409Bonds:
Government bonds 17 19 2Corporate bonds 99 100 0
Other 861 876 1410,916 16,343 5,426
Unrealized loss:
Stocks 3,574 3,159 (415)Bonds:
Corporate bonds 52 51 (0)Other 77 73 (4)
3,704 3,284 (420)Total ¥14,621 ¥19,627 ¥5,005
Thousands of U.S. dollars
Unrealized gain:
Stocks $ 94,638 $146,152 $51,514Bonds:
Government bonds 161 180 19Corporate bonds 942 952 0
Other 8,200 8,342 133103,961 155,647 51,676
Unrealized loss:
Stocks 34,038 30,085 (3,952)Bonds:
Corporate bonds 495 485 (0)Other 733 695 (38)
35,276 31,276 (4,000)Total $139,247 $186,923 $47,666
Millions of yen
Unrealized gain:
Stocks ¥ 2,596 ¥ 4,524 ¥ 1,927
Bonds:
Government bonds 17 20 2
Corporate bonds 214 215 0
Other 970 1,003 32
3,800 5,763 1,962
Unrealized loss:
Stocks 10,931 7,985 (2,946)
Bonds:
Corporate bonds 109 107 (2)
Other 129 87 (42)
11,171 8,180 (2,991)
Total ¥14,971 ¥13,943 ¥(1,028)
Non-marketable securities classified as other securities at March
31, 2004 and 2003 amounted to ¥26,809 million ($255,323 thou-
sand) and ¥43,419 million, respectively.
March 31, 2003
March 31, 2004
Acquisition Carrying UnrealizedMarch 31, 2004 costs value gain (loss)
2004March 31, 2004 2003
39
Proceeds from sales of securities classified as other securities
amounted to ¥16,541 million ($157,533 thousand) and ¥5,255
million for the years ended March 31, 2004 and 2003, respectively,
and ¥17,964 million (unaudited) on a pro forma basis for the year
ended March 31, 2002. The aggregate gain realized on those sales
totaled ¥500 million ($4,761 thousand) and ¥3,853 million for the
years ended March 31, 2004 and 2003, respectively, and ¥12,614
million (unaudited) on a pro forma basis for the year ended March
31, 2002, and the aggregate loss realized on those sales totaled
¥19 million ($180 thousand) and ¥53 million for the years ended
March 31, 2004 and 2003, respectively, and ¥254 million (unau-
dited) on a pro forma basis for the year ended March 31, 2002.
The redemption schedule at March 31, 2004 for bonds with
maturity dates is summarized as follows:Millions of yen
Government bonds ¥ — ¥ 7Corporate bonds 100 20
Total ¥100 ¥27
Thousands of U.S. dollars
Government bonds $ — $ 66Corporate bonds 952 190
Total $952 $257
5. Short-Term Borrowings and Long-Term Debt
The weighted-average interest rates for short-term borrowings out-
standing at March 31, 2004 and 2003 were 1.2% and 1.8%,
respectively.
Long-term debt at March 31, 2004 and 2003 consisted of the
following:Thousands of
Millions of yen U.S. dollars
Bonds:
Bond in U.S. dollars,
due 2003, at 6.625% ¥ — ¥ 26,845 $ —Japanese yen bonds,
due 2003 to 2018, at
rates ranging from
1.5% to 3.4% 248,700 259,350 2,368,571Loans with collateral,
due 2003 to 2020, at
rates ranging from
0.24% to 7.91% 599,398 531,486 5,708,552Loans without collateral,
due 2003 to 2030, at rates
ranging from 0.06% to 6.6% 455,537 460,436 4,338,447Other 11,238 14,355 107,028
1,314,874 1,292,473 12,522,609Less current portion
of long-term debt (144,718) (198,188) (1,378,266)¥1,170,156 ¥1,094,285 $11,144,342
The aggregate annual maturities of long-term debt subsequent to
March 31, 2004 are summarized as follows:Thousands of
Millions of yen U.S. dollars
2005 ¥ 144,718 $ 1,378,266
2006 128,427 1,223,114
2007 144,913 1,380,123
2008 185,709 1,768,657
2009 and thereafter 711,105 6,772,428
¥1,314,874 $12,522,609
A summary of assets pledged as collateral at March 31, 2004 and
2003 is as follows:Thousands of
Millions of yen U.S. dollars
Flight equipment, net of
accumulated depreciation ¥557,141 ¥509,643 $5,306,104Flight equipment spare parts 53,286 — 507,485Investments in affiliates and
other securities 34,793 19,344 331,361Ground property and
equipment, net of
accumulated depreciation,
and other 237,028 250,754 2,257,409¥882,249 ¥779,741 $8,402,371
The effective interest rate on the bond in U.S. dollars, due 2003, at
6.625%, which resulted from hedging the bond with a currency
swap, was lower than the long-term prime rate in Japan at the
issuance date.
6. Accrued Pension and Severance Costs
An employee whose employment is terminated is entitled, in most
cases, to pension annuity payments or to a lump-sum severance
payment determined by reference to the basic rate of pay, length of
service and the conditions under which the termination occurs.
Certain significant domestic consolidated subsidiaries have
established contributory defined benefit pension plans pursuant to
the Welfare Pension Insurance Law of Japan, i.e., welfare pension
fund plans (WPFPs). Each WPFP consists of the governmental wel-
fare pension program (the substitutional portion) and an additional
non-contributory pension plan portion. In addition, certain consoli-
dated subsidiaries have maintained non-contributory defined pen-
sion plans and lump-sum severance indemnity plans.
2004March 31, 2004 2003
Year ending March 31,
2004March 31, 2004 2003
March 31, 2004
Due after oneDue in one year through
March 31, 2004 year or less five years
The projected benefit obligation and the funded status of the
plans are summarized as follows:Thousands of
Millions of yen U.S. dollars
Projected benefit obligation ¥(936,352) ¥(829,170) $(8,917,638)Plan assets 396,371 337,495 3,774,961Accrued pension and
severance costs 163,128 143,670 1,553,600Prepaid pension and
severance costs (647) (448) (6,161)Net unrecognized amount ¥(377,499) ¥(348,453) $(3,595,228)
In computing the projected benefit obligation, small companies are
permitted to adopt several simplified methods and certain sub-
sidiaries have done so.
The net unrecognized amounts were as follows:Thousands of
Millions of yen U.S. dollars
Unrecognized benefit
obligation at transition ¥(162,239) ¥(177,551) $(1,545,133)Adjustment for actuarial
assumptions (216,246) (172,417) (2,059,485)Past service cost 986 1,515 9,390Net unrecognized amounts ¥(377,499) ¥(348,453) $(3,595,228)
The substitutional portions of the WPFP benefits have been
included in the amounts shown in the above tables.
On August 13, 2003, a certain domestic subsidiary received
approval from the Minister of Health, Labor and Welfare with
respect to its application for exemption from the benefit obligation
related to future employee services under the substitutional portion
of the WPFP. In accordance with paragraph 47-2 of the “Practical
Guidelines on Retirement Benefits Accounting (Interim Report),”
Report No. 13 of the Accounting System Committee of the
Japanese Institute of Certified Public Accountants, this subsidiary
accounted for the separation of the substitutional portion of the
benefit obligation from the corporate portion of the benefit obliga-
tion under its WPFP as of the date of approval of the exemption,
assuming that the transfer to the Japanese Government of the sub-
stitutional portion of the benefit obligation and related portion of the
pension plan assets had been completed as of that date. As a
result, the subsidiary recognized a gain of ¥755 million ($7,190
thousand) for the year ended March 31, 2004. At March 31, 2004,
the pension plan assets to be transferred were calculated at ¥2,343
million ($22,314 thousand).
The components of net periodic pension and severance costs
excluding the employees’ contributory portion were as follows:Thousands of
Millions of yen U.S. dollars
Service cost ¥31,421 ¥31,169 ¥29,352 $299,247Interest cost on projected
benefit obligation 27,386 26,939 25,237 260,819Expected return on plan assets (15,987) (17,168) (18,240) (152,257)Amortization of unrecognized
severance benefit obligation
at transition 14,844 15,143 15,004 141,371Amortization of adjustment for
actuarial assumptions 12,554 8,765 4,719 119,561Amortization of past service
cost (126) (140) (5,185) (1,200)Net periodic pension and
severance costs ¥70,093 ¥64,709 ¥50,888 $667,552
Special additional termination benefits paid but not included in
determining the projected benefit obligation, are charged to income
when paid. The amounts charged to income amounted to ¥1,485
million ($14,142 thousand) and ¥1,176 million for the years ended
March 31, 2004 and 2003, respectively, and ¥1,730 million (unau-
dited) on a pro forma basis for the year ended March 31, 2002.
The assumptions used were as follows:
Discount rates 2.5% - 2.8% 2.5% - 3.5% 2.5% - 3.5%
Expected rates of return
on plan assets 0.0% - 5.5% 0.7% - 5.5% 1.2% - 6.3%
7. Income Taxes
During the year ended March 31, 2003, the Japanese consolidated
corporate tax return system went into effect, and applications to file
tax returns under the Japanese consolidated corporate tax return
system of the Company and certain domestic subsidiaries were
approved by the Japanese tax authorities. This new tax return sys-
tem allows companies to base their tax payments on the combined
profit or loss of a parent company and its wholly owned domestic
subsidiaries. Accordingly, effective the year ended March 31, 2004,
the Company and certain domestic subsidiaries have adopted the
Japanese consolidated corporate tax return system.
2002Pro forma
2004 2003 (Unaudited)
2004
2002Pro forma
Years ended March 31, 2004 2003 (Unaudited)
2004March 31, 2004 2003
2004March 31, 2004 2003
40 Japan Airlines Corporation
41
The significant components of deferred tax assets and liabilities
and the related valuation allowance at March 31, 2004 and 2003
were as follows:Thousands of
Millions of yen U.S. dollars
Deferred tax assets:
Accrued pension and
severance costs ¥ 53,683 ¥ 38,709 $ 511,266Revaluation loss on investments
in unconsolidated subsidiaries
and affiliates 14,483 14,536 137,933Accounts payable — trade 3,203 3,137 30,504Accrued bonuses 2,526 2,609 24,057Revaluation loss on flight
equipment spare parts 2,287 2,041 21,780Allowance for doubtful accounts 1,814 2,391 17,276Tax loss carryforwards 44,994 38,197 428,514Other 20,530 18,736 195,523
143,524 120,360 1,366,895Deferred tax liabilities:
Reserve for special
depreciation — (2,805) —Accumulated earnings of
consolidated subsidiaries
and affiliates (5,424) (4,058) (51,657)Net unrealized gain on
other securities (2,042) — (19,447)Other (3,910) (1,382) (37,238)
(11,377) (8,246) (108,352)Valuation allowance (73,992) (54,499) (704,685)
Net deferred tax assets ¥ 58,155 ¥ 57,614 $ 553,857
For the year ended March 31, 2004, a reconciliation between the
Japanese statutory tax rate and the Company’s and the consoli-
dated subsidiaries’ effective tax rate is not required to be disclosed
since the Company and the consolidated subsidiaries recorded a
loss before income taxes. The statutory tax rate for the year ended
March 31, 2004 was 43.9%.
A reconciliation between the Japanese statutory tax rate and the
Company’s and the consolidated subsidiaries’ effective tax rate for
the year ended March 31, 2003 is summarized as follows:
Statutory tax rate 42.1%
Disallowed expenses, including entertainment expenses 39.9
Non-taxable income, including dividends received (7.3)
Equity in earnings of unconsolidated subsidiaries
and affiliates (3.5)
Inhabitants’ per capita taxes 7.4
Change in valuation allowance (347.5)
Tax effect on undistributed earnings of
consolidated subsidiaries 53.7
Difference in tax rates of consolidated subsidiaries 10.2
Other (0.0)
Effective tax rate (205.0)%
At March 31, 2003, reflecting a change in the local tax rates, the
statutory tax rate utilized in estimating deferred tax assets and
liabilities has been applied as follows. The statutory tax rate effec-
tive for the year ended March 31, 2004, excluding a surcharge for
the consolidation tax return system, has been applied to the tempo-
rary differences expected to be deducted for tax purposes by the
end of March 2004, and the new rate has been applied to those to
be utilized after April 2004.
8. Stockholders’ Equity
The Commercial Code of Japan (the “Code”) provides that an
amount equal to at least 10% of the amount to be disbursed as dis-
tributions of earnings be appropriated to the legal reserve until the
sum of the reserve and the additional paid-in capital account,
which is included in capital surplus in the consolidated balance
sheets, equals 25% of the common stock account. The Code pro-
vides that neither additional paid-in capital nor the legal reserve is
available for dividends, but both may be used to reduce or elimi-
nate a deficit by resolution of the shareholders or may be trans-
ferred to common stock upon approval by the Board of Directors.
The Code further provides that if the total amount of additional
paid-in capital and the legal reserve exceeds 25% of the amount of
common stock, the excess may be distributed to the shareholders
either as a return of capital or as dividends subject to the approval
of the shareholders. The Company’s shares of common stock have
no par value in accordance with the Code.
9. Supplementary Cash Flow Information
The assets and liabilities of companies excluded from consolidation
following the sale of their stock were as follows:
Thousands ofMillions of yen U.S. dollars
Current assets ¥1,187 $11,304Fixed assets 7,140 68,000Current liabilities (8,218) (78,266)Noncurrent liabilities (1,346) (12,819)Minority interests 704 6,704Gain on investments in securities 473 4,504Increase in retained earnings
resulting from exclusion of
consolidated subsidiaries 170 1,619Proceeds from sales of stock 111 1,057Cash and cash equivalents
held by subsidiaries (7) (66)Net proceeds ¥ 103 $ 980
10. Leases
As lessee
The following pro forma amounts represent the acquisition costs,
accumulated depreciation and net book value of the leased prop-
erty at March 31, 2004 and 2003, and the related depreciation and
interest expense for the years ended March 31, 2004 and 2003
and on a pro forma basis for the year ended March 31, 2002,
which would have been reflected in the consolidated balance
sheets and the related consolidated statements of operations or in
2004Year ended March 31, 2004
Year ended March 31, 2003
2004March 31, 2004 2003
42 Japan Airlines Corporation
the pro forma information if capital lease accounting had been
applied to the capital leases currently accounted for as operating
leases:Millions of yen
Acquisition costs ¥499,349 ¥25,604 ¥524,953Less accumulated
depreciation (205,948) (10,940) (216,888)Net book value ¥293,400 ¥14,664 ¥308,064
Thousands of U.S. dollars
Acquisition costs $4,755,704 $243,847 $4,999,552Less accumulated
depreciation (1,961,409) (104,190) (2,065,600)Net book value $2,794,285 $139,657 $2,933,942
Millions of yen
Acquisition costs ¥460,044 ¥29,930 ¥489,974
Less accumulated
depreciation (223,865) (11,429) (235,294)
Net book value ¥236,179 ¥18,501 ¥254,680
Thousands of Millions of yen U.S. dollars
Depreciation expense ¥48,654 ¥47,376 ¥48,076 $463,371Interest expense ¥ 5,090 ¥ 5,871 ¥ 7,106 $ 48,476
Lease expenses relating to capital leases accounted for as operating
leases amounted to ¥55,537 million ($528,923 thousand) and
¥55,541 million for the years ended March 31, 2004 and 2003,
respectively, and ¥58,911 million (unaudited) on a pro forma basis
for the year ended March 31, 2002.
The present value of future rental expenses under capital leases
accounted for as operating leases outstanding at March 31, 2004
and 2003 were as follows:Thousands of
Millions of yen U.S. dollars
Within 1 year ¥ 47,332 ¥ 47,194 $ 450,780Over 1 year 268,508 217,939 2,557,219
¥315,840 ¥265,133 $3,008,000
Future rental expenses under operating leases outstanding at
March 31, 2004 and 2003 were as follows:Thousands of
Millions of yen U.S. dollars
Within 1 year ¥ 24,175 ¥ 20,083 $ 230,238Over 1 year 167,368 120,376 1,593,980
¥191,544 ¥140,459 $1,824,228
As lessor
The following amounts represent the acquisition costs, accumu-
lated depreciation and net book value of the financing leases
accounted for as operating leases at March 31, 2004 and 2003,
and the related depreciation expense and interest revenue for the
years ended March 31, 2004 and 2003 and on a pro forma basis
for the year ended March 31, 2002, which are reflected in the con-
solidated balance sheets and the related consolidated statements of
operations or in the unaudited pro forma information:Millions of yen
Acquisition costs ¥347 ¥2,559 ¥2,907Less accumulated depreciation (324) (1,702) (2,027)Net book value ¥ 23 ¥ 857 ¥ 880
Thousands of U.S. dollars
Acquisition costs $3,304 $24,371 $27,685Less accumulated depreciation (3,085) (16,209) (19,304)Net book value $ 219 $ 8,161 $ 8,380
Millions of yen
Acquisition costs ¥347 ¥3,033 ¥3,381
Less accumulated depreciation (289) (1,973) (2,263)
Net book value ¥ 58 ¥1,060 ¥1,118
Thousands of Millions of yen U.S. dollars
Depreciation expense ¥513 ¥624 ¥711 $4,885Interest revenue ¥ 51 ¥ 69 ¥ 80 $ 485
Lease revenues relating to direct financing leases accounted for as
operating leases amounted to ¥602 million ($5,733 thousand) and
¥739 million for the years ended March 31, 2004 and 2003, and
¥852 million (unaudited) on a pro forma basis for the year ended
March 31, 2002.
The present value of future rental revenues under direct financ-
ing leases accounted for as operating leases outstanding at March
31, 2004 and 2003 were as follows:Thousands of
Millions of yen U.S. dollars
Within 1 year ¥433 ¥ 492 $4,123Over 1 year 474 676 4,514
¥907 ¥1,169 $8,638
Future rental revenues under operating leases outstanding at
March 31, 2004 and 2003 are summarized as follows:Thousands of
Millions of yen U.S. dollars
Within 1 year ¥15 ¥ — $142Over 1 year 15 — 142
¥31 ¥ — $295
2004March 31, 2004 2003
2004March 31, 2004 2003
2004
2002Pro forma
Years ended March 31, 2004 2003 (Unaudited)
March 31, 2003
March 31, 2004
GroundFlight property and
March 31, 2004 equipment equipment Total
2004March 31, 2004 2003
2004March 31, 2004 2003
2004
2002Pro forma
Years ended March 31, 2004 2003 (Unaudited)
March 31, 2003
March 31, 2004
GroundFlight property and
March 31, 2004 equipment equipment Total

43
11. Commitments and Contingent Liabilities
Commitments outstanding at March 31, 2004 for the purchases of
significant property and equipment amounted to ¥433,235 million
($4,126,047 thousand).
Consolidated subsidiaries lease aircraft, office space, hotel facil-
ities, warehouses and office equipment. These leases are customar-
ily renewed upon expiration.
At March 31, 2004, contingent liabilities for guarantees, princi-
pally for unconsolidated subsidiaries, affiliates and employees,
amounted to ¥17,208 million ($163,885 thousand), and contingent
liabilities for commitments such as guarantees, keep-well agree-
ments and others, principally for unconsolidated subsidiaries, affili-
ates and employees, amounted to ¥1,994 million ($18,990
thousand).
A consolidated subsidiary provides a line-of-credit facility as a
part of its financing activities. The amounts provided, used and
unused, at March 31, 2004 were ¥910 million ($8,666 thousand),
¥110 million ($1,047 thousand) and ¥799 million ($7,609 thou-
sand), respectively.
12. Amounts Per Share
Basic net (loss) income per share has been computed based on the
net (loss) income allocable to or available for distribution to stock-
holders of common stock and the weighted-average number of
shares of common stock outstanding during each year. Diluted net
income per share has not been presented for the years ended
March 31, 2004 and 2003 since neither the Company nor any of
the consolidated subsidiaries had potentially dilutive shares of com-
mon stock to be issued March 31, 2004 and 2003.Yen U.S. dollars
Net (loss) income per
share of common stock ¥(45.19) ¥5.92 $(0.430)
The following table sets forth the computation of net (loss) income
per share of common stock for the years ended March 31, 2004
and 2003:
Thousands ofMillions of U.S. dollars,
yen, except except forfor shares shares
Net (loss) income (allocable)
available to shareholders of
common stock (numerator):
Net (loss) income ¥(88,619) ¥11,645 $(843,990)Less: appropriation of
bonuses to directors
and statutory auditors (42) (37) (400)¥(88,661) ¥11,608 $(844,390)
Weighted-average number of
shares of common stock
outstanding (denominator) 1,961,792,997 1,962,051,790 1,961,792,997
Net assets per share have been computed based on the net assets
available for distribution to stockholders of common stock and the
number of shares of common stock outstanding at each balance
sheet date.Yen U.S. dollars
Net assets per share ¥81.16 ¥129.66 $0.772
13. Segment Information
a. Business segment informationThe Company and its consolidated subsidiaries conduct worldwide
operations in air transportation, hotel and resort operations, travel
services, card and lease operations, trading and other airline-
related business. This segmentation has been determined for inter-
nal management purposes.
Until the year ended March 31, 2003, the business segment
information was presented in four major categories: the air trans-
portation segment, the travel segment, the hotel and resort opera-
tions segment and a segment entitled ‘other’ which included card
and lease operations, trading and other airline-related business.
Effective the year ended March 31, 2004, the Company has
revised its method of segmentation. The airline-related business,
which had been included in “Other” until the year ended March 31,
2003, has been presented as a new segment since, under the
Company’s current business strategies, it is a separate function of
the air transportation business. In addition, the hotel and resort
operations business, which had been presented as a separate seg-
ment until the year ended March 31, 2003, has been included in
“Other” for the year ended March 31, 2004 since its size has
decreased following a change in basic business strategy under
which it now operates its businesses under a system of administra-
tive contracts.
Based on the new segmentation, the Company has restated the
previously reported business segments for the year ended March
31, 2003.
2004March 31, 2004 2003
2004Years ended March 31, 2004 2003
2004Years ended March 31, 2004 2003
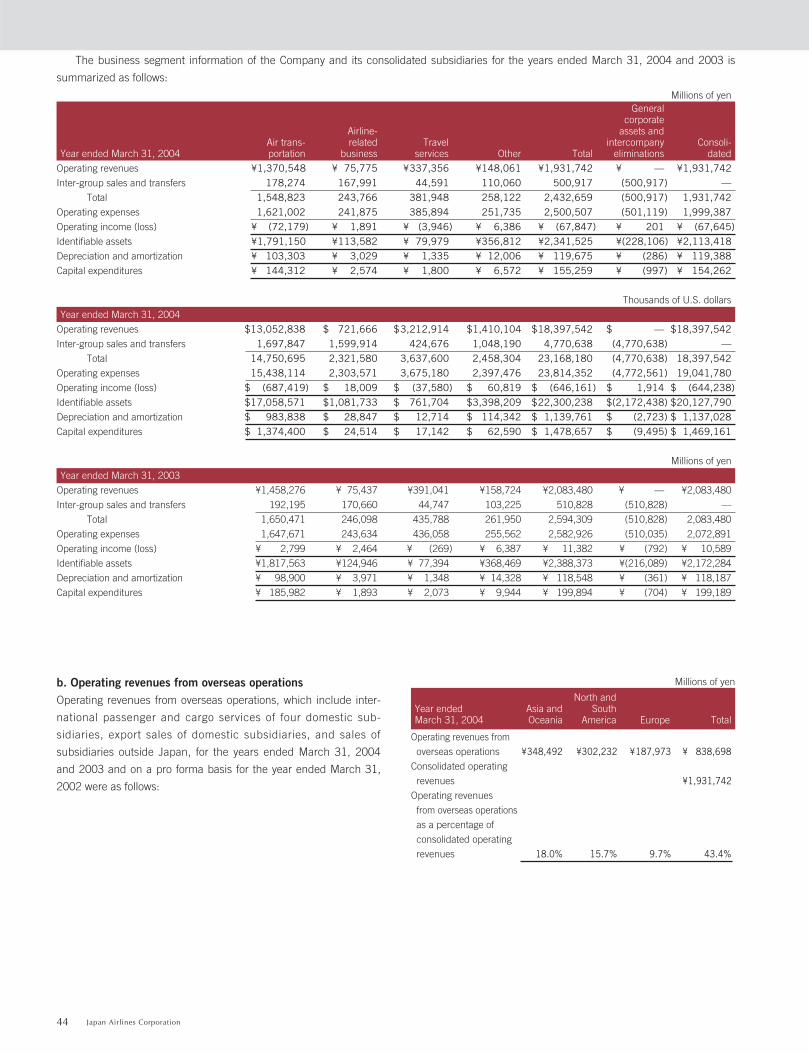
44 Japan Airlines Corporation
b. Operating revenues from overseas operationsOperating revenues from overseas operations, which include inter-
national passenger and cargo services of four domestic sub-
sidiaries, export sales of domestic subsidiaries, and sales of
subsidiaries outside Japan, for the years ended March 31, 2004
and 2003 and on a pro forma basis for the year ended March 31,
2002 were as follows:
Millions of yen
Operating revenues from
overseas operations ¥348,492 ¥302,232 ¥187,973 ¥ 838,698Consolidated operating
revenues ¥1,931,742Operating revenues
from overseas operations
as a percentage of
consolidated operating
revenues 18.0% 15.7% 9.7% 43.4%
North and Year ended Asia and South March 31, 2004 Oceania America Europe Total
The business segment information of the Company and its consolidated subsidiaries for the years ended March 31, 2004 and 2003 is
summarized as follows:
Millions of yenGeneral
corporate Airline- assets and
Air trans- related Travel intercompany Consoli-Year ended March 31, 2004 portation business services Other Total eliminations dated
Operating revenues ¥1,370,548 ¥ 75,775 ¥337,356 ¥148,061 ¥1,931,742 ¥ — ¥1,931,742Inter-group sales and transfers 178,274 167,991 44,591 110,060 500,917 (500,917) —
Total 1,548,823 243,766 381,948 258,122 2,432,659 (500,917) 1,931,742Operating expenses 1,621,002 241,875 385,894 251,735 2,500,507 (501,119) 1,999,387Operating income (loss) ¥ (72,179) ¥ 1,891 ¥ (3,946) ¥ 6,386 ¥ (67,847) ¥ 201 ¥ (67,645)Identifiable assets ¥1,791,150 ¥113,582 ¥ 79,979 ¥356,812 ¥2,341,525 ¥(228,106) ¥2,113,418Depreciation and amortization ¥ 103,303 ¥ 3,029 ¥ 1,335 ¥ 12,006 ¥ 119,675 ¥ (286) ¥ 119,388Capital expenditures ¥ 144,312 ¥ 2,574 ¥ 1,800 ¥ 6,572 ¥ 155,259 ¥ (997) ¥ 154,262
Thousands of U.S. dollars
Year ended March 31, 2004
Operating revenues $13,052,838 $ 721,666 $3,212,914 $1,410,104 $18,397,542 $ — $18,397,542Inter-group sales and transfers 1,697,847 1,599,914 424,676 1,048,190 4,770,638 (4,770,638) —
Total 14,750,695 2,321,580 3,637,600 2,458,304 23,168,180 (4,770,638) 18,397,542Operating expenses 15,438,114 2,303,571 3,675,180 2,397,476 23,814,352 (4,772,561) 19,041,780Operating income (loss) $ (687,419) $ 18,009 $ (37,580) $ 60,819 $ (646,161) $ 1,914 $ (644,238)Identifiable assets $17,058,571 $1,081,733 $ 761,704 $3,398,209 $22,300,238 $(2,172,438) $20,127,790Depreciation and amortization $ 983,838 $ 28,847 $ 12,714 $ 114,342 $ 1,139,761 $ (2,723) $ 1,137,028Capital expenditures $ 1,374,400 $ 24,514 $ 17,142 $ 62,590 $ 1,478,657 $ (9,495) $ 1,469,161
Millions of yen
Year ended March 31, 2003
Operating revenues ¥1,458,276 ¥ 75,437 ¥391,041 ¥158,724 ¥2,083,480 ¥ — ¥2,083,480
Inter-group sales and transfers 192,195 170,660 44,747 103,225 510,828 (510,828) —
Total 1,650,471 246,098 435,788 261,950 2,594,309 (510,828) 2,083,480
Operating expenses 1,647,671 243,634 436,058 255,562 2,582,926 (510,035) 2,072,891
Operating income (loss) ¥ 2,799 ¥ 2,464 ¥ (269) ¥ 6,387 ¥ 11,382 ¥ (792) ¥ 10,589
Identifiable assets ¥1,817,563 ¥124,946 ¥ 77,394 ¥368,469 ¥2,388,373 ¥(216,089) ¥2,172,284
Depreciation and amortization ¥ 98,900 ¥ 3,971 ¥ 1,348 ¥ 14,328 ¥ 118,548 ¥ (361) ¥ 118,187
Capital expenditures ¥ 185,982 ¥ 1,893 ¥ 2,073 ¥ 9,944 ¥ 199,894 ¥ (704) ¥ 199,189

45
Thousands of U.S. dollars
Operating revenues from
overseas operations $3,318,971 $2,878,400 $1,790,219 $ 7,987,600Consolidated operating
revenues $18,397,542Operating revenues from
overseas operations
as a percentage of
consolidated operating
revenues 18.0% 15.7% 9.7% 43.4%
Millions of yen
Operating revenues from
overseas operations ¥433,314 ¥325,409 ¥211,648 ¥ 970,372
Consolidated operating
revenues ¥2,083,480
Operating revenues
from overseas operations
as a percentage of
consolidated operating
revenues 20.8% 15.6% 10.2% 46.6%
Millions of yen
Operating revenues from
overseas operations ¥409,679 ¥303,197 ¥188,233 ¥ 901,110
Consolidated operating
revenues ¥2,029,481
Operating revenues from
overseas operations
as a percentage of
consolidated operating
revenues 20.2% 14.9% 9.3% 44.4%
c. Geographic informationTotal assets in Japan at March 31, 2004 and 2003 and operating
revenue from operations in Japan for the years then ended repre-
sented more than 90% of consolidated total assets and consoli-
dated operating revenues. As a result, geographic information is not
required to be disclosed in accordance with accounting principles
generally accepted in Japan.
14. Derivatives and Hedging Activities
Certain consolidated subsidiaries utilize forward foreign exchange
contracts, currency options, and currency swaps on a consistent
basis to hedge certain foreign currency transactions related to for-
eign purchase commitments, principally of flight equipment, and
foreign accounts receivable and payable. The Company and its
consolidated subsidiaries also utilize currency swaps, interest-rate
swaps and interest-rate options to minimize the impact of foreign
exchange and interest-rate movements related to their outstanding
debt on their operating results. Certain consolidated subsidiaries
also enter into a variety of swaps and options in their management
of risk exposure related to the commodity prices of fuel.
The Company and certain significant consolidated subsidiaries
enter into hedging transactions in accordance with the internal
guidelines and strategies established by management. The routine
operations of the department which is responsible for hedging
transactions are examined by other departments. Gain and loss on
hedging instruments and the assessment of hedge effectiveness,
which is performed both at the inception and on an ongoing basis,
are reported at meetings of the related department managers on a
timely basis. Certain other consolidated subsidiaries have adopted
procedures for hedging transactions which are more simplified than
those adopted by the Company.
15. Subsequent Events
a. Pursuant to a resolution of the Board of Directors at a meeting
held on January 21, 2004, Japan Asia Airways Co., Ltd. (“JAA”),
which was previously owned 90.5% by Japan Airl ines
International Co., Ltd. (formerly Japan Airlines Company, Ltd.), a
wholly-owned subsidiary of the Company, became a wholly-
owned subsidiary of the Company effective April 1, 2004 by way
of a share exchange (kabushiki-kohkan). The Company delivered
65,000,000 shares newly issued by the Company and
16,018,600 shares held as treasury stock (for a total of
81,018,600 shares) to the shareholders of JAA in exchange for
JAA’s shares. Consequently, the Company’s shares of common
stock in issue numbered 2,045,465,250.
As a result of this share exchange, the amount of common stock
remained unchanged, capital surplus increased by ¥5,069 million,
and common stock in treasury decreased by ¥4,474 million.
b. Pursuant to a resolution of the Board of Directors at a meeting
held on March 17, 2004, the Company issued zero coupon guar-
anteed convertible bonds due 2011 on April 5, 2004.
(1) Total amount of the bond issue: ¥100,000 million
(2) Coupon: zero
(3) Maturity date: March 25, 2011
(4) Shares to be issued upon conversion:
1) Type of shares: common stock
2) Number of shares to be issued: The number of shares to
be issued upon exercise of the stock acquisition rights is
equal to the face value of the bonds divided by the conver-
sion price.
(5) Initial conversion price: ¥440 per share which is subject,
under certain circumstances, to adjustment.
(6) Exercise period of stock acquisition rights: The stock acquisi-
tion rights granted under the terms of these bonds may be
exercised at any time during the period from, and inclusive
of, April 19, 2004 up to the close of business on March 11,
2011 at the location where the stock acquisition rights are
exercised.
c. Effective April 1, 2004, JAL Group has changed its business
structure. Under the new business structure, Japan Airlines
International Co., Ltd. is responsible for the international passen-
ger service and cargo service businesses, and Japan Airlines
Domestic Co., Ltd. (formerly Japan Air System Co., Ltd.) is
responsible for the domestic passenger service business.
Year ended March 31, 2002 Pro forma (Unaudited)
Year ended March 31, 2003
Year ended March 31, 2004

46 Japan Airlines Corporation
Report of Independent Auditors
The Board of DirectorsJapan Airlines System Corporation
We have audited the accompanying consolidated balance sheets of Japan Airlines System Corporation and consoli-dated subsidiaries as of March 31, 2004 and 2003, and the related consolidated statements of operations, stockhold-ers’ equity, and cash flows for the two years then ended, all expressed in yen. These financial statements are theresponsibility of the Company’s management. Our responsibility is to express an opinion on these financial statementsbased on our audits.
We conducted our audits in accordance with auditing standards generally accepted in Japan. Those standards requirethat we plan and perform the audit to obtain reasonable assurance about whether the financial statements are free ofmaterial misstatement. An audit includes examining, on a test basis, evidence supporting the amounts and disclosuresin the financial statements. An audit also includes assessing the accounting principles used and significant estimatesmade by management, as well as evaluating the overall financial statement presentation. We believe that our auditsprovide a reasonable basis for our opinion.
In our opinion, the consolidated financial statements referred to above present fairly, in all material respects, the con-solidated financial position of Japan Airlines System Corporation and consolidated subsidiaries at March 31, 2004 and2003, and the consolidated results of their operations and their cash flows for the two years then ended in conformitywith accounting principles generally accepted in Japan.
Supplemental Information1. As described in Note 13, effective the year ended March 31, 2004, the Company has revised its method of
segmentation.2. As described in Note 15 a., Japan Asia Airways Co., Ltd., which was previously owned 90.5% by Japan Airlines
International Co., Ltd. (formerly Japan Airlines Company, Ltd.), a wholly-owned subsidiary of the Company, becamea wholly-owned subsidiary of the Company effective April 1, 2004 by way of a share exchange (kabushiki-kohkan).
3. As described in Note 15 b., the Company issued zero coupon guaranteed convertible bonds due 2011 on April 5,2004.
4. As described in Note 15 c., effective April 1, 2004, the JAL Group has changed its business structure. Under thenew business structure, Japan Airlines International Co., Ltd. is responsible for the international passenger serviceand cargo service businesses, and Japan Airlines Domestic Co., Ltd. (formerly Japan Air System Co., Ltd.) is respon-sible for the domestic passenger service business.
The U.S. dollar amounts in the accompanying consolidated financial statements with respect to the year ended March31, 2004 are presented solely for convenience. Our audit also included the translation of yen amounts into U.S. dollaramounts and, in our opinion, such translation has been made on the basis described in Note 2.
June 25, 2004
As described in Note 1, the unaudited pro forma financial information for the year ended March 31, 2002 has beenpresented solely for convenience and is outside the scope of our audit.
Japan Airlines Corporation and Consolidated SubsidiariesJapan Airlines System Corporation, the holding company of the JAL group, was renamed Japan Airlines Corporation on June 26, 2004.
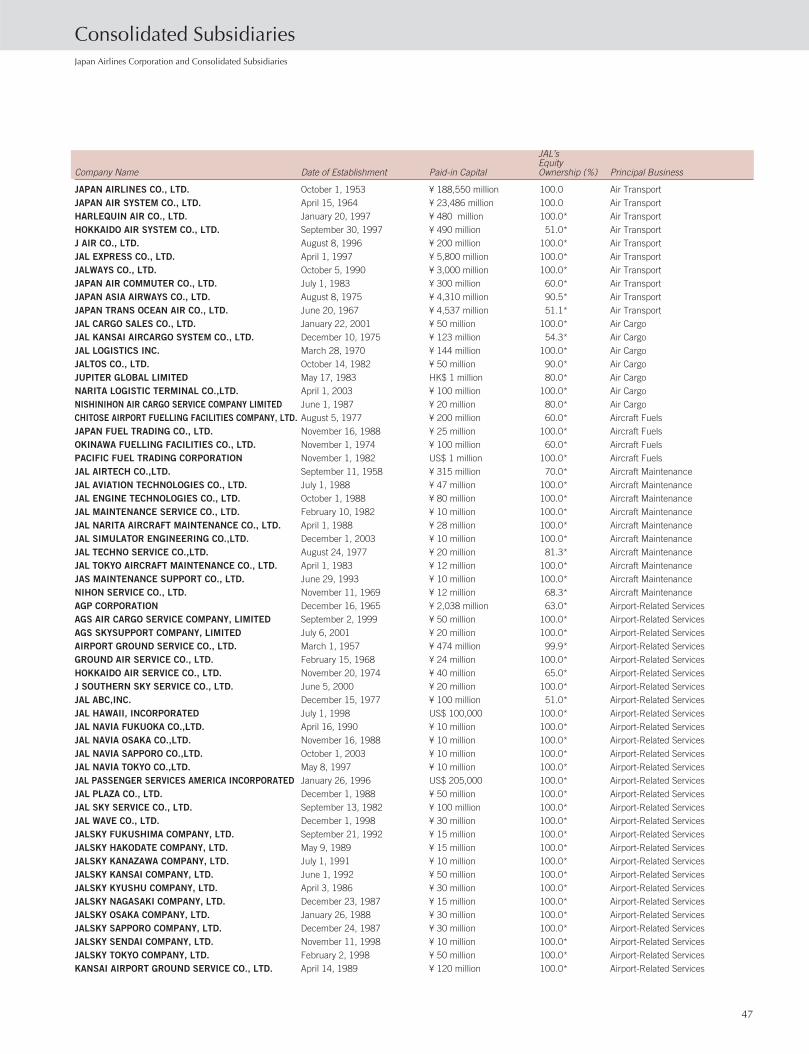
Consolidated Subsidiaries
47
Japan Airlines Corporation and Consolidated Subsidiaries
JAL’sEquity
Company Name Date of Establishment Paid-in Capital Ownership (%) Principal Business
JAPAN AIRLINES CO., LTD. October 1, 1953 ¥ 188,550 million 100.0 Air TransportJAPAN AIR SYSTEM CO., LTD. April 15, 1964 ¥ 23,486 million 100.0 Air TransportHARLEQUIN AIR CO., LTD. January 20, 1997 ¥ 480 million 100.0* Air TransportHOKKAIDO AIR SYSTEM CO., LTD. September 30, 1997 ¥ 490 million 51.0* Air TransportJ AIR CO., LTD. August 8, 1996 ¥ 200 million 100.0* Air TransportJAL EXPRESS CO., LTD. April 1, 1997 ¥ 5,800 million 100.0* Air TransportJALWAYS CO., LTD. October 5, 1990 ¥ 3,000 million 100.0* Air TransportJAPAN AIR COMMUTER CO., LTD. July 1, 1983 ¥ 300 million 60.0* Air TransportJAPAN ASIA AIRWAYS CO., LTD. August 8, 1975 ¥ 4,310 million 90.5* Air TransportJAPAN TRANS OCEAN AIR CO., LTD. June 20, 1967 ¥ 4,537 million 51.1* Air TransportJAL CARGO SALES CO., LTD. January 22, 2001 ¥ 50 million 100.0* Air CargoJAL KANSAI AIRCARGO SYSTEM CO., LTD. December 10, 1975 ¥ 123 million 54.3* Air CargoJAL LOGISTICS INC. March 28, 1970 ¥ 144 million 100.0* Air CargoJALTOS CO., LTD. October 14, 1982 ¥ 50 million 90.0* Air CargoJUPITER GLOBAL LIMITED May 17, 1983 HK$ 1 million 80.0* Air CargoNARITA LOGISTIC TERMINAL CO.,LTD. April 1, 2003 ¥ 100 million 100.0* Air CargoNISHINIHON AIR CARGO SERVICE COMPANY LIMITED June 1, 1987 ¥ 20 million 80.0* Air CargoCHITOSE AIRPORT FUELLING FACILITIES COMPANY, LTD. August 5, 1977 ¥ 200 million 60.0* Aircraft FuelsJAPAN FUEL TRADING CO., LTD. November 16, 1988 ¥ 25 million 100.0* Aircraft FuelsOKINAWA FUELLING FACILITIES CO., LTD. November 1, 1974 ¥ 100 million 60.0* Aircraft FuelsPACIFIC FUEL TRADING CORPORATION November 1, 1982 US$ 1 million 100.0* Aircraft FuelsJAL AIRTECH CO.,LTD. September 11, 1958 ¥ 315 million 70.0* Aircraft MaintenanceJAL AVIATION TECHNOLOGIES CO., LTD. July 1, 1988 ¥ 47 million 100.0* Aircraft MaintenanceJAL ENGINE TECHNOLOGIES CO., LTD. October 1, 1988 ¥ 80 million 100.0* Aircraft MaintenanceJAL MAINTENANCE SERVICE CO., LTD. February 10, 1982 ¥ 10 million 100.0* Aircraft MaintenanceJAL NARITA AIRCRAFT MAINTENANCE CO., LTD. April 1, 1988 ¥ 28 million 100.0* Aircraft MaintenanceJAL SIMULATOR ENGINEERING CO.,LTD. December 1, 2003 ¥ 10 million 100.0* Aircraft MaintenanceJAL TECHNO SERVICE CO.,LTD. August 24, 1977 ¥ 20 million 81.3* Aircraft MaintenanceJAL TOKYO AIRCRAFT MAINTENANCE CO., LTD. April 1, 1983 ¥ 12 million 100.0* Aircraft MaintenanceJAS MAINTENANCE SUPPORT CO., LTD. June 29, 1993 ¥ 10 million 100.0* Aircraft MaintenanceNIHON SERVICE CO., LTD. November 11, 1969 ¥ 12 million 68.3* Aircraft MaintenanceAGP CORPORATION December 16, 1965 ¥ 2,038 million 63.0* Airport-Related ServicesAGS AIR CARGO SERVICE COMPANY, LIMITED September 2, 1999 ¥ 50 million 100.0* Airport-Related ServicesAGS SKYSUPPORT COMPANY, LIMITED July 6, 2001 ¥ 20 million 100.0* Airport-Related ServicesAIRPORT GROUND SERVICE CO., LTD. March 1, 1957 ¥ 474 million 99.9* Airport-Related ServicesGROUND AIR SERVICE CO., LTD. February 15, 1968 ¥ 24 million 100.0* Airport-Related ServicesHOKKAIDO AIR SERVICE CO., LTD. November 20, 1974 ¥ 40 million 65.0* Airport-Related ServicesJ SOUTHERN SKY SERVICE CO., LTD. June 5, 2000 ¥ 20 million 100.0* Airport-Related ServicesJAL ABC,INC. December 15, 1977 ¥ 100 million 51.0* Airport-Related ServicesJAL HAWAII, INCORPORATED July 1, 1998 US$ 100,000 100.0* Airport-Related ServicesJAL NAVIA FUKUOKA CO.,LTD. April 16, 1990 ¥ 10 million 100.0* Airport-Related ServicesJAL NAVIA OSAKA CO.,LTD. November 16, 1988 ¥ 10 million 100.0* Airport-Related ServicesJAL NAVIA SAPPORO CO.,LTD. October 1, 2003 ¥ 10 million 100.0* Airport-Related ServicesJAL NAVIA TOKYO CO.,LTD. May 8, 1997 ¥ 10 million 100.0* Airport-Related ServicesJAL PASSENGER SERVICES AMERICA INCORPORATED January 26, 1996 US$ 205,000 100.0* Airport-Related ServicesJAL PLAZA CO., LTD. December 1, 1988 ¥ 50 million 100.0* Airport-Related ServicesJAL SKY SERVICE CO., LTD. September 13, 1982 ¥ 100 million 100.0* Airport-Related ServicesJAL WAVE CO., LTD. December 1, 1998 ¥ 30 million 100.0* Airport-Related ServicesJALSKY FUKUSHIMA COMPANY, LTD. September 21, 1992 ¥ 15 million 100.0* Airport-Related ServicesJALSKY HAKODATE COMPANY, LTD. May 9, 1989 ¥ 15 million 100.0* Airport-Related ServicesJALSKY KANAZAWA COMPANY, LTD. July 1, 1991 ¥ 10 million 100.0* Airport-Related ServicesJALSKY KANSAI COMPANY, LTD. June 1, 1992 ¥ 50 million 100.0* Airport-Related ServicesJALSKY KYUSHU COMPANY, LTD. April 3, 1986 ¥ 30 million 100.0* Airport-Related ServicesJALSKY NAGASAKI COMPANY, LTD. December 23, 1987 ¥ 15 million 100.0* Airport-Related ServicesJALSKY OSAKA COMPANY, LTD. January 26, 1988 ¥ 30 million 100.0* Airport-Related ServicesJALSKY SAPPORO COMPANY, LTD. December 24, 1987 ¥ 30 million 100.0* Airport-Related ServicesJALSKY SENDAI COMPANY, LTD. November 11, 1998 ¥ 10 million 100.0* Airport-Related ServicesJALSKY TOKYO COMPANY, LTD. February 2, 1998 ¥ 50 million 100.0* Airport-Related ServicesKANSAI AIRPORT GROUND SERVICE CO., LTD. April 14, 1989 ¥ 120 million 100.0* Airport-Related Services

48 Japan Airlines Corporation
NAGOYA INTERNATIONAL SERVICE CO., LTD. March 5, 1984 ¥ 30 million 51.0* Airport-Related ServicesNEW TOKYO SERVICE CO., LTD. August 24, 1974 ¥ 10 million 100.0* Airport-Related ServicesOKINAWA AIRPORT SERVICE CO., LTD. October 1, 1965 ¥ 33 million 100.0* Airport-Related ServicesSERVICE CREATION INC. December 25, 1989 ¥ 30 million 95.0* Airport-Related ServicesTOA AIR SERVICE CO., LTD. February 10, 1976 ¥ 25 million 100.0* Airport-Related ServicesINTERNATIONAL CATERING LTD. October 14, 1982 GBP 4 million 100.0* CateringINTERNATIONAL IN-FLIGHT CATERING CO., LTD. July 20, 1971 US$ 2 million 56.7* CateringJAL ROYAL CATERING CO., LTD. January 28, 1992 ¥ 2,000 million 51.0* CateringNARITA DRY ICE CO., LTD. August 25, 1981 ¥ 50 million 100.0* CateringNIHON FOOD SERVICE CO., LTD. April 5, 1973 ¥ 60 million 100.0* CateringNIKKO INFLIGHT CATERING CO., LTD. November 15, 1984 US$ 2 million 100.0* CateringTFK CORPORATION December 9, 1959 ¥ 497 million 50.7* CateringYAMATO SHOKUZAI CO., LTD. June 25, 1986 ¥ 50 million 100.0* CateringJAL ACADEMY CO., LTD. June 10, 1985 ¥ 240 million 100.0* Cultural Activities and PublishingJAL BRAND COMMUNICATIONS CO.,LTD. March 8, 2004 ¥ 100 million 100.0 Cultural Activities and PublishingJAL BUSINESS CO., LTD. November 8, 1979 ¥ 100 million 100.0* Cultural Activities and PublishingJAL CULTURAL DEVELOPMENT CO., LTD. August 1, 1988 ¥ 100 million 100.0 Cultural Activities and PublishingJAL LIVRE CO., LTD. October 1, 2002 ¥ 50 million 100.0 Cultural Activities and PublishingJAL PLANNING CO., LTD. March 1, 1985 ¥ 72 million 100.0* Cultural Activities and PublishingJAL SUNLIGHT CO., LTD. November 15, 1995 ¥ 20 million 100.0* Cultural Activities and PublishingOFFICIAL FILING CO., LTD. February 10, 1984 ¥ 10 million 89.0* Cultural Activities and PublishingJAL CAPITAL CO., LTD. July 25, 1988 ¥ 3,500 million 100.0 Financial ServicesJAL CAPITAL CORPORATION September 4, 1992 US$ 20 100.0* Financial ServicesJALCARD INC. October 30, 1984 ¥ 400 million 100.0* Financial ServicesJLC INSURANCE COMPANY LIMITED November 22, 2002 US$ 2 million 100.0* Financial ServicesASIA CREATIVE TOURS CO., LTD. October 14, 1975 ¥ 50 million 100.0* Hotel and Travel ServicesBENKAY (U.S.A.), INC. February 6, 1986 US$ 1,000 100.0* Hotel and Travel ServicesCHITOSE INTERNATIONAL HOTEL CO., LTD. April 13, 1978 ¥ 2,317 million 85.3* Hotel and Travel ServicesCREATIVE GREETING SERVICE, INC. October 1, 1991 US$ 10,000 100.0* Hotel and Travel ServicesCREATIVE REISE GMBH October 26, 1979 EUR 102,258 87.5* Hotel and Travel ServicesCREATIVE TOURS (EUROPE) B.V. November 1, 1979 EUR 907,560 100.0* Hotel and Travel ServicesCREATIVE TOURS (SINGAPORE) PTE. LTD. May 1, 1979 S$ 100,000 100.0* Hotel and Travel ServicesCREATIVE TOURS (SPAIN) S.A. September 21, 1982 EUR 180,303 100.0* Hotel and Travel ServicesCREATIVE TOURS DUSSELDORF GMBH April 1, 1991 EUR 127,822 100.0* Hotel and Travel ServicesCREATIVE TOURS LTD. September 14, 1973 GBP 96,627 100.0* Hotel and Travel ServicesEURO CREATIVE TOURS (UK) LTD. October 17, 1980 GBP 80,000 65.5* Hotel and Travel ServicesHAWAII HOTEL RESERVATION SYSTEM, INC. October 1, 1997 US$ 10,000 100.0* Hotel and Travel ServicesHOTEL NEW NIKKO DE PARIS S.A.S. June 5, 1996 EUR 1 million 100.0* Hotel and Travel ServicesHOTEL NIKKO (U.S.A.), INC. July 18, 1984 US$ 1,000 100.0* Hotel and Travel ServicesHOTEL NIKKO ANNUPURI November 5, 1984 ¥ 2,200 million 70.5* Hotel and Travel ServicesHOTEL NIKKO OF SAN FRANCISCO, INC. July 19, 1984 US$ 1,000 100.0* Hotel and Travel ServicesHOTEL NIKKO OSAKA CO., LTD. December 10, 1980 ¥ 100 million 100.0* Hotel and Travel ServicesHOTEL NIKKO SAIPAN, INC. September 26, 1984 US$ 21 million 87.0* Hotel and Travel ServicesJ INTER CO., LTD. February 7, 1997 ¥ 10 million 100.0* Hotel and Travel ServicesJ PRO CO., LTD. December 4, 1998 ¥ 30 million 100.0* Hotel and Travel ServicesJ SALES OKINAWA CO., LTD. July 5, 2000 ¥ 50 million 100.0* Hotel and Travel ServicesJAL HOTELS COMPANY LTD. July 1, 1970 ¥ 4,272 million 90.7* Hotel and Travel ServicesJAL SALES CO., LTD. November 22, 1999 ¥ 4,750 million 100.0 Hotel and Travel ServicesJAL TOURS CO., LTD. April 1, 1978 ¥ 80 million 80.5* Hotel and Travel ServicesJAL TRAVEL CO.,LTD. December 15, 1993 ¥ 460 million 100.0* Hotel and Travel ServicesJAL TRAVEL HOKKAIDO CO.,LTD. December 15, 1993 ¥ 250 million 100.0* Hotel and Travel ServicesJAL TRAVEL KYUSHU CO.,LTD. May 23, 1984 ¥ 200 million 100.0* Hotel and Travel ServicesJAL TRAVEL NAGASAKI CO.,LTD. April 1, 1977 ¥ 10 million 73.0* Hotel and Travel ServicesJAL TRAVEL WESTERN JAPAN CO.,LTD. November 18, 1994 ¥ 240 million 100.0* Hotel and Travel ServicesJALPAK CO., LTD. April 4, 1969 ¥ 900 million 78.4* Hotel and Travel ServicesJALPAK DE MEXICO S.A. DE C.V. April 1, 1987 MXN 2,273,639 100.0* Hotel and Travel ServicesJALPAK HOLDING U.S.A., INC. April 1, 1999 US$ 100 100.0* Hotel and Travel ServicesJALPAK INTERNATIONAL (THAILAND) CO., LTD. November 9, 2000 THB 6 million 100.0* Hotel and Travel ServicesJALPAK INTERNATIONAL AMERICA, INC. July 29, 1970 US$ 2 million 100.0* Hotel and Travel ServicesJALPAK INTERNATIONAL ASIA PTE LTD. February 4, 1997 S$ 100,000 100.0* Hotel and Travel ServicesJALPAK INTERNATIONAL HAWAII, INC. April 1, 1990 US$ 1 million 100.0* Hotel and Travel ServicesJALPAK INTERNATIONAL HONG KONG CO., LTD. May 31, 1974 HK$ 550,000 100.0* Hotel and Travel Services
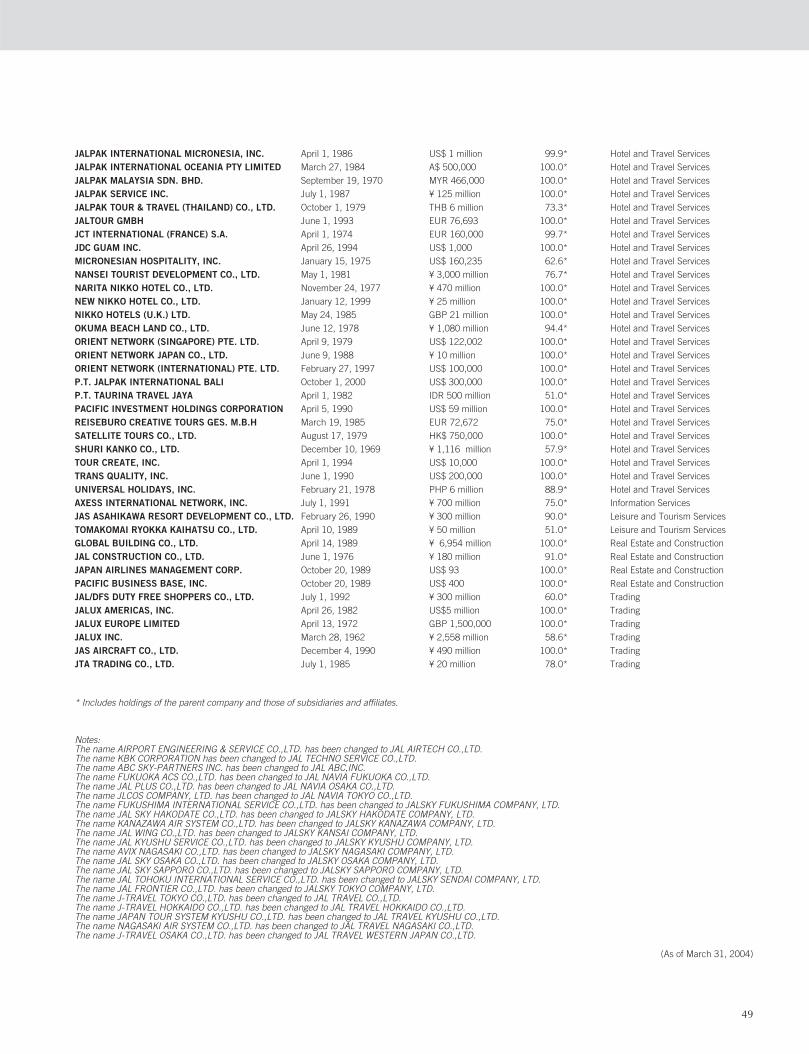
49
JALPAK INTERNATIONAL MICRONESIA, INC. April 1, 1986 US$ 1 million 99.9* Hotel and Travel ServicesJALPAK INTERNATIONAL OCEANIA PTY LIMITED March 27, 1984 A$ 500,000 100.0* Hotel and Travel ServicesJALPAK MALAYSIA SDN. BHD. September 19, 1970 MYR 466,000 100.0* Hotel and Travel ServicesJALPAK SERVICE INC. July 1, 1987 ¥ 125 million 100.0* Hotel and Travel ServicesJALPAK TOUR & TRAVEL (THAILAND) CO., LTD. October 1, 1979 THB 6 million 73.3* Hotel and Travel ServicesJALTOUR GMBH June 1, 1993 EUR 76,693 100.0* Hotel and Travel ServicesJCT INTERNATIONAL (FRANCE) S.A. April 1, 1974 EUR 160,000 99.7* Hotel and Travel ServicesJDC GUAM INC. April 26, 1994 US$ 1,000 100.0* Hotel and Travel ServicesMICRONESIAN HOSPITALITY, INC. January 15, 1975 US$ 160,235 62.6* Hotel and Travel ServicesNANSEI TOURIST DEVELOPMENT CO., LTD. May 1, 1981 ¥ 3,000 million 76.7* Hotel and Travel ServicesNARITA NIKKO HOTEL CO., LTD. November 24, 1977 ¥ 470 million 100.0* Hotel and Travel ServicesNEW NIKKO HOTEL CO., LTD. January 12, 1999 ¥ 25 million 100.0* Hotel and Travel ServicesNIKKO HOTELS (U.K.) LTD. May 24, 1985 GBP 21 million 100.0* Hotel and Travel ServicesOKUMA BEACH LAND CO., LTD. June 12, 1978 ¥ 1,080 million 94.4* Hotel and Travel ServicesORIENT NETWORK (SINGAPORE) PTE. LTD. April 9, 1979 US$ 122,002 100.0* Hotel and Travel ServicesORIENT NETWORK JAPAN CO., LTD. June 9, 1988 ¥ 10 million 100.0* Hotel and Travel ServicesORIENT NETWORK (INTERNATIONAL) PTE. LTD. February 27, 1997 US$ 100,000 100.0* Hotel and Travel ServicesP.T. JALPAK INTERNATIONAL BALI October 1, 2000 US$ 300,000 100.0* Hotel and Travel ServicesP.T. TAURINA TRAVEL JAYA April 1, 1982 IDR 500 million 51.0* Hotel and Travel ServicesPACIFIC INVESTMENT HOLDINGS CORPORATION April 5, 1990 US$ 59 million 100.0* Hotel and Travel ServicesREISEBURO CREATIVE TOURS GES. M.B.H March 19, 1985 EUR 72,672 75.0* Hotel and Travel ServicesSATELLITE TOURS CO., LTD. August 17, 1979 HK$ 750,000 100.0* Hotel and Travel ServicesSHURI KANKO CO., LTD. December 10, 1969 ¥ 1,116 million 57.9* Hotel and Travel ServicesTOUR CREATE, INC. April 1, 1994 US$ 10,000 100.0* Hotel and Travel ServicesTRANS QUALITY, INC. June 1, 1990 US$ 200,000 100.0* Hotel and Travel ServicesUNIVERSAL HOLIDAYS, INC. February 21, 1978 PHP 6 million 88.9* Hotel and Travel ServicesAXESS INTERNATIONAL NETWORK, INC. July 1, 1991 ¥ 700 million 75.0* Information ServicesJAS ASAHIKAWA RESORT DEVELOPMENT CO., LTD. February 26, 1990 ¥ 300 million 90.0* Leisure and Tourism ServicesTOMAKOMAI RYOKKA KAIHATSU CO., LTD. April 10, 1989 ¥ 50 million 51.0* Leisure and Tourism ServicesGLOBAL BUILDING CO., LTD. April 14, 1989 ¥ 6,954 million 100.0* Real Estate and ConstructionJAL CONSTRUCTION CO., LTD. June 1, 1976 ¥ 180 million 91.0* Real Estate and ConstructionJAPAN AIRLINES MANAGEMENT CORP. October 20, 1989 US$ 93 100.0* Real Estate and ConstructionPACIFIC BUSINESS BASE, INC. October 20, 1989 US$ 400 100.0* Real Estate and ConstructionJAL/DFS DUTY FREE SHOPPERS CO., LTD. July 1, 1992 ¥ 300 million 60.0* TradingJALUX AMERICAS, INC. April 26, 1982 US$5 million 100.0* TradingJALUX EUROPE LIMITED April 13, 1972 GBP 1,500,000 100.0* TradingJALUX INC. March 28, 1962 ¥ 2,558 million 58.6* TradingJAS AIRCRAFT CO., LTD. December 4, 1990 ¥ 490 million 100.0* TradingJTA TRADING CO., LTD. July 1, 1985 ¥ 20 million 78.0* Trading
* Includes holdings of the parent company and those of subsidiaries and affiliates.
Notes:The name AIRPORT ENGINEERING & SERVICE CO.,LTD. has been changed to JAL AIRTECH CO.,LTD. The name KBK CORPORATION has been changed to JAL TECHNO SERVICE CO.,LTD.The name ABC SKY-PARTNERS INC. has been changed to JAL ABC,INC. The name FUKUOKA ACS CO.,LTD. has been changed to JAL NAVIA FUKUOKA CO.,LTD.The name JAL PLUS CO.,LTD. has been changed to JAL NAVIA OSAKA CO.,LTD.The name JLCOS COMPANY, LTD. has been changed to JAL NAVIA TOKYO CO.,LTD.The name FUKUSHIMA INTERNATIONAL SERVICE CO.,LTD. has been changed to JALSKY FUKUSHIMA COMPANY, LTD.The name JAL SKY HAKODATE CO.,LTD. has been changed to JALSKY HAKODATE COMPANY, LTD.The name KANAZAWA AIR SYSTEM CO.,LTD. has been changed to JALSKY KANAZAWA COMPANY, LTD.The name JAL WING CO.,LTD. has been changed to JALSKY KANSAI COMPANY, LTD.The name JAL KYUSHU SERVICE CO.,LTD. has been changed to JALSKY KYUSHU COMPANY, LTD.The name AVIX NAGASAKI CO.,LTD. has been changed to JALSKY NAGASAKI COMPANY, LTD.The name JAL SKY OSAKA CO.,LTD. has been changed to JALSKY OSAKA COMPANY, LTD.The name JAL SKY SAPPORO CO.,LTD. has been changed to JALSKY SAPPORO COMPANY, LTD.The name JAL TOHOKU INTERNATIONAL SERVICE CO.,LTD. has been changed to JALSKY SENDAI COMPANY, LTD.The name JAL FRONTIER CO.,LTD. has been changed to JALSKY TOKYO COMPANY, LTD.The name J-TRAVEL TOKYO CO.,LTD. has been changed to JAL TRAVEL CO.,LTD.The name J-TRAVEL HOKKAIDO CO.,LTD. has been changed to JAL TRAVEL HOKKAIDO CO.,LTD.The name JAPAN TOUR SYSTEM KYUSHU CO.,LTD. has been changed to JAL TRAVEL KYUSHU CO.,LTD.The name NAGASAKI AIR SYSTEM CO.,LTD. has been changed to JAL TRAVEL NAGASAKI CO.,LTD.The name J-TRAVEL OSAKA CO.,LTD. has been changed to JAL TRAVEL WESTERN JAPAN CO.,LTD.
(As of March 31, 2004)
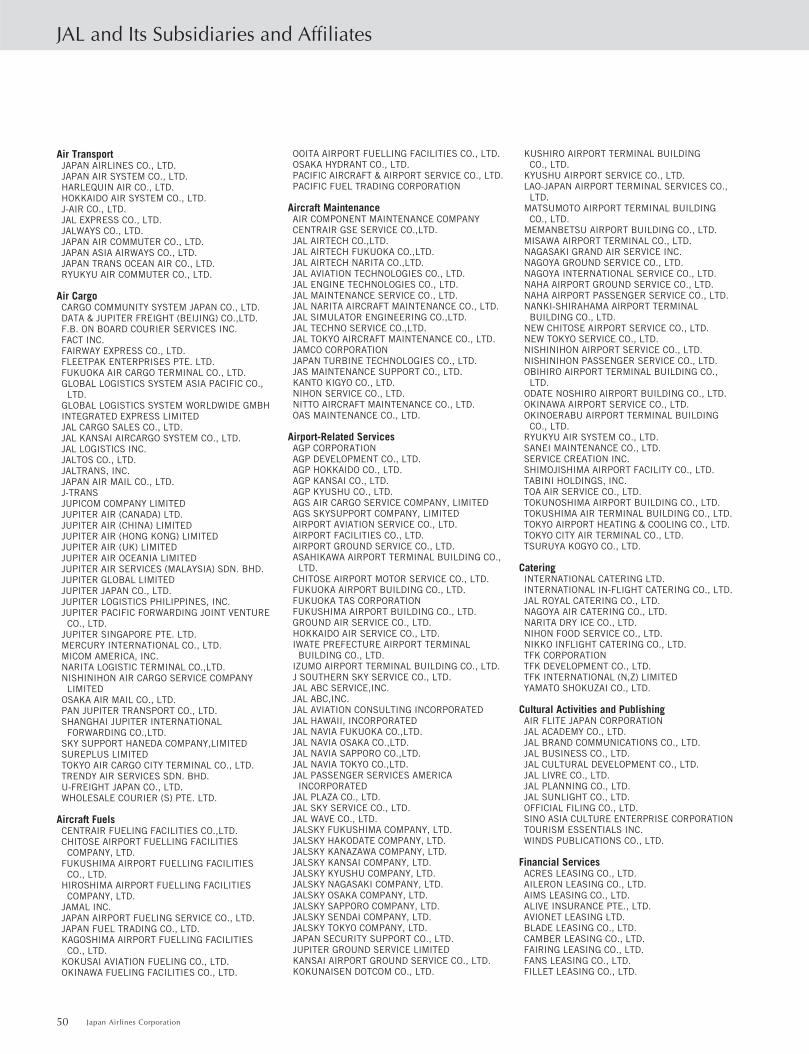
JAL and Its Subsidiaries and Affiliates
50 Japan Airlines Corporation
Air TransportJAPAN AIRLINES CO., LTD.JAPAN AIR SYSTEM CO., LTD.HARLEQUIN AIR CO., LTD.HOKKAIDO AIR SYSTEM CO., LTD.J-AIR CO., LTD.JAL EXPRESS CO., LTD.JALWAYS CO., LTD.JAPAN AIR COMMUTER CO., LTD.JAPAN ASIA AIRWAYS CO., LTD.JAPAN TRANS OCEAN AIR CO., LTD.RYUKYU AIR COMMUTER CO., LTD.
Air CargoCARGO COMMUNITY SYSTEM JAPAN CO., LTD.DATA & JUPITER FREIGHT (BEIJING) CO.,LTD.F.B. ON BOARD COURIER SERVICES INC.FACT INC.FAIRWAY EXPRESS CO., LTD.FLEETPAK ENTERPRISES PTE. LTD.FUKUOKA AIR CARGO TERMINAL CO., LTD.GLOBAL LOGISTICS SYSTEM ASIA PACIFIC CO.,
LTD.GLOBAL LOGISTICS SYSTEM WORLDWIDE GMBHINTEGRATED EXPRESS LIMITEDJAL CARGO SALES CO., LTD.JAL KANSAI AIRCARGO SYSTEM CO., LTD.JAL LOGISTICS INC.JALTOS CO., LTD.JALTRANS, INC.JAPAN AIR MAIL CO., LTD.J-TRANSJUPICOM COMPANY LIMITEDJUPITER AIR (CANADA) LTD.JUPITER AIR (CHINA) LIMITEDJUPITER AIR (HONG KONG) LIMITEDJUPITER AIR (UK) LIMITEDJUPITER AIR OCEANIA LIMITEDJUPITER AIR SERVICES (MALAYSIA) SDN. BHD.JUPITER GLOBAL LIMITEDJUPITER JAPAN CO., LTD.JUPITER LOGISTICS PHILIPPINES, INC.JUPITER PACIFIC FORWARDING JOINT VENTURE
CO., LTD.JUPITER SINGAPORE PTE. LTD.MERCURY INTERNATIONAL CO., LTD.MICOM AMERICA, INC.NARITA LOGISTIC TERMINAL CO.,LTD.NISHINIHON AIR CARGO SERVICE COMPANY
LIMITEDOSAKA AIR MAIL CO., LTD. PAN JUPITER TRANSPORT CO., LTD.SHANGHAI JUPITER INTERNATIONAL
FORWARDING CO.,LTD.SKY SUPPORT HANEDA COMPANY,LIMITEDSUREPLUS LIMITEDTOKYO AIR CARGO CITY TERMINAL CO., LTD.TRENDY AIR SERVICES SDN. BHD.U-FREIGHT JAPAN CO., LTD.WHOLESALE COURIER (S) PTE. LTD.
Aircraft FuelsCENTRAIR FUELING FACILITIES CO.,LTD.CHITOSE AIRPORT FUELLING FACILITIES
COMPANY, LTD.FUKUSHIMA AIRPORT FUELLING FACILITIES
CO., LTD.HIROSHIMA AIRPORT FUELLING FACILITIES
COMPANY, LTD.JAMAL INC.JAPAN AIRPORT FUELING SERVICE CO., LTD.JAPAN FUEL TRADING CO., LTD.KAGOSHIMA AIRPORT FUELLING FACILITIES
CO., LTD.KOKUSAI AVIATION FUELING CO., LTD.OKINAWA FUELING FACILITIES CO., LTD.
OOITA AIRPORT FUELLING FACILITIES CO., LTD.OSAKA HYDRANT CO., LTD.PACIFIC AIRCRAFT & AIRPORT SERVICE CO., LTD.PACIFIC FUEL TRADING CORPORATION
Aircraft MaintenanceAIR COMPONENT MAINTENANCE COMPANY CENTRAIR GSE SERVICE CO.,LTD.JAL AIRTECH CO.,LTD.JAL AIRTECH FUKUOKA CO.,LTD.JAL AIRTECH NARITA CO.,LTD.JAL AVIATION TECHNOLOGIES CO., LTD.JAL ENGINE TECHNOLOGIES CO., LTD.JAL MAINTENANCE SERVICE CO., LTD.JAL NARITA AIRCRAFT MAINTENANCE CO., LTD.JAL SIMULATOR ENGINEERING CO.,LTD.JAL TECHNO SERVICE CO.,LTD.JAL TOKYO AIRCRAFT MAINTENANCE CO., LTD.JAMCO CORPORATIONJAPAN TURBINE TECHNOLOGIES CO., LTD.JAS MAINTENANCE SUPPORT CO., LTD.KANTO KIGYO CO., LTD. NIHON SERVICE CO., LTD. NITTO AIRCRAFT MAINTENANCE CO., LTD.OAS MAINTENANCE CO., LTD.
Airport-Related ServicesAGP CORPORATIONAGP DEVELOPMENT CO., LTD.AGP HOKKAIDO CO., LTD.AGP KANSAI CO., LTD.AGP KYUSHU CO., LTD.AGS AIR CARGO SERVICE COMPANY, LIMITEDAGS SKYSUPPORT COMPANY, LIMITEDAIRPORT AVIATION SERVICE CO., LTD.AIRPORT FACILITIES CO., LTD.AIRPORT GROUND SERVICE CO., LTD.ASAHIKAWA AIRPORT TERMINAL BUILDING CO.,
LTD.CHITOSE AIRPORT MOTOR SERVICE CO., LTD.FUKUOKA AIRPORT BUILDING CO., LTD.FUKUOKA TAS CORPORATIONFUKUSHIMA AIRPORT BUILDING CO., LTD.GROUND AIR SERVICE CO., LTD.HOKKAIDO AIR SERVICE CO., LTD.IWATE PREFECTURE AIRPORT TERMINAL
BUILDING CO., LTD.IZUMO AIRPORT TERMINAL BUILDING CO., LTD.J SOUTHERN SKY SERVICE CO., LTD.JAL ABC SERVICE,INC.JAL ABC,INC.JAL AVIATION CONSULTING INCORPORATEDJAL HAWAII, INCORPORATEDJAL NAVIA FUKUOKA CO.,LTD.JAL NAVIA OSAKA CO.,LTD.JAL NAVIA SAPPORO CO.,LTD.JAL NAVIA TOKYO CO.,LTD.JAL PASSENGER SERVICES AMERICA
INCORPORATEDJAL PLAZA CO., LTD.JAL SKY SERVICE CO., LTD.JAL WAVE CO., LTD.JALSKY FUKUSHIMA COMPANY, LTD.JALSKY HAKODATE COMPANY, LTD.JALSKY KANAZAWA COMPANY, LTD.JALSKY KANSAI COMPANY, LTD.JALSKY KYUSHU COMPANY, LTD.JALSKY NAGASAKI COMPANY, LTD.JALSKY OSAKA COMPANY, LTD.JALSKY SAPPORO COMPANY, LTD.JALSKY SENDAI COMPANY, LTD.JALSKY TOKYO COMPANY, LTD.JAPAN SECURITY SUPPORT CO., LTD.JUPITER GROUND SERVICE LIMITEDKANSAI AIRPORT GROUND SERVICE CO., LTD.KOKUNAISEN DOTCOM CO., LTD.
KUSHIRO AIRPORT TERMINAL BUILDINGCO., LTD.
KYUSHU AIRPORT SERVICE CO., LTD.LAO-JAPAN AIRPORT TERMINAL SERVICES CO.,LTD.
MATSUMOTO AIRPORT TERMINAL BUILDINGCO., LTD.
MEMANBETSU AIRPORT BUILDING CO., LTD.MISAWA AIRPORT TERMINAL CO., LTD.NAGASAKI GRAND AIR SERVICE INC.NAGOYA GROUND SERVICE CO., LTD.NAGOYA INTERNATIONAL SERVICE CO., LTD.NAHA AIRPORT GROUND SERVICE CO., LTD.NAHA AIRPORT PASSENGER SERVICE CO., LTD.NANKI-SHIRAHAMA AIRPORT TERMINALBUILDING CO., LTD.
NEW CHITOSE AIRPORT SERVICE CO., LTD.NEW TOKYO SERVICE CO., LTD.NISHINIHON AIRPORT SERVICE CO., LTD.NISHINIHON PASSENGER SERVICE CO., LTD.OBIHIRO AIRPORT TERMINAL BUILDING CO., LTD.
ODATE NOSHIRO AIRPORT BUILDING CO., LTD.OKINAWA AIRPORT SERVICE CO., LTD.OKINOERABU AIRPORT TERMINAL BUILDING CO., LTD.
RYUKYU AIR SYSTEM CO., LTD.SANEI MAINTENANCE CO., LTD. SERVICE CREATION INC.SHIMOJISHIMA AIRPORT FACILITY CO., LTD.TABINI HOLDINGS, INC.TOA AIR SERVICE CO., LTD.TOKUNOSHIMA AIRPORT BUILDING CO., LTD.TOKUSHIMA AIR TERMINAL BUILDING CO., LTD.TOKYO AIRPORT HEATING & COOLING CO., LTD.TOKYO CITY AIR TERMINAL CO., LTD.TSURUYA KOGYO CO., LTD.
CateringINTERNATIONAL CATERING LTD.INTERNATIONAL IN-FLIGHT CATERING CO., LTD.JAL ROYAL CATERING CO., LTD.NAGOYA AIR CATERING CO., LTD.NARITA DRY ICE CO., LTD.NIHON FOOD SERVICE CO., LTD.NIKKO INFLIGHT CATERING CO., LTD.TFK CORPORATIONTFK DEVELOPMENT CO., LTD.TFK INTERNATIONAL (N,Z) LIMITEDYAMATO SHOKUZAI CO., LTD.
Cultural Activities and PublishingAIR FLITE JAPAN CORPORATIONJAL ACADEMY CO., LTD.JAL BRAND COMMUNICATIONS CO., LTD.JAL BUSINESS CO., LTD.JAL CULTURAL DEVELOPMENT CO., LTD.JAL LIVRE CO., LTD.JAL PLANNING CO., LTD.JAL SUNLIGHT CO., LTD.OFFICIAL FILING CO., LTD.SINO ASIA CULTURE ENTERPRISE CORPORATIONTOURISM ESSENTIALS INC.WINDS PUBLICATIONS CO., LTD.
Financial ServicesACRES LEASING CO., LTD.AILERON LEASING CO., LTD.AIMS LEASING CO., LTD.ALIVE INSURANCE PTE., LTD.AVIONET LEASING LTD.BLADE LEASING CO., LTD.CAMBER LEASING CO., LTD.FAIRING LEASING CO., LTD.FANS LEASING CO., LTD.FILLET LEASING CO., LTD.

51
FLAP LEASING CO., LTD.GEAR LEASING CO., LTD.HIGH SKY LEASING CO., LTD.HONEYCOMB LEASING CO., LTD.HORIZONTAL LEASING CO., LTD.JAL CAPITAL CO., LTD.JAL CAPITAL CORPORATIONJAL FSC LESSEE (CHI) COMPANY, LTD.JAL FSC LESSEE (NC) COMPANY, LTD.JAL FSC LESSEE (NC2) COMPANY, LTD.JAL FSC LESSEE (PB) COMPANY, LTD.JAL FSC LESSEE (PB2) COMPANY, LTD.JAL LEASING (NETHERLANDS) B.V.JALCARD INC.JET LINER LEASING CO., LTD.JF CARIB A.E.C.JL AIRCRAFT LEASING CO., LTD.JLC INSURANCE COMPANY LIMITEDJLMC AVIATION SERVICE CO., LTD.KEEL LEASING CO., LTD.LIFT LEASING CO., LTD.NACELLE LEASING CO., LTD.PITOT LEASING CO., LTD.PLY LEASING CO., LTD.PNEUMATIC LEASING CO., LTD.PULSEJET LEASING CO., LTD.PYLON LEASING CO., LTD.RAM JET LEASING CO., LTD.REDOME LEASING CO., LTD.RIB LEASING CO., LTD.RUDDER LEASING CO., LTD.SCRUM JET LEASING CO., LTD.SELCAL LEASING CO., LTD.SLAT LEASING CO., LTD.SPAR LEASING CO., LTD.SPINNER LEASING CO., LTD.STABILIZER LEASING CO., LTD.STAR JET LEASING CO., LTD.STATOR LEASING CO., LTD.STRINGER LEASING CO., LTD.SUBSONIC LEASING CO., LTD.TAB LEASING CO., LTD.TILLER LEASING CO., LTD.TOGA LEASING CO., LTD.TRANSPONDER LEASING CO., LTD.TRIM LEASING CO., LTD.TRIPLE A LIMITEDTWIN CRANE LEASING CO., LTD.WINGLET LEASING CO., LTD.
Hotel and Travel ServicesAIRPORT HOTEL MANAGEMENT CO., LTD.AMERASIA REPRESENTACIONES C.A.ASAHI RYOKOUKAI CO., LTD.ASIA CREATIVE TOURS CO., LTD.ASIA CREATIVE TOURS HONGKONG LTD.BENKAY (U.S.A.), INC.CARGO CREATIVE SERVICE CO., LTD.CHITOSE INTERNATIONAL HOTEL CO., LTD.CREATIVE GREETING SERVICE, INC.CREATIVE REISE GMBHCREATIVE TOURS (EUROPE) B.V.CREATIVE TOURS (SINGAPORE) PTE. LTD.CREATIVE TOURS (SPAIN) S.A.CREATIVE TOURS DUSSELDORF GMBHCREATIVE TOURS LTD.CREATIVE TRAVEL (TAIWAN) LTD.EURO CREATIVE TOURS (UK) LTD.HAWAII HOTEL RESERVATION SYSTEM, INC.HOKKAIDO TOUR SYSTEM CO., LTD.HOTEL NEW NIKKO DE PARIS S.A.S.HOTEL NIKKO (U.S.A.), INC.HOTEL NIKKO ANNUPURIHOTEL NIKKO OF SAN FRANCISCO, INC.HOTEL NIKKO OSAKA CO., LTD.HOTEL NIKKO SAIPAN, INC.
HOTELES NIKKO S.A. DE C.V.HUAYA DEVELOPMENT CO., LTD.IMPERIAL TRAVEL SERVICE CO., LTD.INCONTRA, INC.INDO JAPAN AIR SERVICES PVT. LTD.J INTER CO., LTD. *UNOFFICIALJ PRO CO., LTD.J SALES OKINAWA CO., LTD.JAL HOTELS COMPANY LTD.JAL HOTELS GMBH DUSSELDORFJAL SALES CO., LTD.JAL TOURS CO., LTD.JAL TRAVEL CO.,LTD.JAL TRAVEL EHIME CO.,LTD.JAL TRAVEL HOKKAIDO CO.,LTD.JAL TRAVEL KYUSHU CO.,LTD.JAL TRAVEL NAGASAKI CO.,LTD.JAL TRAVEL WESTERN JAPAN CO.,LTDJALPAK CO., LTD.JALPAK DE MEXICO S.A. DE C.V.JALPAK HOLDING U.S.A., INC.JALPAK INTERNATIONAL (CHINA) CO.,LTD.JALPAK INTERNATIONAL (THAILAND) CO., LTD.JALPAK INTERNATIONAL AMERICA, INC.JALPAK INTERNATIONAL ASIA PTE LTD.JALPAK INTERNATIONAL HAWAII, INC.JALPAK INTERNATIONAL HONG KONG CO., LTD.JALPAK INTERNATIONAL MICRONESIA, INC.JALPAK INTERNATIONAL OCEANIA PTY LIMITEDJALPAK MALAYSIA SDN. BHD.JALPAK SERVICE INC.JALPAK TOUR & TRAVEL (THAILAND) CO., LTD.JALTOUR GMBHJAPAN AIR SYSTEM HONG KONG CO., LTD.JAPAN COUPON SERVICE CO., LTD.JAPAN TOURS SYSTEM CO., LTD.JCT INTERNATIONAL (FRANCE) S.A.JDC (PACIFIC) LTD.JDC GUAM INC.JIMNA PTY LIMITEDJPI TOUR SERVICE, INC.HAKUSAN OGUCHI MANAGEMENT ASSOCIATIONMICRONESIAN HOSPITALITY, INC.MTJ DEVELOPMENT SDN. BHD.NANSEI TOURIST DEVELOPMENT CO., LTD.NARITA NIKKO HOTEL CO., LTD.NEW NIKKO HOTEL CO., LTD.NIKKO CREATIVE SERVICE S.A.NIKKO HOTEL MANAGEMENT (THAILAND) CO.,LTD.
NIKKO HOTELS (U.K.) LTD.OKUMA BEACH LAND CO., LTD.ORIENT NETWORK (SINGAPORE) PTE LTD.ORIENT NETWORK JAPAN CO., LTD.ORIENT NETWORK (INTERNATIONAL) PTE. LTD.P.T. JALPAK INTERNATIONAL BALIP.T. TAURINA TRAVEL JAYAPACIFIC AIR SERVICEPACIFIC INVESTMENT HOLDINGS CORPORATIONPARIS LIMOUSINE SERVICE S.A.R.L.REISEBURO CREATIVE TOURS GES. M.B.HSATELLITE TOURS CO., LTD.SHURI KANKO CO., LTD. STS ENTERPRISES, INC.SUN INTERNATIONAL TRAVEL, INC.SUN TRAVEL CO., LTD.TNN GUAM INC.TOKYO HUMANIA ENTERPRISE INC.TOUR CREATE, INC.TRANS QUALITY, INC.TROPICAL LAUNDRY AND LINEN SUPPLYCOMPANY, LTD.
UNIVERSAL HOLIDAYS, INC.VIEW WORLD COMPANY LIMITEDWING ON JAS NICEWING LTD.
Information ServicesAVICOM JAPAN CO., LTD.AVIONET (THAILAND) COMPANY LTD.AXESS INTERNATIONAL NETWORK, INC.E-MILENET LTD.JAL AVIONET ASIA LIMITEDJAL AVIONET EUROPE LIMITEDJAL AVIONET USAJAL INFORMATION TECHNOLOGY CO., LTD.JTA INFORMATION & COMMUNICATION CO., LTD.
Leisure and Tourism ServicesASIA WINDS DEVELOPMENT CO., LTD.HIROKAWA RESORT TOWN CO., LTD. JAS ASAHIKAWA RESORT DEVELOPMENTCO., LTD.
TOMAKOMAI RYOKKA KAIHATSU CO., LTD.
Limousine ServicesAIRPORT TRANSPORT SERVICE CO., LTD.AZUMA KOTSU CO., LTD. KANSAI AIRPORT TRANSPORTATION ENTERPRISEOSAKA AIRPORT TRANSPORT CO., LTD.SOUTHERN AIRPORT KOTSU CO., LTD.
Real Estate and ConstructionANTARES INTERNATIONAL LIMITEDBLANCO VENDE, LTD.GLOBAL BUILDING CO., LTD.JAL CONSTRUCTION CO., LTD.JAPAN AIRLINES MANAGEMENT CORP.KOKEN CO., LTD. NAHA GENERAL BUILDING SERVICE CO., LTD.PACIFIC BUSINESS BASE, INC.SHEEN CHART LIMITEDTERMINAL ONE MANAGEMENT INC.TOKYO FLIGHT KITCHEN RESTAURANTES LTDA.
TradingINTERNATIONAL AIRPORT CLEANING CO., LTD.JAL/DFS DUTY FREE SHOPPERS CO., LTD.JALUX AIRPORT, INC.JALUX AMERICAS, INC.JALUX ASIA LTD.JALUX EUROPE LIMITEDJALUX HAWAII, INC.JALUX INC.JAS AIRCRAFT (U.S.A.) CORP.JAS AIRCRAFT CO., LTD.JAS AIRCRAFT S.A.JAS TRADING HONG KONG LTD.JET FRESH THAILAND CO., LTD.JTA TRADING CO., LTD.KANTO TRADING CO., LTD.MARUYOSHI CO., LTD.NJS COMPANY, LTD.NORDIS CO., LTD.TOKYO BAY RESTAURANT CO., LTD. TOKYO KINAI YOHIN CO., LTD.TOKYO KOKU CLEANING CO., LTD.

Directory
52 Japan Airlines Corporation
Japan Airlines Corporation and Consolidated Subsidiaries
AMSTERDAMOffice Centre Bldg. 2nd FloorJozef Israelskade 48e1072 SB Amsterdam, THE NETHERLANDSPhone: 0205-829-488 (Reservations &
Information)
ANCHORAGE3830 International Airport Road, AnchorageInternational Airport, Anchorage, Alaska99502, U.S.A.Phone: 907-243-1551
ATLANTASwissport Bldg. D, Room 215, 4200 SouthCargo Drive, Atlanta, GA30337, U.S.A.Phone: 404-530-2225
AUCKLANDJalpak International Oceania Pty. Ltd.12th Floor, Westpac Tower,120 Albert Street,Auckland, NEW ZEALANDPhone: (09)3799-906
BANGKOKJAL Bldg., 254/1 Ratchadaphisek RoadHuaykwang, Bangkok, 10320, THAILANDPhone: (02)692-5151~62 (Reservations)
BEIJING1st Floor, Chang Fu Gong Office Bldg.,Jianguo Menwai Dajie,Beijing, P.R. of CHINAPhone: 800(810)5551 Japanese/Chinese
(Reservations & Information)800(810)5553 Cantonese/English(Reservations & Information)
BRISBANEJalpak International Oceania Pty. Ltd.Level 14, Waterfront Place 1 Eagle St.,Brisbane, QLD.4000, AUSTRALIAPhone: (07)3229-9916
BUSANKookje Bldg., #1602, 69, 6-KaJungang-Dong, Jung-Ku,Busan, KOREAPhone: (051)469-1215 (Reservations &
Ticketing)
CAIRO1, El Saleh Ayoub St., ZamalekCairo, EGYPTPhone: (02)738-1422
CHICAGOTerminal 5, Chicago O’HareInternational Airport,Chicago Illinois 60666, U.S.A.Phone: 1-800-525-3663 (Reservations)
DALIAN14th Floor Senmao Bldg.,147 Zhongshan Road,Xigang District, Dalian, P.R. of CHINAPhone: 800(810)5551 Japanese/Chinese
(Reservations & Information)800(810)5553 Cantonese/English(Reservations & Information)
DENPASARP.T. Kayanmas BaliJL. Bypass l Gusti Ngurah Rai 100X, Tuban,Denpasar 80030 Bali, INDONESIAPhone: (0361)757077, 764733
FRANKFURTRossmarkt 15,60311 Frankfurt/Main 1, GERMANYPhone: 01802228700 (Reservations &
Information)(069)13600 (Administration)
GUAMGuam International Airport,Guam, U.S.A.Phone: 642-6425~6 (Reservations &
Ticketing)
GUANGZHOUChina Hotel A-201, Liu Hua Lu, Guangzhou510015, P.R. of CHINAPhone: 800(810)5551 Japanese/Chinese
(Reservations & Information)800(810)5553 Cantonese/English(Reservations & Information)
HANGZHOU1st Floor, Sofitel Westlake Hangzhou, 333Westlake Avenue, Hangzhou 310002, P.R. ofCHINAPhone: 800(810)5551 Japanese/Chinese
(Reservations & Information)800(810)5553 Cantonese/English(Reservations & Information)
HANOIO.S.C. Travel (S.M.I Group) Co. Ltd.5th Floor, 63 Ly Thai To Bldg. 63 Ly Thai To St., Hanoi, VIETNAMPhone: (4)8266693
HO CHI MINH CITYO.S.C Travel (S.M.I Group) Co. Ltd.3rd Floor, Sheraton Saigon Hotel & Towers Ho Chi Minh City, 88 Dong Khoi St.Dist.1 Ho chi minh City, VIETNAMPhone: (8)8219098
HONG KONG30th Floor, Tower 6,The Gateway, Harbour City,9 Canton Road, Tsim Sha Tsui, Kowloon,Hong Kong S.A.R., P.R. of CHINAPhone: 2523-0081 Chinese/English
(Reservations & Information)
HONOLULUHonolulu International Airport,300 Rodgers Blvd.,Honolulu, Hawaii 96819, U.S.A.Phone: 1-800-525-3663, (808)521-1441
(Reservations)
JAKARTAKyoei Prince Building Ground Floor, JL.,Jenderal Sudirman, Kav. 3-4,Jakarta, 10220, INDONESIAPhone: (021)572-3211 (Reservations)
KAOHSIUNGJapan Asia AirwaysKaohsiung Chung-Cheng Bldg. 4F 2,Chung-Cheng 3rd., Kaohsiung, TaiwanPhone: 0800-065151
KONAKONA INTERNATIONAL AIRPORT AT KEAHOLEP.O. Box 3300, Kailua-Kona, Hawaii 96745U.S.A.Phone: 1-800-525-3663
KUALA LUMPURSuite 20·03 Level 20 Menara citibank 165Jalan Ampang, 50450 Kuala Lumpur,MALAYSIAPhone: (03)2161-1722~6 (Reservations)
KUNMINGWU JIA BA INTERNATIONAL AIRPORTPhone: 800(810)5551 Japanese/Chinese
(Reservations & Information)800(810)5553 Cantonese/English(Reservations & Information)
LAS VEGASMCCARRAN INTERNATIONAL AIRPORTP.O. Box 11185, Las Vegas, Nevada 89111-1185, U.S.A.Phone: 1-800-525-3663 (Reservations)
LONDONHanover Court, 5 Hanover Square,London W1S 1JR, U.K.Phone: (0845)7-747-700 (Reservations &
Information)
LOS ANGELES300 N. Continental Blvd., Suite 400,El Segundo CA 90245, U.S.A.Phone: 1-800-525-3663 (Reservations &
Ticketing)
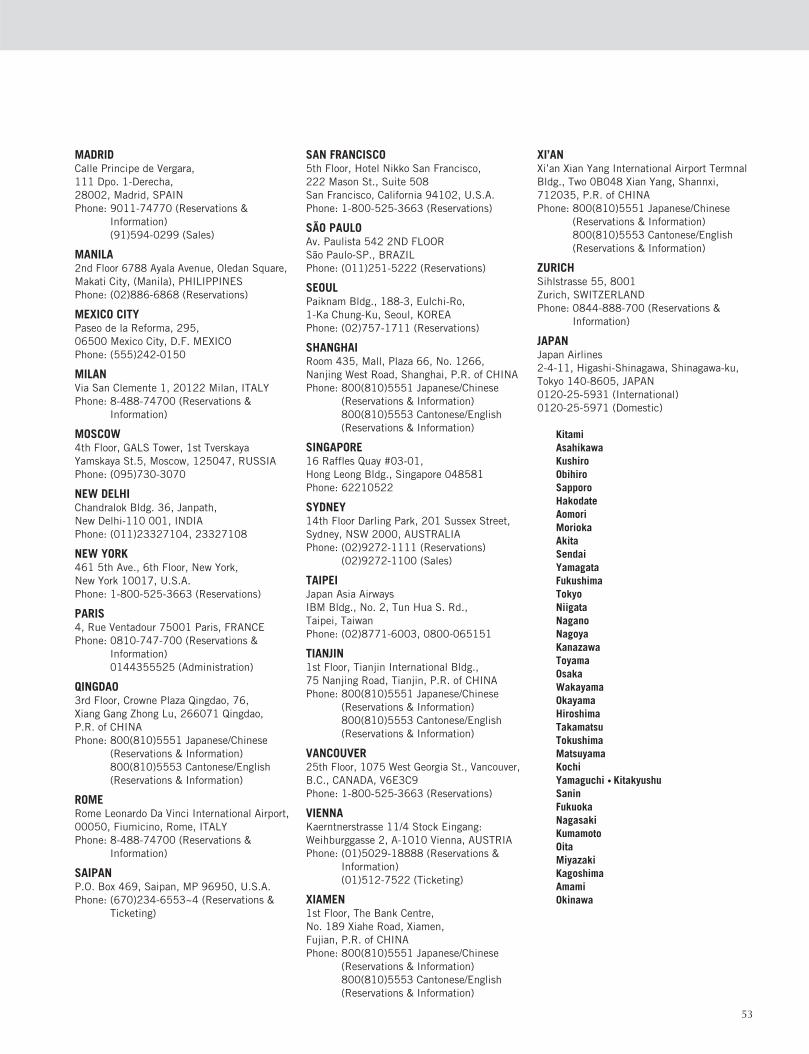
53
MADRIDCalle Principe de Vergara,111 Dpo. 1-Derecha,28002, Madrid, SPAINPhone: 9011-74770 (Reservations &
Information)(91)594-0299 (Sales)
MANILA2nd Floor 6788 Ayala Avenue, Oledan Square,Makati City, (Manila), PHILIPPINESPhone: (02)886-6868 (Reservations)
MEXICO CITYPaseo de la Reforma, 295,06500 Mexico City, D.F. MEXICOPhone: (555)242-0150
MILANVia San Clemente 1, 20122 Milan, ITALYPhone: 8-488-74700 (Reservations &
Information)
MOSCOW4th Floor, GALS Tower, 1st TverskayaYamskaya St.5, Moscow, 125047, RUSSIAPhone: (095)730-3070
NEW DELHIChandralok Bldg. 36, Janpath,New Delhi-110 001, INDIAPhone: (011)23327104, 23327108
NEW YORK461 5th Ave., 6th Floor, New York, New York 10017, U.S.A.Phone: 1-800-525-3663 (Reservations)
PARIS4, Rue Ventadour 75001 Paris, FRANCEPhone: 0810-747-700 (Reservations &
Information)0144355525 (Administration)
QINGDAO3rd Floor, Crowne Plaza Qingdao, 76, Xiang Gang Zhong Lu, 266071 Qingdao, P.R. of CHINAPhone: 800(810)5551 Japanese/Chinese
(Reservations & Information)800(810)5553 Cantonese/English(Reservations & Information)
ROMERome Leonardo Da Vinci International Airport,00050, Fiumicino, Rome, ITALYPhone: 8-488-74700 (Reservations &
Information)
SAIPANP.O. Box 469, Saipan, MP 96950, U.S.A.Phone: (670)234-6553~4 (Reservations &
Ticketing)
SAN FRANCISCO5th Floor, Hotel Nikko San Francisco,222 Mason St., Suite 508San Francisco, California 94102, U.S.A.Phone: 1-800-525-3663 (Reservations)
SÃO PAULOAv. Paulista 542 2ND FLOORSão Paulo-SP., BRAZILPhone: (011)251-5222 (Reservations)
SEOULPaiknam Bldg., 188-3, Eulchi-Ro,1-Ka Chung-Ku, Seoul, KOREAPhone: (02)757-1711 (Reservations)
SHANGHAIRoom 435, Mall, Plaza 66, No. 1266,Nanjing West Road, Shanghai, P.R. of CHINAPhone: 800(810)5551 Japanese/Chinese
(Reservations & Information)800(810)5553 Cantonese/English(Reservations & Information)
SINGAPORE16 Raffles Quay #03-01,Hong Leong Bldg., Singapore 048581Phone: 62210522
SYDNEY14th Floor Darling Park, 201 Sussex Street,Sydney, NSW 2000, AUSTRALIAPhone: (02)9272-1111 (Reservations)
(02)9272-1100 (Sales)
TAIPEIJapan Asia AirwaysIBM Bldg., No. 2, Tun Hua S. Rd.,Taipei, TaiwanPhone: (02)8771-6003, 0800-065151
TIANJIN1st Floor, Tianjin International Bldg.,75 Nanjing Road, Tianjin, P.R. of CHINAPhone: 800(810)5551 Japanese/Chinese
(Reservations & Information)800(810)5553 Cantonese/English(Reservations & Information)
VANCOUVER25th Floor, 1075 West Georgia St., Vancouver,B.C., CANADA, V6E3C9Phone: 1-800-525-3663 (Reservations)
VIENNAKaerntnerstrasse 11/4 Stock Eingang:Weihburggasse 2, A-1010 Vienna, AUSTRIAPhone: (01)5029-18888 (Reservations &
Information)(01)512-7522 (Ticketing)
XIAMEN1st Floor, The Bank Centre,No. 189 Xiahe Road, Xiamen,Fujian, P.R. of CHINAPhone: 800(810)5551 Japanese/Chinese
(Reservations & Information)800(810)5553 Cantonese/English(Reservations & Information)
XI’ANXi’an Xian Yang International Airport TermnalBldg., Two 0B048 Xian Yang, Shannxi,712035, P.R. of CHINAPhone: 800(810)5551 Japanese/Chinese
(Reservations & Information)800(810)5553 Cantonese/English(Reservations & Information)
ZURICHSihlstrasse 55, 8001Zurich, SWITZERLANDPhone: 0844-888-700 (Reservations &
Information)
JAPANJapan Airlines2-4-11, Higashi-Shinagawa, Shinagawa-ku,Tokyo 140-8605, JAPAN0120-25-5931 (International)0120-25-5971 (Domestic)
KitamiAsahikawaKushiroObihiroSapporoHakodateAomoriMoriokaAkitaSendaiYamagataFukushimaTokyoNiigataNaganoNagoyaKanazawaToyamaOsakaWakayamaOkayamaHiroshimaTakamatsuTokushimaMatsuyamaKochiYamaguchi • KitakyushuSaninFukuokaNagasakiKumamotoOitaMiyazakiKagoshimaAmamiOkinawa

JAL Group Route Network
Minneapolis
CancunMexico City
Guadalajara
Monterrey
Philadelphia
Montreal
Chicago
San Francisco
Vancouver
Anchorage
MinneapolisDetroit
Boston
TorontoNew York
WashingtonAtlanta
New Orleans
Orlando
Miami
San Jose
Los AngelesOrange County
(Santa Ana)
San DiegoPhoenix
Austin
Houston
San Antonio
Las Vegas
Ottawa
HonoluluKona(Kailua)
Denver
Durham
Charlotte
Pittsburgh
MoscowStockholm
Copenhagen
HamburgBerlin
London
Paris
Madrid Rome Istanbul
Barcelona
Amsterdam
MunichStuttgart
Frankfurt
MilanZurich
Duesseldorf
Rochester
Buffalo
ClevelandMemphis
Dallas
Oklahoma City
Columbus
DaytonCincinnati
San Juan
IndianapolisST. Louis
Nashville
Bloomington
Colorado Springs
As of July 31, 2004
Aero Mexico IberiaAir France Lufthansa Cargo AGAir New Zealand Northwest AirlinesAlitalia Qantas AirwaysAmerican Airlines Scandinavian Airlines SystemBritish Airways Singapore Airlines CargoCathay Pacific Airways Swiss International Air LinesChina Eastern Airlines Thai Airways InternationalChina Southern Airlines Turkish AirlinesEmirates Airline Vietnam Airlines
•Above cities include code-sharing destinations with these airline companies.
54 Japan Airlines Corporation
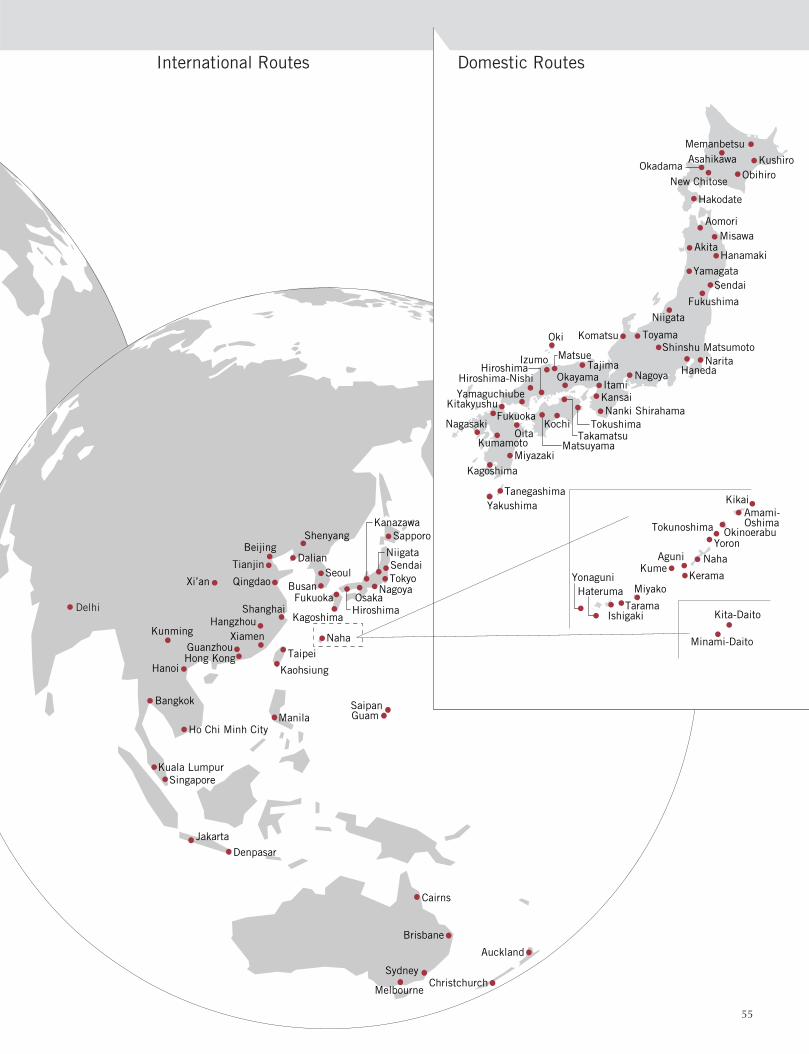
55
International Routes
Delhi
MemanbetsuAsahikawa
OkadamaNew Chitose
ObihiroKushiro
Hakodate
Akita
AomoriMisawa
HanamakiYamagata
Sendai
Fukushima
Niigata
Narita
TokyoSendai
Sapporo
NagoyaOsakaHiroshima
Fukuoka
Kagoshima
Naha
BusanSeoul
Dalian
ShenyangBeijing
Tianjin
QingdaoXi’an
Kunming
ShanghaiHangzhou
Taipei
Kaohsiung
Xiamen
Hong KongGuanzhou
Hanoi
Ho Chi Minh CityManila
Bangkok
SingaporeKuala Lumpur
Jakarta
Denpasar
SaipanGuam
Cairns
Brisbane
Sydney
Melbourne
Auckland
Christchurch
Haneda
ToyamaShinshu Matsumoto
Komatsu
TajimaNagoya
ItamiKansaiNanki Shirahama
Okayama
Oki
Izumo MatsueHiroshima
Hiroshima-NishiYamaguchiube
Kitakyushu
Kochi
MatsuyamaTakamatsu
Tokushima
MiyazakiKagoshima
TanegashimaYakushima
KumamotoOita
NagasakiFukuoka
Kita-Daito
Minami-Daito
Amami-
OkinoerabuOshima
Kikai
Yoron
Tokunoshima
Naha
Kerama
AguniKume
Miyako
TaramaIshigaki
HaterumaYonaguni
Niigata
Kanazawa
Domestic Routes

Board of Directors
56 Japan Airlines Corporation
Japan Airlines Corporation
Isao KANEKOJAL Group CEOChairmanChairman, CSR Committee
Toshiyuki SHINMACHIPresidentChairman, Flight safety committeeChairman, Corporate compliance &business risk management committee
Hidekazu NISHIZUKAExecutive Vice PresidentSenior Vice President, General ManagerCorporate Management
Senior Vice President, Human Resources PlanningSenior Vice President, Corporate Compliance
Takenori MATSUMOTOSenior Managing DirectorSenior Vice President, Corporate SafetySenior Vice President, Purchasing
Nobuyoshi SERASenior Vice President, General Manager, Finance
Senior Vice President, General ManagerInvestor Relations
Senior Vice President, Public Relations
Fumio TSUCHIYASenior Vice President, Deputy General Manager Corporate Management
Senior Vice President, Brand ManagementSenior Vice President, CSR committee
Mitsuo KOMATSUBARASenior Vice President
Katsuo HANEDASenior Vice President
Toshiki OKAZAKISenior Vice President
Shunji KONOSenior Vice President
Ken MOROISenior Vice President
Shinobu SHIMIZUSenior Vice President
Satoshi ENDOSenior Executive Officer, Environmental AffairsSenior Executive Officer, IT Strategy and PlanningChairman, Environmental Affairs CSR committee
Sumio YASUNAGASenior Executive Officer, General ManagerCorporate Affairs
Hideyuki KANENARISenior Executive Officer, Marketing Strategy & Research
Senior Executive Officer, Corporate AffairsSenior Executive Officer, Corporate Management
Haruka NISHIMATSUExecutive Officer, FinanceExecutive Officer, Investor Relations
Kimio HIROIKEExecutive Officer, Associated Business
MEMBER OF THE BOARD OF DIRECTORSAssignments as of June 25, 2004
Yasunaka FURUKAWASenior Corporate Auditor of the Board
Toshiyuki SAKAISenior Corporate Auditor of the Board
Shigeo MATSUICorporate Auditor of the Board
Seiso NEOCorporate Auditor of the Board
Yoshihisa AKIYAMACorporate Auditor of the Board
Masao NISHIMURACorporate Auditor of the Board
AUDITORSAssignments as of June 25, 2004
EXECUTIVE OFFICERSAssignments as of June 25, 2004

Company Name: Japan Airlines Corporation(Japan Airlines Group Holding Company)
* Japan Airlines System Corporation, the holding company of the JAL group, was renamed Japan Airlines Corporation on June 26, 2004.
Date of Foundation: October 2, 2002Head Office: 2-4-11, Higashi-shinagawa, Shinagawa-ku, Tokyo 140-8605, Japan
Phone: 81-3-5769-6097 Fax: 81-3-5769-6492Paid-in Capital: ¥100,000,000,000Number of Shares:Authorized 7,000,000,000 sharesIssued 1,980,465,250 shares
** Number of shares issued and outstanding came to 2,045,465,250 as of April 1, 2004 as a result of a share exchange with its subsidiary Japan Asia Airways.
Floating Stock: 35.97%Number of Shareholders: 278,295 including 436 non-JapaneseMajor Shareholders: Number of Shares Held/Name Ratio of shareholding Tokyu Corporation 80,397,171/4.05Eitaro Itoyama 70,000,000/3.53The Master Trust Bank of Japan, Ltd. (trust account) 66,752,000/3.37Japan Trustee Services Bank, Ltd. (trust account) 54,744,000/2.76Mizuho Corporate Bank, Ltd. 53,603,486/2.70The Tokyo Fire & Marine Insurance Co., Ltd. 52,390,939/2.64Nissay Dowa General Insurance Co., Ltd. 44,960,253/2.27Nippon Life Insurance Company 41,392,227/2.09Fukoku Mutual Life Insurance Company 39,365,000/2.00JAL Group Employees’ Stockholding 35,975,411/1.81
Stock Listings: Tokyo, Osaka, and Nagoya stock exchanges; American Depositary Receipts tradedthrough the OTC (U.S.A.)
Fiscal Year-End: March 31General Meeting of Stockholders: JuneStock Transfer Agent: UFJ Trust Bank, LimitedShare Handling Office: 10-11, Higashi-Suna 7-chome, Koto-ku, Tokyo 137-8081, JapanDate for Confirmation of Stock Ownership: March 31Statutory Minimum Equity Interest Unit: 1,000Media for Public Notices: Nihon Keizai Shimbun issued in Tokyo area and our website (http://www.jal.jp/en/ir/index_report.html)Auditor: Shin Nihon & Co.
(As of March 31, 2004)
(**)
(*)
Investor Information
57
Japan Airlines Corporation(Japan Airlines Group Holding Company)
2-4-11, Higashi-shinagawa, Shinagawa-ku,Tokyo 140-8605, JapanURL: http://www.jal.jp
Printend in JapanPrinted on recycled paper
Recommended