JOINT DESIGN FOR
REINFORCED CONCRETE BUILDINGS
by
Michael J. P~ei~~er
David Darwin
A Report on Research Sponsored by
The University o~ Kansas
Structural Engineering and Materials Laboratory
UNIVERSITY OF KANSAS
LAWRENCE, KANSAS
December 1987
ii
Abstract
JOINT DESIGN FOR
REINFORCED CONCRETE BUILDINGS
This report discusses construction, contraction and expansion joints in
reinforced concrete buildings. The report addresses the purpose of each
type of joint and emphasizes the selection of joint locations and joint
spacings. Some aspects of joint configuration and construction are also
covered. Empirical and analytical design techniques are presented.
iii
Acknowledgements
This report is based on a project report submitted by Michael J.
Pfeiffer to the Civil Engineering Department of the University of Kansas in
partial fulfillment of the requirements for the MSCE degree.
Support for publication of the report is provided by the University of
Kansas Structural Engineering and Materials Laboratory and the Department of
Civil Engineering.
ABSTRACT . • • •
ACKNOWLEDGEMENTS
LIST OF TABLES •
LIST OF FIGURES.
INTRODUCTION
THE NEED FOR JOINTS.
CONSTRUCTION JOINTS.
Joint Construction.
Joint Location.
Summary ••.
CONTRACTION JOINTS
Joint Configuration
Joint Location.
EXPANSION JOINTS .•
iv
Table or Contents
Single Story Buildings: Martin and Acosta
Single and Multi-Story Buildings: Varyani and Radhaji
Page
11
iii
v
vi
2
4
5
6
9
9
10
10
11
13
18
Single and Multi-Story Buildings: National Academy of Sciences 24
REFERENCES. 30
TABLES. 33
FIGURES
APPENDIX A - NOTATION
APPENDIX B - EXPANSION JOINT EXAMPLES
Example 1: Single Story-Multi Bay Building.
Example 2: Multi Story-Multi Bay Building .
45
53
55
55
65
v
LIST OF TABLES
Table Contraction joint spacings . .. . . . . . .. . . Table 2 - Contraction joint spacings for sanitary
engineering structures based on reinforcement
Page
• 33
percentage (Rice 1984) . 33
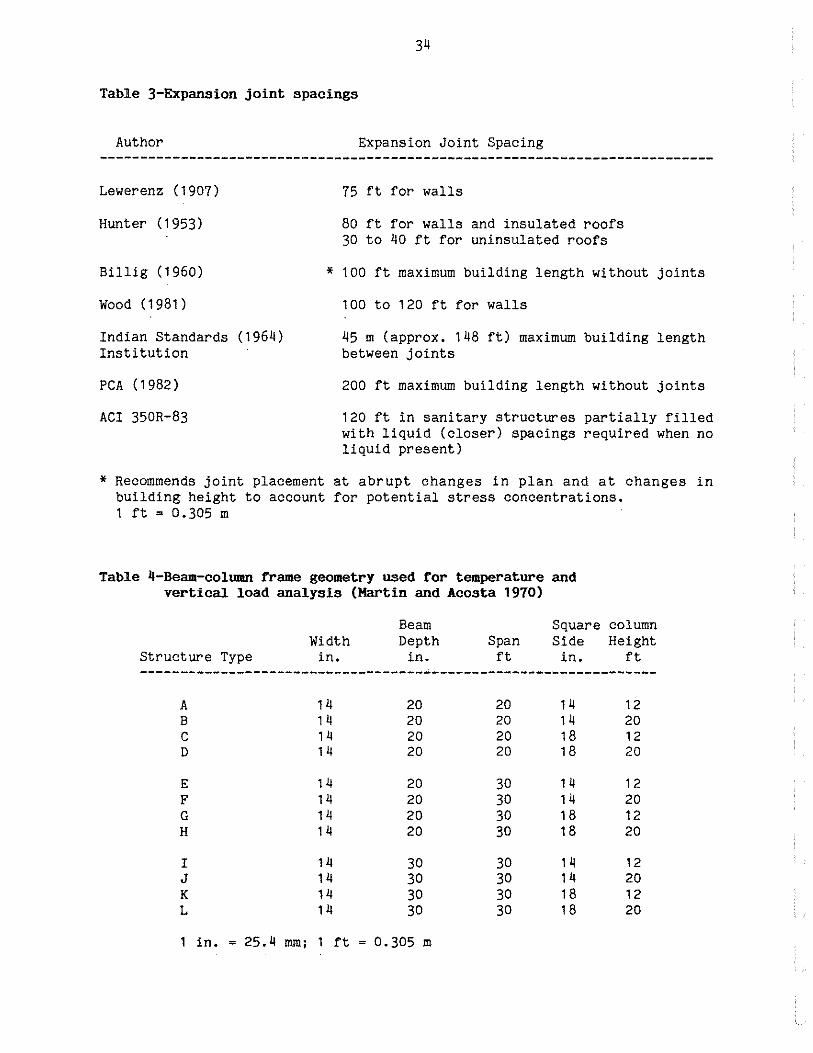
Table 3 - Expansion joint spacings 34
Table 4 - Beam-column frame geometry used for temperature and vertical load analysis (Martin and Acosta 1970). • •••• 34
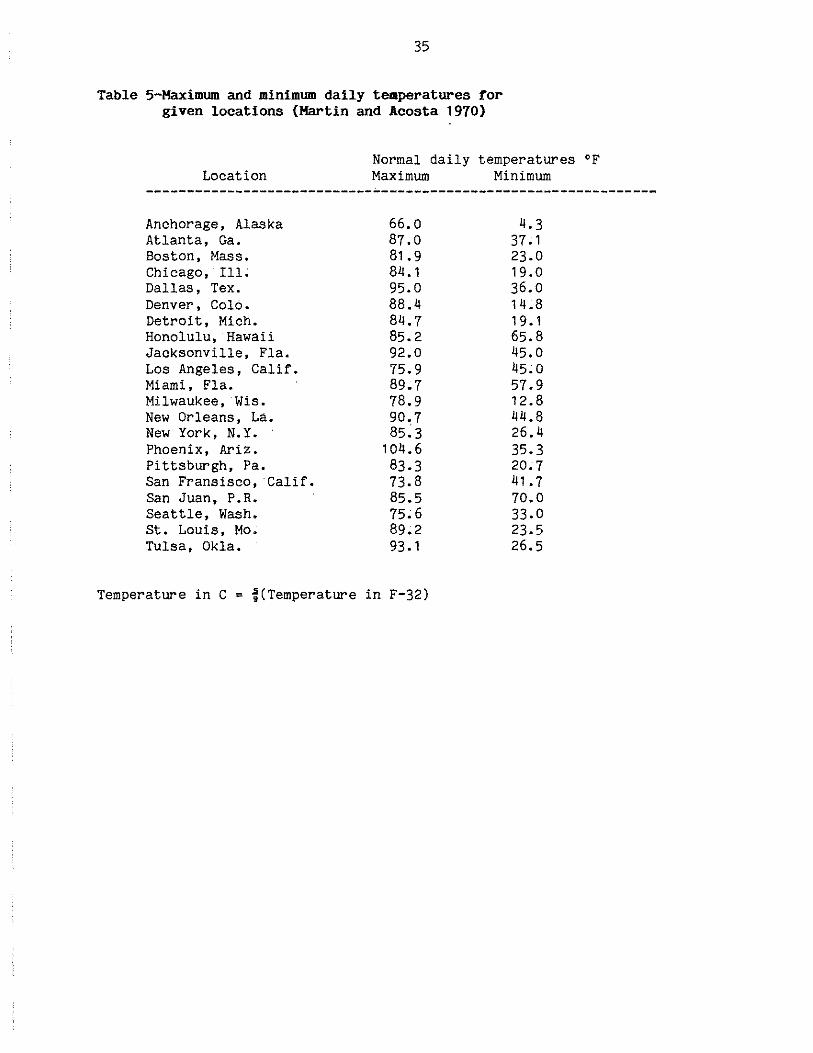
Table 5 - Maximum and minimum daily temperatures for given locations (Martin and Acosta 1970) • • •••••• 35
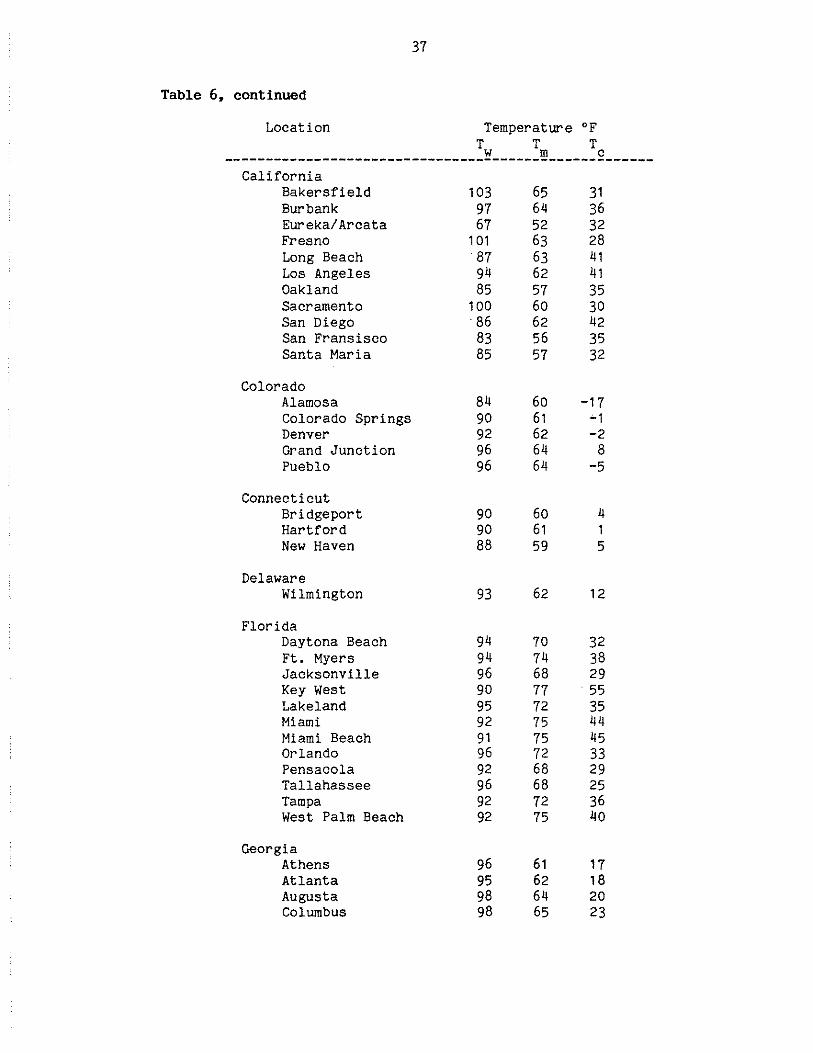
Table 6 - Temperatures used for calculation of 6T (National Academy of Sciences 1974). • •••••••••• 36
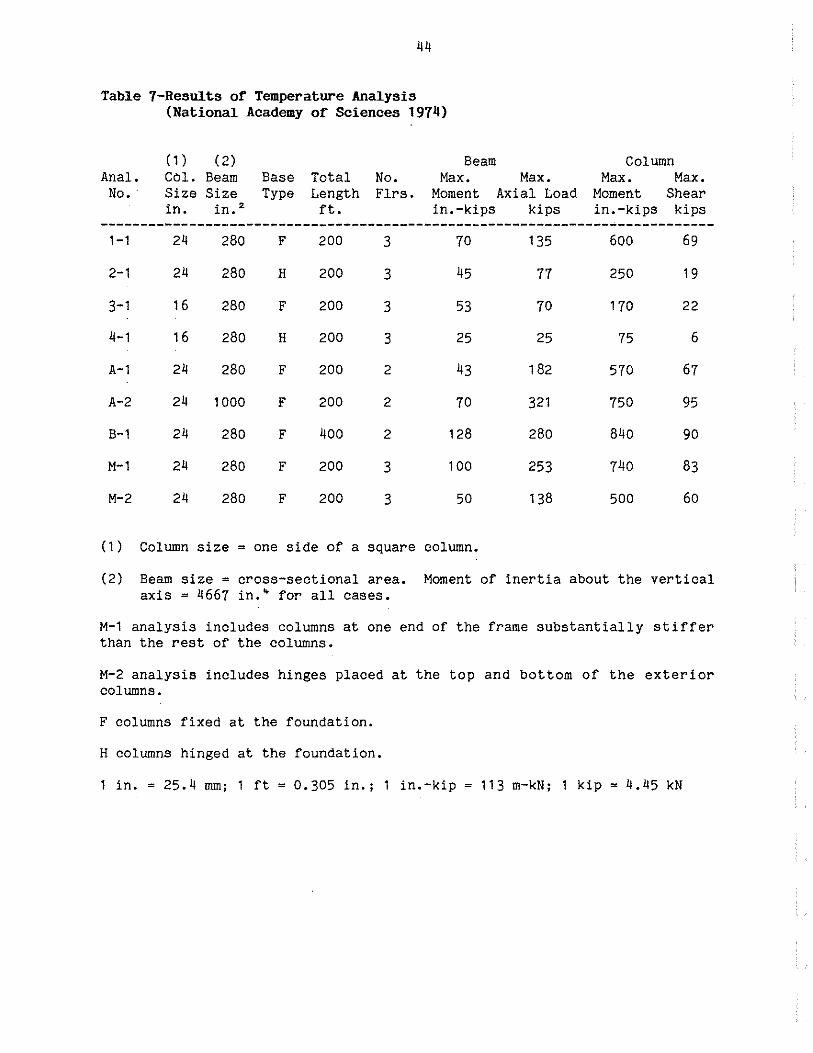
Table 7 - Results of Temperature Analysis (National Academy of Sciences 1974) •••••••••••••• 44
Figure
2
3
vi
LIST OF FIGURES
Page
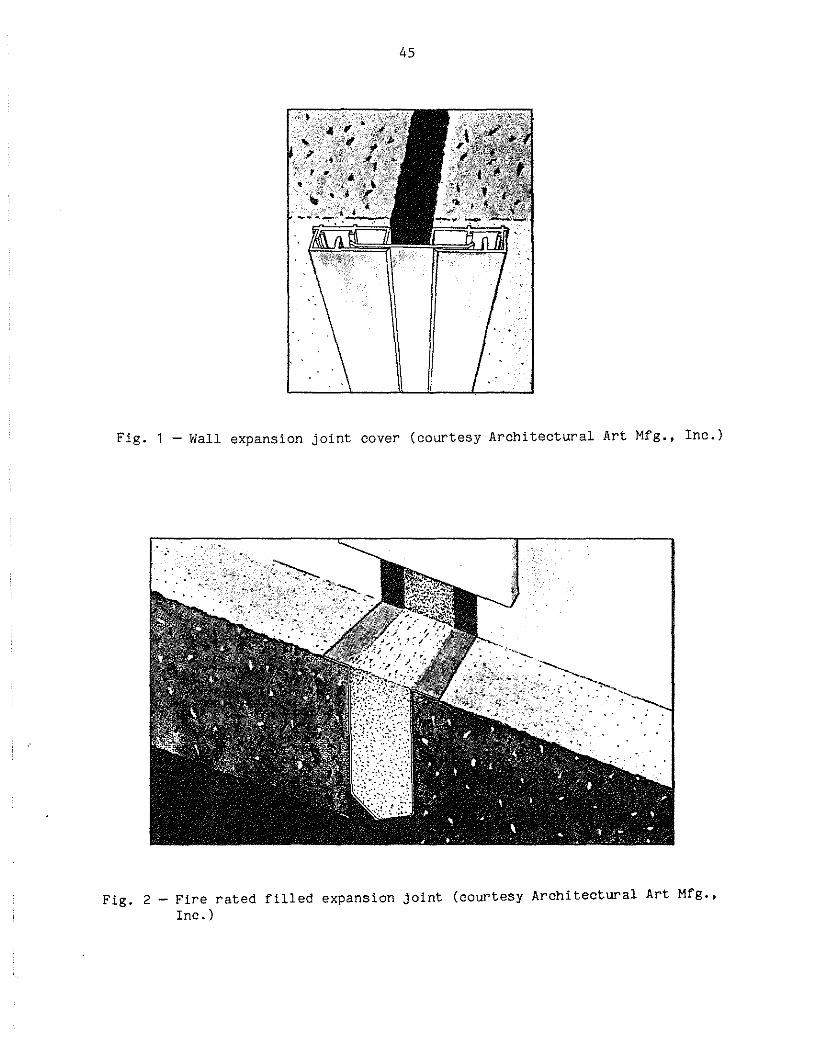
Wall expansion joint cover (courtesy Architectural Art Mfg., Inc.) •••••••••••• 45
Fire rated filled expansion joint (courtesy Architectural Art Mfg., Inc.) •• • • • • 45
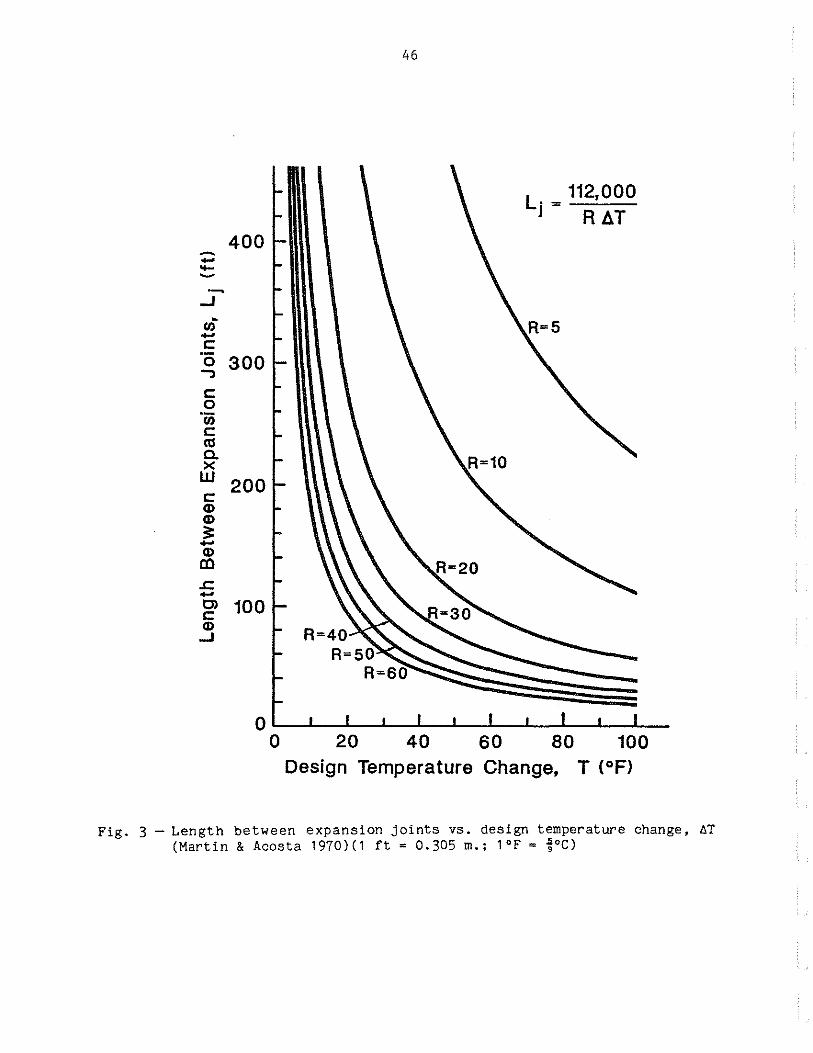
Length between expansion joints vs. design change, ~T (Martin & Acosta 1970)
temperature
(1ft= 0.305 m.; 1°F = ~°C) •••••
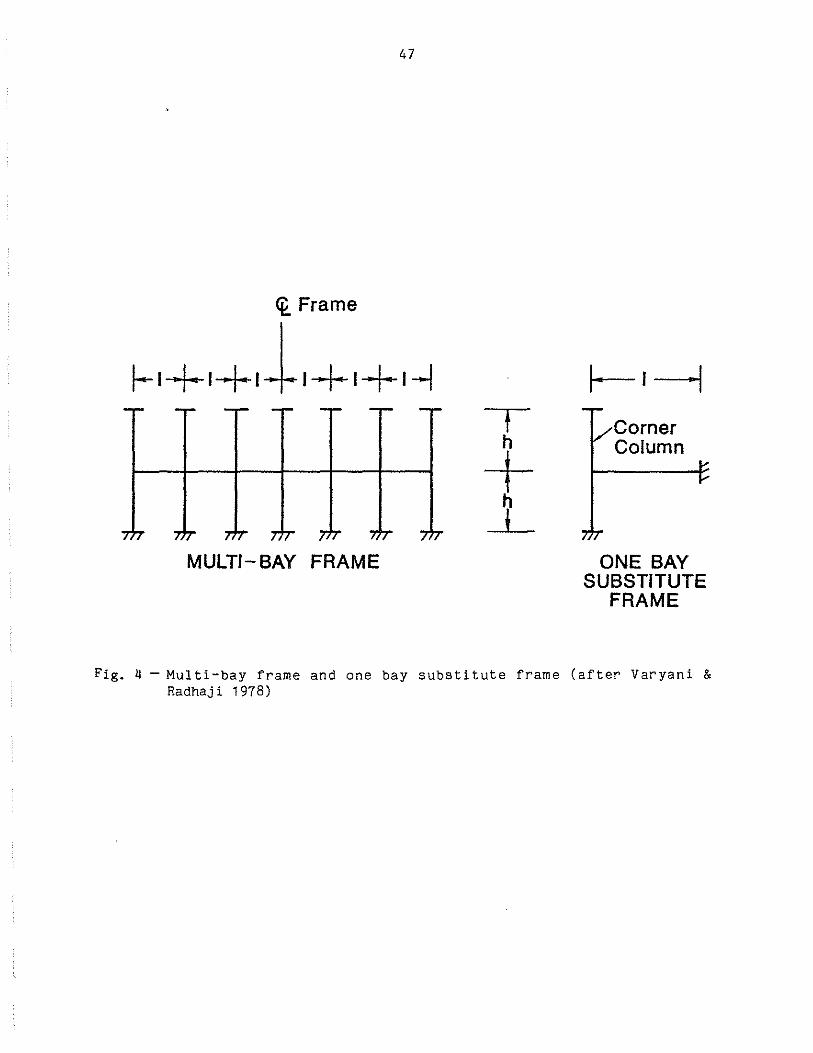
Multi-bay frame and one bay substitute frame (after Varyani & Radhaji 1978) •••• . .
• • • • 46
• • • • • • • 4 7
5 Moments at base of corner columns due to gravity one bay substitute frames (after Varyani & Radhaji 1978) ••• 48
6 Moments at base of corner columns due to temperature change using one bay substitute frames L. =total length between expansion joints (after Varyani & Radhaji 1978) •••••••••••••••• 49
7 Expansion joint criteria of the Federal Construction Council (National Academy of Sciences 1974)
8
(1 ft = 0.305 m; 1°F =~·c) ••••.••••••••••••• 50
Expansion joint criteria of one federal agency (National Academy of Sciences 1974) (1ft= 0.305 m; 1•F = ;•c) •••••••••• • • • • • • • 51
9 Frames subjected to a uniform temperature change (National Academy of Sciences 1974) •••••••••••••• 52
INTRODUCTION
Volume changes caused by changes in moisture and temperature should be
accounted for in the design of reinforced concrete buildings. The magnitude
of the forces developed and the amount of movement caused by these volume
changes is directly related to building length. Contraction and expansion
joints limit the magnitude of forces and movements and cracking induced by
moisture or temperature change by dividing buildings into individual
segments. Joints can be planes of weakness to control the location of
cracks (contraction joints), or lines of total separation between segments
(expansion joints).
There is currently no universally accepted design approach to accom
modate building movements caused by temperature or moisture changes. Many
designers use "rules of thumb" that set limits on the maximum length between
building joints.
Although widely used, rules of thumb have the drawback that they do not
account for the many variables which control volume changes in reinforced
concrete buildings. For example, variables which affect the amount of ther
mally induced movement include the percentage of reinforcement, which limits
the amount of movement and cracking in the concrete; the restraint provided
at the foundation, which limits the movement of the lower stories; the
geometry of the structure, which can cause stress concentrations to develop,
especially at abrupt changes in plan or elevation; and provisions for in
sulation, cooling, and heating, which affect the ability of a building to
dampen the severity of outside temperature changes.
In addition to these variables, the amount of movement in a building is
directly related to the type of aggregate, cement, mix proportions, admix
tures, humidity, construction sequence, and curing procedures used. While
2
these variables can be addressed quantitatively, their consideration is
usually beyond the scope of a typical design sequence and will not be con
sidered here. A number of these parameters are addressed by Mann (1970).
The purpose of this report is to provide guidance for the placement of
contraction and expansion joints in reinforced concrete buildings. A sec
tion is included on construction joints. Isolation joints on slabs on grade
within the buildings are not covered.
The following section provides a brief overview, outlining the need for
joints. The next section is devoted to construction joints, reviewing cur
rent procedures for locating and detailing these joints. A section on
contraction joints follows, reviewing current recommendations for contrac
tion joint spacing. In the final section, three different approaches to
expansion joint placement are presented: Martin and Acosta (1970), Varyani
and Radhaji (1978), and the National Academy of Sciences (1974). Design ex
amples illustrate the application of the three methods. For additional
information, the reader is directed to an annotated bibliography by Gray and
Darwin (1984).
THE NEED FOR JOINTS
Due to the low tensile capacity of concrete, some cracking in rein
forced concrete is unavoidable. Contraction joints provide a weakened plane
for cracks to form. Through the use of architectural details, these joints
can be located so that cracks will occur in less conspicious locations
within a building and possibly be eliminated from view.
Expansion joints allow thermally induced movements to occur with a min
imum build-up of stress. The greater the spacing between joints, the
greater the stresses. Typically, these joints isolate a frame into a series

3
of segments with enough joint width to allow the building to expand with in
creasing temperature. By isolating the segments, expansion joints also
provide relief from cracking due to contraction, and therefore act in a dual
role.
Crack control in reinforced concrete buildings is needed for two
reasons. The obvious reason is aesthetics. Where cast-in-place concrete is
to be the finished product, cracks are unsightly. Cracks in major framing
elements such as girders and columns tend to promote questions concerning
the structural adequacy of the structure. They may, in fact, pose no struc
tural problems, but to the average person without structural knowledge,
they can be cause for alarm. Secondly, cracks of substantial width invite
air and moisture into the framework of the structure, possibly having
deleterious effects. Two examples illustrate the magnitude of potential
cracks.
Lewerenz (1907) cites a plain concrete retaining wall located at the
U.S. Navy Yard in Pudget Sound, Washington. This wall was built with expan
sion joints spaced every 70ft (21.4 m). After being subjected to four
complete cycles of summer-winter temperature changes [8 to 95 °F (-13 to 35
°C)], the joints had opened as much as 3/16 in. (4.8 mm).
Hunter (1953) describes a four story bakery, 200 ft (61 m) long by 50
ft (15 m) tall, built in 1937. An expansion joint placed at mid-length
opened as much as 3/4 in. (19 mm) at the roof level. The width of the joint
tapered to zero at the basement level. The magnitude of this movement is
directly attributed to thermal strains caused by the heat generated by the
ovens, coupled with outside temperature effects.
4
As demonstrated by these two examples, the need for crack control in
reinforced concrete structures is real. The key questions are: How to con
trol the amount of cracking (through the use of contraction joints), and how
to limit stresses in members to an acceptable level (through the use of ex
pansion joints)? In the sections that follow, recommendations are presented
for contraction joint spacing, and specific procedures are presented for the
placement of expansion joints.
Once joint locations are selected, the joint must be constructed so
that it will act as intended. The weakened section at a contraction joint
may be formed or sawed, either with no reinforcement or a portion of the to
tal reinforcement passing through the joint. The expansion or isolation
joint is a discontinuity in both reinforcement and concrete. Therefore, an
expansion joint is effective for both shrinkage and temperature variations.
Both joints can be used as construction joints, as described in the follow
ing section.
CONSTRUCTION JOINTS
Except for very small structures, it is impractical to place concrete
in a continuous operation. Construction joints are needed in order to ac
commodate the construction sequence for placing the concrete. The amount of
concrete that can be placed at one time is governed by batching and mixing
capacity, crew size, and the amount of time allotted. Correctly sited and
properly executed construction joints provide limits for successive concrete
placements, without adversely affecting the structure.
For monolithic concrete, a good construction joint provides a well
bonded watertight surface, which allows for flexural and shear continuity
through the joint. Without this continuity, a weakened region results,
which may serve as a contraction or expansion joint. A contraction joint is
5
formed by limiting the percentage of reinforcement through the joint, thus
creating a plane of weakness. An expansion joint is formed by leaving a gap
in the structure of sufficient width to remain open under extreme tempera
ture conditions. If possible, construction joints should coincide with
contraction or expansion joints, which are discussed in the following
sections. The balance of this section is devoted to construction joints in
regions of monolithic concrete.
Joint Construction
To achieve a well-bonded watertight joint, a few conditions must be met
prior to placement of the fresh concrete. The hardened concrete must be
clean and free of all laitance (ACI Committee 311 1981).
If only a few hours elapse between successive placements, a visual
check is needed to be sure that all loose particles, dirt, and laitance are
removed. The new concrete will be adequately bonded to the hardened green
concrete, provided that the new concrete is vibrated thoroughly over the
area.
Older joints need a little more surface preparation. Cleaning by means
of an air-water jet or wire brooming can be done when the concrete is still
soft enough that any laitance can be removed, but hard enough to prevent ag
gregate from loosening. Concrete that has set should be prepared using a
wet sand blast or ultra-high pressure water jet (ACI Committee 311 1981).
ACI 318 states that existing concrete should be moistened thoroughly
prior to placement of fresh concrete. Green concrete will not require any
additional water, but concrete that has dried out may require saturation for
a day or more. No pools of water should be left standing on the wetted sur
face at the time of placement.
6
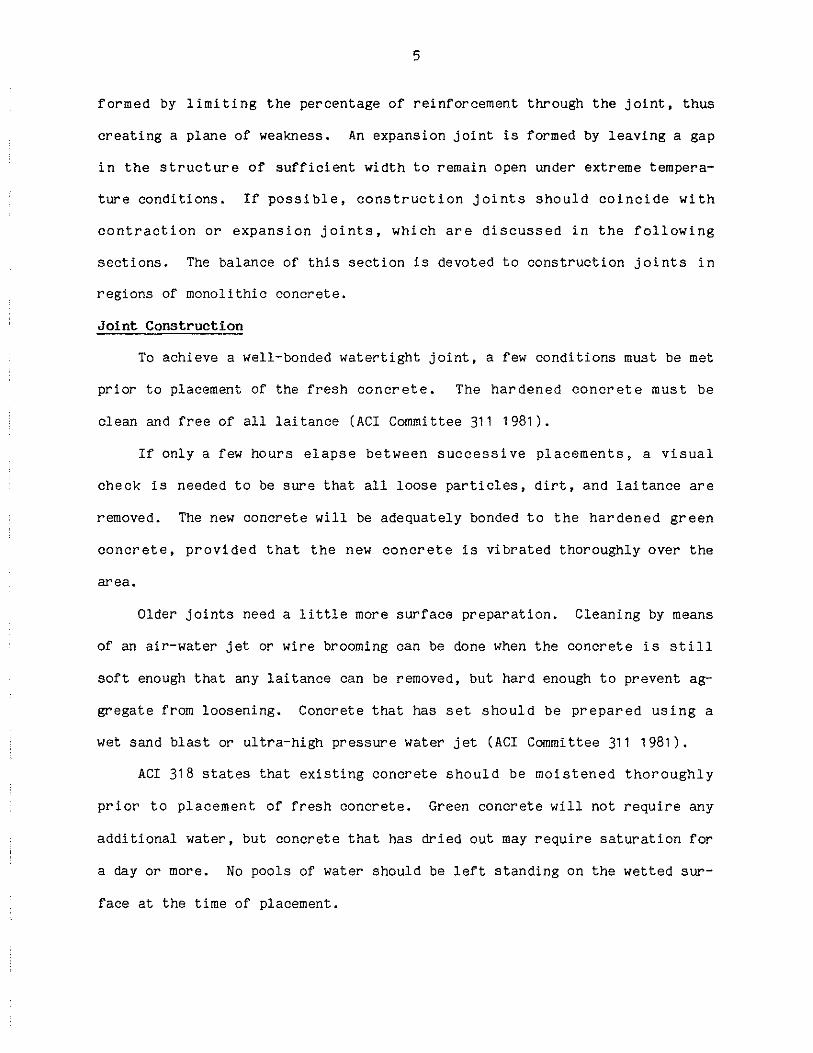
Form construction plays an important role in the quality of a joint.
It is essential to minimize the leakage of grout from under stop-end boards
(Hunter 1953). If the placement is deeper than 6 in., the possibility of
leakage is even greater due to the increase in the pressure head of the wet
concrete. Grout which escapes under the form will form a thin wedge of
material, which must be cut away prior to the next placement. If not
removed, this wedge will not adhere to the fresh concrete, and under load,
deflection in the element will cause this joint to open.
Joint Location
The final consideration is placing the construction joint in the right
place. Assuming an adequate production capacity, construction joints should
be located where they will least affect the structural integrity of the ele
ment under consideration, while at the same time being compatible with the
building's appearance. Placement of joints varies, depending on the type of
element under construction. For this reason, beams and slabs will be ad
dressed separately from columns and walls.
Beams and Slabs--From the point of view of strength in beam and slab
floor systems, desirable locations for joints placed perpendicular to the
main reinforcement are at points of minimum shear or at points of
contraflexure. Typically, joints are located at mid-span or in the middle
third of the span, but locations should be verified by the engineer before
placement is shown on the drawings. In beam and girder construction, where
a beam intersects a girder at the point of minimum shear, ACI 318 states
that the construction joint in the girder should be offset a distance equal
to twice the width of the incident beam.
Horizontal construction joints in beams and girders are usually not
recommended. Common practice is to place beams and girders monolithically
7
with the slab. In the case of beam and girder construction where the mem
bers are of considerable depth, Hunter (1953) recommends placing concrete in
the beam section up to the soffit of the slab, then placing the slab in a
separate operation. The reasoning behind this is that cracking of the top
surface may result due to vertical shrinkage in a deep member. With this
procedure, there is a possibility that the two surfaces will slip due to
horizontal shear in the member. In this case, adequate shear transfer must
be provided (ACI 318).
Construction joints parallel to the slab span can be placed anywhere,
except those locations in T-beam construction that rely on a portion of the
slab to act with the beam in resisting flexure.
The main concern in joint placement is to provide adequate shear trans
fer and flexural continuity through the joint. Flexural continuity is
achieved by continuing the reinforcement through the joint with enough
length past the joint to insure an adequate splice length for the
reinforcement. Shear transfer is provided by shear friction between the old
and new concrete, and/or dowel action in the reinforcement through the
joint. Shear keys are usually undesirable (Fintel 1974), since keyways are
possible locations for spalling of the concrete. If proper concreting pro
cedures are followed, the bond between the old and new concrete, plus the
effect of the reinforcement crossing the joint, are adequate to provide the
necessary shear transfer.
Columns and Valls--It is general practice to limit concrete placements
to a height of one story. Construction joints in columns and bearing walls
should be located at the undersides of floor slabs and beams, and at the top
of floor slabs for columns continuing to the next floor. Column capitals,
haunches, drop panels, and brackets, should be placed monolithically with
8
the slab. Depending on the architecture of the structure, the construction
joint may be used as an architectural detail, or located to blend in without
being noticeable. Quality form construction is of paramount importance in
order to provide the visual detail required (PCA 1982).
The placement of fresh concrete on a horizontal surface can affect the
joint. Common practice has been to provide a bedding layer of mortar, of
the same proportions as that in the concrete, prior to placement of new con
crete above the joint. The ACI Manual of Concrete Inspection (ACI Committee
311 1981) recommends using a bedding layer of concrete with somewhat more
cement, sand, and water than the design mix for the structure. Aggregate
less than 3/4 in. can be left in the bedding layer, but all aggregate larger
than 3/4 in. should be removed. This mix should be placed 4 to 6 in. deep
and thoroughly vibrated with the regular mix placed above. To avoid settle
ment cracks in slabs and beams due to vertical shrinkage of previously
placed columns and walls, the concrete in the columns and walls should be
allowed to stand for at least two hours prior to placement of subsequent
floors.
Placement of vertical construction joints in walls also needs to be
compatible with the architectural flavor of the structure. Construction
joints are often located near reentrant corners of walls, alongside columns,
or other locations where they become an architectural feature of the
structure. If the building architecture does not dictate where the joints
should be placed, placement considerations, such as production capacity of
the crew or whether or not one set of forms will be reused along the length
of the pour may limit the length between joints. This criteria will usually
limit the maximum horizontal length to 40 ft between joints in most build
ings (PCA 1982). Due to the critical nature of building corners, it is best
9
to avoid vertical construction joints at or near a corner, so that the
corner will be tied together adequately.
Shear transfer and bending at joints in walls and columns should be ad-
dressed in much the same way it is for beams and slabs. The reinforcement
should continue through the joint, with adequate length to insure a complete
splice. If the lateral shears are high, the joint must be capable of trans-
fering the load by shear friction or dowel action.
Summary
Construction joints are necessary in most reinforced concrete
construction. Due to their critical nature, they should be located by the
designer, and indicated on the design drawings to insure adequate force
transfer and aesthetic acceptability at the joint. If concrete placement is
stopped involuntarily for a time longer than the initial setting time of the
concrete, the joint should be treated as a construction joint, with advance
input from the designer as to any additional requirements needed to insure
the structural integrity of the element being placed.
CONTRACTION JOINTS
Drying shrinkage and decreases in temperature cause tensile stresses in
concrete, if the material is restrained. Cracks will occur when the tensile
stress reaches the tensile strength of the concrete. Due to the relatively
low tensile capacity of concrete (ftc= 4.0- 7.5 ~for normal weight con
crete, f' and ft in psi), cracking is likely to occur. Contraction joints c c
provide planes of weakness for cracks to form, without marring the ap-
pearance of a structure. Contraction joints are used primarily in walls
and in slabs-on-grade.
10
The greater the distance between contraction joints, the greater will
be the forces in a structure due to volume change. To resist these forces
and minimize the amount of cracking in the concrete, greater amounts of
reinforcement are required.
Joint Configuration
Contraction joints consist of a region with a reduced concrete cross
section and reduced reinforcement. The concrete cross section should be
reduced by a minimum of 25 percent to insure that the section is weak enough
for a crack to form. In terms of reinforcement, there are two types of con
traction joints currently in use, known as "full" and "partial" contraction
joints (ACI 350R). Full contraction joints, preferred for most building
construction, are constructed with a complete discontinuity in reinforcement
at the joint. All reinforcement is terminated approximately 2 in. (51 mm)
from the joint and a bond breaker placed between successive placements, if
the joint is a construction joint. Partial contraction joints are con
structed with not more than 50 percent of the reinforcement passing through
the joint. Partial contraction joints are used in liquid containment
structures. In both types of joint, waterstops may be used to insure
watertightness.
Joint Location
Once the decision is made to use contraction joints, the question
remains: What spacing is needed to limit the amount of cracking between the
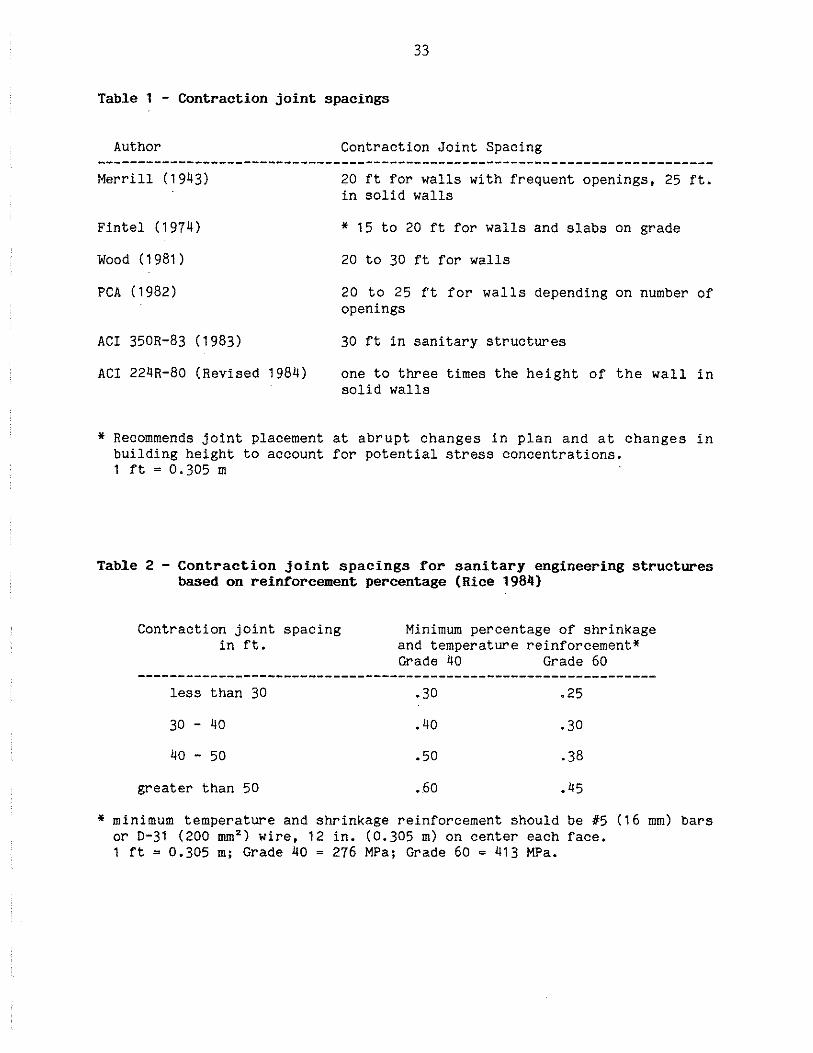
joints? As shown in Table 1, a number of recommendations are given for con
traction joint spacing. Recommended spacings vary from 15 to 30 ft (4.6 to
9.2 m) and from one to three times the wall height. For sanitary struc
tures, Rice (1984) prescribes contraction joint spacings for given
reinforcement percentages (Table 2).
11
The limits prescribed by Rice in Table 2 are extensions of the limits
recommended in ACI 350R, accounting for reinforcement grade and minimum bar
size. A graphical representation of the same information is given by Gogate
( 1984). It should be noted that if a "partial" contraction joint is used,
the joint spacing should be approximately 2/3 of the full contraction joint
spacing (ACI 350R).
Wood (1981) suggests that any joint within a structure should go
through the entire structure in one plane. If the joints are not aligned,
movement at a joint may induce cracking in an unjointed portion of the
structure until the crack intercepts another joint.
EXPANSION JOINTS
Temperature changes will induce stresses in a structure, if the struc-
ture is restrained. Without restraint, no stresses result. In practice,
all buildings are restrained to some degree. Temperature induced stresses
vary with the magnitude of the temperature change; large temperature varia-
tions can result in substantial stresses that must be accounted for in
design, while low temperature changes may result in negligible stresses.
Temperature induced stresses are the direct result of volume changes
within a structure between restrained points. A rough indication of the
amount of elongation caused by temperature increases is obtained by multi
plying the coefficient of expansion of concrete [about 5.5 X 10⁻⁶ in./in.
-6 per 0 f ( 9. 9 x 10 mm/mm per °C)] by the length of the structure and the
temperature change. A building 200 ft long subjected to a temperature in-
crease of 25 °f (14 °C) will elongate about 3/8 in. (9.5 mm).
Expansion joints are used to limit member forces caused by thermally
induced volume changes. Expansion joints permit separate segments of a
12
building to expand or contract without adversely affecting structural in
tegrity or serviceablity. Expansion joints should be wide enough to prevent
portions of the building on either side of the joint from coming in contact,
when the structure is subjected to the maximum expected temperature rise.
Joints vary in width from 1 to 6 in. (25 to 152 mm) or more, with 2 in. (51
mm) being typical. The wider joints are used to accommodate additional dif
ferential building movement that may be caused by settlement or siesmic
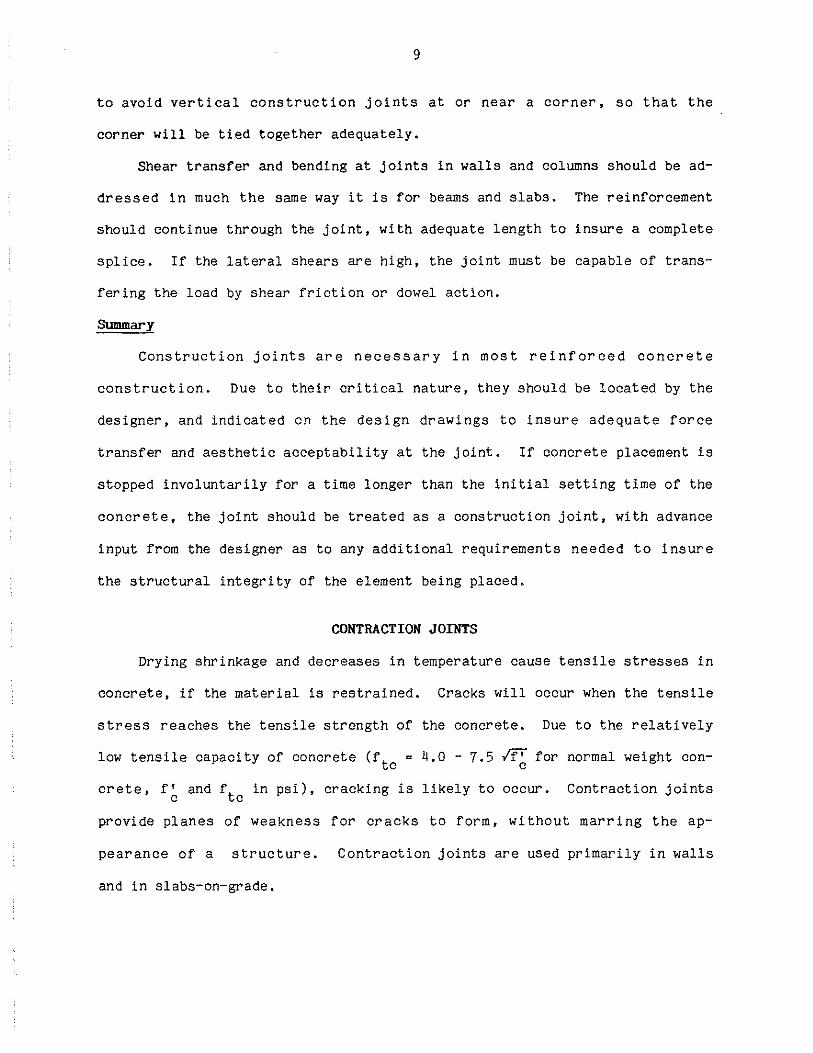
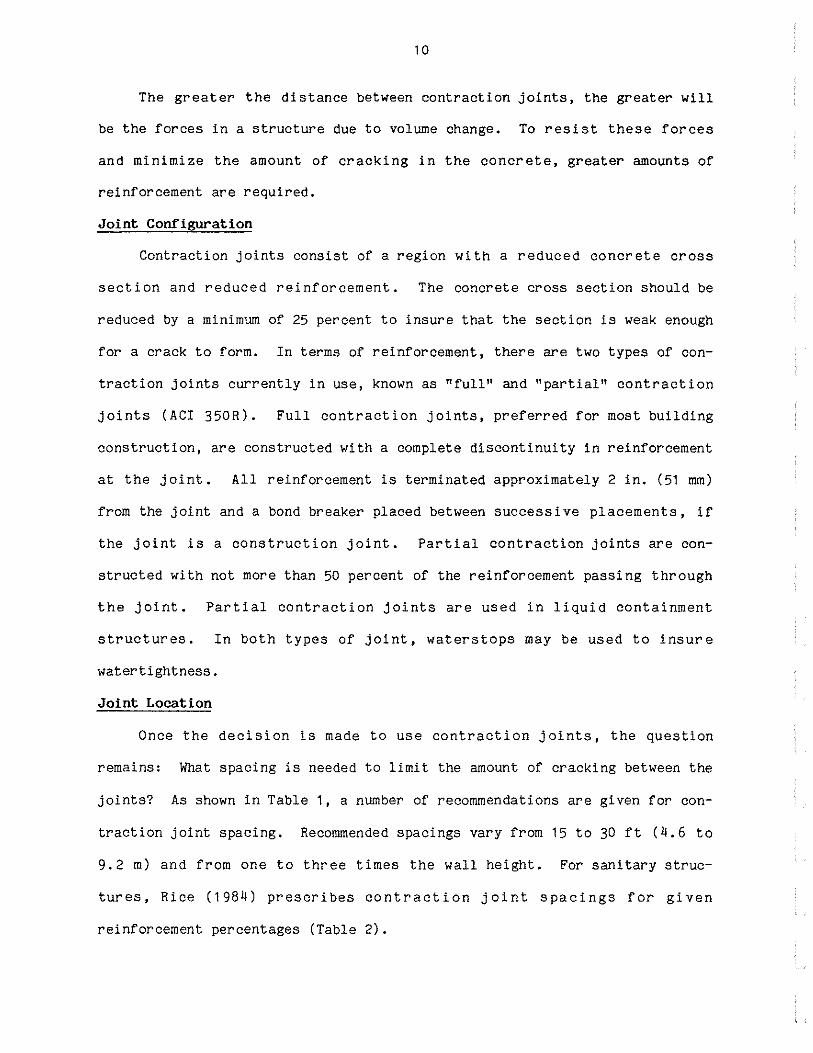
loading. Joints should pass through the entire structure above the level of
the foundation. Expansion joints should be covered (Fig. 1) and may be
empty or filled (Fig. 2). Filled joints are required for fire rated
structures.
Expansion joint spacing is dictated by the amount of movement that can
be tolerated, plus the allowable stresses and/or capacity of the members.
As with contraction joints, rules of thumb have been developed (Table 3).
These range from 30 to 400 ft (9 to 122 m) depending on the type of
structure. In addition to the rules of thumb, a number of methods have been
developed to calculate expansion joint spacing. This section presents three
of these methods. The three methods are based on the work of Martin and
Acosta (1970), Varyani and Radhaji (1978), and the National Academy of
Sciences (1974).
Martin and Acosta (1970) present an expression for the maximum spacing
of expansion joints in one story reinforced concrete buildings. The expres
sion is developed based on the results of a study of frame structures
subjected to temperature change. Joint spacing is a function of the length
and stiffness of frame members, and seasonal temperature changes that occur
at the building site. The design temperature change is based on the dif
ference between the extreme values of the normal daily maximum and minimum
13
temperatures plus an additional drop in temperature of about 30 •F (17 °C)
to account for drying shrinkage in the concrete. Martin (1970) provides
site specific values of shrinkage equivalent temperature drop. Because of
the additional volume change due to drying shrinkage, joint spacing is
governed by contraction instead of expansion.
Varyani and Radhaji (1978) present a method for calculating expansion
joint spacing based on the design of corner columns in a symmetrical frame
to resist a combination of gravity load plus thermally induced load. Joint
spacing is a function of the extreme daily temperature changes, including an
allowance for shrinkage, and the relative stiffnesses of the first floor
beams and columns. The procedure is applicable to rectangular column
layouts for single and multi-story construction. This method is somewhat
more general but is similar in approach to the method presented by Martin
and Acosta (1970).
The National Academy of Sciences (1974) present an empirical procedure
for selecting expansion joint spacing. A graph relates joint spacing to
yearly extremes in temperature at the building site. The procedure is ap
plicable to single and multi-story frame structures, and accounts for
variables such as building stiffness and configuration, the type of column
connection to the foundation, and the use of heating and air conditioning
systems.
Example calculations and a discussion of the relative merits of these
methods are presented in Appendix B.
Single Story Buildings: Martin and Acosta
Martin and Acosta (1970) present a method for calculating the maximum
spacing of expansion joints in one story beam-column frames with ap
proximately equal spans. This method is based on the premise that with
14
adequate joint spacing, the factor of safety for vertical loading will also
provide an adequate safety factor for the effects of temperature change. By
applying this premise to a number of frame structures, Martin and Acosta
develop a single expression for expansion joint spacing.
To remove the need for specific temperature calculations in design,
Martin and Acosta feel that a building should have an adequate factor of
safety to withstand the applied lateral, vertical, and thermally induced
loads. Due to the short-term nature of thermal loading, Martin and Acosta
address this type of load in the same way as ACI 318-63 addressed wind
loads. Accordingly, the structure should be designed to meet the following
criteria:
Dead and live loads:
u 1 • 50 + 1 • 8L ( 1 )
Dead, live, and temperature loads:
U=1.25(D+L+T) (2)
in which U = required strength of the element under consideration: D = dead
load; L = live load, and T = thermal load.
Setting Eq. (1) equal to Eq. (2), yields an expression for the maximum
temperature induced load, T, that is allowed in order for thermal effects to
be omitted in the design calculations. This maximum equivalent load is rep
resented by:
T = 0.20 + 0.44L ( 3)

15
This means that temperature loads should not exceed the effect of 20 percent
of the dead load plus 44 percent of the live load.
Beam-column frames with the geometries given in Table 4 were analyzed
for temperature variations obtained at a number of geographical locations.
The number of spans (and consequently the length of the buildings) were in-
creased to model varying lengths between expansion joints.
The magnitude of the design temperature change, AT, is taken as two-
thirds of the difference between the extreme values of the normal daily
maximum and minimum temperatures, T and T . , at these locations. Martin max m1n
and Acosta arbitrarily chose the two-thirds factor to account for the fact
that the temperature at which the building is completed would statistically
not be at the maximum or minimum daily temperature, but somewhere between
the two. They used a coefficient of thermal expansion, a, of 5.5 X 10⁻⁶
-6 in./in. per °F (9.9 x 10 mm/mm per •c). To account for concrete
shrinkage, Martin and Acosta used an additional equivalent temperature dif-
ferential, which averages about 30°F, in the temperature analysis to obtain
the total design temperature change.
AT = 2
CT - T . ) + 30°F 3 max m1n (4)
Although AT is used to proportion expansion joints, AT in Eq. (4) actually
represents the combination of a temperature drop with shrinkage.
The shears and moments due to temperature and shrinkage were compared
to the shears and moments due to vertical loads applied to the same frame.
The loads considered in the vertical analysis were the self weight of the
structure plus a roof live load of 30 psf (1.44 kPa), resulting in a
uniformly distributed dead load of 2 kips per foot (29 kN/m), and a
16
uniformly distributed live load of 0.5 kips per foot. The critical tempera-
ture effect for the longer beam spans (structures Type E through L of Table
4) was the bending moment in the exterior columns. Structures with shorter
beam spans (Type A through D of Table 4) were governed by the beam moment at
the exterior face of the first interior column.
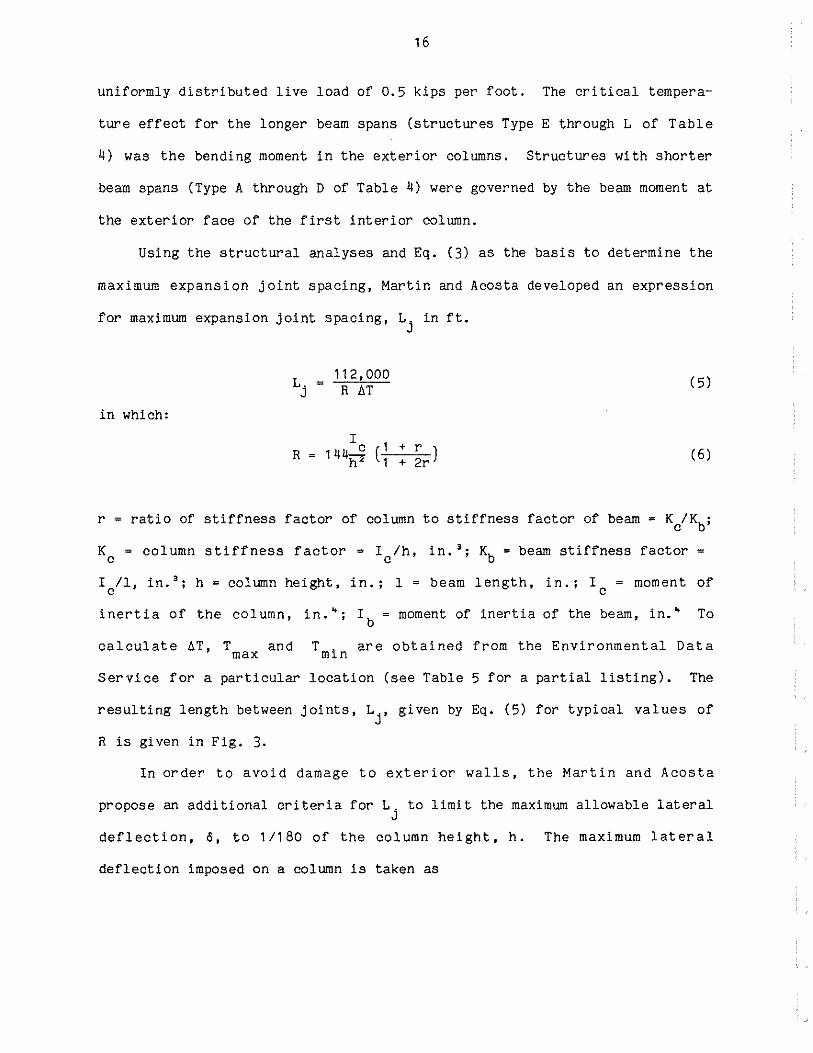
Using the structural analyses and Eq. (3) as the basis to determine the
maximum expansion joint spacing, Martin and Acosta developed an expression
for maximum expansion joint spacing, Lj in ft.
L. = 112,000
J R llT (5)
in which:
I (1 c + r ) R 144h2 1 + 2r (6)
r = ratio of stiffness factor of column to stiffness factor of beam = Kc/Kb;
K0
= column stiffness factor = I0/h, in. 3 ; Kb = beam stiffness factor =
I /1, in.•; h =column height, in.; 1 = beam length, in.; I = moment of c c
inertia of the column, in.'; Ib = moment of inertia of the beam, in.' To
calculate llT, Tmax and Tmin are obtained from the Environmental Data
Service for a particular location (see Table 5 for a partial listing). The
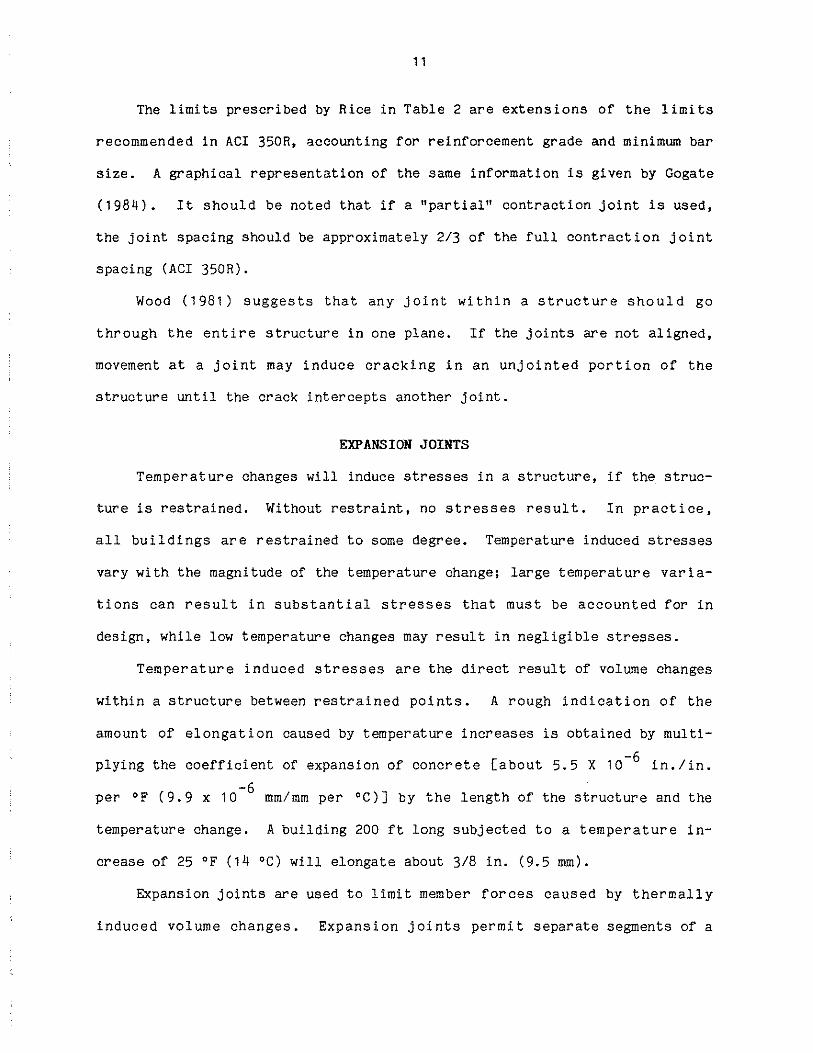
resulting length between joints, Lj' given by Eq. (5) for typical values of
R is given in Fig. 3.
In order to avoid damage to exterior walls, the Martin and Acosta
propose an additional criteria for L. to limit the maximum allowable lateral J
deflection, o, to 1/180 of the column height, h. The maximum lateral
deflection imposed on a column is taken as
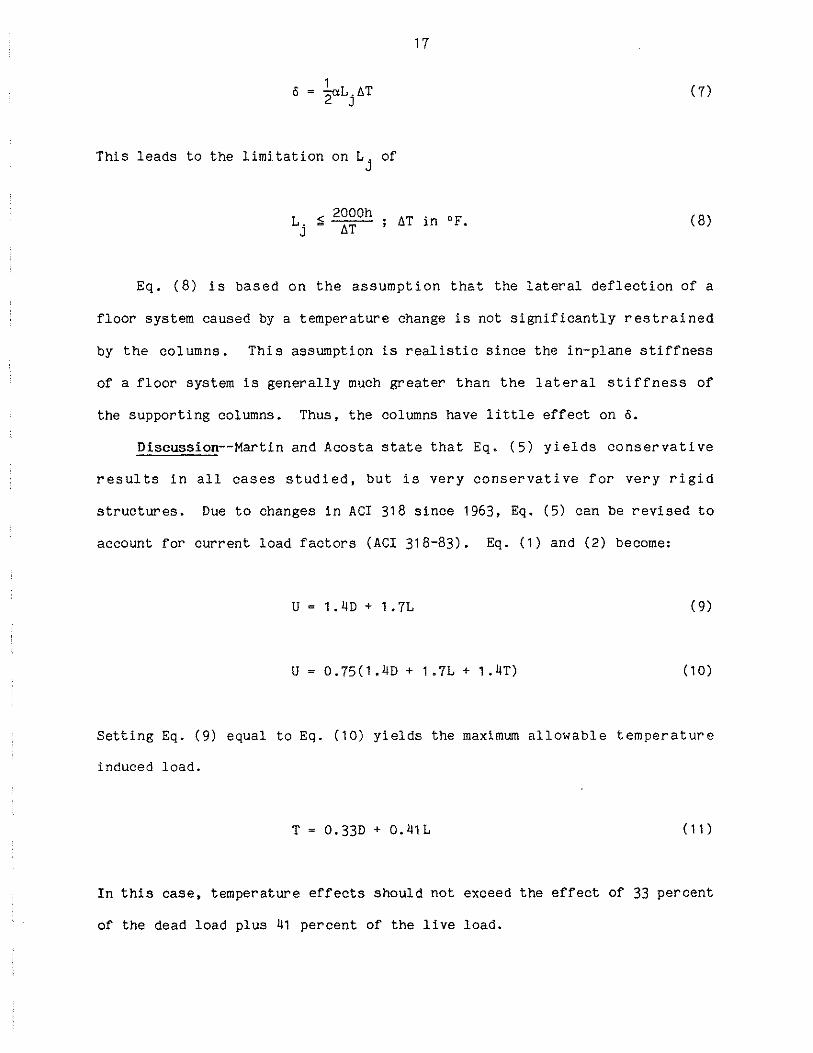
This leads to the limitation on Lj of
L -< 2000h
j t;T
17
( 7)
t;T in °F. ( 8)
Eq. ( 8) is based on the assumption that the lateral deflection of a
floor system caused by a temperature change is not significantly restrained
by the columns. This assumption is realistic since the in-plane stiffness
of a floor system is generally much greater than the lateral stiffness of
the supporting columns. Thus, the columns have little effect on o.
Discussion--Martin and Acosta state that Eq. (5) yields conservative
results in all cases studied, but is very conservative for very rigid
structures. Due to changes in ACI 318 since 1963, Eq. (5) can be revised to
account for current load factors (ACI 318-83). Eq. (1) and (2) become:
u 1 • 4D + 1 • 7L (9)
u 0.75(1.40 + 1.7L + 1.4T) ( 1 0)
Setting Eq. (9) equal to Eq. (10) yields the maximum allowable temperature
induced load.
T = 0.33D + 0.41L ( 11)
In this case, temperature effects should not exceed the effect of 33 percent
of the dead load plus 41 percent of the live load.
18
To obtain an updated version of Eq. (5) requires a reanalysis of the
original data of Martin and Acosta. In lieu of a reanalysis, Eq. (5)
remains as a conservative guideline for expansion joint spacing, since Eq.
(3) is more conservative than Eq. (11) in practical applications.
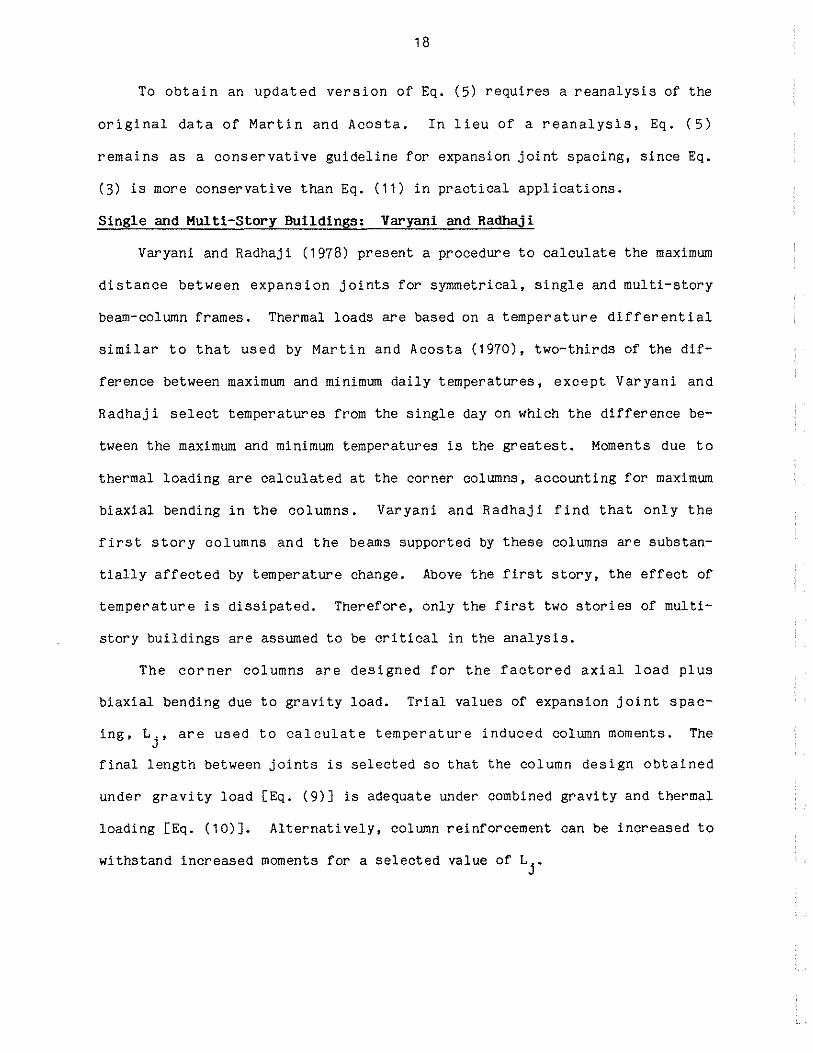
Single and Multi-Story Buildings: Varyani and Radhaji
Varyani and Radhaji (1978) present a procedure to calculate the maximum
distance between expansion joints for symmetrical, single and multi-story
beam-column frames. Thermal loads are based on a temperature differential
similar to that used by Martin and Acosta (1970), two-thirds of the dif-
ference between maximum and minimum daily temperatures, except Varyani and
Radhaji select temperatures from the single day on which the difference be-
tween the maximum and minimum temperatures is the greatest. Moments due to
thermal loading are calculated at the corner columns, accounting for maximum
biaxial bending in the columns. Varyani and Radhaji find that only the
first story columns and the beams supported by these columns are substan-
tially affected by temperature change. Above the first story, the effect of
temperature is dissipated. Therefore, only the first two stories of multi-
story buildings are assumed to be critical in the analysis.
The corner columns are designed for the factored axial load plus
biaxial bending due to gravity load. Trial values of expansion joint spac-
ing, L., are used to calculate temperature induced column moments. The J
final length between joints is selected so that the column design obtained
under gravity load [Eq. (9)] is adequate under combined gravity and thermal
loading [Eq. (10)]. Alternatively, column reinforcement can be increased to
withstand increased moments for a selected value of Lj.
19
The thermally induced moments at the base and top of a corner column
can be calculated using analysis techniques such as matrix analysis or mo-
ment distribution. Due to the tedious nature of these calculations for long
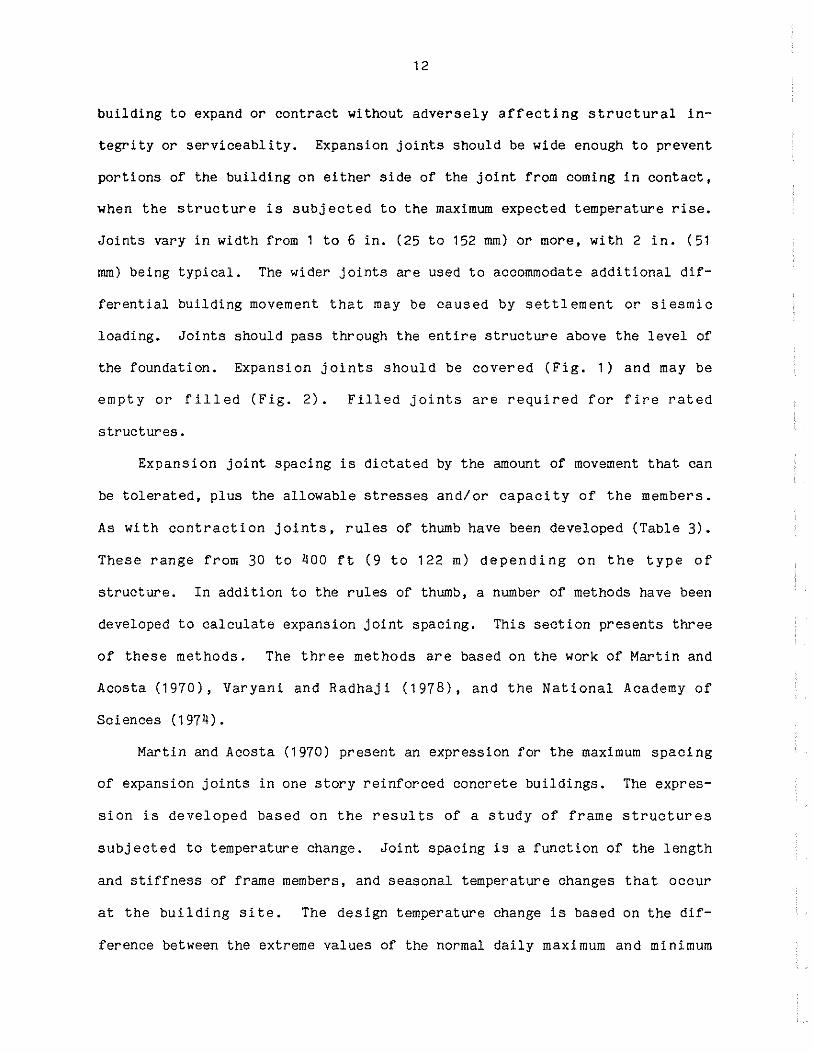
structures, Varyani and Radhaji recommend the use of a substitute one-bay
open frame, shown in Fig. 4. The one-bay frames replace the first interior
column with a fixed point at the beam-column joint. Varyani and Radhaji
compared the results obtained with this approximation to results obtained
with more accurate methods (Reynolds 1960) for up to 4 bays, and compared
the substitute bay analysis to frame analyses for buildings up to 10 bays.
They considered the 0 to 10.5 percent margin of error to be satisfactory.
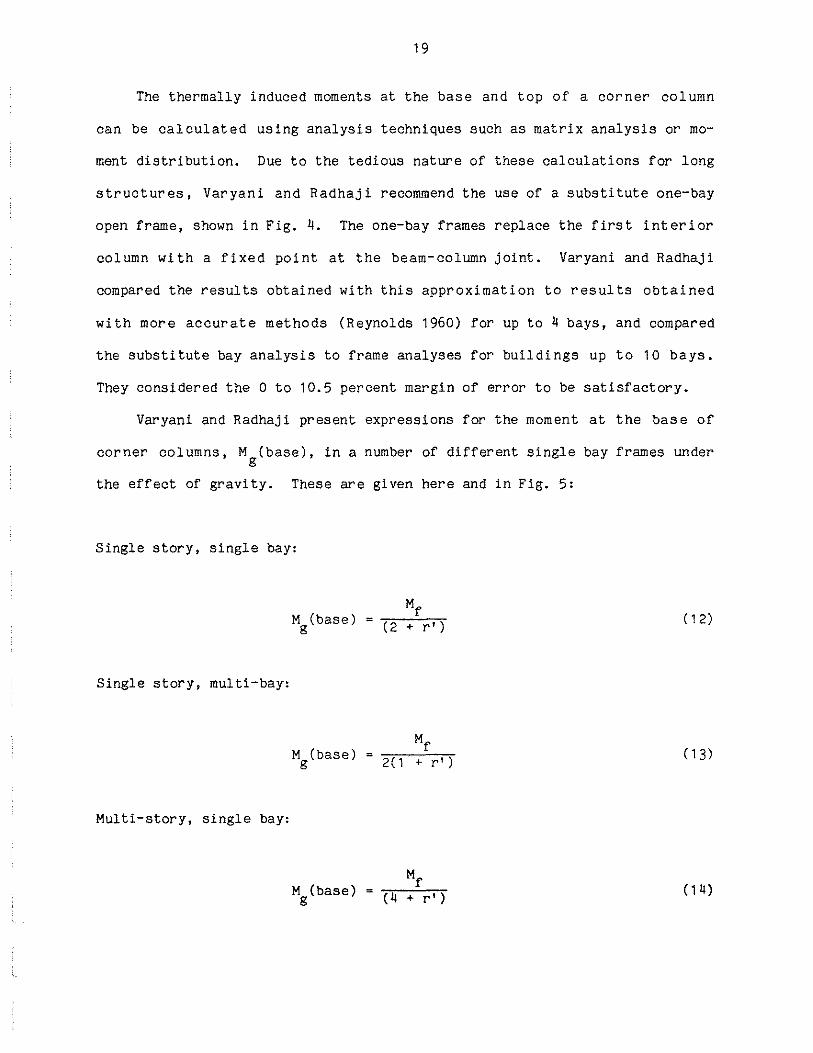
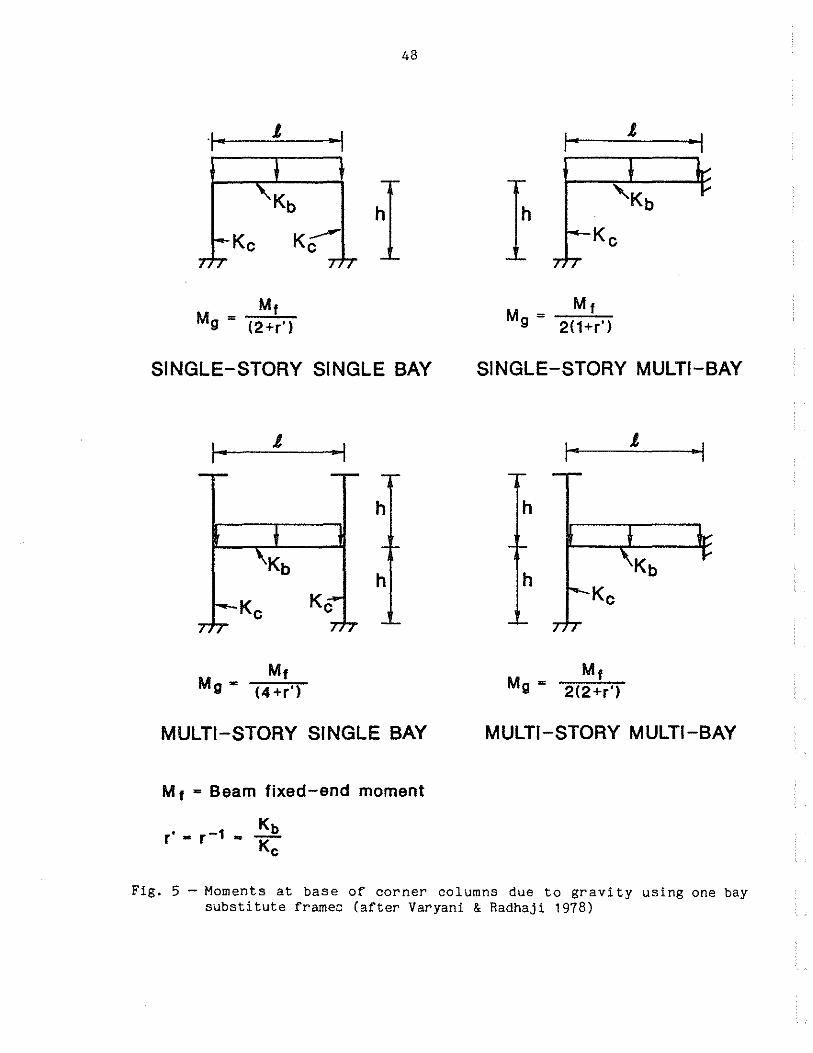
Varyani and Radhaji present expressions for the moment at the base of
corner columns, Mg(base), in a number of different single bay frames under
the effect of gravity. These are given here and in Fig. 5:
Single story, single bay:
Single story, multi-bay:
Multi-story, single bay:
Mf M (base ) = -;-;::--=-;-,
g (2+r')
M (base) g 2(1 + r')
Mf M (base ) = ,.....--,!'--;-,
g (4 + r')
( 12)
( 1 3)
( 1 4)
20
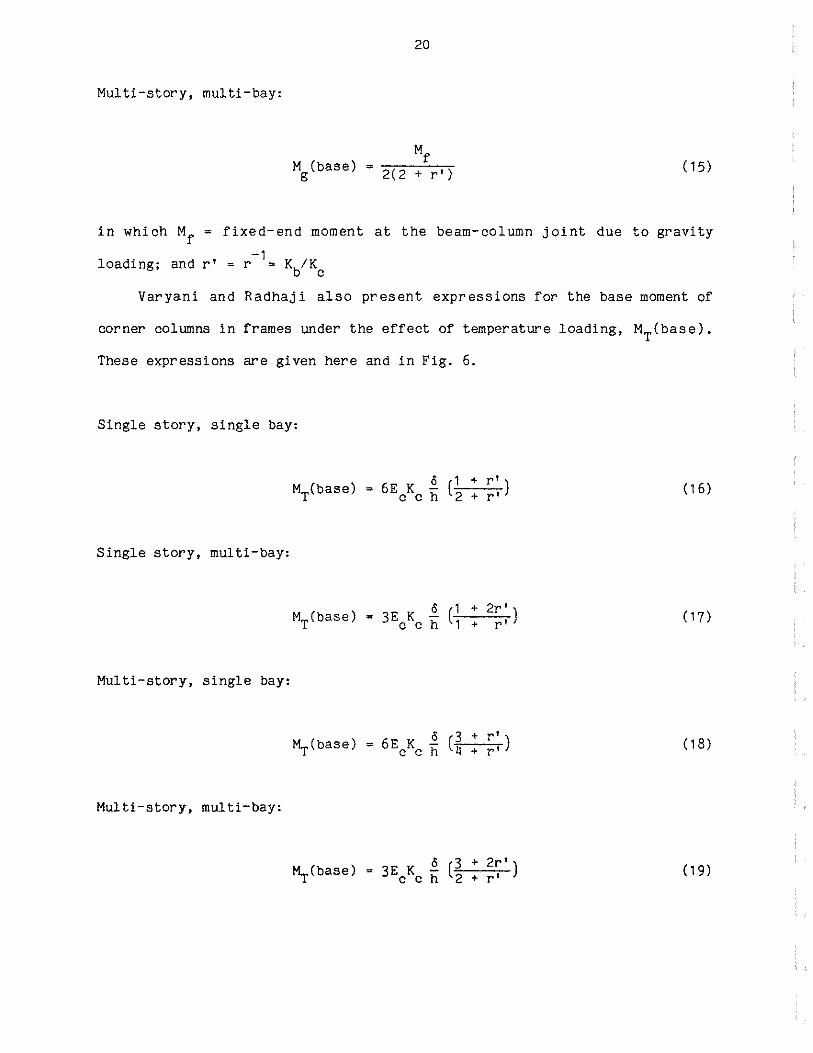
Multi-story, multi-bay:
Mf M ( b a s e ) = -::-:--::---=--...,..,-
g 2(2 + r') ( 15)
in which Mf = fixed-end moment at the beam-column joint due to gravity
-1 loading; and r' = r = Kb/Kc
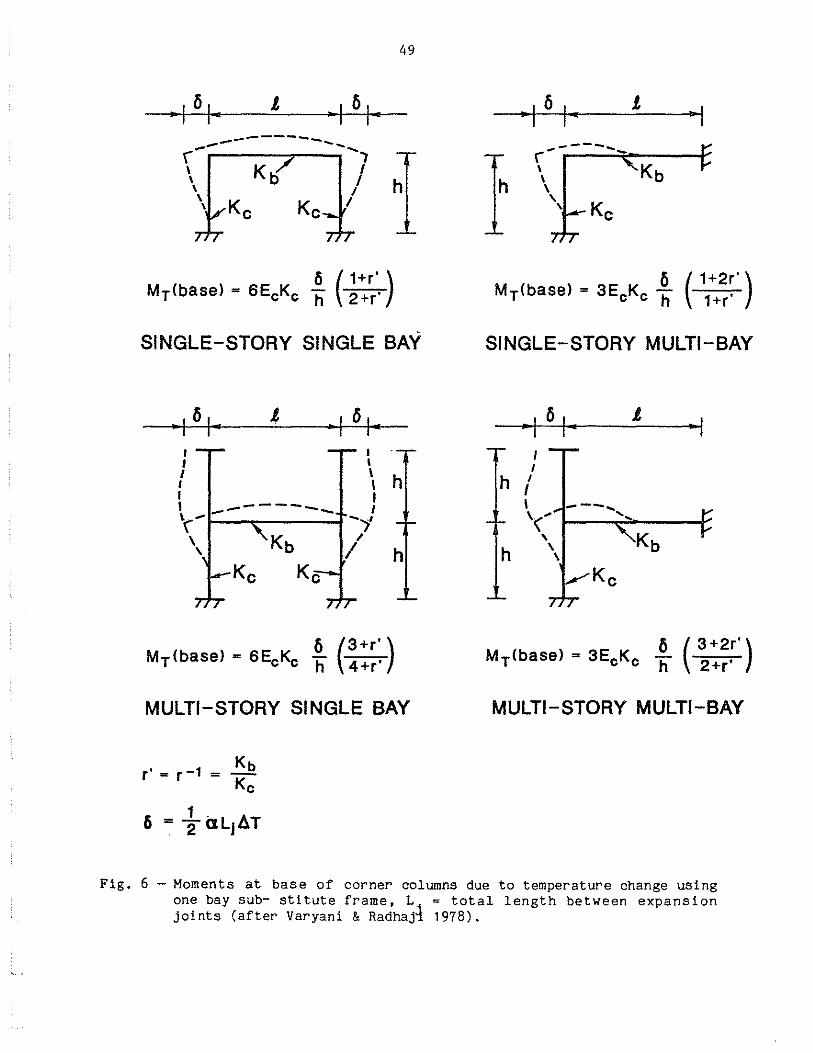
Varyani and Radhaji also present expressions for the base moment of
corner columns in frames under the effect of temperature loading, MT(base).
These expressions are given here and in Fig. 6.
Single story, single bay:
= 6E K §. (1 + r') MT(base) c c h 2 + r'
Single story, multi-bay:
MT(base)
Multi -story, single bay:
Multi-story, multi-bay:
~(base)
3E K §_ (1 + 2r') c c h 1 + r'
3 E K §. ( 3 + 2r' ) c c h 2 + r'
( 16)
(17)
( 1 8)
( 1 9)
21
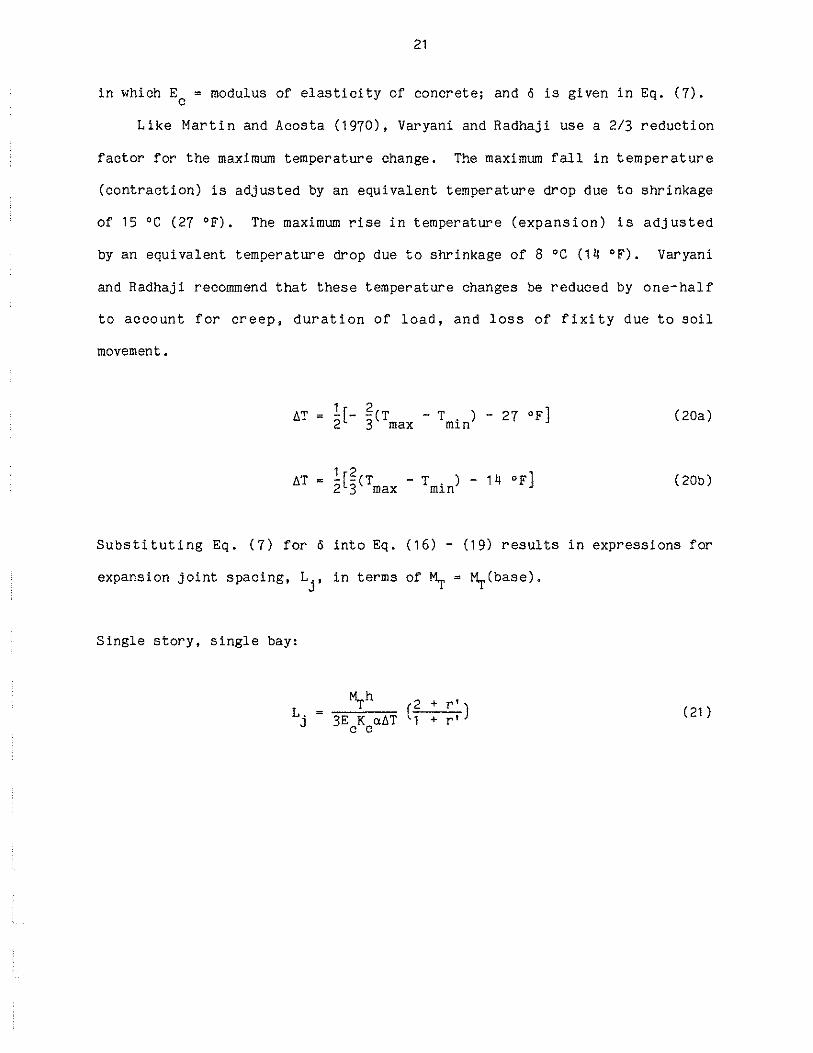
in which Ec =modulus of elasticity of concrete; and 6 is given in Eq. (7).
Like Martin and Acosta (1970), Varyani and Radhaji use a 2/3 reduction
factor for the maximum temperature change. The maximum fall in temperature
(contraction) is adjusted by an equivalent temperature drop due to shrinkage
of 15 •c (27 °F). The maximum rise in temperature (expansion) is adjusted
by an equivalent temperature drop due to shrinkage of 8 •c (14 °F). Varyani
and Radhaji recommend that these temperature changes be reduced by one-half
to account for creep, duration of load, and loss of fixity due to soil
movement.
l [- ~ ( T - T . ) - 27 oF) 2 3 max m1n
(20a)
l[~(T - T . ) - 14 •F) 2 3 max m1n (20b)
Substituting Eq. (7) for o into Eq. (16) - (19) results in expressions for
expansion joint spacing, Lj, in terms of~= MtCbase).
Single story, single bay:
( 2 + r') 3E K allT 1 + r' c c
( 21 )
Single story, multi-bay:
Multi-story, single bay:
L = j
Multi-story, multi-bay:
22
l-l.rh ( 4 + r' ) 3E K ClbT 3 + r' c c
(2 + r' ) 3E K ClbT 3 + 2r' c c
(22)
(23)
(24)
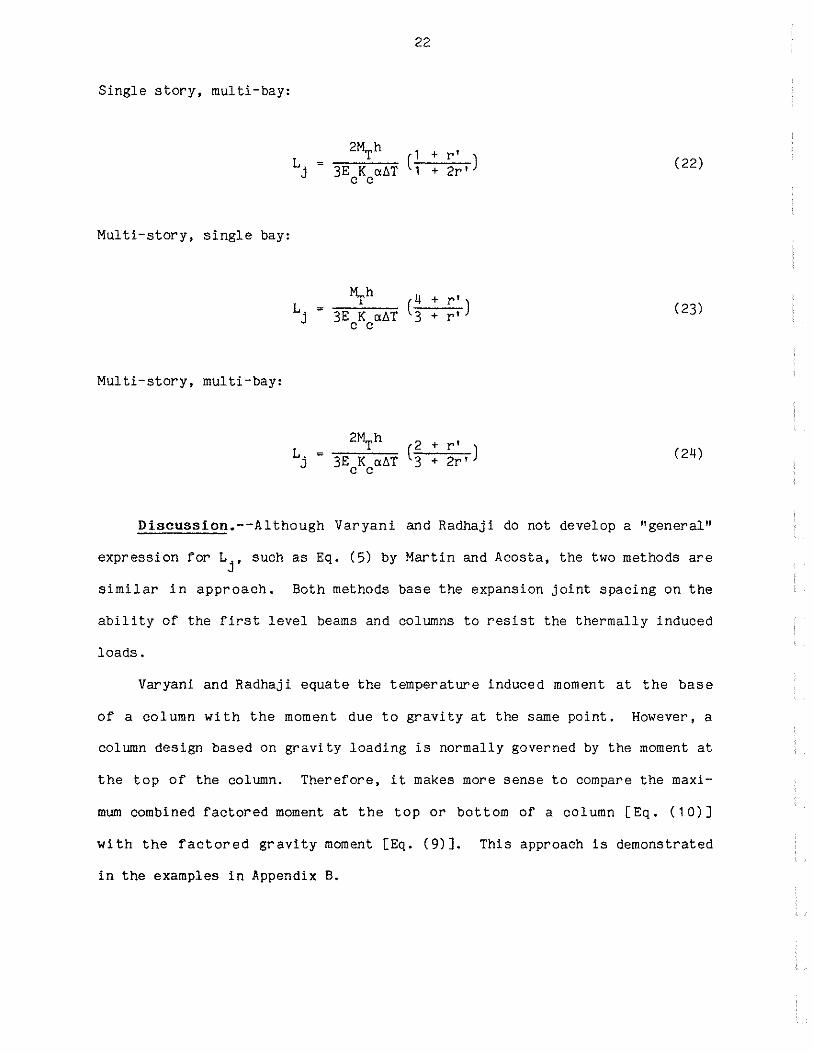
Discussion.--Although Varyani and Radhaji do not develop a "general"
expression for Lj, such as Eq. (5) by Martin and Acosta, the two methods are
similar in approach. Both methods base the expansion joint spacing on the
ability of the first level beams and columns to resist the thermally induced
loads.
Varyani and Radhaji equate the temperature induced moment at the base
of a column with the moment due to gravity at the same point. However, a
column design based on gravity loading is normally governed by the moment at
the top of the column. Therefore, it makes more sense to compare the maxi-
mum combined factored moment at the top or bottom of a column [Eq. ( 1 0)]
with the factored gravity moment [Eq. (9) ]. This approach is demonstrated
in the examples in Appendix B.
23
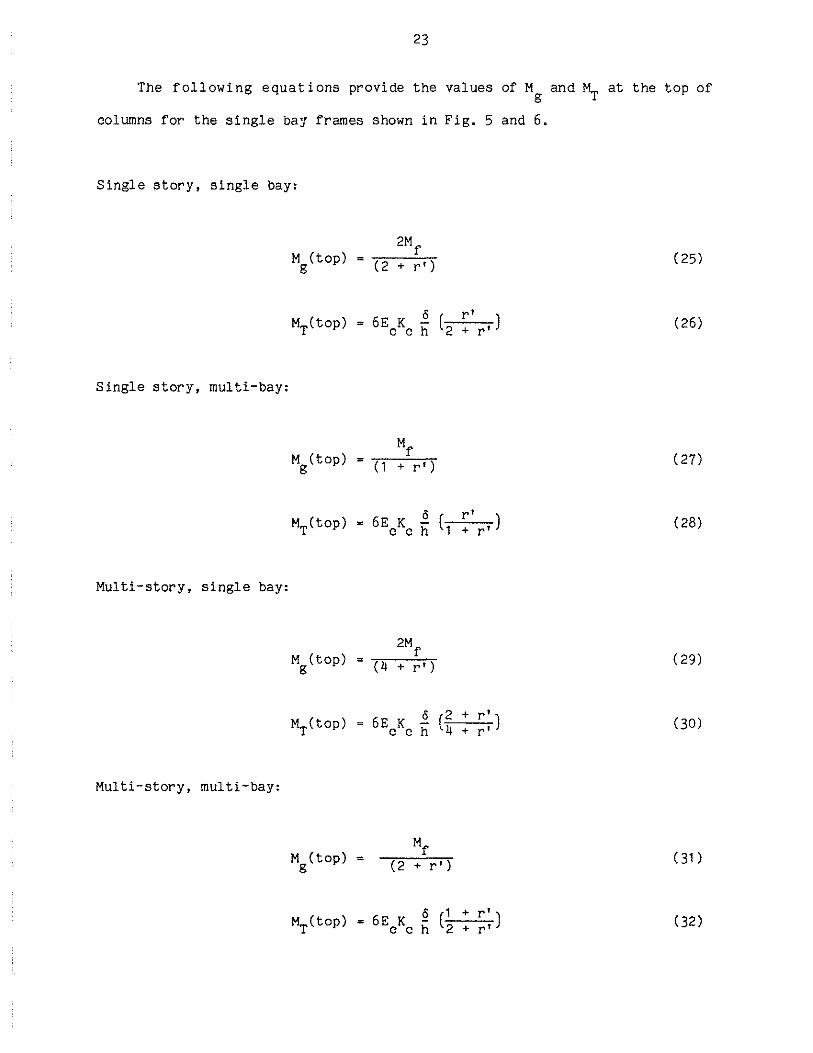
The following equations provide the values of Mg and MT at the top of
columns for the single bay frames shown in Fig. 5 and 6.
Single story, single bay:
Single story, multi-bay:
Multi-story, single bay:
Multi-story, multi-bay:
M (top) g (2 + r')
6E K .§. ( r' ) c c h 2 + r'
6E K .§. ( r' ) MT(top) = c c h 1 + r'
M (top) g
M (top) = g
(4 + r')
6E K .§_ (~ + r') c c h + r'
(2 + r')
= 6 E K ~ (1 + r • ) ~(top) c c h 2 + r'
(25)
(26)
( 27)
(28)
( 29)
(30)
( 31 )
( 32)
2~
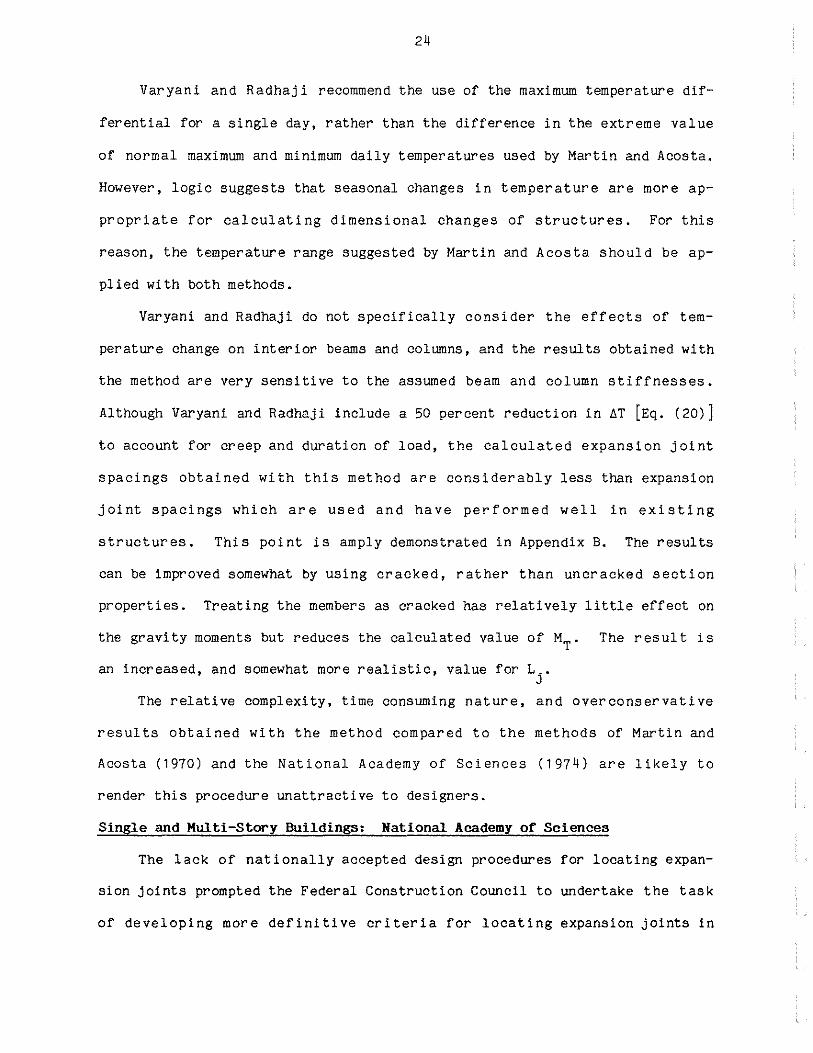
Varyani and Radhaji recommend the use of the maximum temperature dif
ferential for a single day, rather than the difference in the extreme value
of normal maximum and minimum daily temperatures used by Martin and Acosta.
However, logic suggests that seasonal changes in temperature are more ap
propriate for calculating dimensional changes of structures. For this
reason, the temperature range suggested by Martin and Acosta should be ap
plied with both methods.
Varyani and Radhaji do not specifically consider the effects of tem
perature change on interior beams and columns, and the results obtained with
the method are very sensitive to the assumed beam and column stiffnesses.
Although Varyani and Radhaji include a 50 percent reduction in ~T [Eq. (20)]
to account for creep and duration of load, the calculated expansion joint
spacings obtained with this method are considerably less than expansion
joint spacings which are used and have performed well in existing
structures. This point is amply demonstrated in Appendix B. The results
can be improved somewhat by using cracked, rather than uncracked section
properties. Treating the members as cracked has relatively little effect on
the gravity moments but reduces the calculated value of MT. The result is
an increased, and somewhat more realistic, value for Lj.
The relative complexity, time consuming nature, and overconservative
results obtained with the method compared to the methods of Martin and
Acosta (1970) and the National Academy of Sciences (197~) are likely to
render this procedure unattractive to designers.
Single and Multi-Story Buildings: National Academy of Sciences
The lack of nationally accepted design procedures for locating expan
sion joints prompted the Federal Construction Council to undertake the task
of developing more definitive criteria for locating expansion joints in
25
federal construction. As a consequence, the Council directed its Standing
Committee on Structural Engineering to develop a procedure for expansion
joint design to be used by federal agencies in building design. The
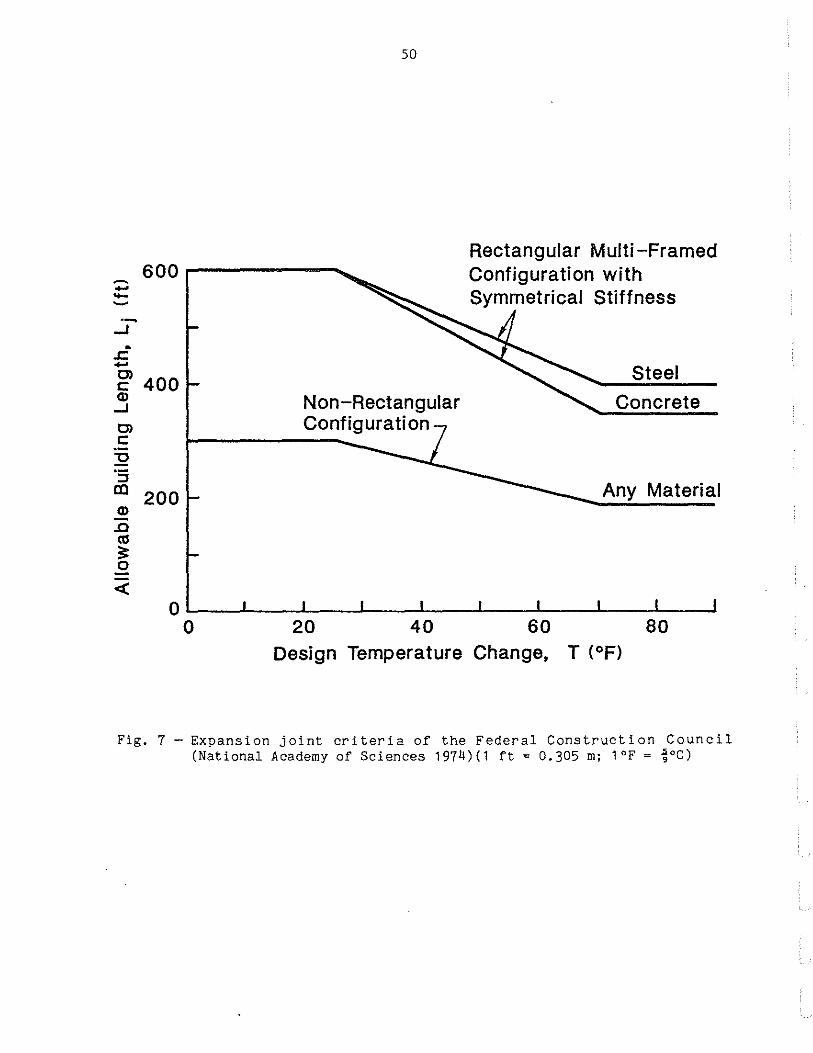
criteria formulated by the Committee was published by the National Academy
of Sciences (1974) in the form of a graph (Fig. 7) which expresses the al
lowable building length as a function of a design temperature change. The
relationships shown in Fig. 7 are directly applicable to beam-column frames,
with columns hinged at the base and heated interiors. In order for the
graph to be adaptable to a wide range of buildings, the Committee provided
modification factors to reflect building stiffness and configuration, heat
ing and cooling, and.the type of column connection to the foundation.
Fig. 7 is based on the Committee's investigation of the procedures in
use by federal agencies to select joint spacing, plus an analytical study
comparing the theoretical effects of temperature change on two-dimensional
elastic frames to the actual movements recorded during a one-year study by
the Public Buildings Administration (1943-1944).
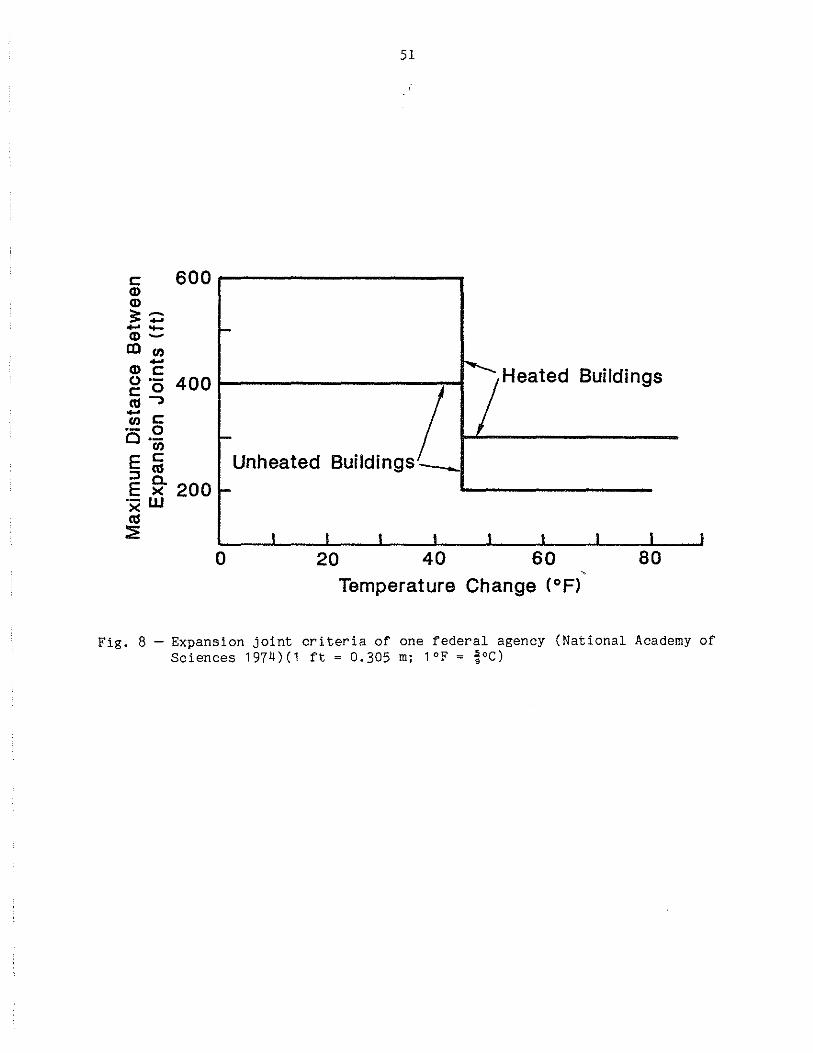
The Committee first examined procedures used by federal agencies to
select expansion joint spacing. Although no significant quantitative data
was found to support their criteria, most federal agencies relied on rules
(Fig. 8) that provided maximum building dimensions for heated and unheated
buildings as a function of the change in the exterior temperature.
Temperature change is taken as the maximum difference between the mean tem
perature during the normal construction season and either the summer or
winter extremes.
The criteria illustrated in Fig. 8 reflect two assumptions: that the
maximum allowable building length between joints must be decreased as the
maximum difference between the mean annual temperature and the
26
maximum/minimum temperature increases; and that dimensions between joints
can be increased for heated structures, which have the ability to dampen the
severity of the outside temperature changes through temperature control in
the building. The upper and lower bounds of 600 and 200 ft were felt to
reflect a consensus within the engineering profession and have no experimen-
tal or theoretical justification.
Additional information was drawn from an unpublished report by struc-
tural engineers of the Public Buildings Administration (1943-1944). This
report documents an investigation of expansion joint movement over a period
of one year (September 1943 to August 1944) in nine federal buildings.
Based on the report, the conclusions drawn by the Committee and implemented
in their design recommendations are as follows:
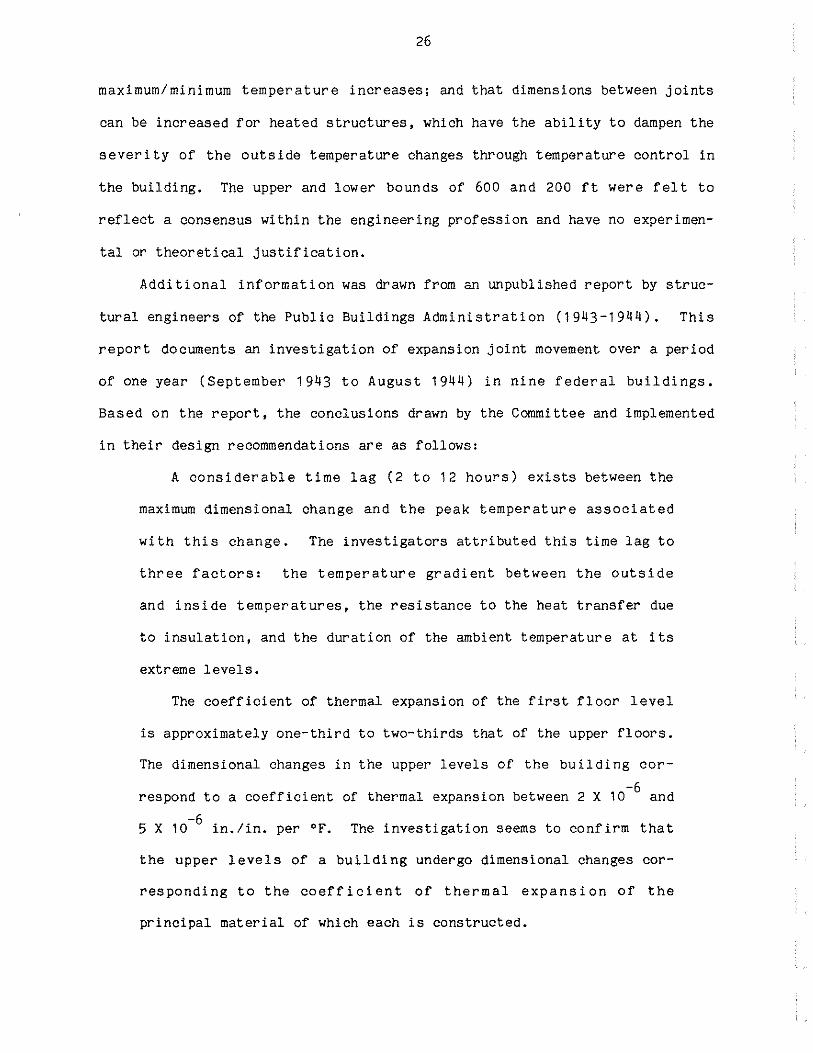
A considerable time lag (2 to 12 hours) exists between the
maximum dimensional change and the peak temperature associated
with this change. The investigators attributed this time lag to
three factors: the temperature gradient between the outside
and inside temperatures, the resistance to the heat transfer due
to insulation, and the duration of the ambient temperature at its
extreme levels.
The coefficient of thermal expansion of the first floor level
is approximately one-third to two-thirds that of the upper floors.
The dimensional changes in the upper levels of the building cor-
respond to a coefficient
5 X 10⁻⁶ in./in. per •F.
-6 of thermal expansion between 2 X 10 and
The investigation seems to confirm that
the upper levels of a building undergo dimensional changes cor-
responding to the coefficient of thermal expansion of the
principal material of which each is constructed.
27
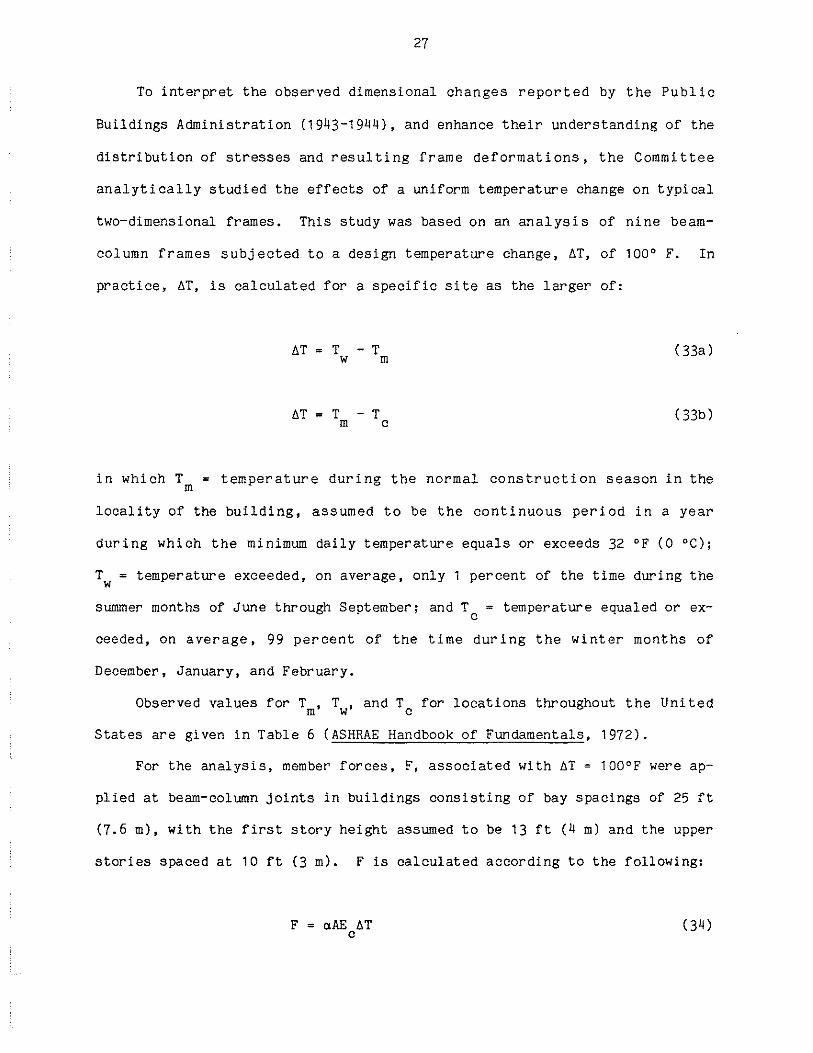
To interpret the observed dimensional changes reported by the Public
Buildings Administration (1943-1944), and enhance their understanding of the
distribution of stresses and resulting frame deformations, the Committee
analytically studied the effects of a uniform temperature change on typical
two-dimensional frames. This study was based on an analysis of nine beam-
column frames subjected to a design temperature change, 6T, of 100° F. In
practice, 6T, is calculated for a specific site as the larger of:
6T T - T w m ( 33a)
6T T - T m c ( 33b)
in which T = temperature during the normal construction season in the m
locality of the building, assumed to be the continuous period in a year
during which the minimum daily temperature equals or exceeds 32 °F (0 °C);
Tw = temperature exceeded, on average, only 1 percent of the time during the
summer months of June through September; and T = temperature equaled or exc
ceeded, on average, 99 percent of the time during the winter months of
December, January, and February.
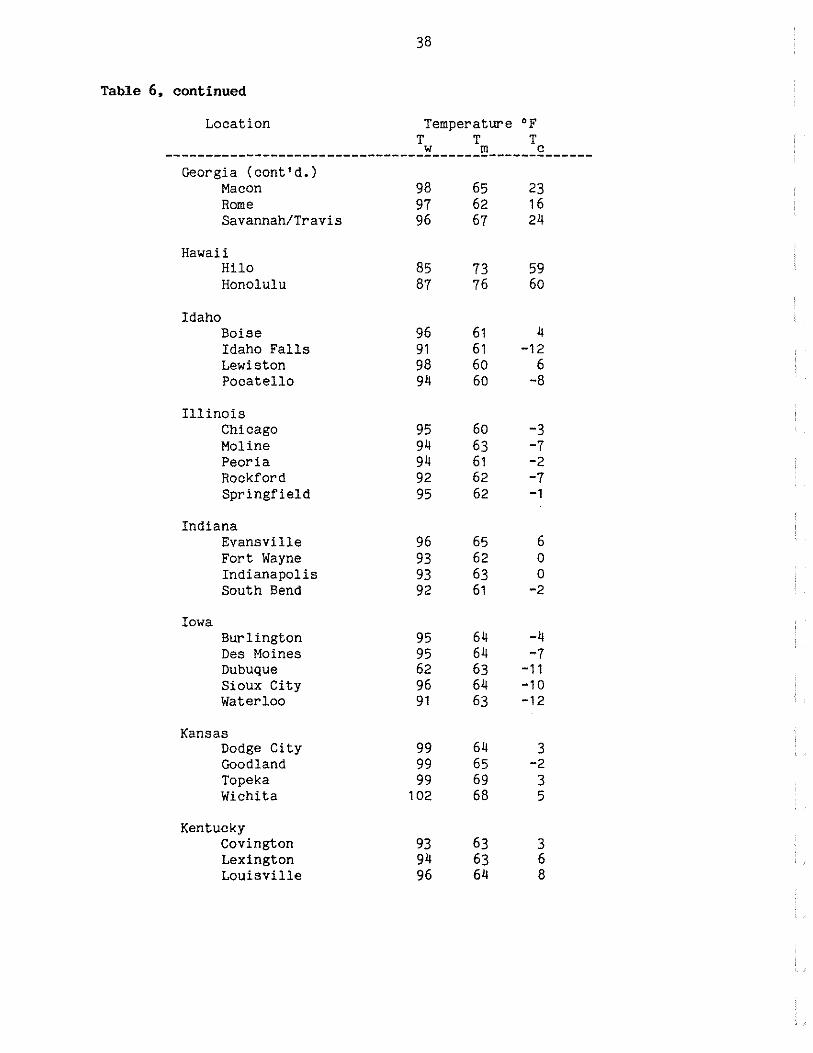
Observed values for T , T , and T0
for locations throughout the United m w
States are given in Table 6 (ASHRAE Handbook of Fundamentals, 1972).
For the analysis, member forces, F, associated with 6T = 100°F were ap-
plied at beam-column joints in buildings consisting of bay spacings of 25 ft
(7.6 m), with the first story height assumed to be 13 ft (4 m) and the upper
stories spaced at 10 ft (3m). F is calculated according to the following:
F = aAE 6T c
(34)
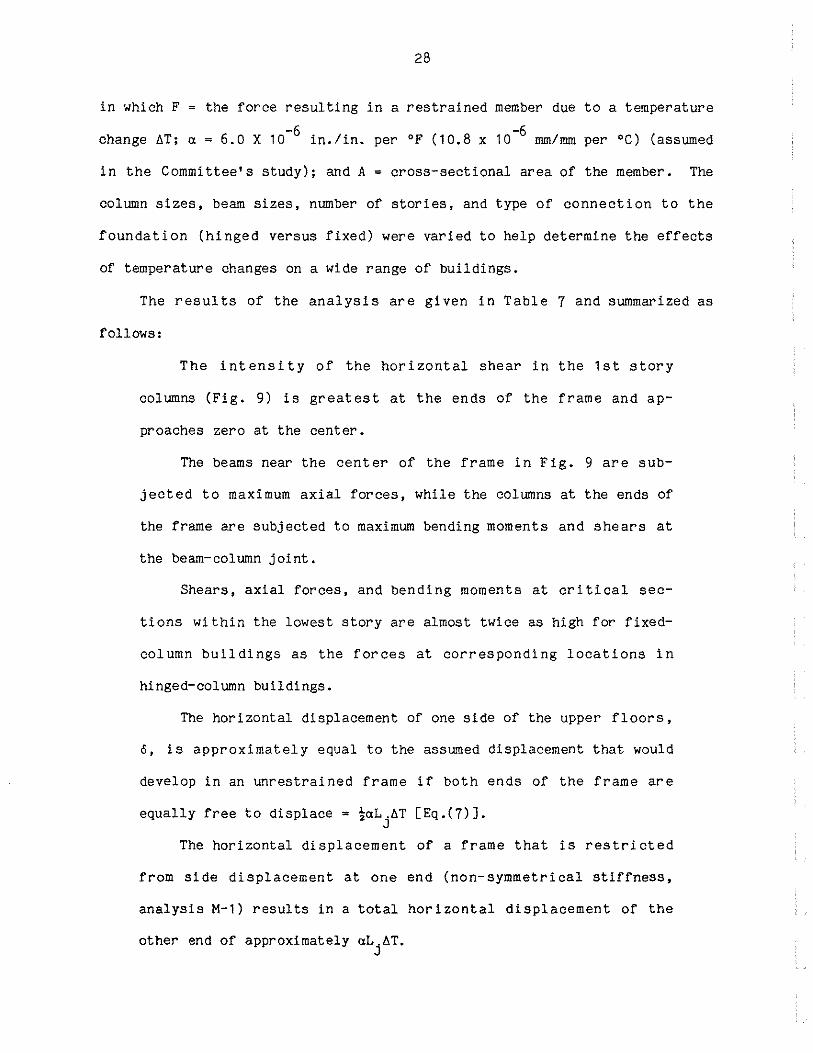
28
in which F the force resulting in a restrained member due to a temperature
change ~T; -6 ~ a = 6.0 X 10 in./in. per •F (10.8 x 10 mm/mm per •c) (assumed
in the Committee's study); and A= cross-sectional area of the member. The
column sizes, beam sizes, number of stories, and type of connection to the
foundation (hinged versus fixed) were varied to help determine the effects
of temperature changes on a wide range of buildings.
The results of the analysis are given in Table 7 and summarized as
follows:
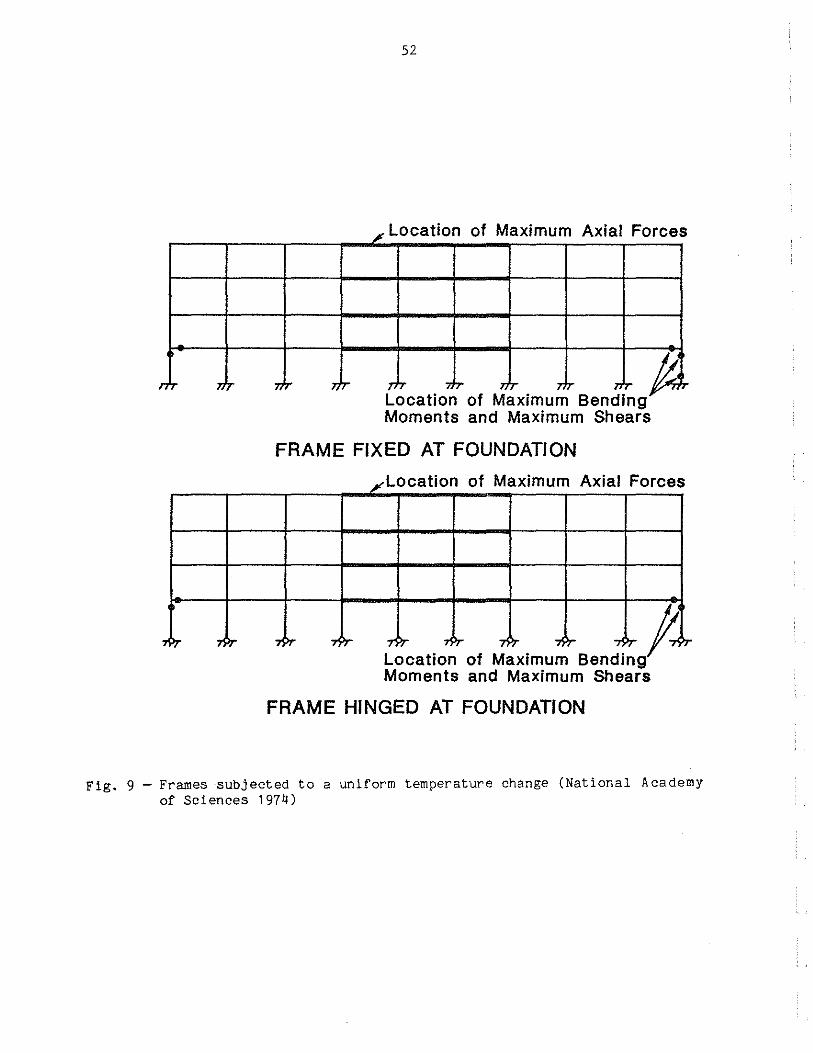
The intensity of the horizontal shear in the 1st story
columns (Fig. 9) is greatest at the ends of the frame and ap-
preaches zero at the center.
The beams near the center of the frame in Fig. 9 are sub-
jected to maximum axial forces, while the columns at the ends of
the frame are subjected to maximum bending moments and shears at
the beam-column joint.
Shears, axial forces, and bending moments at critical sec-
tions within the lowest story are almost twice as high for fixed-
column buildings as the forces at corresponding locations in
hinged-column buildings.
The horizontal displacement of one side of the upper floors,
o, is approximately equal to the assumed displacement that would
develop in an unrestrained frame if both ends of the frame are
equally free to displace= ~aL.~T [Eq.(7)]. J
The horizontal displacement of a frame that is restricted
from side displacement at one end (non-symmetrical stiffness,
analysis M-1) results in a total horizontal displacement of the
other end of approximately aLj~T.
29
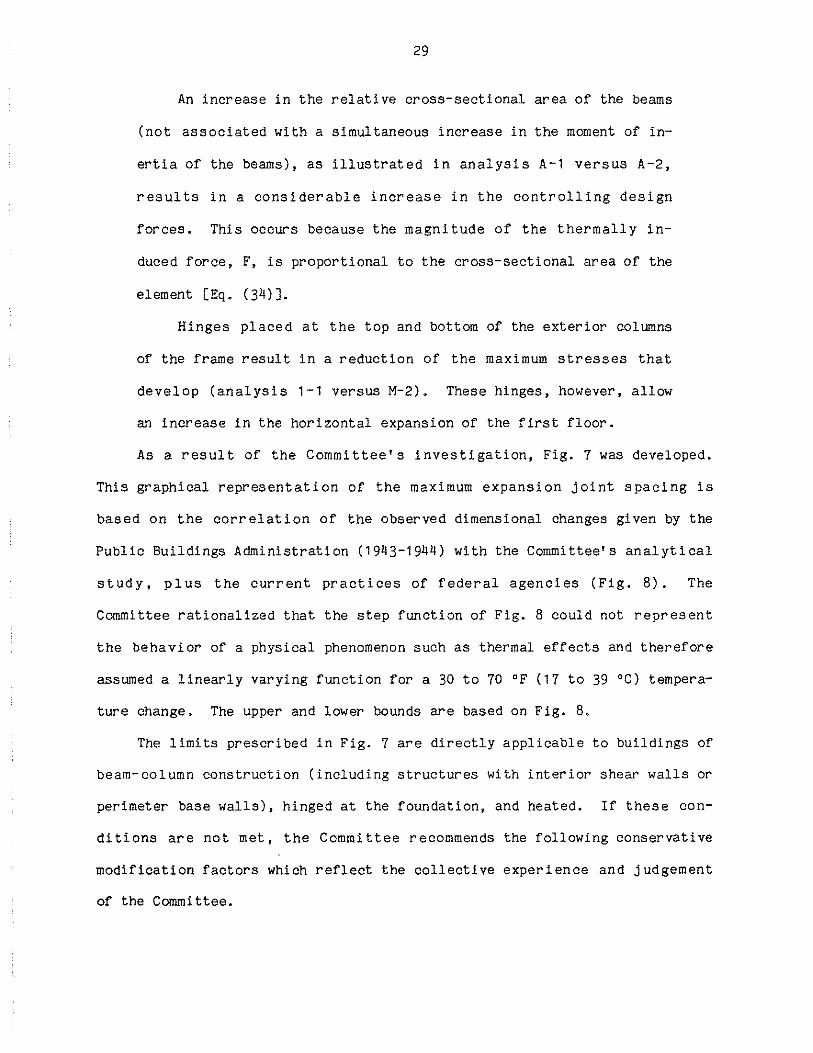
An increase in the relative cross-sectional area of the beams
(not associated with a simultaneous increase in the moment of in
ertia of the beams), as illustrated in analysis A-1 versus A-2,
results in a considerable increase in the controlling design
forces. This occurs because the magnitude of the thermally in
duced force, F, is proportional to the cross-sectional area of the
element [Eq. (34)].
Hinges placed at the top and bottom of the exterior columns
of the frame result in a reduction of the maximum stresses that
develop (analysis 1-1 versus M-2). These hinges, however, allow
an increase in the horizontal expansion of the first floor.
As a result of the Committee's investigation, Fig. 7 was developed.
This graphical representation of the maximum expansion joint spacing is
based on the correlation of the observed dimensional changes given by the
Public Buildings Administration (1943-1944) with the Committee's analytical
study, plus the current practices of federal agencies (Fig. 8). The
Committee rationalized that the step function of Fig. 8 could not represent
the behavior of a physical phenomenon such as thermal effects and therefore
assumed a linearly varying function for a 30 to 70 °F (17 to 39 °C) tempera
ture change. The upper and lower bounds are based on Fig. 8.
The limits prescribed in Fig. 7 are directly applicable to buildings of
beam-column construction (including structures with interior shear walls or
perimeter base walls), hinged at the foundation, and heated. If these con
ditions are not met, the Committee recommends the following conservative
modification factors which reflect the collective experience and judgement
of the Committee.
30
If the building will be heated only and have hinged column
bases, use the length specified.
If the building will be air-conditioned as well as heated, in-
crease the allowable length by 15 percent.
If the building will be unheated, decrease the allowable
length by 33 percent.
If the building will have fixed column bases, decrease the al-
lowable length by 15 percent.
If the building will have substantially greater stiffness
against lateral displacement at one end of the structure, decrease
the allowable length by 25 percent.
When one or more of these conditions occur, the total modification factor is
the algebraic sum of the individual adjustment factors that apply.
Discussion--The Federal Construction Council Committee does not recom-
mend their procedure for all situations. Particularly, when a generic
representation is not adequate for a unique structure or when the empirical
approach provides a solution that professional judgement indicates is too
conservative, a detailed analysis should be performed. This analysis should
recognize the amount of lateral deformation that can be tolerated, and the
structure should be designed so that this limit is not exceeded.
REFERENCES
ACI Committee 22~, 198~, Control of Cracking in Concrete Structures (ACI 22~R-80) (Revised 198~), American Concrete Institute, Detroit, Michigan, ~3 pp.
ACI Committee 311, 1981, ACI Manual of Concrete Inspection, Sixth Edition, ACI Publication SP-2, Detroit, Michigan, 508 pp.
ACI Committee 318, 1983, Building Code Requirements for Reinforced Concrete (ACI 318-83), American Concrete Institute, Detroit, Michigan, 111 pp.
31
ACI Committee 350, 1983, "Concrete Sanitary Engineering Structures (ACI 350R-83)," ACI Journal, Proceedings, v. 80, No.6, Nov.-Dec., pp. 467-486.
Billig, Kurt, 1960, "Expansion Joints," Structural Concrete, London, McMillan and Co., Ltd., pp. 962-965.
Crane, T., 1956, Architectural Construction, The Choice of Structural Design, Second Edition, John Wiley and Sons, Inc., New York, 433 pp.
Fintel, Mark, 1974, "Joints in Buildings," Handbook of Concrete Engineering, New York, New York, VanNostrand Reinhold Company, pp. 94-110.
Gray, David C., and Darwin, David, 1984, "Expansion and Contraction Joints in Reinforced Concrete Buildings - An Annotated Bibliography," SM Report No. 14, University of Kansas Center for Research, Lawrence, KS, December, 43 pp.
Gogate, Anand B., 1984, "An Analysis of ACI Committee 350's Recommended Design Standards," Concrete International: Design and Construction, V. 6, No. 10, Oct., pp. 17-20.
Hunter, L. E., 1953, "Construction and Expansion Joints for Concrete, 11 Civil Engineering and Public Works Review, V. 48, No. 560, February, pp. 157-158, and V. 48, No. 561, Mar., pp. 263-265.
Indian Standards Institution, 1964, IS 456-1964, Code of Practice for Plain and Reinforced Concrete, Second Revision, New Delhi.
Lewerenz, A.C., 1907, "Notes on Expansion and Contraction of Concrete Structures," Engineering News, V. 57, No. 19, May 9, pp. 512-514.
Mann, 0. Clarke, 1970, "Expansion-Contraction Joint Locations in Concrete Structures," Designing for the Effects of Creep, Shrinkage, and Temperature in Concrete Structures, SP-27, American Concrete Institute, Detroit, Michigan, pp. 301-322.
Martin, Ignacio, 1970, "Effect of Environmental Conditions on Thermal Variations and Shrinkage of Concrete Structures in the United States," Designing for the Effects of Creep, Shrinkage, and Temperature in Concrete Structures, SP-27, American Concrete Institute, Detroit, Michigan, pp. 279-300.
Martin, Ignacio and Acosta, Jose, 1970, "Effect of Thermal Variations and Shrinkage on One Story Reinforced Concrete Buildings," Designing for the Effects of Creep, Shrinkage, and Temperature in Concrete Structures, SP-27, American Concrete Institute, Detroit, Michigan, pp. 229-240.
Merril, W.S., 1943, "Prevention and Control of Cracking in Reinforced Concrete Buildings," Engineering News Record, V. 131, No. 23, Dec., 16, pp. 91-93.
National Academy of Sciences, 1974, "Expansion Joints in Buildings," Technical Report No. 65, Washington, D.C., 43 pp.
32
Portland Cement Association, 1982, Building Movements and Joints, Skokie, Illinois, 64 pp.
Reynolds, C.E., 1960, Reinforced Concrete Designer's Handbook, Sixth Edition, Concrete Publications Limited, London.
Rice, Paul F., 1984, "Structural Design of Concrete Sanitary Structures," Concrete International: Design and Construction, V. 6, No. 10, Oct., pp. 14-16.
Varyani, V.H., and Radhaji, A., 1978, "Analysis of Long Concrete Buildings for Temperature and Shrinkage Effects," Journal of the Institution of Engineers (India), V. 59, Part CI 1, July, pp. 20-30.
Wood, Roger H., 1981, "Joints in Sanitary Engineering Structures," Concrete International: Design and Construction, V. 3, No. 4, Apr., pp. 53-56.
33
Table 1 - Contraction joint spacings
Author
Merrill (1943)
Fintel (1974)
Wood (1981)
PCA (1982)
ACI 350R-83 (1983)
ACI 224R-80 (Revised 1984)
Contraction Joint Spacing
20 ft for walls with frequent openings, 25 ft. in solid walls
* 15 to 20 ft for walls and slabs on grade
20 to 30 ft for walls
20 to 25 ft for walls depending on number of openings
30 ft in sanitary structures
one to three times the height of the wall in solid walls
* Recommends joint placement at abrupt changes in plan and at changes in building height to account for potential stress concentrations. 1 ft = 0. 305 m
Table 2 - Contraction joint spacings for sanitary engineering structures based on reinforcement percentage (Rice 1984)
Contraction joint spacing in ft.
less than 30
30 - 40
40 - 50
greater than 50
Minimum percentage of shrinkage and temperature reinforcement* Grade 40 Grade 60
.30
.40
.50
.60
.25
.30
.38
.45
* minimum temperature and shrinkage reinforcement should be #5 (16 mm) bars or D-31 (200 mm 2
) wire, 12 in. (0.305 m) on center each face. 1 ft = 0.305 m; Grade 40 = 276 MPa; Grade 60 = 413 MPa.
34
Table 3-Expansion joint spacings
Author Expansion Joint Spacing
Lewerenz (1907) 75 ft for walls
Hunter (1953) 80 ft for walls and insulated roofs 30 to 40 ft for uninsulated roofs
Billig (1960)
Wood (1981)
* 100 ft maximum building length without joints
Indian Standards (1964) Institution
PCA (1982)
ACI 350R-83
* Recommends joint placement building height to account 1 ft = 0.305 m
100 to 120 ft for walls
45 m (approx. 148 ft) maximum building length between joints
200 ft maximum building length without joints
120 ft in sanitary structures partially filled with liquid (closer) spacings required when no liquid present)
at abrupt changes in plan and at changes in for potential stress concentrations.
Table 4-Beam-column frame geometry used for temperature and vertical load analysis (Hartin and Acosta 1970)
Beam Square column Width Depth Span Side Height
Structure Type in. in. ft in. ft ----------------------------------------------------------------
A 14 20 20 14 12 B 14 20 20 14 20 c 14 20 20 18 12 D 1 4 20 20 18 20
E 14 20 30 14 12 F 14 20 30 14 20 G 14 20 30 18 12 H 14 20 30 18 20
I 14 30 30 1 4 12 J 14 30 30 14 20 K 14 30 30 18 12 L 14 30 30 18 20
in. = 25.4 mm; 1 ft 0.305 m
35
Table 5-Maximum and minimum daily temperatures for given locations (Martin and Acosta 1970)
Normal daily temperatures °F Location
Anchorage, Alaska Atlanta, Ga. Boston, Mass. Chicago, IlL Dallas, Tex. Denver, Colo. Detroit, Mich. Honolulu, Hawaii Jacksonville, Fla. Los Angeles, Calif. Miami, Fla. Milwaukee, ·wis. New Orleans, La. New York, N.Y. Phoenix, Ariz. Pittsburgh, Pa. San Fransisco, ·calif. San Juan, P.R. Seattle, Wash. St. Louis, Mo. Tulsa, Okla.
Maximum Minimum
66.0 87.0 81.9 84. 1 95.0 88.4 84.7 85.2 92.0 75.9 89.7 78.9 90.7 85.3
104.6 83.3 73.8 85.5 75;6 89;2 93. 1
4.3 37.1 23.0 19.0 36.0 1 4.8 19. 1 65.8 45.0 45;0 57.9 12.8 44.8 26.4 35.3 20.7 41.7 70.0 33.0 23.5 26.5
Temperature in C = i(Temperature in F-32)
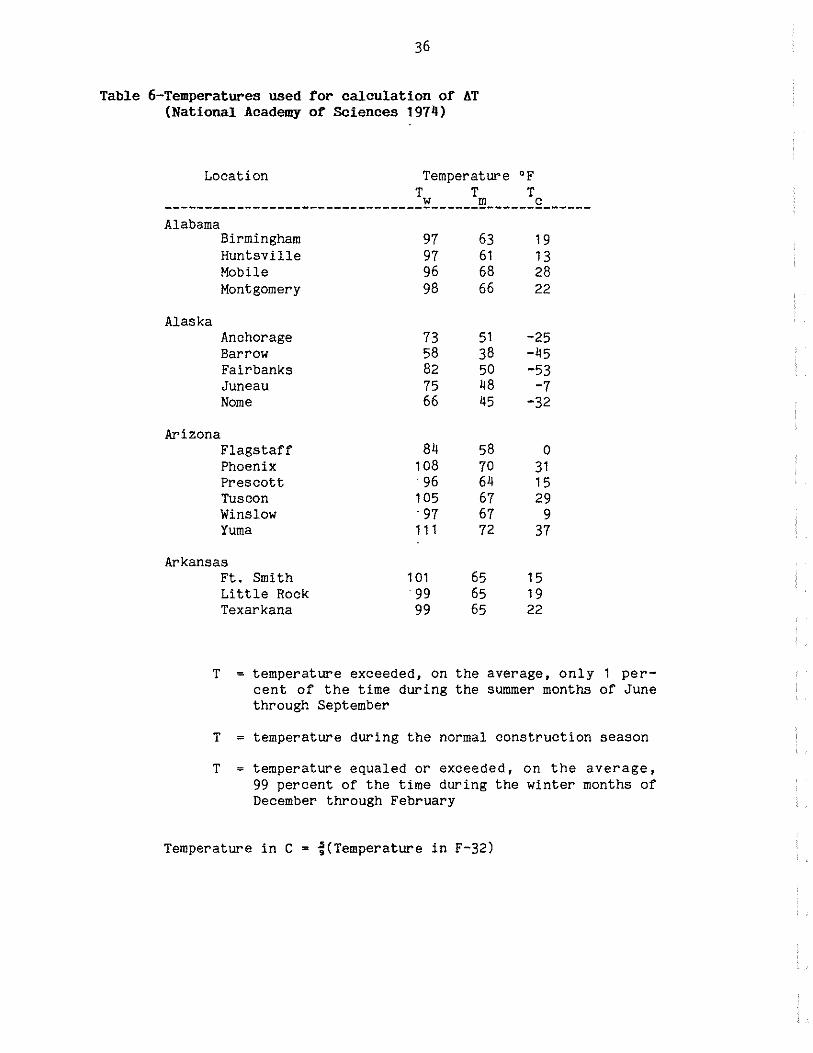
Table 6-Temperatures used for calculation of AT (National Academy of Sciences 1974)
Location Temperature °F T T T
--------------------------------~------~------2------Alabama
Birmingham 97 63 19 Huntsville 97 61 13 Mobile 96 68 28 Montgomery 98 66 22
Alaska Anchorage 73 51 -25 Barrow 58 38 -45 Fairbanks 82 50 -53 Juneau 75 48 -7 Nome 66 45 -32
Arizona Flagstaff 84 58 0 Phoenix 108 70 31 Prescott 96 64 15 Tuscon 105 67 29 Winslow •97 67 9 Yuma 111 72 37
Arkansas Ft. Smith 101 65 15 Little Rock 99 65 19 Texarkana 99 65 22
T ~ temperature exceeded, on the average, only 1 percent of the time during the summer months of June through September
T = temperature during the normal construction season
T = temperature equaled or exceeded, on the average, 99 percent of the time during the winter months of December through February
Temperature in C = ~(Temperature in F-32)
37
Table 6, continued
Location Temperature °F T T T
--------------------------------~------~------2 ______ California
Bakersfield 103 65 31 Burbank 97 64 36 Eureka/ Arcata 67 52 32 Fresno 1 01 63 28 Long Beach 87 63 41 Los Angeles 94 62 41 Oakland 85 57 35 Sacramento 100 60 30 San Diego 86 62 42 San Fransisco 83 56 35 Santa Maria 85 57 32
Colorado Alamosa 84 60 -17 Colorado Springs 90 61 •1 Denver 92 62 -2 Grand Junction 96 64 8 Pueblo 96 64 -5
Connecticut Bridgeport 90 60 4 Hartford 90 61 1 New Haven 88 59 5
Delaware Wilmington 93 62 12
Florida Daytona Beach 94 70 32 Ft. Myers 94 74 38 Jacksonville 96 68 29 Key West 90 77 55 Lakeland 95 72 35 Miami 92 75 44 Miami Beach 91 75 45 Orlando 96 72 33 Pensacola 92 68 29 Tallahassee 96 68 25 Tampa 92 72 36 West Palm Beach 92 75 40
Georgia Athens 96 61 17 Atlanta 95 62 18 Augusta 98 64 20 Columbus 98 65 23
38
Tab1e 6, continued
Location Temperature °F T T T
--------------------------------~------~------2 ______ Georgia (cont'd.)
Macon 98 65 23 Rome 97 62 16 Savannah/Travis 96 67 24
Hawaii Hilo 85 73 59 Honolulu 87 76 60
Idaho Boise 96 61 4 Idaho Falls 91 61 -12 Lewiston 98 60 6 Pocatello 94 60 -8
Illinois Chicago 95 60 -3 Moline 94 63 -7 Peoria 94 61 -2 Rockford 92 62 -7 Springfield 95 62 -1
Indiana Evansville 96 65 6 Fort Wayne 93 62 0 Indianapolis 93 63 0 South Bend 92 61 -2
Iowa Burlington 95 64 -4 Des Moines 95 64 -7 Dubuque 62 63 -11 Sioux City 96 64 -10 Waterloo 91 63 -12
Kansas Dodge City 99 64 3 Goodland 99 65 -2 Topeka 99 69 3 Wichita 102 68 5
Kentucky Covington 93 63 3 Lexington 94 63 6 Louisville 96 64 8

39
Table 6, continued Location Temperature °F
T T T --------------------------------~------~------2 _____ _
Louisiana
Maine
Baton Rouge Lake Charles New Orleans Shreveport
Caribou Portland
Maryland Baltimore Frederick
Massachusetts Boston Pittsfield Worcester
Michigan Alpena Detroit-Metro Escanaba Flint Grand Rapids Lansing Marquette Muskegon Sault Ste Marie
Minnesota Duluth International Falls Minneapolis/St. Paul Rochester St. Cloud
Mississippi Jackson Meridian Vicksburg
Missouri Columbia Kansas City St. Joseph St. Louis Springfield
96 95 93 99
85 88
94 94
91 86 89
87 92 82 89 91 89 88 87 83
85 86 92 90 90
98 97 97
97 100
97 98 97
68 68 69 66
56 58
63 63
58 58 58
57 58 55 60 62 59 55 59 55
55 57 62 60 60
66 65 66
65 65 66 65 64
25 29 32 22
-18 .;.5
12 7
6 -5 -3
-5 4
-7 -1
2 2
-8 4
-12
-19 -29 -14 -17 -20
21 20 23
2 4
-1 4 5

40
Table 6. continued Location Temperature °F
T T T --------------------------------~------~------2 ______
Montana Billings 94 60 -10 Glasgow 96 60 -25 Great Falls 91 58 -20 Havre 91 58 -22 Helena 90 58 -17 Kalispell 88 56 -7 Miles City 97 62 -19 Missoula 92 58 -7
Nebraska Grand Island 98 65 -6 Lincoln 100 64 -4 Norfolk 97 64 -11 North Platte 97 64 -6 Omaha 97 64 -5 Scottsbluff 96 62 -8
Nevada Elko 94 61 -13 Ely 90 59 '-6 Las Vegas 108 66 23 Reno 95 62 2 Winnemucca 97 63 1
New Hampshire Concord 91 60 -11
New Jersey Atlantic City 91 61 14 Newark 94 62 11 Trenton 92 61 12
New Mexico Albuquerque 96 64 14 Raton 92 64 -2 Roswell 101 70 16
New York Albany 91 61 -5 Binghampton 91 67 -2 Buffalo 88 59 3 New York 94 59 11 Rochester 91 59 2 Syracuse 90 59 -2
41
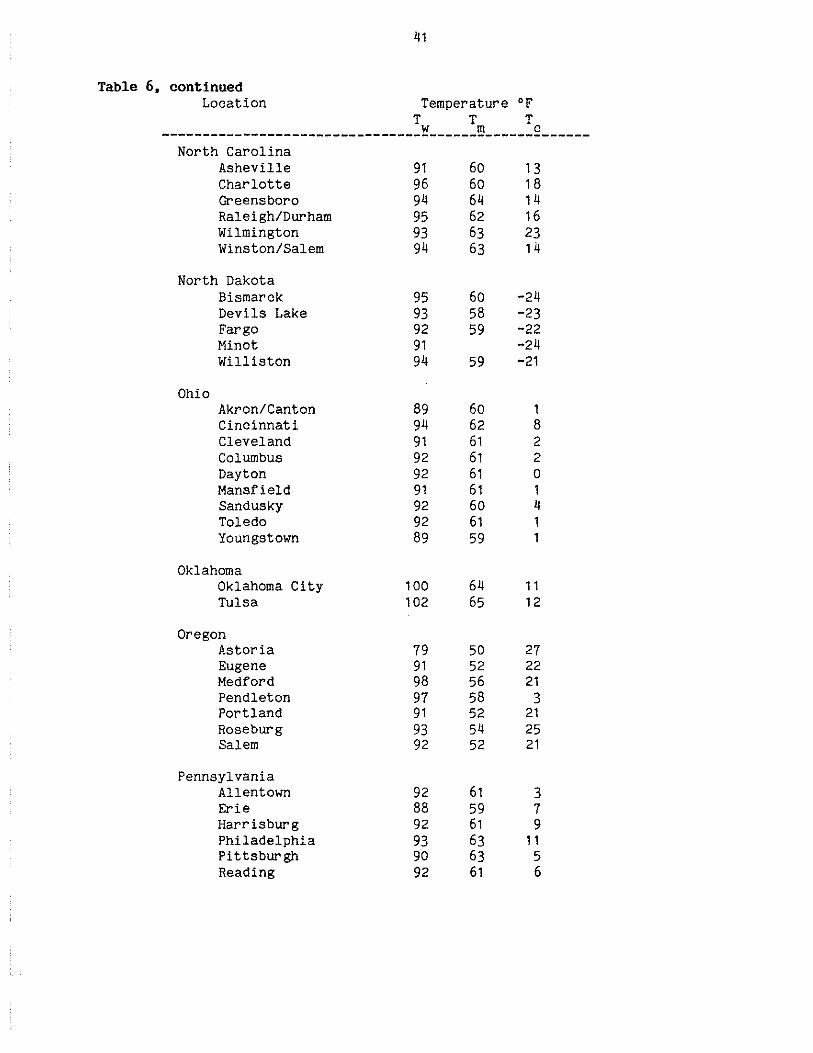
Table 6, continued Location Temperature °F
T T T --------------------------------~------~------2------
North Carolina Asheville 91 60 13 Charlotte 96 60 1 8 Greensboro 94 64 14 Raleigh/Durham 95 62 16 Wilmington 93 63 23 Winston/Salem 94 63 14
North Dakota Bismarck 95 60 -24 Devils Lake 93 58 -23 Fargo 92 59 -22 Minot 91 -24 Williston 94 59 -21
Ohio Akron/Canton 89 60 1 Cincinnati 94 62 8 Cleveland 91 61 2 Columbus 92 61 2 Dayton 92 61 0 Mansfield 91 61 1 Sandusky 92 60 4 Toledo 92 61 1 Youngstown 89 59 1
Oklahoma Oklahoma City 100 64 11 Tulsa 102 65 12
Oregon Astoria 79 50 27 Eugene 91 52 22 Medford 98 56 21 Pendleton 97 58 3 Portland 91 52 21 Roseburg 93 54 25 Salem 92 52 21
Pennsylvania Allentown 92 61 3 Erie 88 59 7 Harrisburg 92 61 9 Philadelphia 93 63 11 Pittsburgh 90 63 5 Reading 92 61 6
42
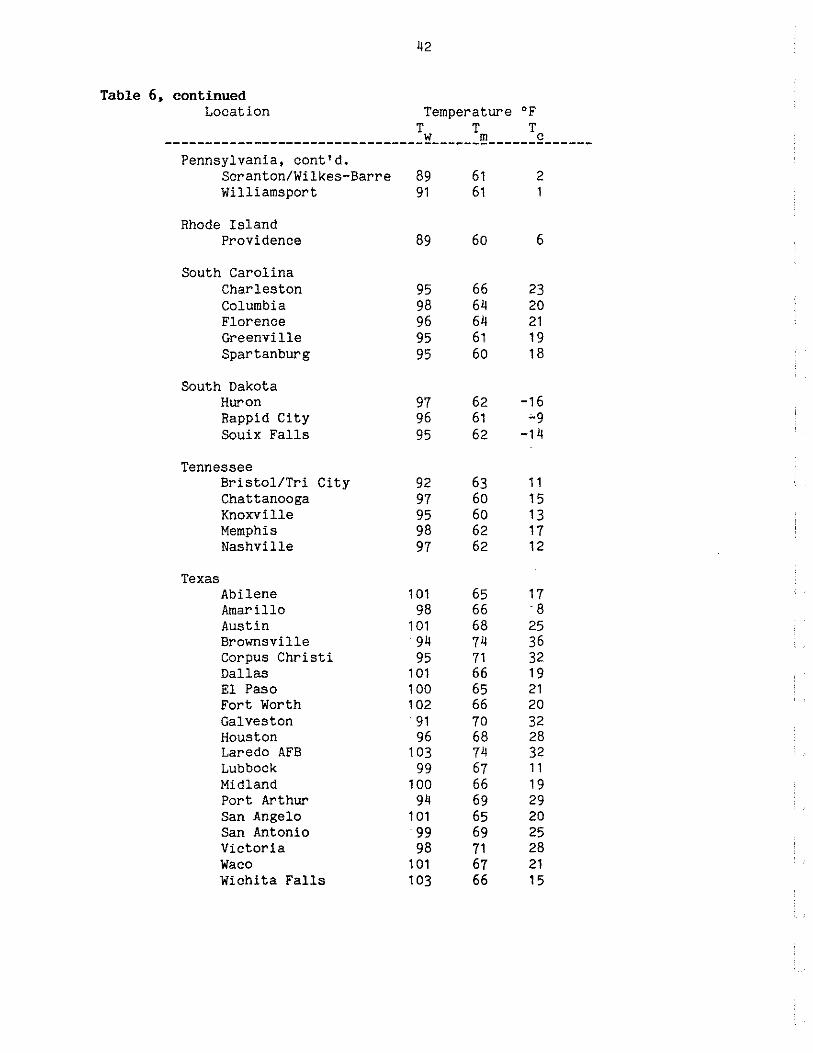
Table 6, continued Location Temperature °F
-------------------------------~~-----~~-----:2 _____ _ Pennsylvania, cont'd.
Scranton/Wilkes-Barre Williamsport
Rhode Island Providence
South Carolina Charleston Columbia Florence Greenville Spartanburg
South Dakota Huron Rappid City Souix Falls
Tennessee
Texas
Bristol/Tri City Chattanooga Knoxville Memphis Nashville
Abilene Amarillo Austin Brownsville Corpus Christi Dallas El Paso Fort Worth Galveston Houston Laredo AFB Lubbock Midland Port Arthur San Angelo San Antonio Victoria Waco Wichita Falls
89 91
89
95 98 96 95 95
97 96 95
92 97 95 98 97
101 98
101 94 95
101 100 102
91 96
103 99
100 94
101 99 98
101 103
61 61
60
66 64 64 61 60
62 61 62
63 60 60 62 62
65 66 68 74 71 66 65 66 70 68 74 67 66 69 65 69 71 67 66
2 1
6
23 20 21 19 18
-16 -9
-14
11 15 13 17 12
17 8
25 36 32 19 21 20 32 28 32 11 19 29 20 25 28 21 15
43
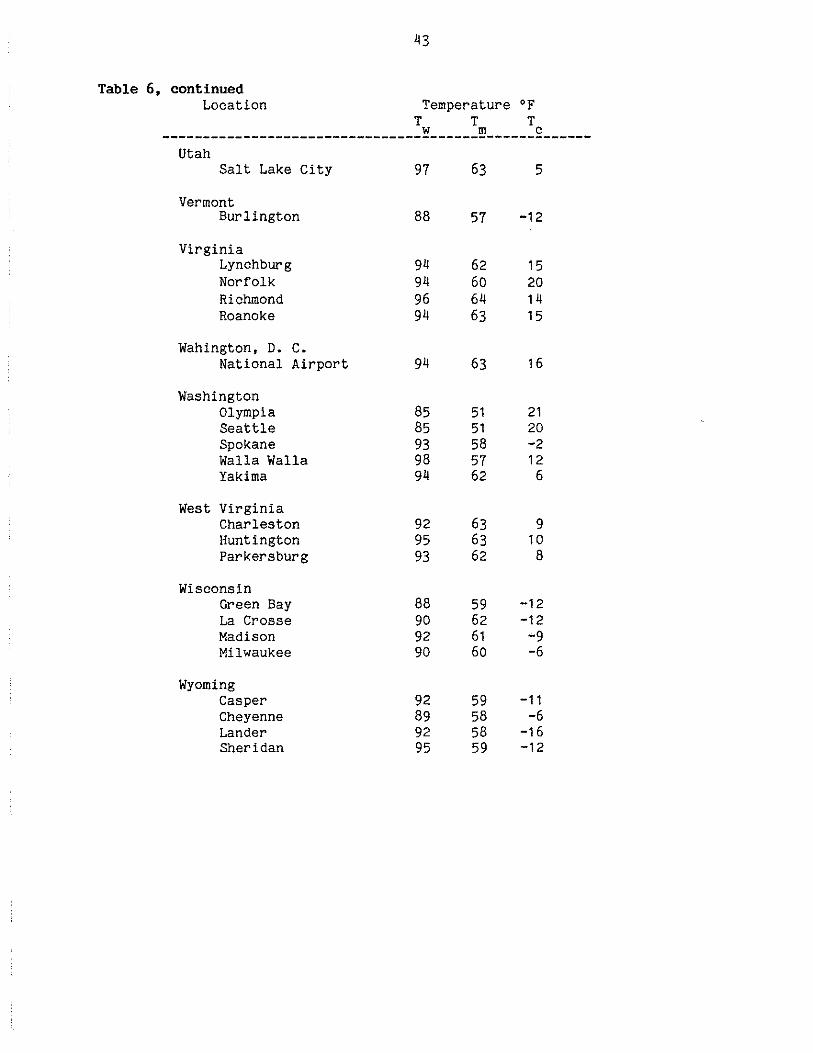
Table 6, continued Location Temperature °F
T T T --------------------------------~------~------2------
Utah Salt Lake City 97 63 5
Vermont Burlington 88 57 -12
Virginia Lynchburg 94 62 15 Norfolk 94 60 20 Richmond 96 64 14 Roanoke 94 63 15
Wahington, D. c. National Airport 94 63 16
Washington Olympia 85 51 21 Seattle 85 51 20 Spokane 93 58 -2 Walla Walla 98 57 12 Yakima 94 62 6
West Virginia Charleston 92 63 9 Huntington 95 63 10 Parkersburg 93 62 8
Wisconsin Green Bay 88 59 -12 La Crosse 90 62 -12 Madison 92 61 -9 Milwaukee 90 60 -6
Wyoming Casper 92 59 -11 Cheyenne 89 58 -6 Lander 92 58 -16 Sheridan 95 59 -12
44
Table 7-Results of Temperature Analysis (National Academy of Sciences 1974)
( 1 ) ( 2) Beam Anal. Col. Beam Base Total No. Max.
No.· Size Size Type Length Flrs. Moment in. in. 2 ft. in.-kips
Column Max. Max. Max.
Axial Load Moment Shear kips in.-kips kips
----------------------------------------------------------------------------1-1 24 280
2-1 24 280
3-1 16 280
4-1 16 280
A-1 24 280
A-2 24 1000
B-1 24 280
M-1 24 280
M-2 24 280
F 200
H 200
F 200
H 200
F 200
F 200
F 400
F 200
F 200
3
3
3
3
2
2
2
3
3
70
45
53
25
70
128
100
50
(1) Column size= one side of a square column.
135
77
70
25
182
321
280
253
138
600
250
170
75
570
750
840
740
500
69
19
22
6
67
95
90
83
60
(2) Beam size = cross-sectional area. Moment of inertia about the vertical axis= 4667 in.• for all cases.
M-1 analysis includes columns at one end of the frame substantially stiffer than the rest of the columns.
M-2 analysis includes hinges placed at the top and bottom of the exterior columns.
F columns fixed at the foundation.
H columns hinged at the foundation.
1 in. = 25.4 mm; 1 ft = 0.305 in.; 1 in.-kip 113 m-kN; 1 kip= 4.45 kN
45
Fig. 1 -Wall expansion joint cover (courtesy Architectural Art Mfg., Inc.)
Fig. 2- Fire rated filled expansion joint (courtesy Architectural Art Mfg., Inc.)
46
Lj = 112,000
RAT 400
~ --~ ~
...J • tf) -c
0 300 .., c 0
·c;; c cu a. X
UJ 200 c CD CD := -CD (l)
..r:: -0) 100 c CD R=4 ....1
R=5 A
0 0 20 40 60 80 100
Design Temperature Change, T (°F)
Fig. 3 - Length between expansion joints vs. design temperature change, ~T
(Martin & Acosta 1970)(1 ft = 0.305 m.; 1"F = t•c)
47
~Frame
1-l+l+ltl+l+l-1
MULTI-BAY FRAME
1--J----1 Corner Column
ONE BAY SUBSTITUTE
FRAME
Fig. 4- Multi-bay frame and one bay substitute frame (after Varyani & Radhaj i 1978)
Kc
Mt Mg = (2+r' l
• I
K__.... c
48
SINGLE-STORY SINGLE BAY
I •
Mt Mg • (4+r'l
h
MULTI-STORY SINGLE BAY
M f = Beam fixed-end moment
Kb r'- r-1 - K
c
Mt Mg = 2(1+r')
SINGLE-STORY MULTI-BAY
h
h
Mt Mg = 2(2+r')
·I
MULTI-STORY MULTI-BAY
Fig. 5- Moments at base of corner columns due to gravity using one bay substitute frame::: (after Varyani & Radhaji 1978)
49
----------- -I -1 \ Kb I \ I h \ I Kc Kc
6 ( 1+r' ) Mr<base) = 6E0 K0 h 2+r'
SINGLE-STORY SINGLE BAY
6 • I I •
6 • I I •
I I I I I I I I I I I ------- I \(-- -...,.
\ Kb / \ I h
Kc
6 (3+r') Mr<basel = 6E0 Kc h 4+r' MULTI-STORY SINGLE BAY
Kb r' = r-1 = -Kc
6 = ~ aLJ'~~T
SINGLE-STORY MULTI-BAY
6 · I I·
}, • I
I I
h I I I '(" ' Kb
h ' \
6 { 3+2r') Mr<basel = 3E0 K0 h 2+r'
MULTI-STORY MULTI-BAY
Fig. 6 - Moments at base of corner columns due to temperature change using one bay sub-stitute frame, L. = total length between expansion joints (after Varyani & Radhaj1 1978).
50
Rectangular Multi-Framed 600 Configuration with
~ - Symmetrical Stiffness -~ ·-...J • .t:: - Steel Ol 400 c
Q) Non-Rectangular Concrete ...J Ol Configuration c J2 ·:; co 200 Any Material Q)
.0 CCI 3: 0
< 0
0 20 40 60 80 Design Temperature Change, T (°F)
Fig. 7- Expansion joint criteria of the Federal Construction Council (National Academy of Sciences 1974)(1 ft = 0.305 m; 1°F = ~°C)
c: 600 G) G)
S::;:; ........ a>~
all/) .... Q) c: g·o 40o cu.., -II) c: i5 .2
II)
§ ~ E e- 200 ·x w cu :2
51
-
~Unheated Buildings/
/Heated Buildings
-I I I I I I I I I
0 20 40 60 80 Temperature Change (°F)
Fig. 8- Expansion joint criteria of one federal agency (National Academy of Sciences 1974) (1 ft = 0.305 m; 1 °F = i°C)
nr nr
7!>r r.>r
~
7/T nr
52
Location of Maximum Axial Forces
TJT 7Jr nr 7) r . nr ~r . Locat1on of Max1mum Bending Moments and Maximum Shears
FRAME FIXED AT FOUNDATION
7'r -r.>r
Locafon of Ma ·m ;I I XI urn A . I F x1a orces
r>r -r>r -r. ~ 7l >r ~ 'r
Location of Maximum Banding;,. Moments and Maximum Shears
>r
FRAME HINGED AT FOUNDATION
Fig. 9 - Frames ,subjected to a uniform temperature change (National Academy of Sciences 1974)
53
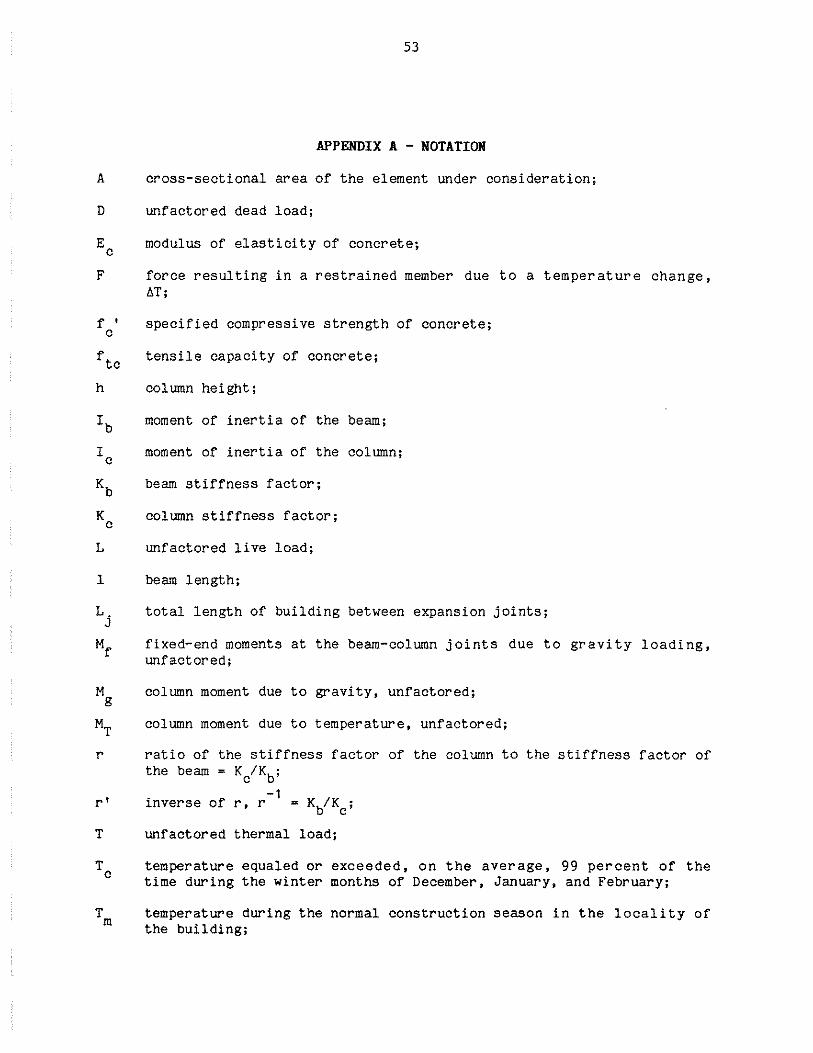
APPENDIX A - NOTATION
A cross-sectional area of the element under consideration;
D unfactored dead load;
Ec modulus of elasticity of concrete;
F force resulting in a restrained member due to a temperature change, aT;
f I
c
L
1
r
r'
T
specified compressive strength of concrete;
tensile capacity of concrete;
column height;
moment of inertia of the beam;
moment of inertia of the column;
beam stiffness factor;
column stiffness factor;
unfactored live load;
beam length;
total length of building between expansion joints;
fixed-end moments at the beam-column joints due to gravity loading, unfactored;
column moment due to gravity, unfactored;
column moment due to temperature, unfactored;
ratio of the beam
the stiffness factor of the column to the stiffness factor of Kc/Kb;
unfactored thermal load;
temperature equaled or exceeded, on the average, 99 percent of the time during the winter months of December, January, and February;
temperature during the normal construction season in the locality of the building;
T max
u
w
54
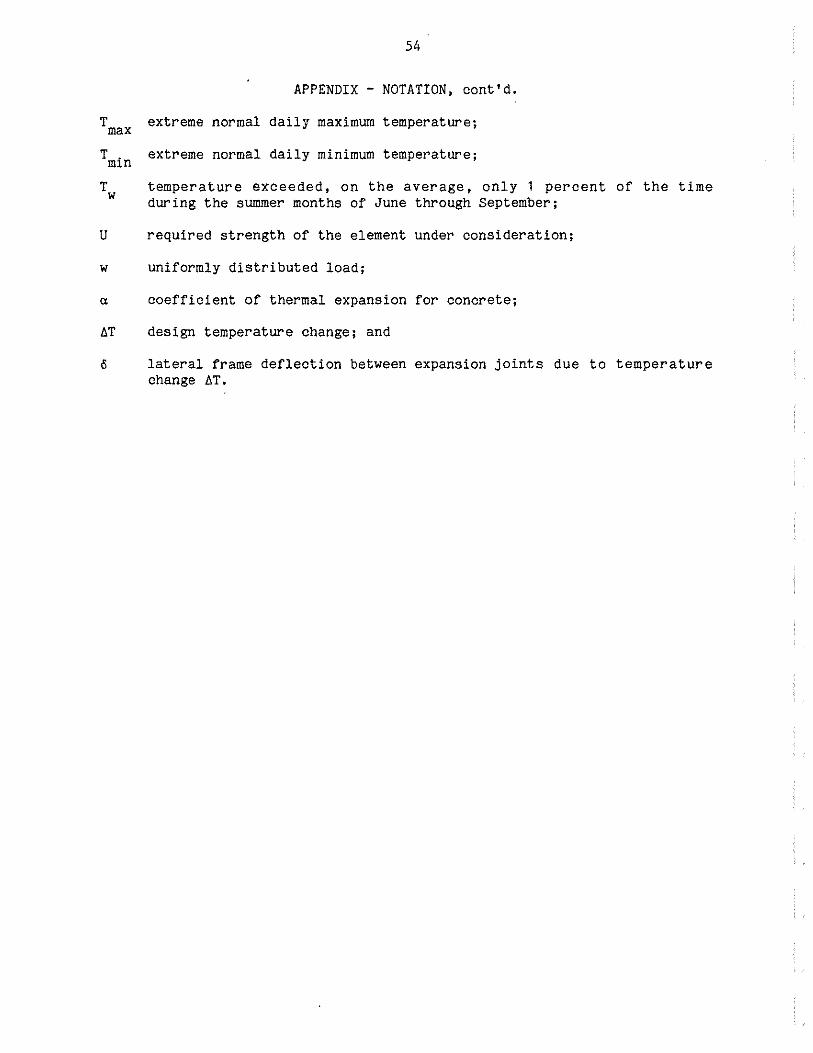
APPENDIX - NOTATION, cont'd.
extreme normal daily maximum temperature;
extreme normal daily minimum temperature;
temperature exceeded, on the average, only 1 percent of the time during the summer months of June through September;
required strength of the element under consideration;
uniformly distributed load;
coefficient of thermal expansion for concrete;
design temperature change; and
lateral frame deflection between expansion joints due to temperature change ~T.
55
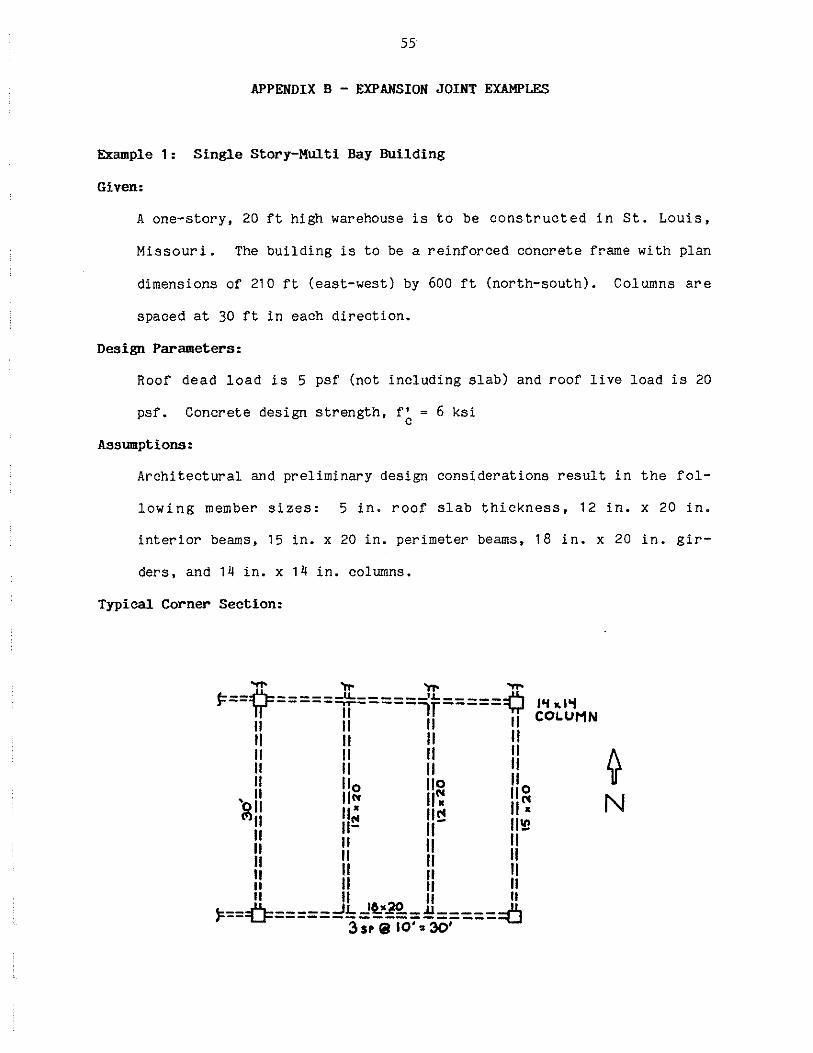
APPENDIX B - EXPANSION JOINT EXAMPLES
Example 1: Single Story-Multi Bay Building
Given:
A one-story, 20 ft high warehouse is to be constructed in St. Louis,
Missouri. The building is to be a reinforced concrete frame with plan
dimensions of 210ft (east-west) by 600ft (north-south). Columns are
spaced at 30 ft in each direction.
Design Parameters:
Roof dead load is 5 psf (not including slab) and roof live load is 20
psf. Concrete design strength, f' = 6 ksi c
Assumptions:
Architectural and preliminary design considerations result in the fol-
lowing member sizes: 5 in. roof slab thickness, 12 in. x 20 in.
interior beams, 15 in. x 20 in. perimeter beams, 18 in. x 20 in. gir-
ders, and 14 in. x 14 in. columns.
Typical Corner Section:
...... "IT" """ -f===)?=======n=======j]======¢ 1'1 "''i II II II 11 COLUMN II II II II II II II II A II II II II 1r ll 11o 112 II o
'oil lfrc 11. 11!'1 N I"> II II~ II !:! II.;
II II- II II-II II II II 11 II 11 II tt II II II II II II II
F--=6=-----.JL...!§..•A-ll-----:::6 -- ------3;,(ii07": 30·---
56
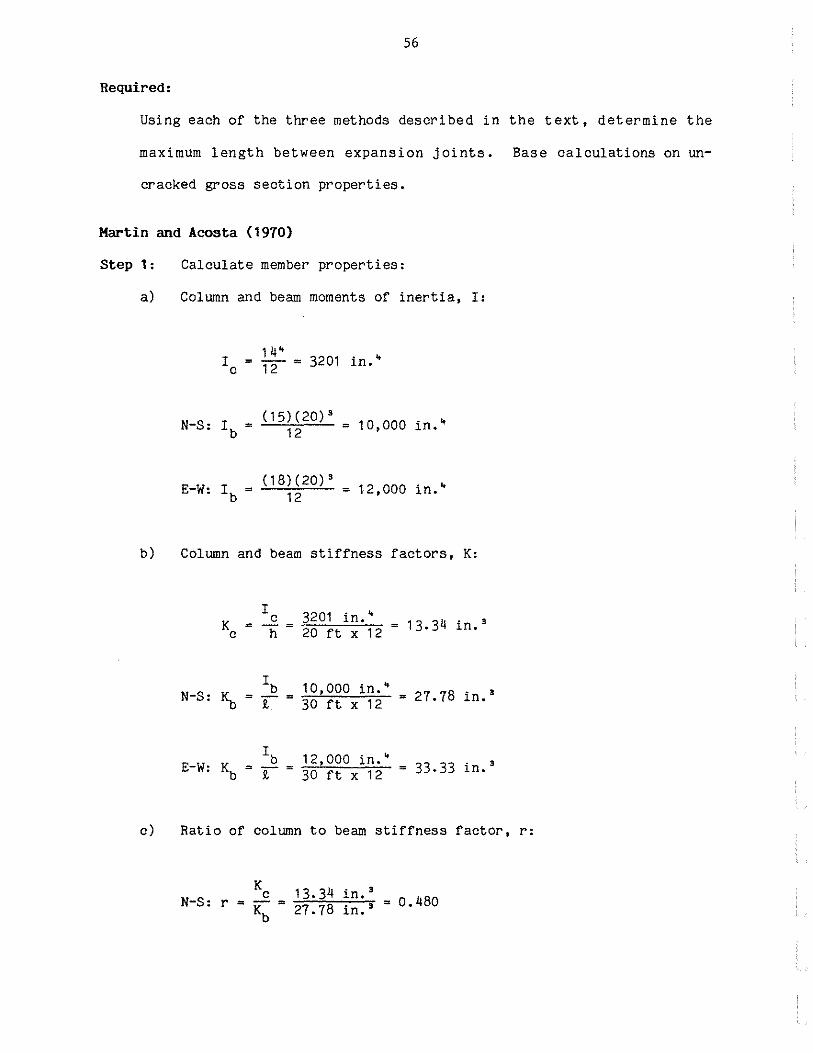
Required:
Using each of the three methods described in the text, determine the
maximum length between expansion joints. Base calculations on un-
cracked gross section properties.
Martin and Acosta (1970)
Step 1: Calculate member properties:
a) Column and beam moments of inertia, I:
14" '1'2 = 3201 in. •
( 15)( 20). 12 = 1 0, 000 in."
(18)(20) 3
E-W: Ib = = 12,000 in.• 12
b) Column and beam stiffness factors, K:
I 3201 in. • K c = 13.34 in. ' =- = 20 ft c h X 12
Ib 10,000 in. • N-S: ~ = 27.78 in. - = i 30 ft X 12
Ib 12,000 in. • E-W: Kb 33.33 in. = r-= 30 ft X 12 =
'
'
c) Ratio of column to beam stiffness factor, r:
N-S: r = Kc 13.34 in.• - = ~~--7'-'-'T = 0. 480 Kb 27.78 in.'
57
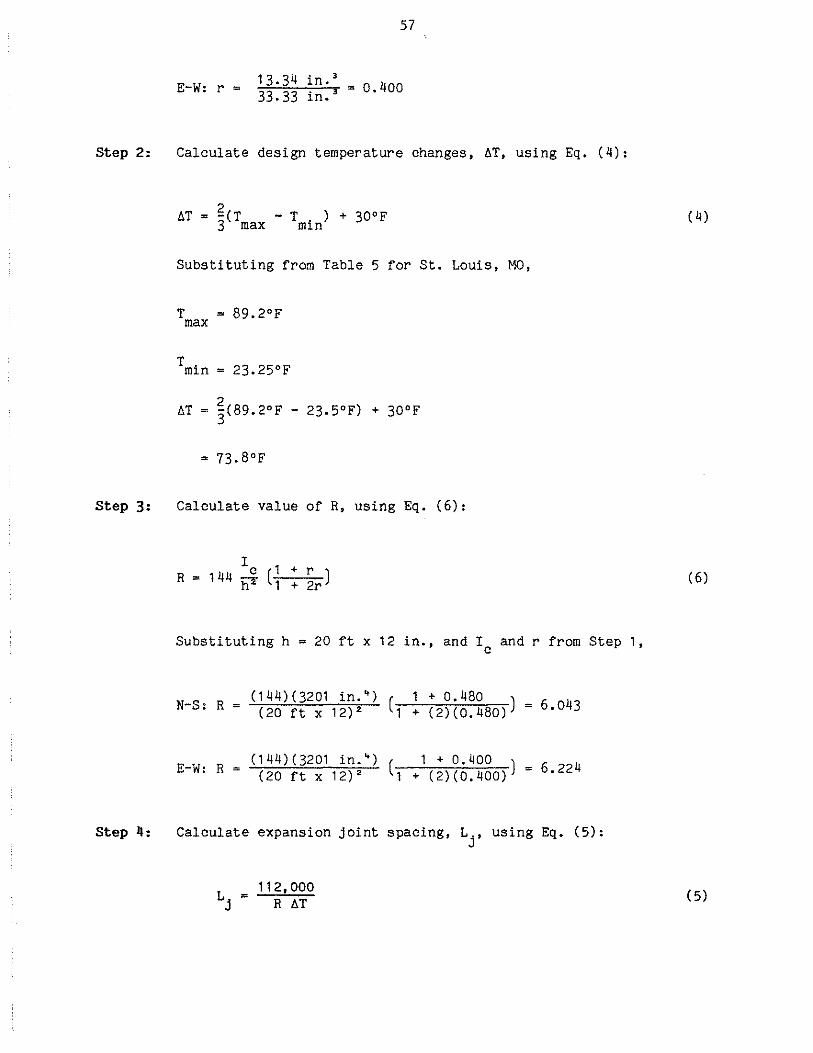
E-W: r 13.34 in.'
= .;,3 3""'.~3;:::-3...:1;..:_ n'-".•• = 0 • 4 0 0
Step 2: Calculate design temperature changes, 6T, using Eq. (4):
Step 3:
6T = g(T - T . ) + 30°F 3 max m1n
Substituting from Table 5 for St. Louis, MO,
T = 89.2°F max
Tmin = 23.25°F
= 73.8°F
Calculate value of R, using Eq. (6):
1c (1 + r )
R = 1 44 tiT 1 + 2r
Substituting h =20ft x 12 in., and Ic and r from Step 1,
N-S: R = (144)(3201 in.') ( 1 + 0.480 ) = (20 ft X 12) 2 1 + (2)(0.480) 6.043
E-W: R (144)(3201 in.') ( 1 + 0.400 ) (20ft X 12) 2 1 + (2)(0.400) 6.224
Step 4: Calculate expansion joint spacing, Lj, using Eq. (5):
112, 000 Lj = R 6T
( 4)
( 6)
( 5)
58
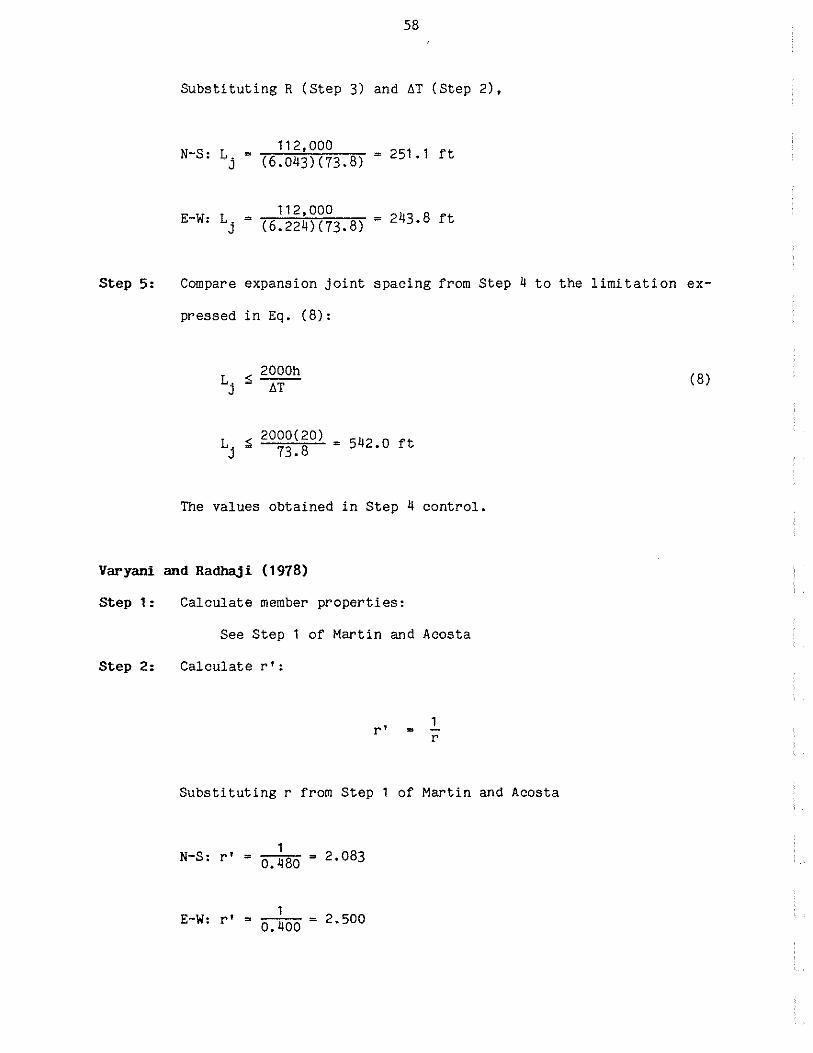
Substituting R (Step 3) and ~T (Step 2),
112,000 (6.043)(73.8) - 251.1 ft
112' 000 E-W: Lj = ( 6•224)( 73 .B) = 243.8 ft
Step 5: Compare expansion joint spacing from Step 4 to the limitation ex-
pressed in Eq. (8):
L .- 2000h j " ~T
L :; 2000(20) = 542.0 ft j 73.8
The values obtained in Step 4 control.
Varyani and Radhaji (1978)
Step 1: Calculate member properties:
See Step 1 of Martin and Acosta
Step 2: Calculate r•:
r' 1 r
Substituting r from Step 1 of Martin and Acosta
N-S: r' 1
= 0.480 = 2.083
1 E-W: r• = ~'-::-:- = 2.500 0.400
(8)
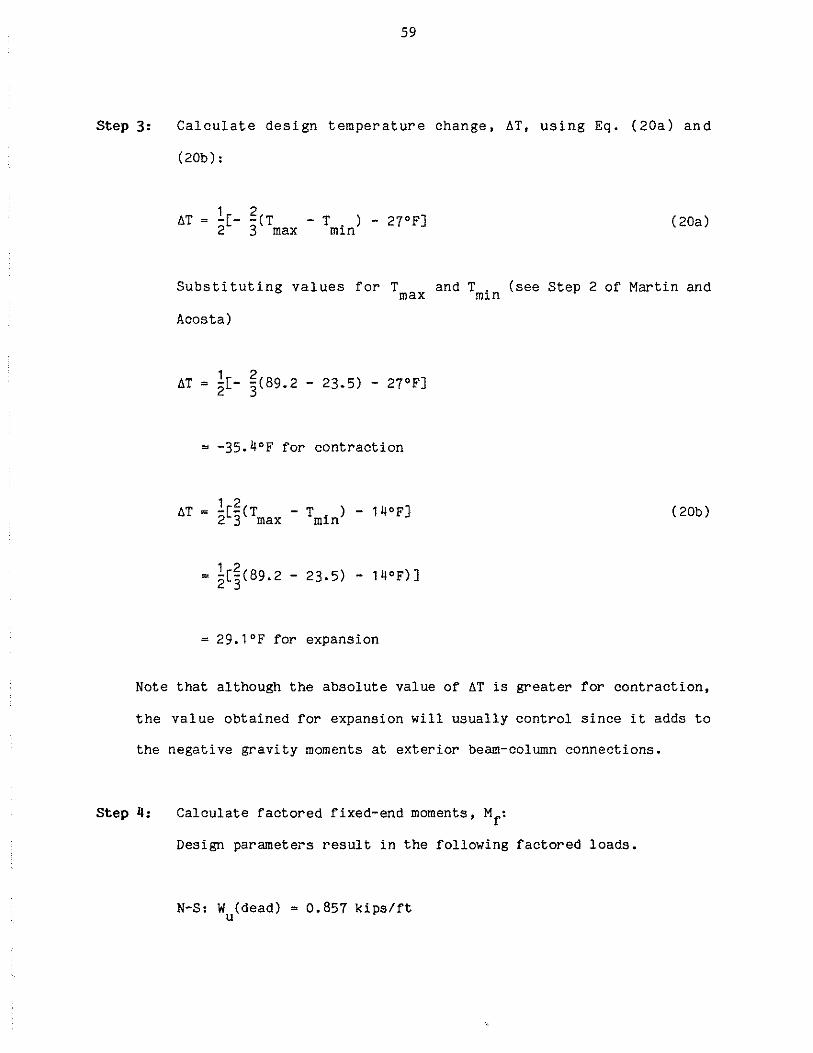
Step 3:
59
Calculate design temperature change, 6T, using Eq. (20a) and
(20b):
6T = 1[- ~(T - T . ) - 27°F] 2 3 max mln (20a)
Substituting values for Tmax and Tmin (see Step 2 of Martin and
Acosta)
1 2 6T = 2[- 3(89.2 - 23.5) - 27°F]
= -35.4°F for contraction
6T = l[~(T - T . ) - 14°F] 2 3 max mln (20b)
= 29.1°F for expansion
Note that although the absolute value of 6T is greater for contraction,
the value obtained for expansion will usually control since it adds to
the negative gravity moments at exterior beam-column connections.
Step 4: Calculate factored fixed-end moments, Mf:
Design parameters result in the following factored loads.
N-S: W (dead) = 0.857 kips/ft u
Step 5:
W (live) u
E-W: W (dead) u
Wu(live)
R (dead) u
R (live) u
N-S: Mf(dead)
Mf(live)
60
= 0. 1 51 kips/ft
= 0. 525 kips/ft
= 0
= 1 8. 0 kips (beam reactions)
= 5. 1 kips (beam reactions)
(0.857)(30) 2
= 64.3 ft-kips = 12
(0.151)(30) 2
= 11.3 ft-kips 12
= (0.525)(30) 2 + _,_(~18~)~(~1~0)~(~2~0~)2 __ + (18)(10)(20) 2
12 ~ 30 30 2
159.4 ft-kips
(5.1)(10)(20) 2
= + 302
34.0 ft-kips
(5.1) (10) (20) 2
30 2
Calculate factored gravity moments, M , at the base and top of the g
column using Eq. (13) and (27):
Base
( 1 3)
Substituting Mf (Step 4) and r• (Step 2),
N-S: ( ) 64. 3 + 11 • 3 1 2 6 f Mg base = 2( 1 + 2•083 ) = .2 t-kips
Step 6:
61
E-W: M (base) 159.4 + 34.0 27.63 ft-kips = 2( 1 2.500) g +
Top
Mg(top) Mf
2 Mg(base) = ( 1 + r') =
N-S: M (top) = 24.52 ft-kips g
E-W: M (top) = 55.26 ft-kips g
(27)
Using Eq. (9) and (10), calculate the unfactored temperature
induced moment, MT, at base and top of the column, assuming column
design is governed by the factored gravity moment obtained at the
top of the column, Mg(top). This procedure is based on the as
sumption that the entire column, including the connection at the
base, is proportioned based on the maximum gravity moment, which
occurs at the top of the column.
U 1.4D + 1.7L ( 9)
U = .75(1.4D + 1.7L + 1.4T) (10)
Substituting U = 1.4D + 1.7L = Mg and T = ~·
Base
M (top) = 0.75 [M (base or top) + 1.4MT(base or top)] g g
N-S: 24.52 = 0.75(12.26 + 1.4 MT)
~(base) = 14.60 ft-kips
E-W: 55.26 = 0.75(27.63 + 1.4 MT)
~(base) = 32.89 ft-kips
Top
62
N-S: 24.52 = 0.75(24.52 + 1.4 MT)
My(top) = 5.84 ft-kips
E-W: 55.26 = 0.75(55.26 ft-kip + 1.4 MT)
My(top) = 13.17 ft-kips
Step 7: Using Eq. (22), calculate expansion joint spacing, Lj, based on
the column moments at the base of the column:
2MT (1 + r' ) L j = ""3-:::E"""K~ct-:b""'T 1 + 2r '
c c ( 22)
Substituting MT(base) from Step 6, h = 20 ft x 12, r' (Step 2), Ec
= 57,000/6000 = 4,415,201 psi (ACI 318), Kc (Step 1), ct= 5.5 x
-6 10 , and bT = 29.1°F (Step 3),
( 1+2.083 ) = ~(2~)~(~1~4~.6~0~x~1~2,~0~0~0~)(~2~0~x~12~)~1_+(~2~)7(~2.~0~8~3~)
(3)(4,415,201)(13.34)(5.5x10⁻⁶)(29.1)
= 1770 in. = 147.5 ft
( 1 + 2. 500 ) (2)(32.89x12,000)(20x12) 1+(2)(2.500)
(3)(4,415,201)(13.34)(5.5x10⁻⁶)(29.1)
= 3904 in. = 325 ft
Step 8: Using Eq. (28), calculate expansion joint spacing, Lj, based on the
column moments at the top of the column:
63
MT(top) = 6E K .§. ( r' ) c c h 1 + r' (28)
Substituting Eq. (7) for o into Eq. (28) and solving for Lj
results in the equation for calculating Lj directly,
( 1 + r' ) 3E K a~T 1 + 2r' c c
Substituting MT(top), h, r', E, K, and ~T gives, c c
( 1 + 2. 083) = _ _;('-'<5:.:..· .:::.84:.:.x::...:1.:::2L., 0::.:0:.::0:.:..)-'-'( 2::.:0:.::x:..:.1.::.2:...) _.::.2:..:. O'-i8;.:e3 __ _
(3)(4,415,201)(13.34)(5.5x10⁻⁶)(29.1)
= 879.5 in. = 73.3 ft
( 1 + 2. 500) = _,_( 1~3~·_.:_1-"7x,_1:..::2:.!•..:::0.:::.0.:::.0 ):.._(:..::2:..::0"'x-'-1 2::.:l:___::2:..c· 5::_,0;::0:__ __
(3)(4,415,201)(13.34)(5.5x10⁻⁶)(29.1)
= 1878.3 in. = 156.5 ft
Step 9: Summary of expansion joint spacings, Lj:
a) Based on base of column moment calculations (Step 7)
N-S: L. = 1 47.5 ft J
E-W: L. J
= 325.0 ft
b) Based on top of column moment calculations (Step 8)
N-S: Lj = 73.3 ft
E-W: Lj = 156.5 ft
64
National Academy of Sciences (1974)
Step 1:
Step 2:
Step 3:
Calculate design temperature changes, liT, using Eq. (33a) and
(33b):
liT = T - T w m
Substituting from Table 6 for St. Louis, MO:
T = 65°F m
liT = 98°F - 65°F
liT = T - T m c
T = 65°F m
T = 4°F c
liT = 65°F - 4°F
= 61 °F
Therefore, use liT= 61°F
( 33a)
(33b)
Using Fig. 5, compute the allowable building length assuming liT =
61 °F:
From Figure 5, allowable building length is approximately 400 ft
Apply modification factors:
Fixed column bases, decrease length by 15%.
Lj =400ft- (400)(0.15)
= 340 ft
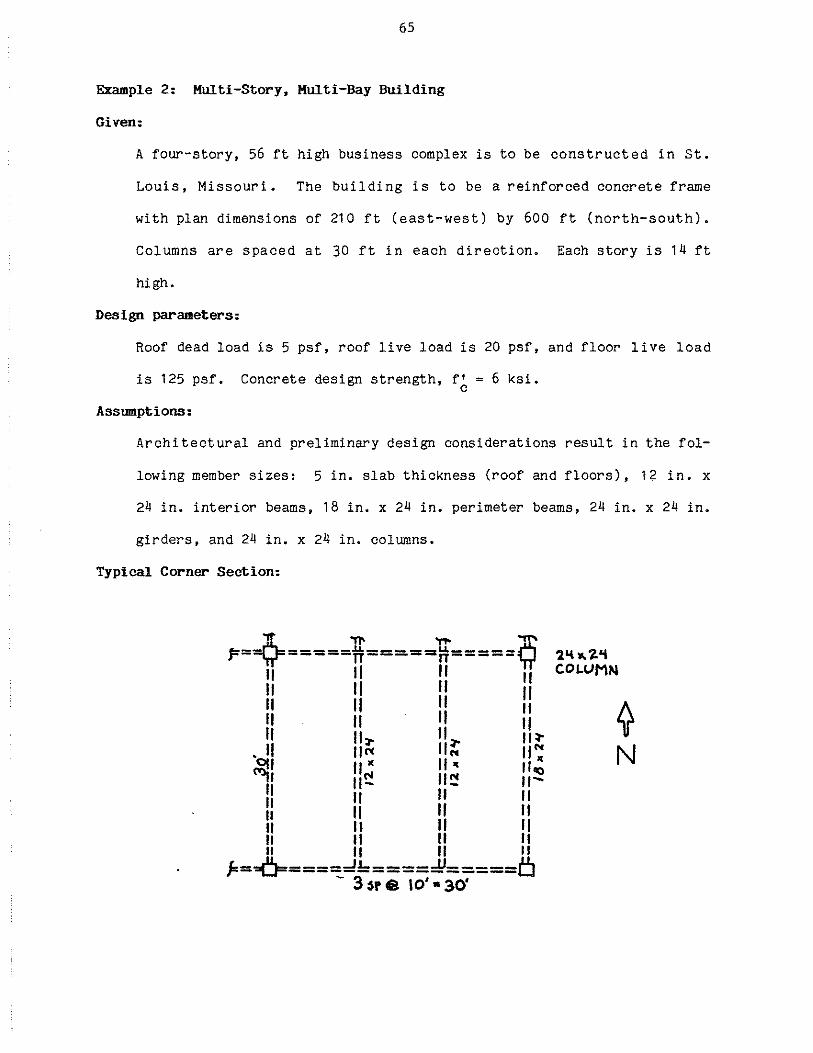
65
Example 2: Multi-Story, Multi-Bay Building
Given:
A four-story, 56 ft high business complex is to be constructed in St.
Louis, Missouri. The building is to be a reinforced concrete frame
with plan dimensions of 210 ft (east-west) by 600 ft (north-south).
Columns are spaced at 30 ft in each direction. Each story is 14 ft
high.
Design parameters:
Roof dead load is 5 psf, roof live load is 20 psf, and floor live load
is 125 psf.
Assumptions:
Concrete design strength, f' = 6 ksi. c
Architectural and preliminary design considerations result in the fol-
lowing member sizes: 5 in. slab thickness (roof and floors), 12 in. x
24 in. interior beams, 18 in. x 24 in. perimeter beams, 24 in. x 24 in.
girders, and 24 in. x 24 in. columns.
Typical Corner Section:
l. ,. ...... ""' r:=y=====ty=====~=====~
II II II II II II II 11 II II II 11 II II II II II II II II :to
. II II~ II~ II';; ~~ II ~ II ~ lloo
-,r II~ II!:! rr-ll II II II ll II II II 11 II II II II II II II II II II II
fo=~====dk====~=====6 - 3 $P e 10' • 30'
~ N
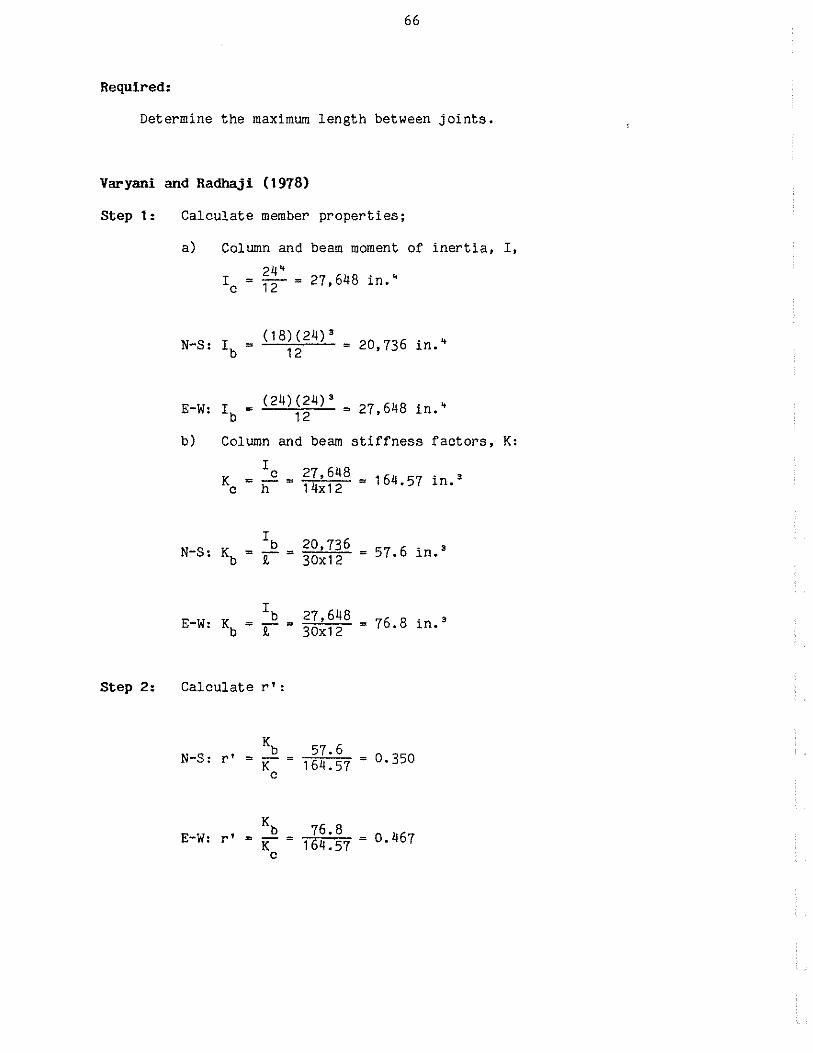
66
Required:
Determine the maximum length between joints.
Varyani and Radhaji (1978)
Step 1:
Step 2:
Calculate member properties;
a) Column and beam moment of inertia, I,
24 4
Ic = ~ = 27,648 in.'
(18)(24) 3
12 = 20,736 in.~~.
E-W: Ib = ( 24 )~~4 )' = 27,648 in. 4
b) Column and beam stiffness factors, K:
1c 27,648 Kc = ~ = 14x12 = 164.57 in.•
N-S: Kb Ib 20,736 57.6 in. • = -= = t 30x12
E-W: Kb Ib 27,648 76.8 in. • = - = = t 30x12
Calculate r' :
N-S: r• Kb 57.6 0. 350 = i<= 164.57 = c
E-W: r' Kb 76.8 0.467 = - = 164.57 = K c
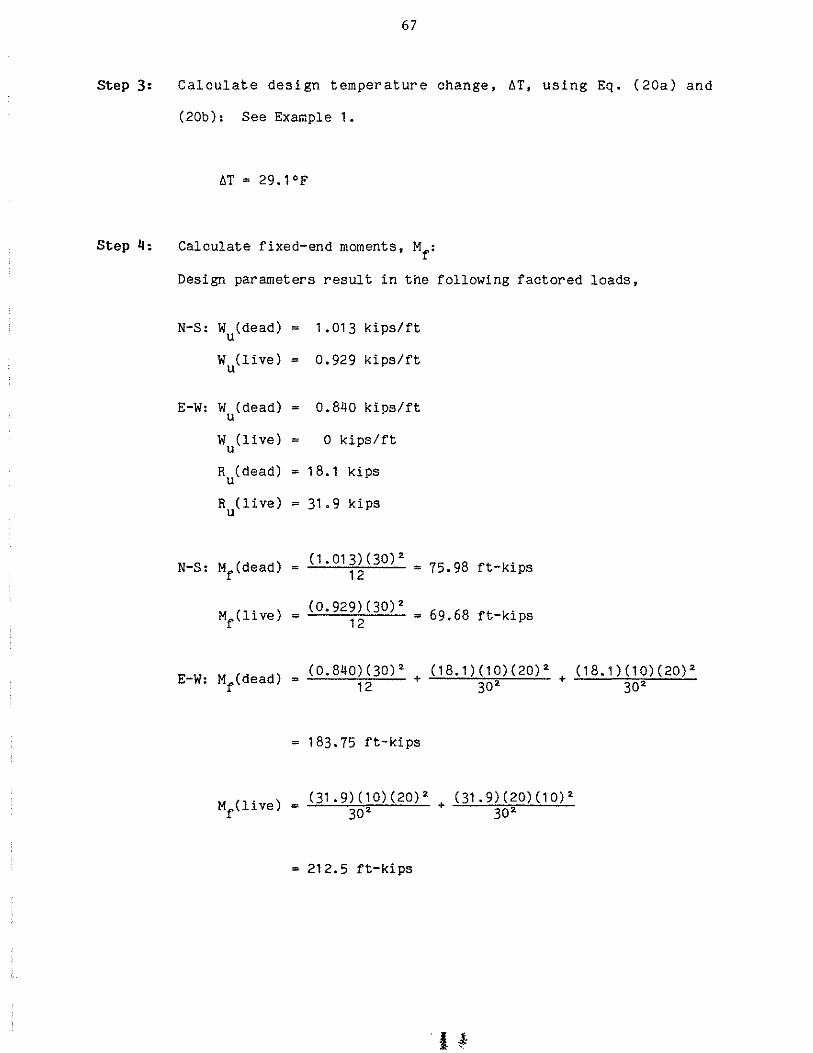
67
Step 3: Calculate design temperature change, 6T, using Eq. (20a) and
Step 4:
(20b): See Example 1.
6T = 29.1 °F
Calculate fixed-end moments, Mf:
Design parameters result in the following factored loads,
N-S: W (dead) = 1 • 01 3 kips/ft u
W (live) = u 0.929 kips/ft
E-W: W (dead) u
= 0.840 kips/ft
W (live) = o kips/ft u
R (dead) u = 1 8. 1 kips
R (live) u = 31.9 kips
N-S: Mf(dead) = ( 1 " 01 ~~( 30)2
= 75.98 ft-kips
(0.929)(30) 2
12 = 69.68 ft-kips
.:...< 0:..:•...:.8_;.;4 0~)-=( "'3 0:..:.)_2 + E-W: Mf(dead) = - 12
= 183.75 ft-kips
( 31 • 9) ( 1 0) ( 20) 2 Mf(live) = 302
= 212.5 ft-kips
( 1 8. 1 ) ( 1 0 )( 20) 2 +
302
+ _,_( 3"'1c.::•..::.9.:,.) ::-;< 2;:..::0"-) _,_( 1.:..;0:;.!)_2 302
(18.1)(10)(20) 2
302
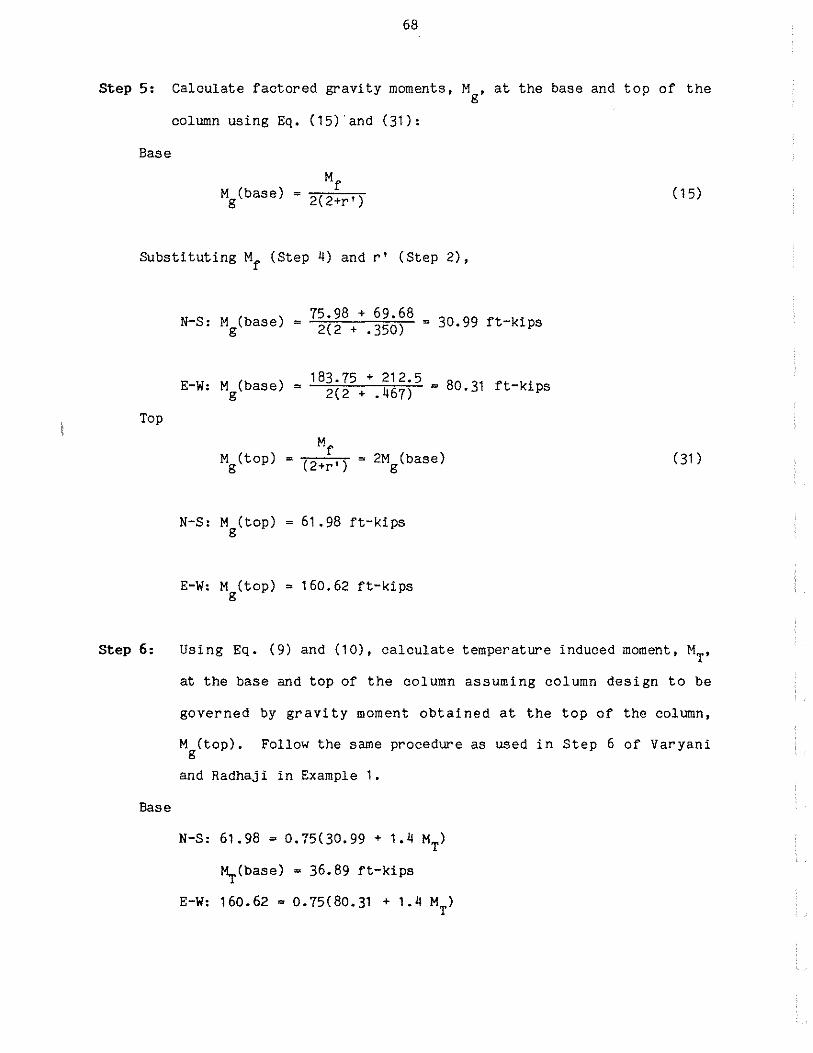
68
Step 5: Calculate factored gravity moments, Mg' at the base and top of the
column using Eq. (15)'and (31):
Base
M (base) g
Mf = "'27( 2-:c'+'-r-;'') ( 15)
Substituting Mf (Step 4) and r' (Step 2),
Top
Step 6:
Base
N-S: Mg(base) 75.98 + 69.68 = 30.99 ft-kips = 2(2 + .350)
E-W: M (base) 183.75 + 212.5 = 80.31 ft-kips = 2(2 + .467) g
M (top) Mf
2M (base) = ( 2+r' ) g g
N-S: M (top) 61.98 ft-kips g
E-W: M (top) = 160.62 ft-kips g
(31)
Using Eq. (9) and (10), calculate temperature induced moment, MT,
at the base and top of the column assuming column design to be
governed by gravity moment obtained at the top of the column,
M (top). Follow the same procedure as used in Step 6 of Varyani g
and Radhaji in Example 1.
N-S: 61.98 = 0.75(30.99 + 1.4 MT)
~(base) = 36.89 ft-kips
E-W: 160.62 = 0.75(80.31 + 1.4 MT)
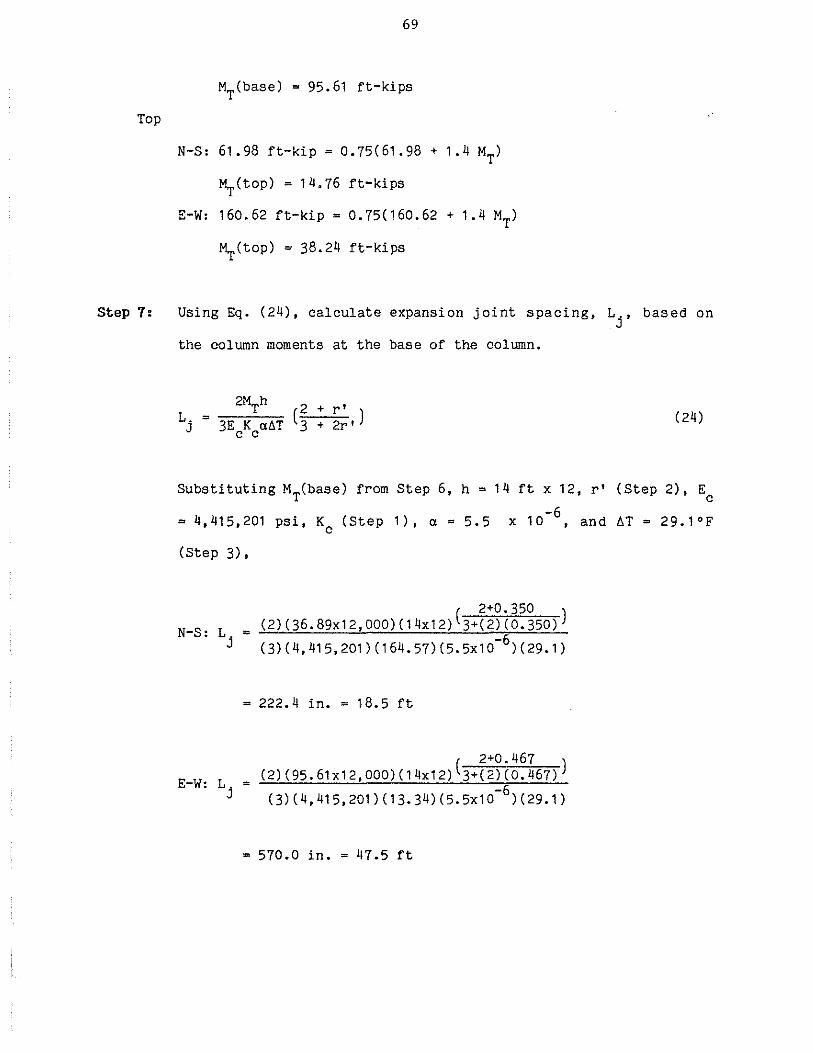
Top
69
MT(base) = 95.61 ft-kips
N-S: 61.98 ft-kip = 0.75(61.98 + 1.4 MT)
~(top) = 14.76 ft-kips
E-W: 160.62 ft-kip = 0.75(160.62 + 1.4 MT)
~(top) = 38.24 ft-kips
Step 7: Using Eq. (24), calculate expansion joint spacing, Lj, based on
the column moments at the base of the column.
2MTh (2 + r' ) 3E K a~T 3 + 2r' c c
Substituting MT(base) from Step 6, h = 14 ft x 12, r'
-6 = 4,415,201 psi, K0
(Step 1), a= 5.5 x 10 , and
(Step 3),
( 2+0. 350 ) (2)(36.89x12,000)(14x12) 3+(2)(0.350)
(3)(4,415,201)(164.57)(5.5x10⁻⁶)(29.1)
= 222.4 in. = 18.5 ft
=
( 2+0.467 ) (2)(95.61x12,000)(14x12) 3+(2)(0.467)
(3)(4,415,201)(13.34)(5.5x10⁻⁶)(29.1)
= 570.0 in. = 47.5 ft
(24)
(Step 2), E c
~T = 29.1°F

Step 8:
70
Using Eq. (32), calculate expansion joint spacing, Lj, based on
the column moments at the top of the column,
M = 6E K .§. ( 1 + r') T c c h 2 + r' (32)
Substituting Eq. (7) for o into Eq. (32) and solving for Lj
results in an equation for calculating Lj directly.
L = MT (2 + r') j 3E K aAT 1 + r' c c
Substituting MT(top), h, r', Ec' Kc' and AT gives
(2+0.350) = --~(~1~4~.7~6~x~12~·~0~0~0~)(~1~4~x~12~)~1~+0~·~375~0 __ ___
(3)(4,415,201)(164.57)(5.5x10⁻⁶)(29.1)
= 148 in. = 12.4 ft
(2+0.467) = --~(~3~8~.2~4~x~12~·~0~0~0~)(~1~4~x~12~)~1~+0~.~476~7 __ ___
(3)(4,415,201)(164.57)(5.5x10⁻⁶)(29.1)
= 371 in. 30.9 ft
Step 9: Summary of expansion joint spacings, Lj:
a) Based on base of column moment calculations
N-S: Lj = 18.5 ft
E-W: Lj = 47.5 ft
b) Based on top of column moment calculations
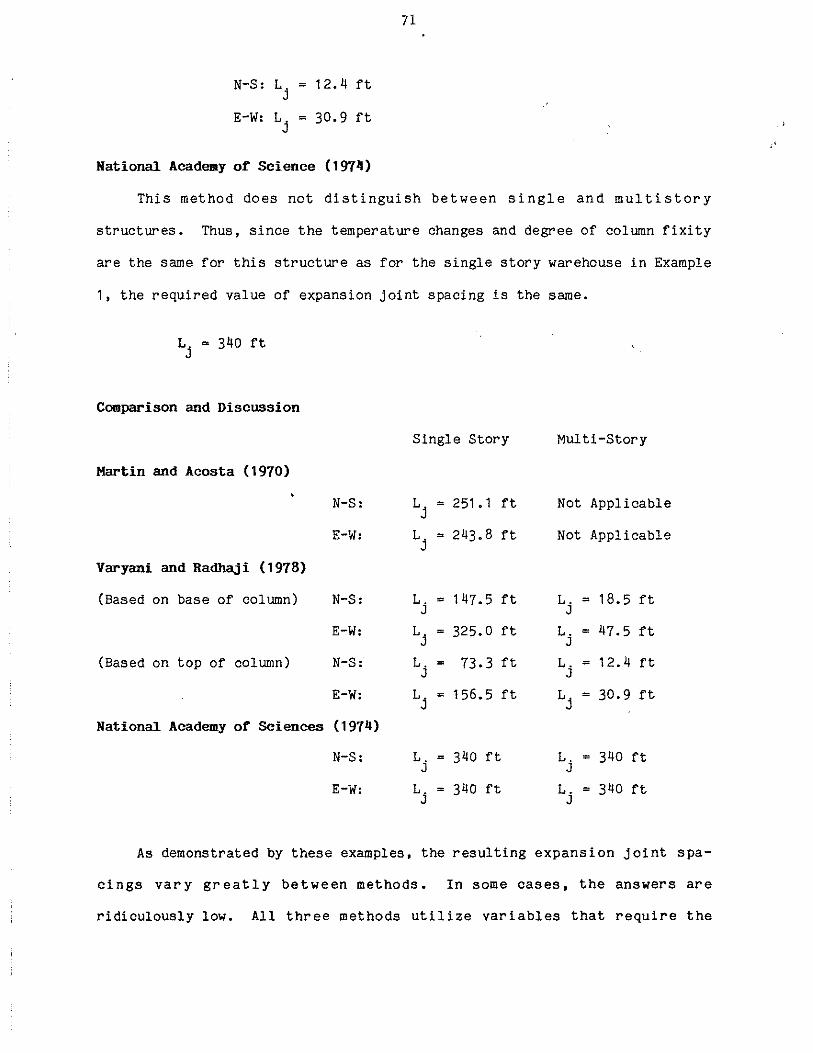
N-S:
E-W:
Lj = 12.4 ft
Lj = 30.9 ft
National Academy o£ Science (1974)
71
This method does not distinguish between single and multistory
structures. Thus, since the temperature changes and degree of column fixity
are the same for this structure as for the single story warehouse in Example
1, the required value of expansion joint spacing is the same.
Lj = 340 ft
Comparison and Discussion
Single Story Multi-Story
Martin and Acosta (1970)
N-S: Lj = 251. 1 ft Not Applicable
E-W: L. = 243.8 ft Not Applicable J
Varyani and Radhaji (1978)
(Based on base of column) N-S: L. = 147.5 ft L. = 18.5 ft J J
E-W: L. = 325.0 ft L. = 47.5 ft J J
(Based on top of column) N-S: L. = 73.3 ft L. = 12.4 ft J J
E-W: Lj = 156.5 ft Lj = 30.9 ft
National Academy of Sciences (1974}
N-S: L. 340 ft L. = 340 ft J J
E-W: Lj = 340 ft L. = J
340 ft
As demonstrated by these examples, the resulting expansion joint spa-
cings vary greatly between methods. In some cases, the answers are
ridiculously low. All three methods utilize variables that require the
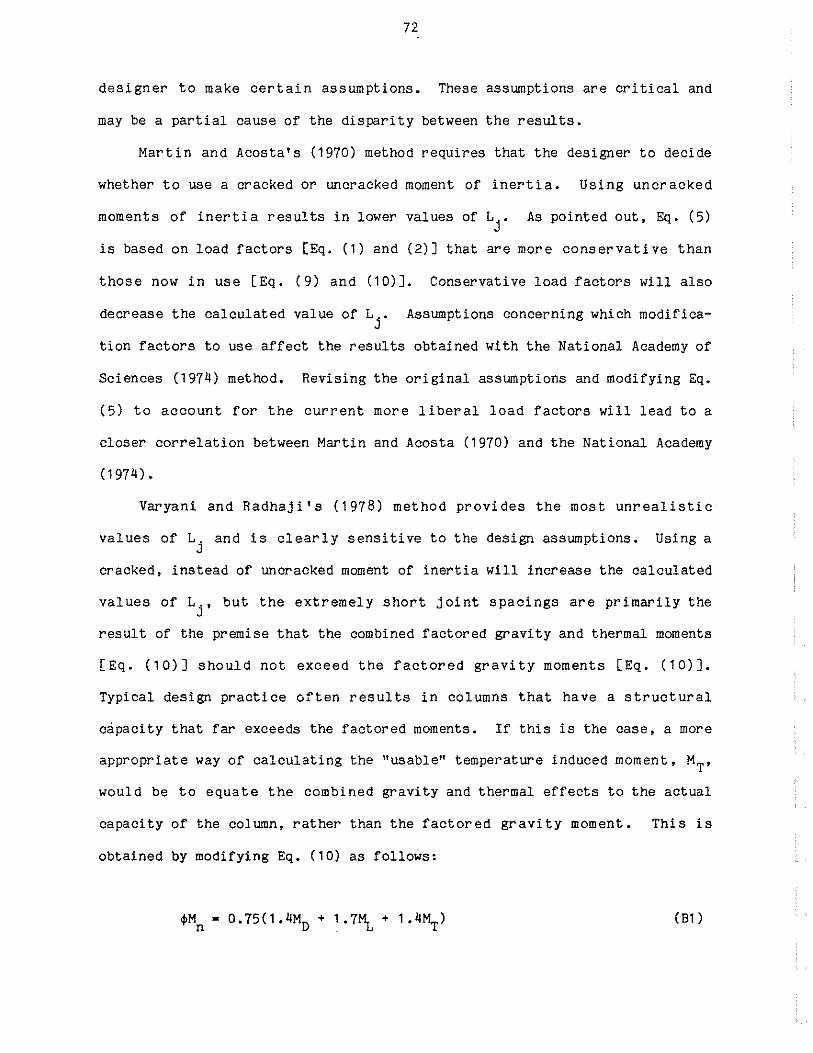
72
designer to make certain assumptions. These assumptions are critical and
may be a partial cause of the disparity between the results.
Martin and Acosta's (1970) method requires that the designer to decide
whether to use a cracked or uncracked moment of inertia. Using uncracked
moments of inertia results in lower values of Lj" As pointed out, Eq. (5)
is based on load factors [Eq. ( 1) and (2)] that are more conservative than
those now in use [Eq. (9) and (10)]. Conservative load factors will also
decrease the calculated value of L.. Assumptions concerning which modificaJ
tion factors to use affect the results obtained with the National Academy of
Sciences (1974) method. Revising the original assumptions and modifying Eq.
(5) to account for the current more liberal load factors will lead to a
closer correlation between Martin and Acosta (1970) and the National Academy
(1974).
Varyani and Radhaji's (1978) method provides the most unrealistic
values of L. and is clearly sensitive to the design assumptions. Using a J
cracked, instead of uncracked moment of inertia will increase the calculated
values of Lj, but the extremely short joint spacings are primarilY the
result of the premise that the combined factored gravity and thermal moments
[Eq. (10)] should not exceed the factored gravity moments [Eq. (10)].
Typical design practice often results in columns that have a structural
capacity that far exceeds the factored moments. If this is the case, a more
appropriate way of calculating the "usable" temperature induced moment, MT'
would be to equate the combined gravity and thermal effects to the actual
capacity of the column, rather than the factored gravity moment. This is
obtained by modifying Eq. (10) as follows:
$M n
(B1)
73
Eq. (81) will yield longer, more realistic joint spacings than Eq. (10).
For a fixed building geometry (and Lj), MT is also fixed.
can be increased to satisfy Eq. (81).
In this case, ~M n
The preceding examples illustrate the strengths and weaknesses of the
proposed methods. The method requiring the least effort (National Academy
of Sciences 1974) produces joint spacings that are in line with current
practice. The most time-consuming method (Varyani and Radhaji 1978) can
produce unreasonably low values of Lj and appears to need additional
modifications before an acceptable version is available. The final deter-
mination of which method to use rests with the designer and must provide an
expansion joint spacing that will limit member forces without adversely af-
fecting structural integrity or serviceability.
Recommended