It’s Time for
Preschool

Early Childhood Education Report 2014
• Second report – first released in 2011• Based OECD recommendations from ‘Starting Strong
2”• Fifteen point scale – 5 equally weighted sections
• Integrated Governance• Funding• Access• Learning Environment• Accountability
• Nineteen benchmarks• Reflects Canadian reality• Data limited by information
availability


2011 20140
2000000000
4000000000
6000000000
8000000000
10000000000
12000000000
2011 2014
Dol
lars
(m
illio
ns)
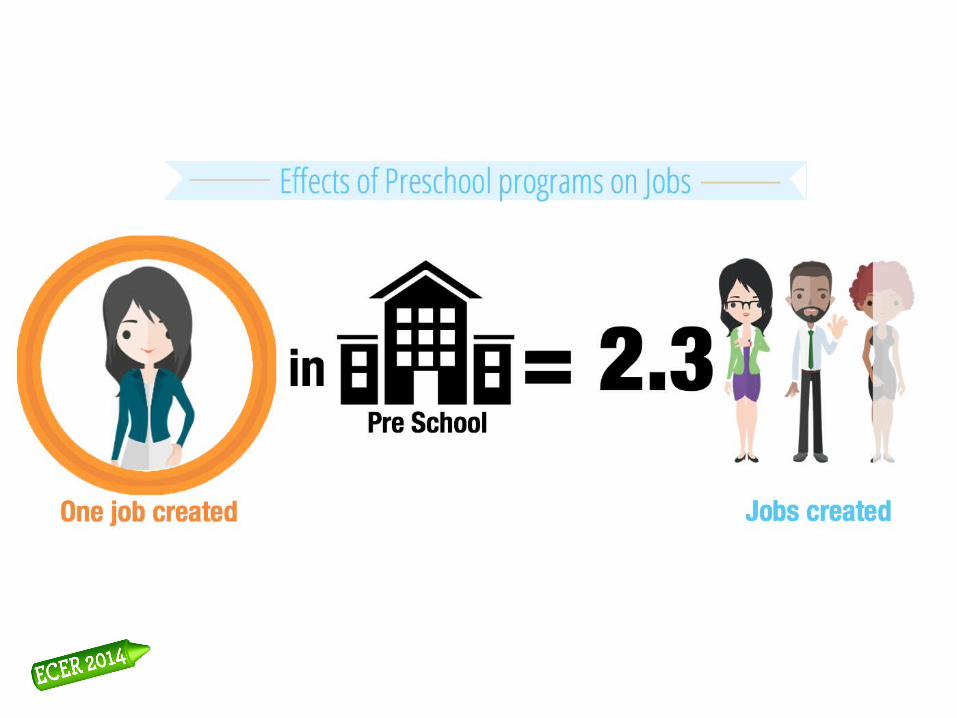
Change in Provincial/Territorial ECE Spending in Canada
Change in Provincial/Territorial ECE Spending in Canada
(Ontario & Québec)
QC ON0
500000000
1000000000
1500000000
2000000000
2500000000
3000000000
3500000000
4000000000
4500000000
5000000000
20112014
QC ON
Dol
lars
(m
illio
ns)
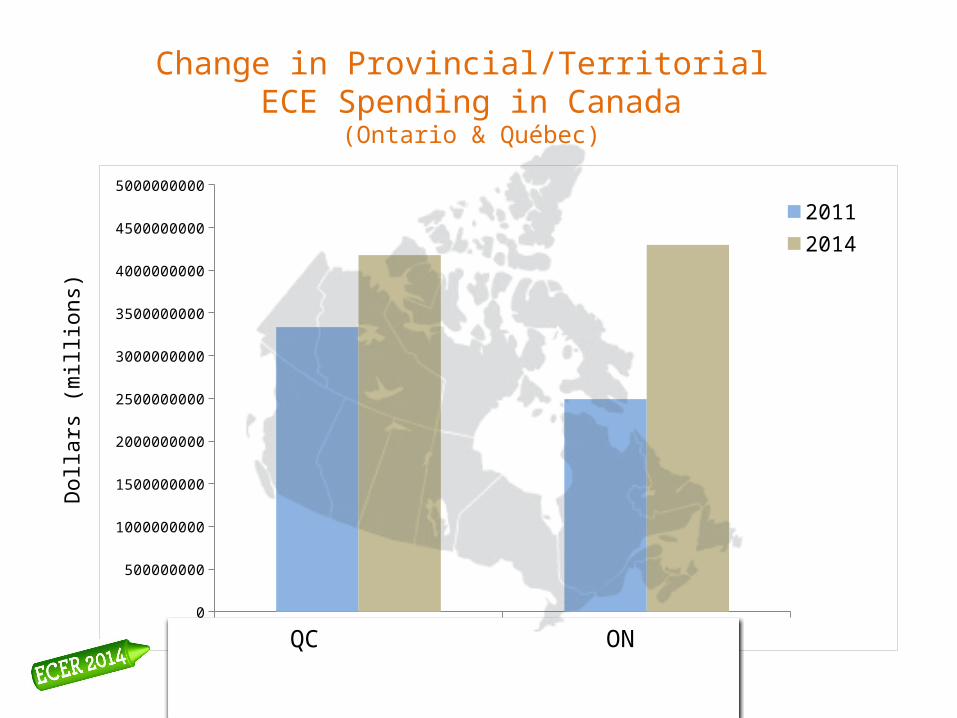
Change in Canada ECE Spending as a Percentage of the GDP
2006 2011 2014 OECD average
00.10.20.30.40.50.60.70.80.9
1
2006 2011 2014 OECDaverag
e
Perc
ent
(GD
P)

2011 20140
10000
20000
30000
40000
50000
60000
70000
80000
90000ECE
Teacher
Change in Teacher / ECE Remuneration
Canadian average income
2011 2014
Dolla
rs (
mill
ions)
QC

Operating Expenditure per Childcare Space and per Pupil in Schools
(Canada)
Am
ou
nt
in d
oll
ars
Funding Per Child Care Space Funding Per Pupil in Schools0
2000
4000
6000
8000
10000
12000
14000
Per Child Care Space
Per School Pupil

Changing CanadianLandscape
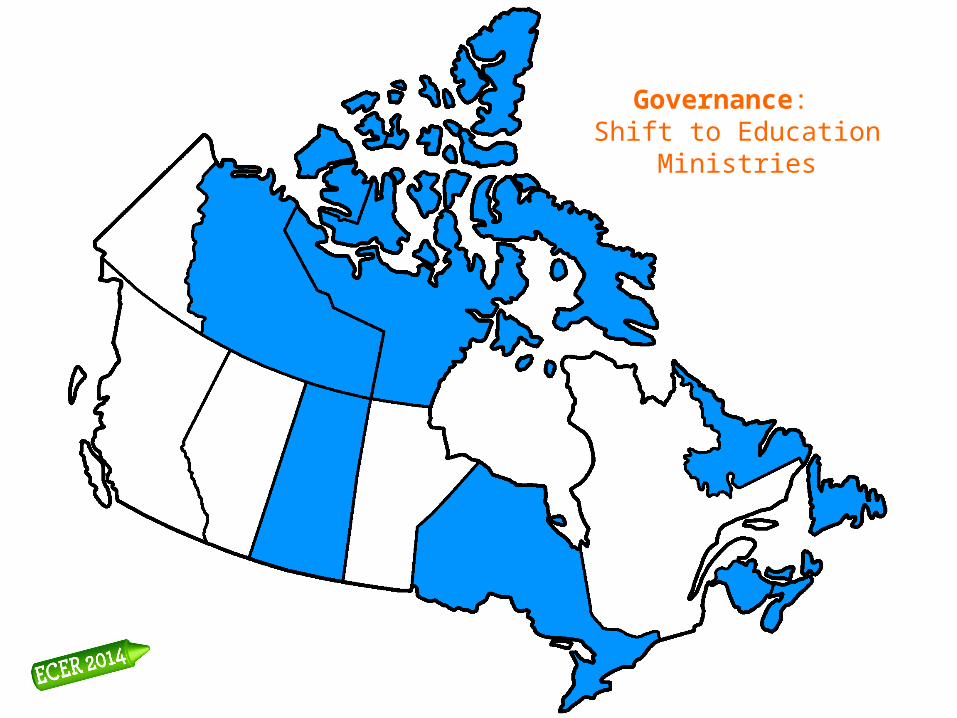
Governance: Shift to Education Ministries
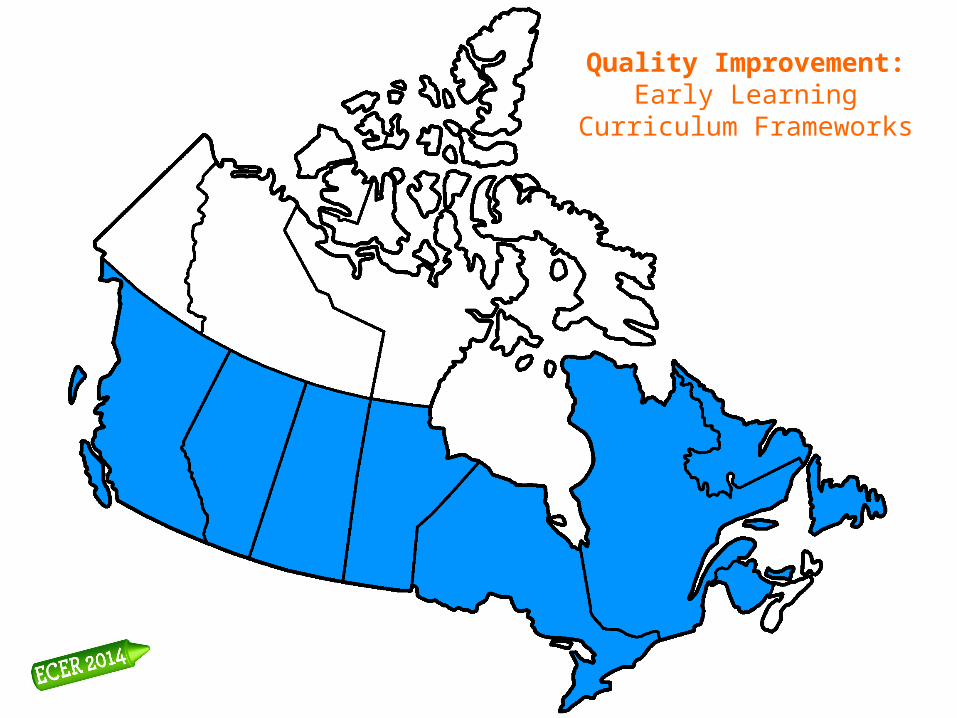
Quality Improvement:Early Learning
Curriculum Frameworks
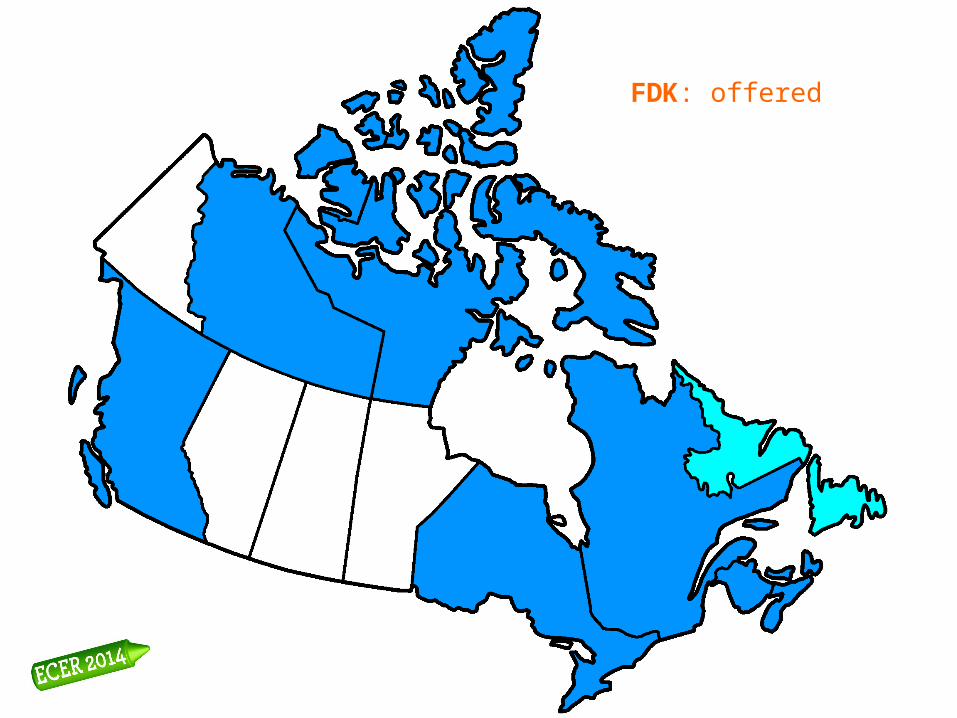
FDK: offered

Access:At least 50% of 2-4 year-olds have access to ECE
program

ECE access for 4-year-olds (Canada 2009/2014 and OECD)
Franc
e
Nether
land
s
Mex
ico
United
Kin
gdom
Denm
ark
Japa
n
Norway
Germ
any
New Z
eala
nd
Swed
en
OECD Ave
rage
Chile
United
Stat
es
Irela
nd
Canad
a (20
14)
Brazil
Austra
lia
Canad
a (20
09)
Switz
erla
nd
Indo
nesia
Turke
y0
10
20
30
40
50
60
70
80
90
100
Canad
a (20
14)
Canad
a (20
09)
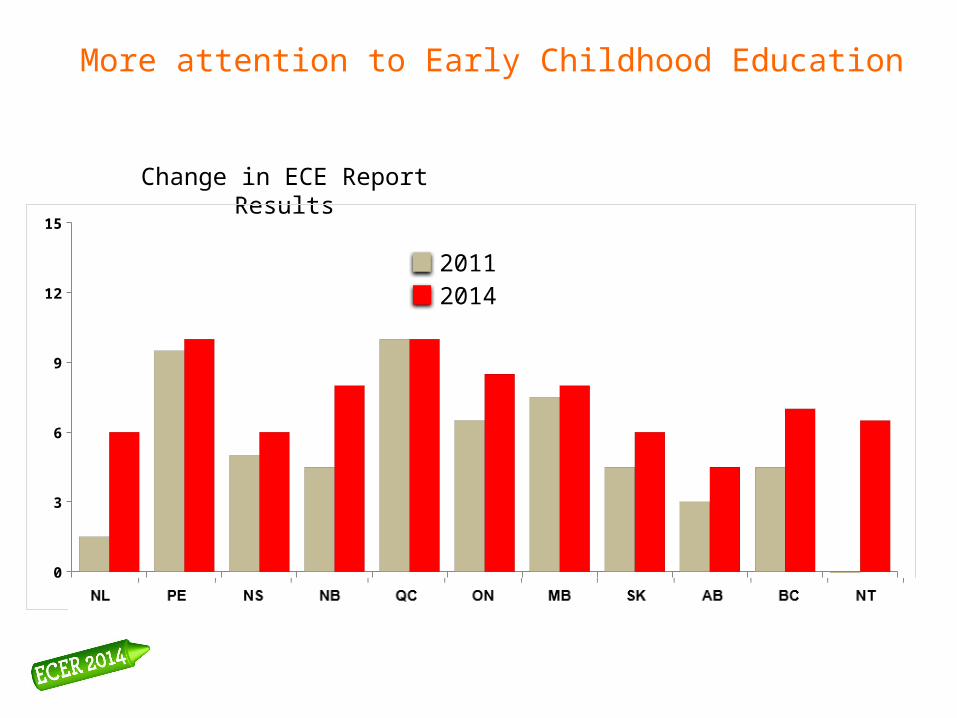
Change in ECE Report Results
More attention to Early Childhood Education
NL PE NS NB QC ON MB SK AB BC NT0
3
6
9
12
15
20112014
Additional Resources
TimeForPreschool.ca
Follow us on Twitter @AtkinsonCentrewww.oise.utoronto.ca/atkinson
Kerry [email protected]
Emis [email protected]
Recommended