Int.J.Curr.Microbiol.App.Sci (2016) 5(6): 527-562
527
Original Research Article http://dx.doi.org/10.20546/ijcmas.2016.506.059
Genome Wide Screening, Identification and Characterization of NAC
Transcription Factors from Capsicum Species: An In Silico Approach
Swastik Swagat Mishra
1, Ayushman Gadnayak
1, Sambhunath Mandal
1 and
Budheswar Dehury2*
1Department of Bioinformatics, Center for Post Graduate Studies, Orissa University of
Agriculture Technology, Bhubaneswar-751003, India 2Biomedical informatics Center, Regional Medical Research Center, Indian council of medical
Research, Bhubaneswar-751023, India *Corresponding author
A B S T R A C T
Introduction
Plants grow in a dynamic and uncontrolled
environment which can frequently impose
adverse effect on growth and development,
resulting in considerable losses to the yields
International Journal of Current Microbiology and Applied Sciences ISSN: 2319-7706 Volume 5 Number 6 (2016) pp. 527-562
Journal homepage: http://www.ijcmas.com
NAM, ATAF, and CUC (NAC) transcription factors comprise a large plant-specific gene family and a few members of this family have been characterized for their roles
in plant growth, development, and stress tolerance. Although recent genome
sequencing of Capsicum annum aid in identification of few NAC transcription factors but which is yet to be complete in terms of other capsicum species. So the
present work was undertaken to screen and identify NAC transcription factors from
two Capsicum genome sequences i.e., Capsicum ang Zunla and Capsicum annum
Chileptein through comparative genomics approach using known NAC transcription factors from Solanaceae family and various plant species as reference. Further
attempt was made elucidate NAC domain architecture, conserved motifs,
localization, trans-membrane region elucidation followed by phylogenetic studies and three-dimensional structure prediction. Extensive genome wide screening
resulted a total of 186 non-redundant (46 from chileptein and 46 from zunla) NAC
transcription factors from Capsicum species. Domain architecture and phylogenetic analysis showed that NAC gene family are highly diverse in nature even though they
possess highly conserved N-Terminal region. Most members contained a complete
NAC DNA-binding domain and a variable transcriptional regulation domain.
Furthermore, most of the gene found in the nuclear region and dominated by the possession of helix region. Distinct compositions of the putative motifs were
revealed on the basis of NAC protein sequences in Capsicum. Sequence analysis,
together with the organization of putative motifs, indicated distinct structures and potential diverse functions of NAC family in Capsicum species. Considering the fact
that a very limited number of genes of the NAC family have been characterized, our
results provide a very useful reference for further functional characterization of this
family in Capsicum species in near future.
K ey wo rd s NAC, NAM, CUC, ATAF, Chileptein, Zunla_1, Solanacae, Domain architecture, Phylogenetic analysis, Redundancy, Trans-membrane,
Motif localization, Sequence Analysis.
Accepted:
20 May 2016
Available Online:
10 June 2016
Article Info

Int.J.Curr.Microbiol.App.Sci (2016) 5(6): 527-562
528
of highly important crops. Among the
adverse abiotic factors commonly
encountered by plants are extreme
temperature, water deficit, high salinity and
submergence that affect plant growth and
productivity. To deal with challenging
conditions, many communities Breeders
take a relatively traditional approach. They
grow and cross varieties then evaluate how
the progenies vary in their ability to deal
with stresses. Scientific communities,
meanwhile, have taken advantage of recent
advances in functional genomics and
biotechnology to genetically engineer crops
which can give better yield than the
unmodified ones in adverse conditions
(Katerji Net al., 2012). The best-adapted
plants will then be selected for growing in
fields exposed to stresses. In order to cope
with stresses, which vary in timing and
severity from place to place, season to
season, plants activate a number of defense
mechanisms that function to increase
tolerance to the unfavorable conditions
imposed by the stress conditions. The
regulatory group includes genes encoding
various transcription factors (TFs), which
can regulate various stress-inducible genes
cooperatively or separately, and may
constitute gene networks. The functional
group contains genes encoding metabolic
components such as sugar, sugar alcohols
and amines, which play an important role in
stress tolerance. Recent efforts have
provided vital information for improving
stress tolerance of important crops by
increasing root growth and development as
well as enhancing various physiological and
metabolic responses through genetic
engineering of transcriptional networks
(Nakashima K et al., 2012).
Transcription Factors
Transcription Factors are molecules
involved in regulating gene expression.
They are usually proteins, although they can
also consist of short, non-coding RNA.
Transcription factors are also usually
found working in groups and complexes,
forming multiple interaction that allow for
varying degree of control over rates of
transcription. In eukaryotes, genes are
usually in a default "off" state, so
Transcription factors serve mainly to turn
gene expression "on". In bacteria, the
reverse is often true, and genes are
expressed constitutively until a
Transcription factors turns it off.
Transcription factors work by recognizing
certain nucleotide sequences (motifs) before
or after the gene on the chromosome (up-
and downstream) (Phillips, T et al., 2011).
Eukaryotes often have a promoter region
upstream from the gene or enhancer regions
up or downstream from the gene, with
certain specific motifs that are recognized by
the various types of Transcription factors.
The Transcription factors bind, attract other
Transcription factors and create a complex
that eventually facilitates binding by RNA
polymerase, thus beginning the process of
transcription. Transcription factors are only
one of the means by which cells express
different combinations of genes, allowing
for differentiation into the various types of
cells, tissues and organs. Transcription
factors can also control gene expression by
creating a "cascade" effect; where in the
presence of small amounts of one protein
triggers the production of larger amounts of
a second, which triggers production of even
larger amounts of a third, and so on
(Phillips, T et al., 2011).
Role of Transcription Factors in
Solanancea Family Plants
The transition from a functional
photosynthetic organ to an actively
degenerating and nutrient-recycling tissue in
a leaf's life history represents the onset of

Int.J.Curr.Microbiol.App.Sci (2016) 5(6): 527-562
529
leaf senescence. This onset is a
developmental switch that involves dramatic
differential gene expression. Differential
gene expression is believed to play an
important role in leaf senescence. In a
senescing leaf, many genes that are
expressed in green leaves, including those
genes involved in photosynthesis, are down
regulated, while a subset of genes, generally
referred to as senescence-associated genes
(SAGs), are up regulated. Leaf senescence is
under direct nuclear control,
and SAG expression is required for
senescence to proceed. Inhibitors of
transcription or translation prevent leaves
from senescing (Buchanan-Wollaston et al.,
2003; Guo and Gan, 2005; Hadfield and
Bennett et al., 1997; Lim and Nam, 2005 et
al., 1994). For the past decade, much effort
has been made to isolate SAGs, and
hundreds of SAGs have been cloned from
various plant species including Arabidopsis,
barley, Brassica, maize, cucumber, rice,
tobacco, radish, asparagus and soybean
(Buchanan-Wollaston et al.,
2003; Gepstein et al., 2003; He and Gan et
al., 2003).
Role of NAC Transcription Factors in
plants
Several members of the NAC family were
initially described more than a decade ago
(Olsen AN et al.,). Since then a great
number of NAC TFs have been identified
and functionally characterized in both model
and crop plants such as Arabidopsis, rice,
soybean (Glycine max) and wheat (T.
turgidum ssp. durum) (Nakashima K et al.,
2012). Proper characterization of particular
TFs often requires a detailed study in the
biological context of a whole TF family
since functional redundancy is a common
occurrence within TF families (Tran L-SP et
al.,). Furthermore, since TFs control the
expression of the genome, it is impossible to
completely understand their function
without performing detailed functional
studies at a genome-wide level (Reichmann
JL et al., 2010). The identification,
characterization and classification of TFs at
the genome-wide level will provide an
important resource for researchers who are
studying the regulation of gene expression
and the functions of the genes. Complete
genomic sequences of several model plants
and crops, including Arabidopsis, rice and
soybean are now available. Genome-wide
analyses of their genomes indicated that
there are more than 60 reported families of
TFs in these plants (Reichmann JL et al.,
2010).
Capsicum annum
Pepper (Capsicum) is an economically
important genus of the Solanaceae family,
which also includes tomato and potato. The
genus includes at least 32 species native to
tropical America, of which C. annuum L., C.
baccatum L., C. chinense Jacq. C. frutescens
L., and C. pubescens (Ruiz & Pavon et al,
2010) were domesticated as far back as 6000
B.C. by Native Americans. Peppers have a
wide diversity of fruit shape, size, and color.
Pungent peppers are used as spices, and
sweet peppers are used as vegetables.
Pepper global production in 2011 reached
34.6 million tons fresh Fruit and 3.5 million
tons dried pods harvested in 3.9 million
hectares (Qina C et al., 2012) Despite the
growing commercial importance of pepper,
the molecular mechanisms that modulate
fruit size, shape, and yield are mostly
unknown. Since the 1990s, genetic diversity
and allelic shifts among cultivars,
domesticated landraces, and wild accessions
have been partially explored using restricted
sets of anonymous or neutral molecular
markers and annotated DNA sequences. Hot
pepper (Capsicum annuum), one of the
oldest domesticated crops in the Americas,
Int.J.Curr.Microbiol.App.Sci (2016) 5(6): 527-562
530
is the most widely grown spice crop in the
world. Whose genome has been sequenced
by Mexican landrace of Capsicum annuum
cv. CM334 whole-genome sequencing and
assembly of the hot pepper at 186.6×
coverage.
Rationale of the work
NAM, ATAF, and CUC (NAC)
transcription factors comprise a large plant-
specific gene family and a few members of
this family have been characterized for their
roles in plant growth, development, and
stress tolerance. Although recent genome
sequencing of Capsicum annum aid in
identification of few NAC transcription
factors however, little is known in other
Capsicum species. So the present study was
undertaken to screen and identify NAC
transcription factors from Capsicum species
through comparative genomics approach
using known NAC transcription factors from
plant species as reference. Considering the
fact that a very limited number of genes of
the NAC family in Capsicum species have
been characterized, our results is expected
provide a very useful reference for further
functional characterization of this family in
Capsicum species in near future
Keeping the importance of NAC TFs in
Capsicum species, the present research work
was designed with the following three
objectives:
Screening and identification of NAC
transcription factors from Capsicum genome
i.e., Capsicum annum L. Zunla1 and
Capsicum annum var. glabriusculum
Chiltepin.
Elucidation of conserved motifs,
localization, trans-membrane region, domain
architecture and phylogenetic analysis of the
identified NAC TFs.
Physico-chemical characterization,
secondary structure analysis followed by 3-
Dimensional architecture prediction of NAC
domains.
Review of Literature
Drought, cold, and salinity are major forms
of stress from abiotic sources that adversely
affect plant growth and productivity
(Nakashima et al., 2012), of which drought
is considered as the most devastating. Water
is one of the significant limiting factors and
affects maize at all stages of its growth.
Maize is especially sensitive to drought at
the reproductive stage, particularly between
tassel emergence and early grain-filling
(Grant et al., 1989). Drought stress during
this period reduces kernel size and thus
lowers grain yield significantly (Bolanos
and Edmeades, et al., 1993). Plants adapt to
drought stress at physiological, biochemical,
and molecular levels by activating a number
of defense mechanisms that increase the
plant's tolerance to water deficit.
Transcription factors (TFs) are key proteins
that regulate gene expression at the
transcription level by interacting with
promoter elements of stress genes resulting
in over-expression of many functional
genes.
Biological functions of NAC proteins
Embryonic, floral and vegetative
development the striking appearance of
mutant phenotypes first indicated the
importance of the NAC gene family in plant
biology. Most petunia (Petunia hybrida)
nam (no apical meristem) mutants lack the
shoot apical meristem (SAM) and die at the
seedling stage. Cotyledon fusions occur in
these mutant seedlings, and plants developed
from occasional escape shoots display
aberrant floral development. NAM was the
first NAC gene to be characterized but was

Int.J.Curr.Microbiol.App.Sci (2016) 5(6): 527-562
531
soon followed by the characterization of the
Arabidopsis CUC2 (CUP-SHAPED
COTYLEDON 2) gene. When combined,
mutations in the CUC1 and CUC2 genes
cause defects similar to the nam phenotype.
The cuc1 cuc2 double mutants have fused
cotyledons and the embryonic SAM is
absent. When shoots are induced by
regeneration from mutant calli, abnormal
flowers are formed. The mutant phenotypes
and the expression patterns of NAM, CUC1
and CUC2 suggested a function for the gene
products in boundary specification and SAM
formation. Thorough studies of the
Arabidopsis CUC genes have since provided
further information about the roles of NAC
proteins in development. CUC1 was found
to encode a NAC-domain protein with high
sequence similarity to CUC2. Functional
redundancy was further demonstrated by the
recent discovery that a third Arabidopsis
NAC gene, CUC3, is involved in the
cotyledon boundary and the shoot meristem.
The cuc mutant phenotype prompted an
investigation of the interaction between the
CUC1 and CUC2 genes and the STM
(SHOOT MERISTEMLESS) gene. STM is
a KNOTTED 1-like homeo box (KNOX)
gene involved in SAM formation and
maintenance as well as in cotyledon
separation. CUC1 and CUC2 were found to
be required for STM expression during
embryonic SAM formation. Furthermore,
overexpression of CUC1 was shown to
induce adventitious shoots on cotyledons
through STM expression.(Ken-ichiro Hibara
et al , 2009) examined the genetic
interaction between CUC1 and the AS1
(ASYMMETRIC1) and AS2 genes, which
are also important in SAM formation. Their
results indicated that CUC1 also promotes
SAM formation through an STM-
independent pathway that is negatively
regulated by AS1 and AS2. AS1 encodes a
MYB (Myeloblastosis) domain transcription
factor, and it is thus apparent from this
single example of NAC gene function that
research into the roles of NAC proteins in
plant biology will contribute to an
unravelling of transcription factor networks
(K. Yamaguchi ,Nakashima et al , 2012 ).
Indeed, a recent study of cup (cupuliformis)
mutants in Antirrhinum (snapdragon)
showed that the CUP protein is involved in
the establishment of aboveground organ
boundaries and that it interacts with a TCP
(TB1, CYC, PCF) domain transcription
factor. Members of the TCP family of
transcription factors are involved in the
regulation of plant growth and development.
Furthermore, expression of an Arabidopsis
NAC gene called NAP (NAC-like, activated
by APETALA 3/PISTILLATA) has been
shown to be directly activated by a
heterodimer of the APETALA 3 and
PISTILLATA proteins, both of which are
MADS (MCM1, AGAMOUS, DEFICIENS
and SRF) box transcription factors essential
for the specification of floral organ
identities. Other regulators of NAC gene
expression have been identified without
evidence of immediate regulation. CUC1
and CUC2 spatial expression is affected by
mutations in STM and in PIN1 (PIN-
FORMED 1), PID (PINOID) and MP
(MONOPTEROS), genes involved in auxin
signalling. Moreover, NAC1 transcription is
activated by NAC1and CUC3 transcription
is stimulated by CUC1 and CUC2. Lateral
root formation and auxin signalling A role in
a different developmental program, the
formation of lateral roots, has been
demonstrated for NAC1. NAC1 was initially
examined because of its predominant
expression in the root tip and in lateral root
initiation points. NAC1 expression was
shown to be induced by the hormone auxin,
which is involved in lateral root production.
Over- and under expression of NAC1
increased or reduced lateral root formation,
respectively. In addition, the auxin
responsive genes AIR3 (AUXIN-INDUCED

Int.J.Curr.Microbiol.App.Sci (2016) 5(6): 527-562
532
IN ROOT CULTURES 3) and DBP (DNA-
BINDING PROTEIN) were identified in a
screen for downstream targets of NAC1
(Figure 1c). DBP encodes a DNA-binding
protein and AIR3 encodes a subtilizing-like
protease that might weaken cell-to-cell
connections to facilitate lateral root
emergence. Detailed studies have
demonstrated a specific activation of the
AIR3 promoter by NAC1. Defence and
abiotic stress Several NAC proteins have
been identified because they interact with
other proteins of biological importance. The
wheat (Triticum sp.) gemin virus RepA-
binding (GRAB) proteins GRAB1 and
GRAB2 were identified because of their
ability to interact with the wheat dwarf
Gemini virus RepA protein, and Arabidopsis
turnip crinkle virus (TCV)-interacting
protein (TIP) was identified because of its
binding to the TCV capsid protein (CP).
TCV induces a hypersensitive response and
systemic resistance in TCV-resistant
Arabidopsis. The ability of TCV to induce
resistance was dependent on interaction
between TCV CP and TIP, suggesting that
TIP is essential for the TCV resistance
response pathway. A function of NAC
proteins in biotic stress responses has also
been suggested by the induction of the
potato (Solanum tuberosum) StNAC gene
by Phytophthora infestans infection and
induction of several Brassica napus (rape)
NAC genes by insect herbivory and fungal
infection. The expression of several of these
genes was also induced by abiotic stress
such as wounding, cold shock and
dehydration. Recently, it was reported that
transgenic plants overexpressing three
different Arabidopsis NAC genes
(ANAC019, ANAC055 and ANAC072)
showed significantly increased drought
tolerance. Furthermore, ANAC072 {referred
to as RD26 (Kim et al., 2012) was shown to
function in a novel abscisic acid (ABA) -
dependent stress-signalling pathway. The
ANAC genes belong to a subgroup of NAC
genes defined by the wound-inducible
ATAF1 and ATAF2 genes, and were
upregulated by dehydration, high salinity
and ABA, and some also by methyl
jasmonate. In addition, the expression of
ANAC072 was shown to be induced by
reactive oxygen species. Overexpression of
the ANAC genes in transgenic plants
revealed potential, stress related target
genes. ANAC072 Trans activated the
promoter of one of these genes, encoding a
glyoxalase I family protein.
Various Functions of plant-specific NAC
transcription factors
NAC proteins are plant-specific TFs which
have been shown to function in relation to
plant development and also for abiotic
and/or biotic stress responses. (Ookaa et al.,
2012) The cDNA encoding a NAC protein
was first reported as the responsive to
dehydration gene in Arabidopsis. The NAC
domain was identified based on consensus
sequences from Petunia NAM and
Arabidopsis ATAF1/2 and CUC2 proteins
(the domain was named from their first
letters of the genes). Many NAC proteins,
including Arabidopsis CUC2, have
important functions in plant development.
Some NAC genes are up-regulated during
wounding and bacterial infection, whereas
others mediate viral resistance. NAC
proteins were thought to be transcriptional
activators as the Arabidopsis ATAF1/2
proteins can activate the CaMV 35S
promoter in yeast cells. The Arabidopsis
AtNAM (NARS2) protein was confirmed by
(Duval et al., 2011) to function as a
transcriptional activator in a yeast system
swell. In rice, Kikuchi et al., Described the
molecular properties of the eight NAC genes
in rice (OsNAC1 to OsNAC8) which encode
proteins with a single NAC domain. Each
OsNAC gene has a unique tissue-specific

Int.J.Curr.Microbiol.App.Sci (2016) 5(6): 527-562
533
expression pattern, suggesting this family
regulates the development of rice. (Ooka et
al., 2012) performed a comprehensive
analysis of NAC family genes in rice and
Arabidopsis. As a result of their studies,
they identified 75 predicted NAC proteins in
full-length cDNA datasets of rice and 105
predicted genes in the Arabidopsis genome.
Recently, (Nuruzzaman et al.,) conducted a
genome-wide analysis of the NAC
transcription factor family in rice and
Arabidopsis by investigating 151 non-
redundant NAC genes in rice and 117 in
Arabidopsis. Furthermore, it is suggested
that the prototypes of SNAC-A and SNAC-
B subgroups may have emerged after the
separation of lycophytes and other vascular
plants but prior to the separation of
monocots from dicots. Transcription factors
acting upstream of NAC genes is still
limited but recent reports have supplied
interesting examples of regulation at the
transcriptional level. Studies of the transition
from leaf cells to protoplasts have suggested
that the acquisition of pluri potentiality
involves the activation of several silent NAC
genes. A role in dedifferentiation is in
accordance with NAC gene function in
meristem development. Another example is
the maize (Zea mays) endosperm NAC gene
nrp1 (NAM-related protein 1), which is
regulated by gene specific imprinting. Thus,
paternally transmitted alleles are silenced,
allowing maternal control of endosperm
development .Post transcriptional control
miRNAs are small regulatory RNAs that
pair with target mRNAs, thereby providing
post-transcriptional repression of the targets.
Informatics analyses suggested that
transcription factors involved in cell-fate
determination are the predominant targets of
miRNAs in plants. A subset of Arabidopsis
NAC mRNAs, including CUC1, CUC2,
NAC1, At5g07680 and At5g61430, was
initially predicted to be targeted by members
of the miR164 gene family, and CUC1 and
CUC2 mRNAs were shown to be cleaved
within their miR164 complementary site. In
addition, expression of miR164-resistant
versions of CUC1 and CUC2 mRNAs, and
overexpression of miR164 proved that
miR164 is necessary for proper regulation of
CUC1 and CUC2. MiR164-directed
cleavage of NAC1, At5g07680 and
At5g61430 was also detected.
Structural feature of NAC proteins
The N-terminus of NAC proteins is a highly
homologous region containing the DNA-
binding NAC domain. The NAC domain is
approximately 150 amino acids in length
and contains five conserved regions (A to
E). The structure of the DNA-binding NAC
domain of Arabidopsis ANAC019
(Arabidopsis thaliana NAC019) has been
determined by X-ray crystallography. The
NAC domain was reported to lack a
classical helix–turn–helix motif; instead it
was revealed to possess a new-type of TF
fold consisting of a twisted beta-sheet that is
surrounded by a few helical elements. The
functional dimer formed by the NAC
domain was identified in the structural
analysis. Recently, the NAC domain
structure of a rice stress-responsive NAC
protein (SNAC1; STRESS-RESPONSIVE
NAC 1) was also determined. The structure
of the SNAC1 NAC domain shares a
structural similarity with the NAC domain
from Arabidopsis ANAC019. The
dimerization of the SNAC1 NAC domain
has also been demonstrated. Regarding
additional features in NAC proteins, the N-
terminal NAC domain also contains a
nuclear localization signal and the C-
terminal region is highly variable and
contains a transactivation domain. In some
NAC proteins, the C-terminal domains
exhibit protein-binding activity and others
contain transmembrane (TM) motifs.

Int.J.Curr.Microbiol.App.Sci (2016) 5(6): 527-562
534
NAC proteins related to abiotic stress
response in Arabidopsis
Our group isolated abiotic stress-responsive
NAC proteins as factors regulating the
expression of the EARLY RESPONSIVE
TO DEHYDRATION 1 (ERD1) gene in
Arabidopsis. Firstly, (Kiyosue et al, 2010).
Isolated the ERD1 cDNA encoding a Clp
protease regulatory subunit (ClpD) from a
cDNA library derived from one-hour-
dehydrated Arabidopsis plants. Nakashima
et al., subsequently isolated the promoter
region of the ERD1 gene and demonstrated
that ERD1 is not only induced by
dehydration but is also up-regulated during
senescence and dark induced etiolation.
Promoter analysis of ERD1 in transgenic
plants showed that two different novel cis-
acting elements, a MYC-like sequence
(CATGTG) and a rps1 site 1-like sequence
(CACTAAATTGTCAC), are involved in
induction by dehydration stress. Tran et al.,
used the yeast one-hybrid screening method
and isolated three kinds of homologous
SNAC group NAC proteins (ANAC019,
ANAC055 and ANAC072 (RD26)) that
bind to a region containing the MYC-like
sequence of the ERD1 promoter. The
expression of these genes is induced by
drought, high salinity and by the
phytohormones ABA and methyl jasmonic
acid (MeJA). A detailed DNA-binding assay
of these NAC proteins revealed that
“CACG” is a core sequence of the NAC
Recognition Sequence (NACRS).
Microarray analysis of transgenic plants
overexpressing either ANAC019,
ANAC055, or ANAC072 revealed that
several stress-inducible genes, including the
glyoxalase gene, were up-regulated in the
transgenic plants. Furthermore, the plants
were shown to have significant
improvements in their drought tolerance.
However, the expression of the ERD1 gene
was not up-regulated in the plants
overexpressing these NAC genes. CDNAs
for the TF that binds to the rps1 site 1-like
sequence was isolated by using the one
hybrid screening method. These cDNAs
encoded zinc-finger homeo domain (ZFHD)
proteins and one of these genes (ZFHD1)
was shown to function as a transcriptional
activator in response to dehydration stress.
Overproduction of both the NAC and ZFHD
proteins increased the expression of ERD1,
indicating that both cis-acting elements are
necessary for the expression of ERD1. The
NAC proteins are capable of functioning as
transcription activators in cooperation with
the ZFHD proteins or by functioning alone.
Recently, Wu et al., reported that
Arabidopsis plants overexpressing the
abiotic stress-responsive gene ATAF1,
which is homologous to RD26, showed
improved drought tolerance. These reports
indicate that NAC factors have important
roles for the control of abiotic stress
tolerance and that their overexpression can
serve as a potential biotechnological
application for improving the stress
tolerance of plants. In addition, they also
provided evidence that positive ABA-
regulatory functionality is associated with
both the ANAC019 TRD and the DBD.
Recently, an ABA perception and core
signalling module, including the ABA
receptor (PYR/PYL/RCAR), group a 2C-
type protein phosphatase (PP2C), and class
III SnRK2 protein kinases was identified.
Our group and another laboratory generated
a srk2d srk2e srk2i (srk2dei) triple mutant to
elucidate the function of class III SnRK2
protein kinases in Arabidopsis. Microarray
experiments revealed that the up that the
expression of stress-inducible NAC genes,
including RD26, were under the control of
the central ABA perception and signalling
module containing PYR/PYL/RCAR, PP2C,
and SnRK2.On the other hand, some NACs
function in relation to abiotic stresses in
addition to osmotic stresses including

Int.J.Curr.Microbiol.App.Sci (2016) 5(6): 527-562
535
drought and high salinity. For example,
RD26 was reported to be responsive to cold
stress. Morishita et al., also reported that
ANAC078 in the NAC group TIP (Fig. 1) is
responsive to a combination of high-light
and heat-stress. They also demonstrated that
ANAC078 regulates flavonoid biosynthesis,
leading to the accumulation of anthocyanins
under high-light conditions. These reports
indicate that various NAC factors function
in relation to numerous types of abiotic
stresses. Transcription factors (TF) are an
essential part in the transcription machinery
and the analysis of transcription factor
families is one of the major areas of
research. TFs are involved in the control of
transcription, an essential step in gene
expression. By and large, transcriptional
control leads to phenotypic divergence in
species, i.e. it brings about a change in key
physiological functions and thereby
regulates development. Though there are
several TF that are common to plants and
animals, NAC, and AP2/ERF TF are plant
specific while the WRKY transcription
factor family had origin in early eukaryotes
and greatly expanded in plants and they
have all been implicated in conferring
tolerance to different biotic and abiotic
stresses . Among the unique transcription
factor families, the NAC family is one with
probably the largest number of members of
plant specific TF. NAC (for NAM, ATAF1,
and CUC) was initially identified as a gene
essential for pattern formation in embryo
and flowers (NAM) in Petunia and organ
separation (CUC) in Arabidopsis. In
subsequent years it was found that NAC was
involved in various developmental process
like the formation of adventitious shoots,
shoot apical meristem flower development;
defence responses like conferring resistance
to turnip crinkle virus, response to wounding
and fungus infection, abiotic stress
responses like induction of dehydration
responsive genes, ABA cell signalling
pathway and attenuation of auxin signalling
(Sathesh et al., 2010).
33.3 million tons of hot pepper planted on
3.8 Mha (United Nations Food and
Agriculture Organization (FAO) statistics;
see URLs). In the last decade, world
production of hot pepper increased by 40%.
The pungency of hot pepper is due to the
accumulation of capsaicinoids, a group of
alkaloids that are unique to the Capsicum
genus. The heat sensation created by these
capsaicinoids is such a defining aspect of
this crop that the genus name Capsicum
comes from the Greek kapto, which means
„to bite‟. Capsaicin, dihydrocapsaicin and
nordihydrocapsaicin constitute the primary
capsaicinoids, which are produced
exclusively in glands on the placenta of the
fruit. The organoleptic sensation of heat
caused when capsaicin binds to the
mammalian transient receptor potential
vanilloid 1 (TRPV1) receptor in the pain
pathway7 can be argued to be a sixth taste
along with sweet, sour, bitter, salty and
umami (savory). M lation of the pathway is
not fully understood. With more than 22
capsaicinoids isolated from hot pepper, this
genus provides an excellent example for
exploring the evolution of secondary
metabolites in plants2. Capsaicinoids have
been found in nature to have antifungal and
antibacterial properties, to act as a deterrent
to animal predation when ingested and to
have inherent properties that aid in avian
seed dispersal. Capsaicinoids have many
health benefits for humans: they are
effective at inhibiting the growth of several
forms of cancer8–10, are an analgesic for
arthritis and other pain11, reduce appetite
and promote weight loss12–14. It is
surprising that a complete understanding of
the capsaicinoid pathway at the molecular
level is lacking, considering the economic
and cultural importance of capsaicinoids.
Here we report a high-quality genome

Int.J.Curr.Microbiol.App.Sci (2016) 5(6): 527-562
536
sequence for hot pepper. C. annuum cv.
CM334 (Criollo de Morelos 334), a landrace
collected from the Mexican state of
Morelos, has consistently exhibited high
levels of resistance to diverse pathogens,
including Phytophthora capsici, pepper
mottle virus and root-knot nematodes. This
landrace has been extensively used in hot
pepper research and cultivar breeding. We
also provide resequencing data for two
cultivated peppers and for a wild species, C.
chinense. Comparative genomics of
members of the Solanaceae family, which
includes hot pepper, provides an
evolutionary view into the genome
expansion, origin of pungency, distinct
ripening process and disease resistance of
hot pepper. This high-quality reference
genome of hot pepper will serve as a
platform for improving the horticultural,
nutritional and medicinal values of
Capsicum species (Kim s et al., 2011).
Agricultural productivity and yields are
dependent upon the environment a crop
encounters during its growth. In order to
burgeon, a species must learn adaptive
approaches against these recurrent
challenges. Grasses belonging to the genus
Setaria which have a world-wide existence,
provide a fine example of such species.
Particularly, Setaria italica, which was
domesticated from the problematic weed
Setaria viridis. 8700 years ago, is amongst
the oldest cultivated crops. This abiotic
stress-tolerant grass has presented itself as
an ideal model for understanding biological
processes in potential biofuel grasses such as
switch grass, napier grass and pearl millet as
they have closely-related but comparatively
complex genome. Considering this
importance, its genome has been recently
sequenced by two independent groups viz.,
Joint Genome Institute, Department of
Energy, USA and Beijing Genomics
Institute, China .Preliminary analysis of the
draft genome has revealed that the stress-
adaptive characteristics which foxtail millet
possesses have yet not been evolved in other
plants. Stress adaptation is a complex
incident as stress may occur at diverse
stages of plant development and often
multiple stresses concurrently affect the
plant. Comprehensive investigations have
revealed the molecular stress adaptation
mechanisms which are governed by
processes that allow regulated gene
expression by an accurate signalling and
tight transcriptional control. This entails
binding of specific transcription factors
(TFs) to cis-regulatory sequences in
promoter of a stress-responsive gene. A
corollary of this fact is that plants donate a
large part of their genome (?7%) to encode
TFs belonging several families, such as
AP2/ERF, bZIP, NAC, MYB, MYC,
Cys2His2, zinc-finger and WRKY, each
with a dedicated binding site through which
they can activate or repress the expression of
their respective target genes (puranik s et al
2012). As a crucial form of TFs, the well-
known NAC gene family has emerged as a
complex plant-specific superfamily. The
ellipsis, NAC, derives its name from three
earliest characterized proteins from petunia
NAM (no apical meristem), Arabidopsis
ATAF1/2 and CUC2 (cup-shaped
cotyledon). This family has been noted for
the presence of numerous members in the
model plant Arabidopsis (Arabidopsis
thaliana: 117), crops such as rice (Oryza
sativa: 151), soybean (Glycine max: 152),
tree species like poplar (Populus
trichocarpa: 163), grape (Vitis vinifera: 79)
and tobacco (Nicotiana tabacum: 152). It is
characterized by the presence of a highly
conserved NAC domain at N-terminal of the
protein, however some exceptions have also
been noted. Although this domain confines
the ability of DNA binding (DB), it shows
great variation in recognizing DB sites in the
target genes and atleast 5 different arrays
have been identified. This feature allows

Int.J.Curr.Microbiol.App.Sci (2016) 5(6): 527-562
537
them to regulate spatial and temporal
expression of a variety of downstream genes
towards governing multiple cellular or
molecular processes. The highly diverged C-
terminal end functions as a transcription
regulatory region, by conferring either
activation or repression activity. In some
NAC proteins, these N- or C-terminal
domains may modulate protein-protein
interactions. As an additional feature, some
NAC proteins comprise an a-helical
transmembrane (TM) motif for anchoring to
plasma membrane or endoplasmic
reticulum. Genes encoding NAC proteins
can be regulated (i) transcriptionally by
upstream TFs such as ABREs (ABA-
responsive elements) and DREs
(Dehydration-responsive elements), (ii) post
transcriptionally by micro-RNAs or
alternative splicing, and (iii) post
translationally by ubiquitinization,
dimerization, phosphorylation or
proteolysis. These regulatory steps assists
the functional involvement of NAC proteins
in majority of plant processes including
orchestration of organ, fiber and secondary
wall development, cell cycle control , and
senescence . Their multi-functionality has
also been implicated in the regulation of
molecular pathways that govern abiotic and
biotic stress responses through mediation by
hormones. Although about one fourth (20–
25%) NAC genes functions in at least one or
the stress-response, very few candidate
genes have been functionally characterized
for enhancement of stress tolerance
correspondingly, till now foxtail millet
invited little research with respect to
development of genetic, genomic and
functional resources although it is
potentially better stress tolerant when
compared to other staple cereals. The recent
release of its genome sequence facilitates the
prediction and systematic analysis of
important genes families, including the
multi-functional plant specific NAC TFs. In
this context, we conducted a genome-wide
survey and identified a comprehensive and
non-redundant set of 147 NAC genes from
foxtail millet (internally annotated as Setaria
italica NAC; SiNAC) and classified into
eleven classes on basis of the conserved
motifs and sequence phylogeny. Sequence
comparison of SiNAC genes with
themselves and with other monocots like
sorghum, maize and rice facilitated the
detection of presence and distribution of
paralogous and orthologous NAC genes
between the grasses. The experimental
outcomes have paved a way for further
comparative genomic and phylogenetic
analyses of NAC TFs among members of
grass family. Subsequently, quantitative real
time PCR (qRT-PCR)-based gene
expression profiling displayed temporal and
stress-specific expression pattern of selected
candidate SiNAC genes. Three-dimensional
structure determination and molecular
simulation of a stress-responsive protein
SiNAC128 was performed for understanding
the basis of its molecular function. This
study provides the first information about
foxtail millet NAC genes, which would
serve as potential candidates for dissecting
NAC-mediated regulatory pathways in this
significant yet neglected crop species
(Puranik s et al., 2012).
Materials and Methods
Materials used
Databases
Plant Transcription Database
The Plant Transcription Factor Database
(PlnTFDB; http://plntfdb.bio.uni-
potsdam.de/v3.0/) is an integrative database
that provides putatively complete sets of
transcription factors (TFs) and other
transcriptional regulators (TRs) in plant
species (sensu lato) whose genomes have

Int.J.Curr.Microbiol.App.Sci (2016) 5(6): 527-562
538
been completely sequenced and annotated.
The complete sets of 84 families of TFs and
TRs from 19 species ranging from
unicellular red and green algae to
angiosperms are included in PlnTFDB,
representing >1.6 billion years of evolution
of gene regulatory networks. For each gene
family, a basic description is provided that is
complemented by literature references, and
multiple sequence alignments of protein
domains. TF or TR gene entries include
information of expressed sequence tags, 3D
protein structures of homologous proteins,
domain architecture and cross-links to other
computational resources online. Moreover,
the different species in PlnTFDB are linked
to each other by means of orthologous genes
facilitating cross-species comparison.
Peeper genome database
Capsicum, commonly referred to as pepper,
is an economically important genus of the
Solanaceae family which includes tomato
and potato. The genus includes at least 32
species native to tropical America, of which
C. annuum L., C. baccatum L., C. chinense
Jacq., C. frutescens L., and C. pubescens
(Ruiz & Pavon) were domesticated as far
back as 6000 BC by Native Americans.
Peppers have a wide diversity of fruit shape,
size and color. Pungent peppers are used as
spices and sweet peppers as vegetables.
Following the return of Columbus from
America in 1492 and subsequent voyages of
exploration, peppers spread around the
world because of their adaptation to
different agroclimatic regions and food,
medical and ornamental uses. Global
production of pepper in 2010 reached 29.4
million tons of fresh fruit and 3.1 million
tons of dried pods produced on 3.9 million
hectares (http://www.fao.org). In spite of the
growing commercial importance of pepper,
the molecular mechanisms that modulate
fruit size, shape and yield are mostly
unknown. We sequenced the complete
genomes of wild Mexican pepper accession
“Chiltepin” and a Chinese inbred derivative
“Zunla-1” using the Illumina platform. As
one of the most important vegetable crops,
pepper genome will provide an invaluable
new resource for biological research and
breeding of Capsicum. To better manage the
pepper genome data and facilitate public
academic users to access the genome data
and related information, we developed the
Pepper Genome Database.
Software tools
Web Servers
Reduce redundancy tool
This program allows you to reduce the
redundancy in a set of aligned or unaligned
sequences. The algorithm used by this
program was developed by Cédric
Notredame and is unpublished. The trim
algorithm works as follow:
Computes all the pairwise alignments
(PAM250, gop=-10, gep=-1) or use a
multiple alignment.
Measure the %id (number id/number
matches) of each pair
If a minimum identity min% is set: all the
sequences with less than min% identity with
ANY sequence in the set will be removed so
that in the remaining set ALL the pairs of
sequences have more than min% identity.
The removal will stop uncompleted if the set
becomes smaller than n.
Remove one of the two closest sequences
until either n is reached or until all the
sequences have less than max% identity.
Return the new set.

Int.J.Curr.Microbiol.App.Sci (2016) 5(6): 527-562
539
ProtoParam tool
ProtParam (References / Documentation) is
a tool which allows the computation of
various physical and chemical parameters
for a given protein stored in Swiss-Prot or
TrEMBL or for a user entered protein
sequence. The computed parameters include
the molecular weight, theoretical pI, amino
acid composition, atomic composition,
extinction coefficient, estimated half-life,
instability index, aliphatic index and grand
average of hydropathicity (GRAVY)
Pfam
Pfam version 28.0 was produced at the
European Bioinformatics Institute using a
sequence database called Pfamseq, which is
based on UniProt release 2014_07. Pfam is
freely available under the Creative
Commons Zero ("CC0") licence. Pfam is
powered by the HMMER3 package written
by Sean Eddy and his group at the Howard
Hughes Janelia Research Campus, and built
by the Pfam consortium.
Smart
SMART (a Simple Modular Architecture
Research Tool) allows the identification and
annotation of genetically mobile domains
and the analysis of domain architectures.
More than 500 domain families found in
signalling, extracellular and chromatin-
associated proteins are detectable. These
domains are extensively annotated with
respect to phyletic distributions, functional
class, tertiary structures and functionally
important residues. Each domain found in a
non-redundant protein database as well as
search parameters and taxonomic
information are stored in a relational
database system. User interfaces to this
database allow searches for proteins
containing specific combinations of domains
in defined taxa. For all the details, please
refer to the publications on SMART.
Interproscan
The European Bioinformatics Institute is
part of EMBL, Europe‟s flagship laboratory
for the life sciences. EMBL-EBI provides
freely available data from life science
experiments covering the full spectrum of
molecular biology. While we are best known
for our provision of bioinformatics services,
about 20% of our institute is devoted to
basic research. Our extensive training
programme helps researchers in academia
and industry to make the most of the
incredible amount of data being produced
every day in life science experiments. We
are a non-profit, intergovernmental
organisation funded by EMBL member
states. Our 500 staff represent 43
nationalities, and we welcome a regular
stream of visiting scientists throughout the
year. We are located on the Wellcome
Genome Campus in Hinxton, Cambridge in
the United Kingdom.
Psipred
The PSIPRED protein structure prediction
server allows users to submit a protein
sequence, perform a prediction of their choice
and receive the results of the prediction both
textually via e-mail and graphically via the
web. The user may select one of three
prediction methods to apply to their sequence:
PSIPRED, a highly accurate secondary
structure prediction method; MEMSAT 2, a
new version of a widely used transmembrane
topology prediction method; or
GenTHREADER, a sequence profile based
fold recognition method. Psipred is available
athttp://globin.bio.warwick.ac.uk/psipred/.
Concord
Most of the protein structure prediction
methods use a multi-step process, which
often includes secondary structure
prediction, contact prediction, fragment

Int.J.Curr.Microbiol.App.Sci (2016) 5(6): 527-562
540
generation, clustering, etc. For many years,
secondary structure prediction has been the
workhorse for numerous methods aimed at
predicting protein structure and function.
This paper presents a new mixed integer
linear optimization (MILP)-based consensus
method: a Consensus scheme based on a
mixed integer linear optimization method
for secondary structure prediction
(CONCORD). Based on seven secondary
structure prediction methods, sspro, DSC,
PROF, PROFphd, PSIPRED, Predator and
GorIV, the MILP-based consensus method
combines the strengths of different methods,
maximizes the number of correctly predicted
amino acids and achieves a better prediction
accuracy. The method is shown to perform
well compared with the seven individual
methods when tested on the PDBselect25
training protein set using six fold cross
validation. It also performs well compared
with another set of 10 online secondary
structure prediction servers (including
several recent ones) when tested on the
CASP9 targets (http://prediction
center.org/casp9/). The average Q3
prediction accuracy is 83.04 per cent for the
six fold cross validation of the PDBselect25
set and 82.3 per cent for the CASP9 targets.
We have developed a MILP-based
consensus method for protein secondary
structure prediction. A web server,
CONCORD, is available to the scientific
community at
http://helios.princeton.edu/CONCORD .
Pred
JPred is a Protein Secondary Structure
Prediction server and has been in operation
since approximately 1998. JPred
incorporates the Jnet algorithm in order to
make more accurate predictions. In addition
to protein secondary structure JPred also
makes predictions on Solvent Accessibility
and Coiled-coil regions (Lupas method).
Standalone tools
BLAST
BLAST for Basic Local Alignment Search
Tool is an algorithm for comparing primary
biological sequence information, such as the
amino-acid sequences of different proteins
or the nucleotides of DNA sequences. A
BLAST search enables a researcher to
compare a query sequence with a library or
database of sequences, and identify library
sequences that resemble the query sequence
above a certain threshold.
MEGA
MEGA is an integrated tool for conducting
automatic and manual sequence alignment,
inferring phylogenetic trees, mining web-
based databases, estimating rates of
molecular evolution, inferring ancestral
sequences, and testing evolutionary
hypotheses.
i) MODELLER 9.15
MODELLER is used for homology
modelling of protein three dimensional
structures .The user provides an alignment
of a sequence to be modelled with known
related structures and MODELLER
automatically calculates a model containing
all non-hydrogen atoms. MODELLER
implements comparative protein structure
modelling by satisfaction of spatial restraints
and can perform many additional tasks;
MODELLER is available for download for
most Unix/Linux systems, Windows, and
Mac and is available at salilab.org/modeller.
PyMOL
PyMOL is a molecular modelling program
that is particularly effective for the
construction and 3D visualization of
macromolecules, including proteins and

Int.J.Curr.Microbiol.App.Sci (2016) 5(6): 527-562
541
protein –ligand complexes. PyMOL can be
used to visualize .pdb files, which contain a
refinement of a crystal structure It is
available at http://www.pymol.org/ under
“download.”
Discovery Studio
Discovery Studio is a suite of software for
simulating small molecule and
macromolecule systems. It is developed and
distributed by Accelrys. The product suite
has a strong academic collaboration
programme, supporting scientific research
and makes use of a number of software
algorithms developed originally in the
scientific community, including CHARMM,
MODELLER, DELPHI, ZDOCK, DMol3
and more.
Methods
Sequence retrieval from pepper genome
database
To identify members of the Capsicum NAC
gene family, Protein coding sequences from
two capsicum genomes i.e., Capsicum
annum L. Zunla1 and Capsicum annum var.
glabriusculum Chileptin were downloaded
from Pepper genome database.
Reference transcription factors sequences
Initially, 746 amino acid sequences
encoding NAC transcription factors from
Solanaceae were retrieved from plant
transcription factor database 3.0
(plntfdb.bio.uni-potsdam.de/). These
sequences were used as reference to identify
putative NAC transcription factors in
Capsicum protein coding gene sequences.
Moreover, the HMM profiles of the NAM
and NAC domains in the Pfam database
(http://pfam.sanger.ac.uk/) were searched
against the Capsicum protein coding
sequences.
Screening and identification of NAC
transcription factors
BLAST was locally configured and BLAST
search (E-value cut-off 1.0) was performed
using NAC transcription factors as query
against protein sequences of Capsicum
genome to screen putative NAC
TFs.Further, attempt was made to analyze
the domains of all of the Capsicum proteins
using a Hidden Markov Model (HMM)
profile of the NAM domain retrieved from
Pfam 26.0 (http://Pfam.sanger.ac.uk/) with
an expected value (e-value) cut-off of 1.0.
All identified protein models were subjected
to Pfam analysis to confirm the presence of
the NAM domain with an e-value cut-off of
1e-3.Combining the results from BLAST
search and PFAM, putative NAC TFs (from
both the genomes) were screened and
subjected to redundancy removal using
Reduce redundancy tool of EBI.
Primary characterization of NAC TFs
Each non-redundant sequence was checked
for the presence of the conserved NAC
domain by SMART
(http://smart.emblheidelberg.de/) and Pfam
(http://pfam.sanger.ac.uk/) searches.Physico-
chemical parameters including molecular
weight, isoelectric point, instability index,
alihphatic index and GARVY were elucidated
using Protparam tool of ExPASy
(http://web.expasy.org/protparam/).
Transmembrane motifs in the sequences were
identified with TMHMM Server v.2.0
(http://www.cbs.dtu.dk/services/TMHMM/)
using default parameters. The conserved
motifs in full-length NAC proteins were
identified using Multiple Expectation
Maximization for Motif Elicitation (MEME)
v. 4.9.0 (http://meme.nbcr.net/
meme3/meme.html). Analysis was performed
Int.J.Curr.Microbiol.App.Sci (2016) 5(6): 527-562
542
with the following parameters: number of
repetitions, any; maximum number of motifs,
20; and optimum width of the motif,
≥50.Discovered MEME motifs (≤1E-30) were
searched in the InterPro database with
InterProScan
(http://www.ebi.ac.uk/Tools/pfa/iprscan5/).
Phylogenetic study of NAC domains
Phylogenetic analysis
To clarify the phylogenetic relationships
among the Capsicum NAC proteins,
phylogenetic trees were constructed using
NAC domain and an un-rooted tree was
generated by constructing a multiple
sequence alignment with a gap open and gap
extension penalties of 10 and 0.1,
respectively using ClustalW Neighbor-
joining method was used for unrooted tree
construction with bootstrap analysis (1,000
replicates) in MEGAv6.0.
Homology Modelling of NAC Domains
To elucidate the three-dimensional
architecture of NAC domains, comparative
modelling approach was employed where
suitable templates were identified using
BLASTP, PSI-BLAST and DELTA-BLAST
search against PDB database. From each
genome only representative 5 NAC domains
were selected for homology modelling.
Identified templates were aligned with
respective target NAC domains. Based on
the target-template alignment, Modeller
facilitated in the development 50 rough
models of NAC domains in Capsicum
species. These theoretical structural models
of Cry1Id were ranked based on their
normalized discrete optimized protein
energy (DOPE) scores. The model with the
lowest value of the normalized DOPE score
is considered as the best model for energy
minimization in Discovery Studio3.5
(Accelrys, Inc. San Diego, USA).
Energy minimization
The best model (in each case) with lowest
DOPE score was subjected to energy
minimization by DS3.5 with the
minimization protocol. The minimization
protocol employs the steepest descent and
conjugate gradient methods of minimization
algorithms with a generalized born implicit
solvent model. In the present study the
following parameters are considered for the
structural minimization: distance-dependent
dielectric constant=1, non-bonded radius of
14 Å with CHARMM force field, spherical
electrostatic cut-off, and the steepest descent
algorithm to remove close van der Waals
contacts for a maximum steps of 5000 with
0.1 minimizing RMS gradient. Finally the
potential energy, van der Waals energy and
electrostatic energy for the minimized
models was determined using the calculate
energy protocol in DS3.5.
Model quality assessment
The refined models were evaluated by a
number of tools to test the internal
consistency and reliability of the model.
PROCHECK analysis which quantifies the
amino acid residues in the available zones of
Ramachandran plot, was used to assess the
stereo chemical quality of the models.
ERRAT tool, which finds the overall quality
factor of the protein, was used to check the
statistics of non-bonded interactions
between different atom types. The VERIFY-
3D program was used to determine the
compatibility of the atomic models (3D)
with its own amino acid sequence (1D). The
average magnitude of the volume
irregularities in the model was calculated
using PROVE program. PROVE program
uses an algorithm which treats the atoms

Int.J.Curr.Microbiol.App.Sci (2016) 5(6): 527-562
543
like hard spheres and calculates a statistical
Z-score (i.e., deviation) for the model from
highly resolved (2.0 Å or better) and refined
(R-factor of 0.2 or better). Standard bond
lengths and bond angles of the model were
determined using WHAT IF web server. The
estimated energy of the models was
calculated by the ANOLEA server.
Furthermore, the stereo-chemical
calculations were also performed using the
MetaMQAP, ProQ, and Mod FOLD version
4.0 servers. Also MolProbity web server
(http://molprobity.biochem.duke.edu/) was
used in the model validation process which
provides a detailed atomic contact analysis
of any steric problems within the molecules
as well as the dihedral-angle diagnostics.
Subsequently the Protein structure analysis
(ProSA-web)
(https://prosa.services.came.sbg.ac.at/prosa.
php) tool was employed in the refinement
and validation process to check the native
protein folding energy of the model by
comparing the energy of the models with the
potential mean force derived from a large set
of known protein structures. Structural
superimposition of proposed 3-D model
with its closest homologue was performed in
iPBA
(http://www.dsimb.inserm.fr/dsimb_tools/ip
ba/) web server. The iPBA web server
presented the root mean square deviation
(RMSD) between the Cα-atoms and all
atoms of the homology model and template.
To have a knowledge on the conservedness
in the secondary structure of the refined
model and the template, the pair-wise 3-D
structural alignment was performed in the
pair-wise 3-D alignment tool MATRAS
(Markovian transition of Structure
evolution) (http://strcomp.protein.osaka-
u.ac.jp/matras/). So as to ensure the
accuracy in the assignment of secondary
structure elements in the proposed models,
the results of secondary structure elements
assigned by STRIDE
(http://webclu.bio.wzw.tum.de/stride/) and
DSSP (http://swift.cmbi.ru.nl/gv/dssp/) was
compared with the results of CONCORD web
server.
Ramachandran Plot
A Ramachandran plot (also known as
a Ramachandran diagram or a (φ,ψ) plot),
originally developed in 1963 by G. N.
Ramachandran, C. Ramakrishna , and V.
Sasisekharan, is a way to visualize backbone
dihedral angles ψ against φ of amino
acid residues in protein structure. The figure
at left illustrates the definition of the φ and
ψ backbone dihedral angles (called φ and φ'
by Ramachandran). The ω angle at the
peptide bond is normally 180°, since the
partial-double-bond character keeps
the peptide planar. The figure at top right
shows the allowed φ,ψ backbone
conformational regions from the
Ramachandran et al., 1963 and 1968 hard-
sphere calculations: full radius in solid
outline, reduced radius in dashed, and
relaxed tau (N-Calpha-C) angle in dotted
lines. Because dihedral angle values are
circular and 0° is the same as 360°, the
edges of the Ramachandran plot "wrap"
right-to-left and bottom-to-top. For instance,
the small strip of allowed values along the
lower-left edge of the plot are a continuation
of the large, extended-chain region at upper
left.
Structure Validation and Functional
Region Identification
PROSA
ProSA is a tool widely used to check 3D
models of protein structures for potential
errors. Its range of application includes error
recognition in experimentally determined
structures theoretical models and protein
engineering. ProSA-web, that encompasses

Int.J.Curr.Microbiol.App.Sci (2016) 5(6): 527-562
544
the basic functionality of stand-alone ProSA
and extends it with new features that
facilitate interpretation of the results
obtained. The overall quality score
calculated by ProSA for a specific input
structure is displayed in a plot that shows the
scores of all experimentally determined
protein chains currently available in the
Protein Data Bank (PDB). This feature
relates the score of a specific model to the
scores computed from all experimental
structures deposited in PDB. Problematic
parts of a model are identified by a plot of
local quality scores and the same scores are
mapped on a display of the 3D structure
using color codes. It is available at
https://prosa.services.came.sbg.ac.at/prosa.p
hp.
Results and discussion
Methods
Sequence Retrieval and Identification of
NAC Domain Proteins from Capsicum
annum
Three different approaches were applied to
identify putative NAC domain containing
proteins from Capsicum annum. Initially,
898 amino acid sequences encoding NAC
transcription factors from four plants
(Arabidopsis thaliana, Oryza sativa, Zea
mays, solanum tubersum, solanum
lypersicum and Sorghum bicolor) were
retrieved from plant transcription factor
database 3.0 (plntfdb.bio.uni-potsdam.de/).
These sequences were used to identify
homologous peptides from sollanaci by
performing a BLASTP search at
PHYTOZOME v8.0 database (www.
phytozome.net/) using default parameters. In
addition, the database was searched using
the keywords „NAC‟, „no apical meristem‟
or „NAM‟‟. Moreover, the HMM profiles of
the NAM and NAC domains in the Pfam
database (http://pfam.sanger.ac.uk/) were
searched against the PHYTOZOME
database of Capsicum annum. Similarity
searches were also performed through
TBLASTN at NCBI database against the
EST sequences of Capsicum annum genome
to eliminate possible exclusions of any
additional NAC member. All hits with
expected values less than 1.0 were retrieved
and redundant sequences were removed
using the decrease redundancy
(web.expasy.org/decrease_redundancy).
Each non-redundant sequence was checked
for the presence of the conserved NAC
domain by SMART
(http://smart.emblheidelberg. de/) and Pfam
(http://pfam.sanger.ac.uk/) searches.
Transmembrane motifs in the sequences
were identified with TMHMM Server v.2.0
(http://www.cbs.dtu.dk/services/ TMHMM/)
using default parameters.
Chromosomal Location, Gene Structure
and Estimation of Genomic Distribution
Specific chromosomal position of the genes
encoding these SiNAC proteins were
determined by BLASTP search of the
Capsicum annum sequences against the
PHYTOZOME database using default
settings. The genes were plotted separately
onto the nine sollanaci chromosomes
according to their ascending order of
physical position (bp), from the short arm
telomere to the long arm telomere and
finally displayed using Map Chart. As a
gene family may be expanded through
tandem and segmental duplication events,
we intended to identify the mechanisms
involved for expansion of NAC members in
sollanaci. Segmental duplications were
identified based on the method of Plant
Genome Duplication Database. Briefly,
BLASTP search was executed against all
predicted peptide sequences of Capsicum
annum and top 5 matches with E-value, 1e-

Int.J.Curr.Microbiol.App.Sci (2016) 5(6): 527-562
545
05 were identified as potential anchors.
Collinear blocks were evaluated by MCScan
and alignments with E-value, 1e-10 were
considered as significant matches. Tandem
duplications were characterized as adjacent
genes of same sub-family located within10
predicted genes apart or within 30 kb of
each other. The exon-intron organizations of
the genes were determined using Gene
structure display server
(gsds.cbi.pku.edu.cn/) through comparison
of their full-length cDNA or predicted
coding sequence (CDS) with their
corresponding genomic sequence.
Step 2: Secondary structure prediction
and multiple alignments
To discover the conserved regions of 96
NAC genes, we performed Sequence
alignment by using PRALINE, default
parameter were set to BLOSUM62 weight
matrix , associated gap penalty 12 open and
1 extension , and secondary structure was
predicted by applying psipred server with
default parameters setting NR PSI-BLAST
and DSSP TRAINED neural nets, we also
executed motif search by applying meme
suite. After getting the results of multiple
sequence alignment, secondary structure
prediction and motif search, we have come
to conclude that all 96 NAC genes have
highly conserved domains and most of the
sequences are dominated by helix
possession.
STEP 3 Domain search of NAC protein
After the final 92 sequences were retrieved
Arbitrary chosen NAC domain useing
SMART, INTERPROSCAN and Pfam, Was
used for the domain search.
Primary Characterisation of NAC TFs
Physico-chemical parameters including
molecular weight, isoelectric point,
instability index, alihphatic index and
GARVY were elucidated using Protparam
tool of ExPASy
(http://web.expasy.org/protparam/).
Phylogenetic Analysis
The amino acid sequences were imported
into MEGA 6.0 and multiple sequence
alignments were performed using ClustalW
with a gap open and gap extension penalties
of 10 and 0.1, respectively. The alignment
file was then used to construct an uprooted
phylogenetic tree based on the neighbour -
joining method and after bootstrap analysis
for 1000 replicates, the tree was displayed
using Interactive tree of life.
STEP 4: Secondary structure prediction
SOPMA
Steps for SOPMA
The secondary structure prediction was done
by SOPMA
By seeing the alpha value, beta value and
coil turn sheet secondary structure
prediction has been done.
The table 4.5 and 4.6 shows the SOPMA
results.
STEP-5: Templates identified using
BLASTP, PSI-BLAST and
DELTA_BLAST search
against PDB to model NAC
domains identified from NAC
TFs of Capsicum genome
After secondary structure prediction the
value of α, β and turn coil have been
predicted by SOPMA.
Then the best template search has been done
by protein BLAST against PDB id.

Int.J.Curr.Microbiol.App.Sci (2016) 5(6): 527-562
546
Then the BLAST sequence has been
modelled
The result of BLAST has been shown in
table 4.7 and 4.8.
The best template found are been
highlighted.
Tertiary Structure Identification
After finding the best five template from
Zunla 1 and chileptein are being modelled
using MODELLER 9.5 the model have been
generated are shown below.
Extensive genome wide screening resulted a
total of 186 non-redundant (37 from
Capsicum annum L. Zunla_1 and 42 from
Capsicum annum var. glabriusculum
Chiltepin) NAC transcription factors from
Capsicum species. Domain architecture and
phylogenetic analysis showed that NAC
gene family are highly diverse in nature
even though they possess highly conserved
N-Terminal region. Most members
contained a complete NAC DNA-binding
domain and a variable transcriptional
regulation domain. Furthermore, most of the
gene found in the nuclear region and
dominated by the possession of helix region.
Distinct compositions of the putative motifs
were revealed on the basis of NAC protein
sequences in Capsicum. Sequence analysis,
together with the organization of putative
motifs, indicated distinct structures and
potential diverse functions of NAC family in
Capsicum species.
Table.1 Statistics of hot pepper genome and gene annotation
Number of scaffolds 37,989
Total length of scaffolds 3.06 Gb
Anchored scaffolds 2.63 Gb (86.0%)
N50 of scaffolds 2.47 Mb
Longest (shortest) scaffolds 18.6 Mb (264 bp)
Number of contigs 337,328
Total length of contigs 2.96 Gb
N50 of contigs 30.0 kb (24,618th)
Longest (shortest) contigs 442.1 kb (71 bp)
GC content 35.03%
Number of genes 34,903
Average/total coding sequence length 1,009.9/35.2 Mb
Average exon/intron length 286.5 bp/541.6 bp
Table.2 Species collected
Capsicum annum L. Glabriusculum Chiltepin
3536 4597
12.1 MB 14.94 MB

Int.J.Curr.Microbiol.App.Sci (2016) 5(6): 527-562
547
Table.3 Reference Genome
Plant Name No. of transcription factor
Solanum Tubersum 131
Solanum Lypopersicum 101
Oryza sativa subsp. Japonica 170
Oryza barthii 140
Oryza brachyantha 118
Oryza glaberrima 117
Oryza punctate 142
Nicotina tabacum 42
TOTAL 1004/8133
Table.4 NAC domain position with NAC TFs identified from Zunla_1 (C. annuum L.) and its
wild progenitor Chiltepin (C. annuum var. glabriusculum)
Zunla-1 Chiltepin
Sequence ID Domain position Sequence ID Domain position
>Capang06g001635 >Capang00g001342 >Capang02g000055 >Capang06g002229 >Capang05g002025
>Capang07g002464 >Capang02g002410 >Capang06g001474 >Capang11g001762 >Capang03g003256 >Capang06g000574 >Capang04g001450 >Capang05g000480
>Capang03g000984 >Capang01g000591 >Capang06g000704 >Capang04g000043 >Capang06g002270 >Capang03g000737 >Capang02g003111 >Capang07g001770
>Capang12g001767 >Capang06g000116 >Capang07g002241 >Capang06g001635 >Capang01g001704 >Capang03g001717 >Capang00g000431 >Capang01g004302
>Capang02g000055 >Capang03g002576 >Capang02g002041 >Capang02g003111 >Capang02g003090 >Capang02g003279 >Capang05g001291 >Capang11g002132 >Capang05g001119
>Capang05g002025
9-132 33-161 6-134 7-115
10-138
31-160 5-139 6-134 9-135
10-138 29-156 8-133
13-138
3-129 19-145 18-147 22-150 6-134
19-145 14-142 82-223
4-132 10-140 16-144 9-132
14-141 27-156 14-140 32-159
6-134 5-134 6-134
14-142 16-142 53-196 7-134
102-240 48-192
10-138
>Capana03g002678 >Capana12g002456 >Capana01g004489 >Capana06g001739 >Capana00g001918
>Capana02g000057 >Capana05g002476 >Capana07g002471 >Capana06g001560 >Capana11g001813 >Capana03g003315 >Capana06g000625 >Capana05g001292
>Capana05g001365 >Capana04g001537 >Capana05g000569 >Capana03g001027 >Capana06g000752 >Capana04g000414 >Capana04g000051 >Capana06g002441
>Capana03g000802 >Capana02g003374 >Capana07g001769 >Capana12g002058 >Capana04g000417 >Capana06g000136 >Capana07g002220 >Capana01g002000
>Capana03g001780 >Capana09g000936 >Capana08g001727 >Capana02g002277 >Capana02g003352 >Capana02g003557 >Capana05g001593 >Capana11g002231 >Capana05g002477
>Capana06g003012
59-198 2-81
12-139 9-132
34-160
7-133 11-137 32-159 7-133
10-134 11-137 30-155 1-80
49-191 9-132
14-137 4-128
19-146 10-118 23-149 7-133
20-144 15-141 83-222 5-131
10-118 11-139 17-143 15-140
28-155 15-139 32-157 7-133
15-141 56-197 17-144 102-240 19-145
11-137

Int.J.Curr.Microbiol.App.Sci (2016) 5(6): 527-562
548
>Capang05g002026 >Capang06g002772 >Capang06g002229 >Capang06g001635
>Capang01g004302 >Capang07g002241 >Capang03g000737 >Capang11g000319 >Capang02g000055 >Capang05g002026 >Capang05g002025 >Capang06g002772
>Capang06g000704 >Capang12g001767 >Capang01g001065 >Capang12g002104 >Capang12g002106 >Capang05g001291 >Capang03g002576 >Capang01g000591
44-170 11-137 7-115 9-132
32-159 16-144 19-145 47-152 6-134
44-170 10-138 11-137
18-147 4-132
12-137 11-140 48-174 7-134 5-134
19-145
>Capana01g002406 >Capana06g001387 >Capana07g002159 >Capana01g001228
>Capana12g002457 >Capana11g000346 >Capang03g000737 Capang11g000319
>Capang02g000055 >Capang05g002026 >Capang05g002025 >Capang06g002772
>Capang06g000704 >Capang12g001767 >Capang01g001065 >Capang12g002104 >Capang12g002106 >Capang05g001291 >Capang03g002576 >Capang01g000591
10-137 9-136
11-137 12-137
49-175 47-172 19-145 47-152 6-134
44-170 10-138 11-137
18-147 4-132
12-137 11-140 48-174 7-134 5-134
19-145
Fig. 4.1: NAC Domain alignment of Chileptein
Fig. 4.2: NAC Domain alignment of Zunla_1
Chileptein

Int.J.Curr.Microbiol.App.Sci (2016) 5(6): 527-562
549
Table.5 Physico-chemical characterisation of NAC transcription factors identified from two
genomes of Capsicum species using ProtParam tool of ExPaSy Zunla_1 (C. annuum L.)
Sequence ID No. of
amino acid
Molecular
weight (kDa) PI
Instability
index
Aliphatic
index GRAVY
Capang03g002576 290 33.0666 8.46 48.61 76.86 -0.657
Capang12g002104 528 58.9613 4.78 33.91 70.42 -0.577
Capang08g001341 313 35.9111 6.11 46.00 64.76 -0.785
Capang06g001635 294 33.6662 6.26 54.98 67.69 -0.660
Capang00g00132 598 65.8700 4.84 45.81 66.06 -0.610
Capang02g000055 577 65.9552 5.09 46.61 63.55 -0.705
Capang06g002229 316 36.6281 6.11 42.20 66.36 -0.806
Capang05g002025 543 60.6187 4.68 38.22 70.42 -0.468
Capang07g002464 323 37.2216 7.13 50.81 60.99 -0.796
Capang02g002410 296 33.9693 6.60 57.08 68.82 -0.706
Capang06g001474 342 38.4157 5.63 48.75 55.56 -0.618
Capang001762 294 33.9183 6.66 30.45 67.59 -0.652
Capang003256 290 33.3445 5.86 47.06 65.17 -0.650
Capang00054 408 45.9157 9.10 47.15 70.44 -0.552
Capang004003 459 51.2797 5.98 49.69 52.46 -0.936
Capang05g1119 486 53.9603 6.45 48.75 65.62 -0.739
Capang001450 290 33.3169 8.10 49.60 66.62 -0.610
Capang09g001941 132 15.2614 9.37 33.60 64.24 -0.645
Capang05g000480 306 34.9414 6.96 37.23 62.84 -0.694
Capang03g000984 284 32.0148 4.71 29.48 78.20 -0.553
Capang01g000591 356 39.6510 7.62 33.23 68.38 -0.372
Capang06g000704 637 70.1060 4.77 37.43 76.50 -0.505
Capang04g000383 373 41.5550 5.05 46.94 59.95 -0.643
Capang04g000043 402 45.3429 6.11 28.81 65.30 -0.618
Capang06g002270 334 37.8961 5.38 43.01 51.95 -0.700
Capang03g000737 332 38.1330 7.08 30.81 65.15 -0.669
Capang02g003111 397 44.8412 6.14 43.73 65.31 -0.570
Capang07g001770 325 36.5264 7.70 34.03 75.51 -0.550
Capang12g001767 719 79.5033 4.70 38.67 77.16 -0.288
Capang04g000385 371 40.9581 4.67 56.14 63.69 -0.662
Capang06g000116 287 33.3714 5.67 40.00 71.32 -0.671
Capang04g002241 339 37.9185 8.56 42.37 65.60 -0.727
Capang06g001635 294 33.6662 6.26 54.98 67.69 -0.660
Capang01g001704 247 28.1949 9.53 40.67 59.96 -0.730
Capang03g001717 632 69.8746 4.83 39.15 69.72 -0.588
Capang12g002106 425 47.5245 5.35 53.43 72.73 -0.626
Capang00g000431 350 39.6168 9.11 32.70 72.14 -0.644
Capang02g000055 577 65.9552 5.09 46.61 63.55 -0.705
Capang05g001292 411 46.2679 6.64 51.28 67.64 -0.561
Capang02g002041 632 72.5194 5.83 43.54 70.02 -0.619
Capang02g003090 326 37.2779 7.58 44.92 57.70 -0.786
Capang02g003279 385 42.9157 5.03 45.05 64.83 -0.752
Capang00g001342 586 65.8700 4.84 45.81 66.06 -0.610
Capang05g001291 411 46.2679 6.64 51.28 67.64 -0.561
Capang05g002026 420 47.4850 5.70 50.32 74.48 -0.473
Capang06g002772 290 33.3967 5.88 46.35 69.62 -0.575
Capang06g002229 316 36.6281 6.11 42.20 66.36 -0.806
Capang06g001635 294 33.6662 6.26 54.98 67.69 -0.660
Capang01g004302 409 46.4232 6.63 55.66 68.70 -0.787
Capang07g002241 339 37.9185 8.56 42.37 65.60 -0.727
Capang11g000319 414 46.5895 8.86 49.47 70.14 -0.731
Capang02g0055 577 65.9552 5.09 46.61 63.55 -0.705
Capang01g001065 348 38.9664 7.20 42.51 49.89 -0.770

Int.J.Curr.Microbiol.App.Sci (2016) 5(6): 527-562
550
(b) Chiltepin (C. annuum var. glabriusculum)
Sequence ID
No. of
amino
acid
Molecular
Weight
(kDa)
PI Instability
index
Aliphatic
index GRAVY
Capana03g002 290 33.0666 8.46 48.61 76.86 -0.657
Capana12g0022456 476 52.8764 4.60 32.05 69.92 -0.556
Capana01g004489 313 35.9411 6.11 46.28 64.44 -0.793
Capana06g001739 213 24.5653 9.10 47.18 70.56 -0.697
Capana00g001918 586 65.8360 4.80 44.93 66.21 -0.603
Capana02g000057 577 66.0173 5.09 47.38 62.88 -0.708
Capana05g002476 551 61.6118 4.69 40.20 69.93 -0.479
Capana07g002471 323 37.1936 7.15 50.78 61.58 -0.802
Capana11g001813 294 33.8462 7.05 31.38 67.59 -0.642
Capana03g003315 290 33.3445 5.86 47.06 65.15 -0.650
Capana05g001292 459 51.2655 5.81 49.97 52.46 -0.934
Capana04g001537 290 33.3169 8.10 49.60 66.62 -0.610
Capana03g001027 284 32.0409 4.90 28.97 78.20 -0.558
Capana04g00414 356 39.5315 4.91 46.51 59.24 -0.769
Capana04g000051 390 44.1115 6.28 29.54 66.31 -0.618
Capana07g001769 325 36.5724 7.22 34.36 74.31 -0.582
Capana04g000417 371 40.9581 4.67 56.14 63.69 -0.662
Capana06g000136 287 33.3714 5.67 38.86 71.32 -0.669
Capana01g002000 248 28.3391 9.59 41.55 58.15 -0.766
Capana02g002277 632 72.5675 5.89 43.65 70.02 -0.615
Capana02g003557 387 43.1040 5.03 44.87 64.50 -0.744
Capana01g002406 303 34.9318 7.79 36.78 60.20 -0.865
Capana06g000625 408 45.9046 9.00 48.64 69.49 -0.565
Capana07g002159 323 36.2277 8.80 43.87 60.71 -0.531
Capana03g001780 632 69859.6 4.88 38.45 69.72 -0.589
Capana11g002231 506 57.5254 5.51 48.24 72.79 -0.752
Capana02g003374 397 44.8412 6.14 43.73 65.31 -0.570
Capana02g003352 326 37.3040 7.58 44.92 58.90 -0.771
Capana09g000936 350 39.6168 9.11 32.70 72.14 -0.644
Capana05g1365 486 53.9603 6.45 48.75 65.62 -0.739
Capana06g002441 334 37.9091 5.38 42.92 51.95 -0.708
Capana08g001727 408 46.3112 6.64 55.77 68.87 -0.787
Capana07g002220 340 37.9915 8.56 42.84 65.12 -0.734
Capana03g000802 332 38.0949 7.08 30.27 64.58 -0.674
Capana11g000346 414 46.5895 8.86 49.47 70.14 -0.731
Capana05g002477 396 44.6363 5.41 52.75 68.66 -0.629
Capana06g003012 290 33.3826 5.88 46.61 69.62 -0.575
Capana06g001387 322 37.5936 5.85 46.51 52.70 -0.937
Capana06g000752 637 70.1060 4.77 37.43 76.50 -0.505
Capana12g002058 719 79.4972 4.68 40.07 77.02 -0.289
Capana01g001228 352 39.1947 7.20 43.54 49.32 -0.765
Capana12g002457 424 47.6276 5.35 53.60 72.32 -0.619
Capana05g001593 410 46.2109 6.64 51.08 67.80 -0.561
Capana05g000569 306 34.9419 7.08 37.23 62.84 -0.694
Capana01g000650 356 39.6530 7.08 33.60 68.40 -0.376

Int.J.Curr.Microbiol.App.Sci (2016) 5(6): 527-562
551
Table.6 Secondary structure prediction
(a) Chileptein
Sequence id SOPMA
Heli (%) Beta sheet % Turn coils %
Capang03g002576 10 11.72 44.14
Capang12g002104 28.60 6.63 45.64
Capang08g001341 20.45 9.90 47.60
Capang06g001635 20.41 6.12 55.10
Capang00g001342 26.45 7.85 45.05
Capang02g000055 29.98 8.15 45.41
Capang06g002229 32.59 8.23 45.57
Capang05g002025 26.52 6.63 47.33
Capang07g002464 29.55 6.50 51.08
Capang02g002410 28.38 10.81 39.53
Capang06g001474 13.16 7.89 56.73
Capang11g001762 21.09 7.14 49.32
Capang03g003256 16.00 9.66 47.59
Capang06g000574 25.98 7.60 45.59
Capang00g004003 15.69 7.84 61.0
Capang05g001119 16.87 7.61 56.17
Capang04g001450 20.34 7.59 52.07
Capang09g001941 13.64 15.91 35.61
Capang05g000480 24.84 8.50 48.37
Capang03g000984 29.23 8.45 36.97
Capang01g000591 21.91 9.83 44.66
Capang06g000704 23.23 8.16 49.14
Capang04g000313 35.92 4.29 47.18
Capang04g000043 25.02 11.19 40.80
Capang06g002270 7.78 8.88 61.08
Capang03g000737 28.61 6.33 44.28
Capang02g003111 22.92 9.07 50.38
Capang07g001770 20.62 10.15 46.15
Capang12g001767 21.28 7.79 47.29
Capang04g000385 37.20 4.58 44.74
Capang06g000116 21.60 10.80 40.42
Capang07g002241 15.34 10.03 55.16
Capang06g001635 20.41 6.12 55.10
Capang01g001704 22.67 11.34 38.87
Capang03g001717 25.32 7.12 47.94
Capang12g002104 28.60 6.63 45.64
Capang00g00431 28.86 8.57 42.29
Capang01g004302 25.43 5.62 50.12
Capang02g000055 29.98 8.15 45.41
Capang03g002576 10.00 11.72 44.14
Capang02g002041 25.47 8.39 47.63
Capang02g003090 20.25 8.90 48.47
Capang02g003279 24.16 7.27 47.27
Capang00g001342 26.45 7.85 45.05
Capang05g001291 33.58 7.79 44.28
Capang11g002132 31.60 8.73 37.84
Capang05g002025 26.52 6.63 47.33
Capang05g002026 31.19 8.83 42.62
Capang06g002772 22.41 13.10 34.66
Capang06g002229 32.59 8.23 45.57
Capang06g001635 20.41 6.12 55.10
Capang01g004302 25.43 5.62 50.12
Capang11g000319 28.02 9.66 46.86
Capang07g002241 15.34 10.03 55.16
Capang12g001767 21.28 7.79 47.29
Capang01g001065 25.86 6.90 46.55
Capang12g002106 35.53 7.53 43.06
Capang05g001291 33.58 7.79 44.28
Capang00g001342 26.45 7.85 45.05
Capang01g001591 21.91 9.83 44.60

Int.J.Curr.Microbiol.App.Sci (2016) 5(6): 527-562
552
(b) Zunla_1
Sequence id SOPMA
Helix (%) Beta sheet % Turn coils %
Capana03g002678 10.00 11.72 44.14
Capana12g002456 28.78 6.93 43.49
Capana01g004489 20.45 9.90 47.60
Capana06g001739 23.00 7.04 51.64
Capana00g001918 26.28 7.51 46.25
Capana02g000057 29.64 8.67 45.06
Capana05g002476 27.04 6.53 47.19
Capana07g002471 26.93 6.50 51.70
Capana11g001813 20.41 7.48 50.0
Capana03g003315 16.90 9.66 47.59
Capana05g001292 15.69 7.84 61.00
Capana04g001537 20.34 7.59 52.07
Capana03g001027 29.23 8.45 37.32
Capana04g000414 33.71 4.78 50.84
Capana04g000051 26.15 11.03 41.03
Capana07g001769 18.77 10.77 47.08
Capana04g000417 37.20 4.58 44.74
Capana06g000136 21.60 10.80 40.42
Capana01g002000 22.18 10.48 39.92
Capana02g002277 25.32 7.91 48.42
Capana02g003557 23.77 7.24 47.80
Capana01g002406 23.43 11.22 46.86
Capana06g000625 25.98 8.82 47.61
Capana03g001780 25.16 7.28 47.78
Capana07g002159 23.53 6.50 49.54
Capana11g002231 33.20 8.30 36.96
Capana02g003374 22.92 9.07 50.38
Capana02g003352 21.78 9.51 46.93
Capana09g000936 28.86 8.57 42.29
Capana05g001365 16.87 7.61 56.17
Capana06g002441 7.78 8.68 60.78
Capana08g001727 25.49 5.64 50.25
Capana03g000802 28.01 5.72 44.88
Capana07g002220 15.29 9.12 56.18
Capana11g000346 28.02 9.66 46.86
Capana05g002477 28.28 9.09 45.20
Capana06g003012 23.10 13.79 37.93
Capana06g001387 18.94 6.83 51.86
Capana06g000752 23.23 8.16 49.14
Capana12g002058 21.56 7.65 46.45
Capana01g001228 25.57 7.10 47.16
Capana12g002457 35.12 7.98 42.96
Capana05g001593 33.66 8.05 43.90
Capana05g000569 24.84 8.50 48.37
Capana01g000650 21.07 9.83 45.22
Capana03g002678 10.00 11.72 44.14
Capana12g002456 28.78 6.93 43.49
Capana01g004489 20.45 9.90 47.60
Capana06g001739 23.00 7.04 51.64
Capana00g001918 26.28 7.51 46.25
Capana02g000057 29.64 8.67 45.06
Capana05g002476 27.04 6.53 47.19
Capana07g002471 26.93 6.50 51.70
Capana11g001813 20.41 7.48 50.0
Capana03g003315 16.90 9.66 47.59
Capana05g001292 15.69 7.84 61.00
Capana04g001537 20.34 7.59 52.07
Capana03g001027 29.23 8.45 37.32
Capana04g000414 33.71 4.78 50.84
Capana04g000051 26.15 11.03 41.03
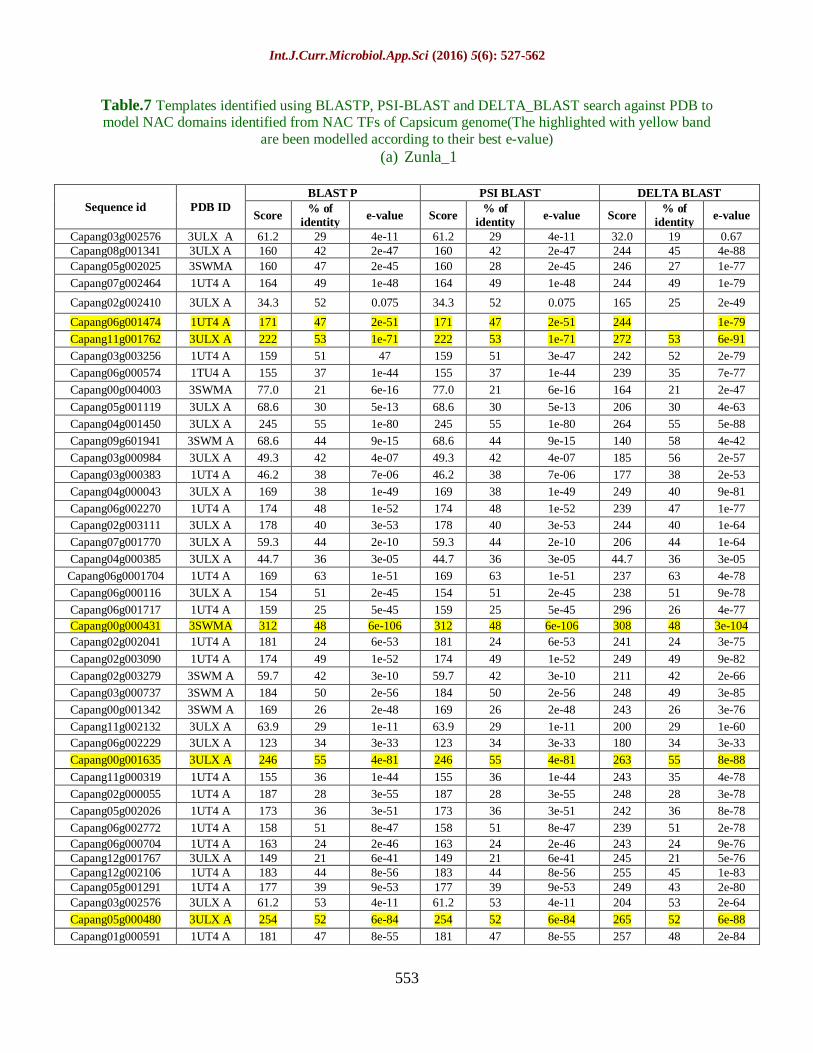
Int.J.Curr.Microbiol.App.Sci (2016) 5(6): 527-562
553
Table.7 Templates identified using BLASTP, PSI-BLAST and DELTA_BLAST search against PDB to model NAC domains identified from NAC TFs of Capsicum genome(The highlighted with yellow band
are been modelled according to their best e-value)
(a) Zunla_1
Sequence id PDB ID
BLAST P PSI BLAST DELTA BLAST
Score % of
identity e-value Score
% of
identity e-value Score
% of
identity e-value
Capang03g002576 3ULX A 61.2 29 4e-11 61.2 29 4e-11 32.0 19 0.67
Capang08g001341 3ULX A 160 42 2e-47 160 42 2e-47 244 45 4e-88
Capang05g002025 3SWMA 160 47 2e-45 160 28 2e-45 246 27 1e-77
Capang07g002464 1UT4 A 164 49 1e-48 164 49 1e-48 244 49 1e-79
Capang02g002410 3ULX A 34.3 52 0.075 34.3 52 0.075 165 25 2e-49
Capang06g001474 1UT4 A 171 47 2e-51 171 47 2e-51 244 1e-79
Capang11g001762 3ULX A 222 53 1e-71 222 53 1e-71 272 53 6e-91
Capang03g003256 1UT4 A 159 51 47 159 51 3e-47 242 52 2e-79
Capang06g000574 1TU4 A 155 37 1e-44 155 37 1e-44 239 35 7e-77
Capang00g004003 3SWMA 77.0 21 6e-16 77.0 21 6e-16 164 21 2e-47
Capang05g001119 3ULX A 68.6 30 5e-13 68.6 30 5e-13 206 30 4e-63
Capang04g001450 3ULX A 245 55 1e-80 245 55 1e-80 264 55 5e-88
Capang09g601941 3SWM A 68.6 44 9e-15 68.6 44 9e-15 140 58 4e-42
Capang03g000984 3ULX A 49.3 42 4e-07 49.3 42 4e-07 185 56 2e-57
Capang03g000383 1UT4 A 46.2 38 7e-06 46.2 38 7e-06 177 38 2e-53
Capang04g000043 3ULX A 169 38 1e-49 169 38 1e-49 249 40 9e-81
Capang06g002270 1UT4 A 174 48 1e-52 174 48 1e-52 239 47 1e-77
Capang02g003111 3ULX A 178 40 3e-53 178 40 3e-53 244 40 1e-64
Capang07g001770 3ULX A 59.3 44 2e-10 59.3 44 2e-10 206 44 1e-64
Capang04g000385 3ULX A 44.7 36 3e-05 44.7 36 3e-05 44.7 36 3e-05
Capang06g0001704 1UT4 A 169 63 1e-51 169 63 1e-51 237 63 4e-78
Capang06g000116 3ULX A 154 51 2e-45 154 51 2e-45 238 51 9e-78
Capang06g001717 1UT4 A 159 25 5e-45 159 25 5e-45 296 26 4e-77
Capang00g000431 3SWMA 312 48 6e-106 312 48 6e-106 308 48 3e-104
Capang02g002041 1UT4 A 181 24 6e-53 181 24 6e-53 241 24 3e-75
Capang02g003090 1UT4 A 174 49 1e-52 174 49 1e-52 249 49 9e-82
Capang02g003279 3SWM A 59.7 42 3e-10 59.7 42 3e-10 211 42 2e-66
Capang03g000737 3SWM A 184 50 2e-56 184 50 2e-56 248 49 3e-85
Capang00g001342 3SWM A 169 26 2e-48 169 26 2e-48 243 26 3e-76
Capang11g002132 3ULX A 63.9 29 1e-11 63.9 29 1e-11 200 29 1e-60
Capang06g002229 3ULX A 123 34 3e-33 123 34 3e-33 180 34 3e-33
Capang00g001635 3ULX A 246 55 4e-81 246 55 4e-81 263 55 8e-88
Capang11g000319 1UT4 A 155 36 1e-44 155 36 1e-44 243 35 4e-78
Capang02g000055 1UT4 A 187 28 3e-55 187 28 3e-55 248 28 3e-78
Capang05g002026 1UT4 A 173 36 3e-51 173 36 3e-51 242 36 8e-78
Capang06g002772 1UT4 A 158 51 8e-47 158 51 8e-47 239 51 2e-78
Capang06g000704 1UT4 A 163 24 2e-46 163 24 2e-46 243 24 9e-76
Capang12g001767 3ULX A 149 21 6e-41 149 21 6e-41 245 21 5e-76
Capang12g002106 1UT4 A 183 44 8e-56 183 44 8e-56 255 45 1e-83
Capang05g001291 1UT4 A 177 39 9e-53 177 39 9e-53 249 43 2e-80
Capang03g002576 3ULX A 61.2 53 4e-11 61.2 53 4e-11 204 53 2e-64
Capang05g000480 3ULX A 254 52 6e-84 254 52 6e-84 265 52 6e-88
Capang01g000591 1UT4 A 181 47 8e-55 181 47 8e-55 257 48 2e-84

Int.J.Curr.Microbiol.App.Sci (2016) 5(6): 527-562
554
(b) Chileptin
Sequence ID PDB ID
BLAST P PSI BLAST DELTA BLAST
Score % of
identity e-value Score
% of
identity e-value Score
% of
identity e-value
Capana03g002678 3ULX A 61.2 29 4e-11 61.2 29 4e-11 204 53 8e-64
Capana12g002456 1UT4 A 108 21 3e-27 108 21 3e-27 166 21 4e-48
Capana01g004489 3ULXA 160 55 1e-47 160 55 1e-47 245 54 3e-80
Capana01g001739 3ULXA 244 76 3e-81 244 76 3e-81 253 75 5e-85
Capana00g001918 3ULXA 167 21 9e-48 167 21 9e-48 243 26 3e-76
Capana02g000057 IUT4A 187 28 4e-55 187 28 4e-55 248 28 3e-78
Capana05g002476 35WMA 159 28 3e-45 159 28 3e-45 246 27 1e-77
Capana07g002471 IUT4A 164 50 1e-48 164 50 1e-48 244 51 1e-79
Capana11g001813 3ULXA 222 53 1e-71 222 53 1e-71 272 53 5e-91
Capana03g003315 IUT4A 159 51 3e-47 159 51 3e-47 242 52 2e-79
Capana05g001292 IUT4A 16.6 21 6e-16 76.6 21 6e-16 164 22 2e-47
Capana04g001537 3ULXA 245 55 1e-80 245 55 1e-80 264 55 5e-88
Capana03g001027 3ULXA 50.1 42 3e-07 50.1 42 3e-07 183 50 2e-56
Capana04g000414 IUT4A 47.0 40 4e-06 47.0 40 4e-06 179 40 4e-54
Capana04g000051 IUT4A 169 40 7e-50 169 40 7e-50 249 42 6e-81
Capana07g001769 3ULXA 59.7 44 2e-10 59.7 44 2e-10 206 44 9e-65
Capana04g000417 3ULXA 44.7 36 3e-50 44.7 36 3e-05 194 36 7e-60
Capana06g000136 3ULXA 154 51 4e-45 154 51 4e-45 238 51 9e-78
Capana01g002000 IUT4A 171 63 3e-52 171 63 3e-52 239 63 6e-79
Capana02g002277 IUT4 181 24 7e-53 181 24 7e-53 241 24 4e-75
Capana02g003557 3SWMA 59.7 42 2e-10 59.7 42 2e-10 211 42 3e-66
Capana01g002406 3ULXA 170 49 4e-51 170 49 4e-51 249 49 5e-82
Capana06g000625 3SWMA 155 37 1e-44 155 37 1e-44 240 35 6e-77
Capana07g002159 IUT4A 176 48 3e-53 176 48 3e-53 229 39 4e-74
Capana03g001780 IUT4A 159 25 8e-45 159 25 8e-45 246 26 4e-77
Capana11g002231 3ULXA 63.9 27 1e-11 63.9 27 1e-11 200 27 1e-60
Capana02g003374 3ULX 178 40 3e-53 178 40 3e-53 244 40 1e-78
Capana02g003352 3SWM 174 49 1e-52 174 49 1e-52 249 49 1e-81
Capana09g000936 3SWM 312 48 6e-106 342 48 6e-106 308 48 3e-104
Capana05g001365 3ULXA 68.6 30 5e-13 68.6 30 5e-13 206 30 4e-63
Capana06g002441 IUT4A 175 48 8e-53 175 48 8e-53 239 47 7e-78
Capana00g001727 IUT4A 185 35 5e-56 185 35 5e-56 241 35 2e-71
Capana07g002220 IUT4A 228 49 4e-73 228 49 4e-73 263 47 5e-87
Capana03g000802 IUT4A 184 50 2e-56 184 50 2e-56 259 49 3e-85
Capana11g000346 IUT4A 155 36 1e-44 155 36 1e-44 243 35 4e-78
Capana05g002477 3SVVM 173 38 2e-51 173 38 2e-51 244 38 1e-78
Capana05g002477 IUT4A 158 51 8e-47 158 51 8e-47 239 51 3e-78
Capana06g003012 3ULXA 162 46 8e-48 162 46 8e-48 238 48 2e-77
Capana06g001387 3ULXA 162 46 8e-48 162 46 8e-48 238 48 2e-77
Capana06g000752 IUT4A 163 24 2e-46 163 24 2e-46 243 24 9e-70
Capana12g002058 3ULXA 149 21 5e-41 149 21 5e-41 246 21 4e-76
Capana12g002058 IUT4A 183 44 9e-56 183 44 9e-56 255 44 1e-83
Capana01g001228 3SWM 172 35 9e-51 172 35 9e-51 247 36 1e-79
Capana12g002457 3SWMA 172 35 9e-51 172 35 9e-51 247 36 1e-79
Capana05g001593 IUT4A 177 39 8e-53 177 39 8e-53 249 43 2e-80
Capana05g000569 3ULXA 254 53 6e-84 254 52 6e-84 265 52 6e-88
Capana01g000650 IUT4A 181 47 7e-55 181 47 7e-55 257 48 2e-84

Int.J.Curr.Microbiol.App.Sci (2016) 5(6): 527-562
555
Fig. 4.3: Phylogenetic tree of Chileptein
Zunla_1
Fig. 4.4: Phylogenetic tree for Zunla_1
Chileptein

Int.J.Curr.Microbiol.App.Sci (2016) 5(6): 527-562
556
Fig. 4.5: Capang00g000431Fig. 4.6: Capang05g000480
Fig. 4.9: Capang11g001762
Fig. 4.7: Capang06g001474Fig. 4.8: Capang00g00163
Zunla_1
Fig. 4.10: Capana04g001537Fig. 4.11: Capana05g000569Fig. 4.12: Capana01g001739
Fig. 4.13: Capana11g001813Fig. 4.14: Capana09g000936
STEP-6
Ramachandran Plot (chileptein)

Int.J.Curr.Microbiol.App.Sci (2016) 5(6): 527-562
557
Fig. 4.15: Capang00g000431 Fig. 4.16: Capang05g000480
Fig. 4.17: Capang06g001474 Fig. 4.18: Capang00g001635
Fig. 4.19: Capang11g001762
Zunla_1
Fig. 4.20: Capana04g001537 Fig. 4.21: Capana05g000569

Int.J.Curr.Microbiol.App.Sci (2016) 5(6): 527-562
558
Fig. 4.22: Capana01g001739 Fig. 4.23: Capana11g001813
Fig. 4.24: Capana09g000936
Chileptein
Fig.4.25: Capang00g000431 Fig.4.26: Capang05g000480
Fig.4.27: Capang06g001474 Fig. 4.28: Capang00g001635
Fig. 4.29: Capang11g001762

Int.J.Curr.Microbiol.App.Sci (2016) 5(6): 527-562
559
ZUNLA_1
Fig.4.30: Capana04g001537 Fig.4.31: Capana05g000569
Fig.4.32: Capana01g001739 Fig.4.33: Capana11g001813
Fig.4.34: Capana09g000936
Taken together, NAC family was
comprehensive characterized from
Capsicum species may serve as a future
genetic resource to elucidate candidate
stress-responsive NAC TFs. In the future, a
combination of reverse genetics, genomics,
and proteomic approaches in various
developmental stages and stress conditions
will provide us with critical information to
elucidate the functional differences of the
stress-responsive NAC factors and their
relationship in transcriptional control. Since
numerous NAC factors have various
functions in plant growth and development,
including senescence as well as stress
responses, the functions of NAC
transcription factors and NAC network will
also be analysed in relation to the crosstalk
between stress responses and plant growth.
Overall, our work has laid a solid foundation
for further characterization of this important
NAC gene family in Capsicum species.
Acknowledgement
First of all we want to give our extreme
thanks to Dr.Budheswar Dehury for his
support and guidance for which the entire
work may not be completed. Thenwe would
acknowledge to the Department of
Biotechnology, Govt. of India, for providing
the BIF Centre facility to carry out the

Int.J.Curr.Microbiol.App.Sci (2016) 5(6): 527-562
560
current research work. We would like to
express our heartfelt gratitude to Department
of Bioinformatics, Center for post graduate
studies, Orissa University of Agriculture
Technology, Bhubaneswar, and Odisha,
India. Then we would express our deepest
thanks to our uncle Prof.Sudhakar
Mishra,New York, USA for encouraging
and guiding throughout our professional
career and at last we would also thank to
ourparents without their blessings and love
which couldn‟t be possible.
References
Cheng Qina, Changshui Yu. et al., 2014.
Whole-genome sequencing of cultivated
and wild peppers provides insights into
Capsicum domestication and
specialization, PNAS, 111(14): 5135–
5140.
Fang, Y., You, J., Xie, K., Xie, W., Xiong,
L. et al., 2008. Systematic sequence
analysis and identification of tissue-
specific or stress-responsive genes of
NAC transcription factor family in rice.
Molecular Genetics Genomics, 280:
535-46.
Gong, W., Shen, Y.P., Ma, L.G., Pan, Y.,
Du, Y.L., Wang, D.H. et al. 2004.
Genome-wide ORFeome cloning and
analysis of Arabidopsis transcription
factor genes, Plant Physiol., 135: 773-
82.
Guo Y and Gan S. et al.,, 2006. AtNAP, a
NAC family transcription factor, has an
important role in leaf senescence. The
Plant J., 46: 601–612.
Hazen, S.P., Wu, Y., Kreps, J.A. et al.,
2003. Gene expression profiling of plant
responses to abiotic stress. Function
Integer Genomics, 3: 105-11.
Hu, H., Dai, M., Yao, J., Xiao, B., Li, X.,
Zhang, Q. et al., 2006. Over expressing
a NAM, ATAF and CUC (NAC)
transcription factor enhances drought
resistance and salt tolerance in rice.
Proceeding Natl. Academics Sci., 103:
12987-92.
John, I., Hackett, R., Cooper, W., Drake, R.,
Farrell, A., Grierson, D. et al. 1997.
Cloning and characterization of tomato
leaf senescence-related cDNAs. Plant
Mol. Biol., 33: 641-51.
Kacperska, A. et al., 2004. Sensor types in
signal transduction pathways in plant
cells responding to abiotic stressors: do
they depend on stress intensity. Physiol.
Plant, 122: 159-68.
Katerji, N., van Horn, J.W., Hamdy, A.,
Mastrorilli, M. et al. 2004. Comparison
of corn yield response to plant water
stress caused by salinity and drought.
Agri. Water Manage, 65: 95-101.
Katerji, N., van Horn, J.W., Hamdy, A,
Mastrorilli, S. et al. 2003. Effect on crop
development and yield, analysis of salt
tolerance according to several
classification methods. Agri. Water
Manage, 62: 37-66.
Kim, S., Park, M. et al. 2014. Genome
sequence of the hot pepper provides
insights into the evolution of pungency
in Capsicum species. Nature Genetics,
46(3): 270-279.
Liao, Y., Zou, H.F., Wei, W., Hao, .Y.J,
Tian, A.G., Huang, J. et al. 2008.
Soybean GmbZIP144, GmbZIP162 and
GmbZIP178 genes function as negative
regulator of ABA signaling and confer
salt and freezing tolerance in transgenic
Arabidopsis. Planta, 228: 225-40.
Manavalan, L.P., Guttikonda, S.K. Tran L-
SP and Nguyen HT et al.,, 2009.
Physiological and molecular approaches
to improve drought resistance in
soybean. Plant Cell Physiol., 50: 1260-
76.
Nakashima, K., Ito, Y., Yamaguchi-
Shinozaki, K. et al. 2009.
Transcriptional regulatory networks in
response to abiotic stresses in

Int.J.Curr.Microbiol.App.Sci (2016) 5(6): 527-562
561
Arabidopsis and grasses. Plant Physiol.,
149: 88-95.
Nakashima, K., Ito, Y., Yamaguchi-
Shinozaki, K. et al. 2012.
Transcriptional regulatory networks in
response to abiotic stresses in
Arabidopsis and grasses. Plant Physiol.,
149: 88-95.
Nakashima, Y., Ito, K,. Yamaguchi-
Shinozaki, K. et al. 2009.
Transcriptional regulatory Networks in
response to abiotic stresses in
Arabidopsis and grasses, Plant Physiol.,
149: 88–95.
Olsen, A.N., Ernst, H.A., Leggio, L.L.,
Skriver, K. et al. 2005. NAC
transcription factors: structurally
distinct, functionally diverse. Trends
Plant Sci., 10: 79-87.
Olsen, A.N., Ernst, H.A., Leggio, L.L.,
Skriver, K. et al. 2005. NAC
transcription factors: structurally
distinct, functionally diverse. Trends
Plant Sci., 10: 79-87.
Phillips, T., Hoopes, L. et al. 2008.
Transcription factors and transcriptional
control in eukaryotic cells. Nature
Education, 104: 20623-8.
Riechmann, J.L., Heard, J., Martin, G.,
Reuber, L., Jiang, C., Keddie, J. et al.
2000. Arabidopsis transcription factors:
genome-wide comparative analysis
among eukaryotes. Planta, 290: 2105-
10.
Seki, M., Kamei, A., Yamaguchi-Shinozaki,
K., Shinozaki, K. et al. 2003. Molecular
responses to drought, salinity and frost:
common and different paths for plant
protection. Curr. Open Biotechnol., 14:
194-9.
Thomashow, M.F. et al. 1999. Plant cold
acclimation Freezing tolerance genes
and regulatory mechanisms. Plant
Physiol. Plant Mol. Biol., 50: 571-99.
Tran, L.S.P., Nakashima, K., Sakuma, Y.,
Simpson, S.D., Fujita, Y., Maruyama, K.
et al. 1998. Isolation and functional
analysis of Arabidopsis stress-inducible
NAC transcription factors that bind to a
drought-responsive cis-element in the
early responsive to dehydration stress 1
promoter. Plant Cell, 16: 2481-98.
Tran, L.S.P., Nakashima, K., Shinozaki, K.,
Yamaguchi- Shinozaki, K. et al. 2007.
Plant gene networks in osmotic stress
response: from genes to regulatory
networks. Methods Enzymol., 428: 109-
28.
Tran, L.S.P., Quach, T., Guttikonda, S.K.,
Aldrich, D.L., Rajesh, K., Neelakandan,
A. et al. 2009. Molecular
characterization of stress-inducible
GmNAC genes in soybean. Mol.
Genetics Genomics, 281: 647-64.
Tran, L.S.P., Urao, T., Qin, F., Maruyama,
K., Kakimoto, T., Shinozaki, K. et al.
2009. Functional analysis of AHK1/
ATHK1 and cytokinin receptor histidine
kinases in response to abscisic acid,
drought and salt stress in Arabidopsis.
Proceeding Natl. Academics Sci., 104:
20623-8.
Uauy, C., Distelfeld, A., Fahima, T., Blechl,
A., Dubcovsky, J.A. et al. 2006. NAC
gene regulating senescence improves
grain protein, zinc and iron content in
wheat. Proceeding Natl. Academics Sci.,
314: 1298-301.
Udvardi, M.K., Kakar, K., Wandrey, M.,
Montanari, O., Murray, J., Andriankaja,
A. et al. 2007. Legume transcription
factors: global regulators of plant
development and response to the
environment. Plant Physiol., 144: 538-
49.
Udvardi, M.K., Kakar, K., Wandrey, M.,
Montanari, O., Murray, J., Andriankaja,
A. et al. 2007. Legume transcription
factors: global regulators of plant
development and response to the
environment. Plant Physiol., 144: 538-
49.

Int.J.Curr.Microbiol.App.Sci (2016) 5(6): 527-562
562
Umezawa, T., Fujita, M., Fujita, Y.,
Yamaguchi-Shinozaki, K., Shinozaki, K.
et al. 2006. Engineering drought
tolerance in plants: discovering and
tailoring genes to unlock the future.
Curr. Open Biotechnol., 17: 113-22.
Valliyodan, B., Nguyen, H.T. et al. 2006.
Understanding regulatory networks and
engineering for enhanced drought
tolerance in plants. Curr. Open Plant
Biol., 9: 189-95.
Wang, W., Vinocur, B., Altman, A. et al.
2003. Plant responses to drought,
salinity and extreme temperatures:
towards genetic engineering for stress
tolerance. Planta, 218: 1-14.
Xiong, Y., Liu, T., Tian, C., Sun, S., Li, J.,
Chen, M. et al. 2005. Transcription
factors in rice: a genome-wide
comparative analysis between monocots
and eudicots. Plant Mol. Biol., 59: 191-
203.
Yamaguchi-Shinozaki, K., Shinozaki, K. et
al., 2005. Organization of cis-acting
regulatory elements in osmotic- and
cold-stress-responsive promoters. Trends
Plant Sci., 10: 88-94.
Yamaguchi-Shinozaki, K., Shinozaki, K. et
al. 2005. Organization of cis-acting
regulatory elements in osmotic- and
cold-stress-responsive promoters. Trends
Plant Sci., 10: 88-94.
Yamaguchi-Shinozaki, K., Shinozaki, K. et
al. 2006. Transcriptional regulatory
networks in cellular responses and
tolerance to dehydration and cold
stresses. Plant Physiol. Plant Mol. Biol.,
57: 781-803.
Yamaguchi-Shinozaki, K., Shinozaki, K. et
al. 2006. Transcriptional regulatory
networks in cellular responses and
tolerance to dehydration and cold
stresses, Annual Rev. Plant Biol., 57:
781–803.
Zhang, J.Z., Creelman, R.A., Zhu, J.K. et al.
2004. From laboratory to field. Using
information from Arabidopsis to
engineer salt, cold and drought tolerance
in crops. Plant Physiol., 135: 615-21.
Zhou, Q.Y., Tian, A.G., Zou, H.F., Xie,
Z.M., Lei, G., Huang, J. et al. 2008.
Soybean WRKY-type transcription
factor genes, GmWRKY13,
GmWRKY21 and GmWRKY54, confer
differential tolerance to abiotic stresses
in transgenic Arabidopsis plants. Plant
Biotechnol. J., 6: 486-503.
Zhu, J.K. et al. 2002. Salt and drought stress
signal transduction in plants. Plant
Physiol. Plant Mol. Biol., 53: 247-73.
How to cite this article:
Swastik Swagat Mishra, Ayushman Gadnayak, Sambhunath Mandal and Budheswar Dehury.
2016. Genome Wide Screening, Identification and Characterization of NAC Transcription
Factors from Capsicum Species: An In Silico Approach. Int.J.Curr.Microbiol.App.Sci. 5(6):
527-562. doi: http://dx.doi.org/10.20546/ijcmas.2016.506.059
Recommended