INVESTOR PRESENTATIONNovember 2017

DISCLAIMERThis presentation contains forward-looking statements within the meaning of the federalsecurities laws, which statements involve substantial risks and uncertainties. Forward-lookingstatements generally relate to future events and include, without limitation, projections, forecastsand estimates about possible or assumed future results of the Company’s business, financialcondition, liquidity, results of operations, plans and objectives. In some cases, you can identifyforward-looking statements because they contain words such as “may,” “might,” “will,” “would,”“should,” “expect,” “plan,” “anticipate,” “could,” “intend,” “target,” “project,” “contemplate,”“believe,” “estimate,” “predict,” “likely,” “potential” or “continue” or the negative of these words orother similar terms or expressions that concern our expectations, strategy, plans or intentions.
These forward-looking statements are necessarily based upon estimates and assumptions that,while considered reasonable by the Company and its management, are inherently uncertain.Factors that may cause actual results to differ materially from current expectations include, butare not limited to, those factors identified in the Company’s prospectus in the sections titled “Riskfactors,” “Special note regarding forward-looking statements” and “Management’s discussion andanalysis of financial condition and results of operations.” New risks and uncertainties arise overtime, and it is not possible for us to predict all such factors or how they may affect us.
Nothing in this presentation should be regarded as a representation by any person that theforward-looking statements set forth herein will be achieved or that any of the contemplatedresults of such forward-looking statements will be achieved. You should not place undue relianceon forward-looking statements, which speak only as of the date they are made. The Companyundertakes no duty to update these forward-looking statements. Certain of the economic andmarket information contained herein has been obtained from published sources and/or preparedby other parties. None of the Company or any of its directors, stockholders, officers, affiliates,employees, agents or advisers, nor any other person, assumes any responsibility for theaccuracy, reliability or completeness of any information in this presentation, and we expresslydisclaim any obligation or undertaking to release publicly any updates or revisions to anyforward-looking statements to reflect any change in expectation or events, conditions orcircumstances on which such statements are based.
This presentation includes certain non-GAAP financial measures, including Adjusted EBITDA.These non-GAAP financial measures should be considered only as supplemental to, and not assuperior to, financial measures prepared in accordance with GAAP. Please refer to the Appendixof this presentation for a reconciliation of Adjusted EBITDA to net income, the most directlycomparable financial measure prepared in accordance with U.S. GAAP.
This presentation is confidential and may not be reproduced or otherwise distributed ordisseminated, in whole or part, without the prior written consent of the Company, which consentmay be withheld in its sole and absolute discretion.
Any investment in the Company will be subject to certain risks related to the nature of theCompany’s business and the structure and operations of the Company. Any investment in theCompany should be made only with an appreciation of the applicable risks, which are describedin the Company’s filings with the SEC.

MANAGEMENT PRESENTERS
30 years in the industry
5 years with MasterCraft
Senior executive roles at both Brunswick and Correct Craft
TERRY MCNEW PRESIDENT & CEO
27 years in the industry
11 years with MasterCraft
16 years at Brunswick
TIM OXLEY CFO

▪ Global, premium, performance-based lifestyle brand
▪ Leading U.S. market share in the performance sport boat (“PSB”)
category
▪ Highly-engineered performance sport boats used for water skiing,
wakeboarding and wake surfing, as well as general recreational
boating
▪ Relentless focus on innovation with 28 patents issued and pending,
and several notable recent achievements and upcoming releases
▪ The strongest dealer network in the performance sport boat
category with 97 North American dealers with 157 locations and 48
international dealers with 81 locations
▪ Attractive customer demographics with exceptional customer loyalty
INTRODUCTION TO MASTERCRAFT
_____________________
Note: Pro-Forma Net Sales and Adjusted EBITDA represent the Company financials excluding the results of operations of its Hydra-Sports
business and certain other non-cash or non-operating expenses. See Appendix for reconciliation of Adjusted EBITDA.
Pro-Forma Net Sales (1)
$ in millions
RAPID GROWTH
Adjusted EBITDA (1)
$ in millions
Margin 15.8%11.2%7.9%
$148.8$163.6
$199.9$221.6 $228.6
0
50
100
150
200
250
FY2013 FY2014 FY2015 FY2016 FY2017
$11.8$18.4
$31.5
$41.2 $43.5
0
10
20
30
40
50
FY2013 FY2014 FY2015 FY2016 FY2017
18.6% 19.0%

EVOLUTION OF THE CATEGORY INNOVATOR
1968 1976 1980 1989 1996 2003 2004 2013 2014 20152009
MASTERCRAFT’S
FIRST CUSTOM
HULL SKI BOAT
FIRST POWERSLOT
TRANSMISSION
(LATER PATENTED
IN 1981)
DEDICATED
WAKEBOARD-SPECIFIC
BOAT USED IN
ESPN’S X-GAMES
NOW
POPULAR
PICKLE-FORK
STYLE BOW
INDUSTRY’S FIRST
WAKE SHAPING
SURF TABS
WON 2 OF 3 NMMA
INNOVATION
AWARDS AT THE
MIAMI BOAT SHOW
FIRST SWIM
PLATFORM
AND SKI BOAT
MUFFLERS
PATENTED
WEARGUARD
PYLON
V-DRIVE
DRIVETRAIN
TWIN
V-DRIVE
ENGINE
PATENTED
GEN 2 FULLY
INTEGRATED
SURF SYSTEM
WON 1 OF 3 NMMA
INNOVATION
AWARDS
AT THE
MIAMI BOAT SHOW
LAUNCH
OF THE
MASTERCRAFT
NXT20
2017
RECENTLY
PATENTED
DOCKSTAR
COOLFEEL
VINYL
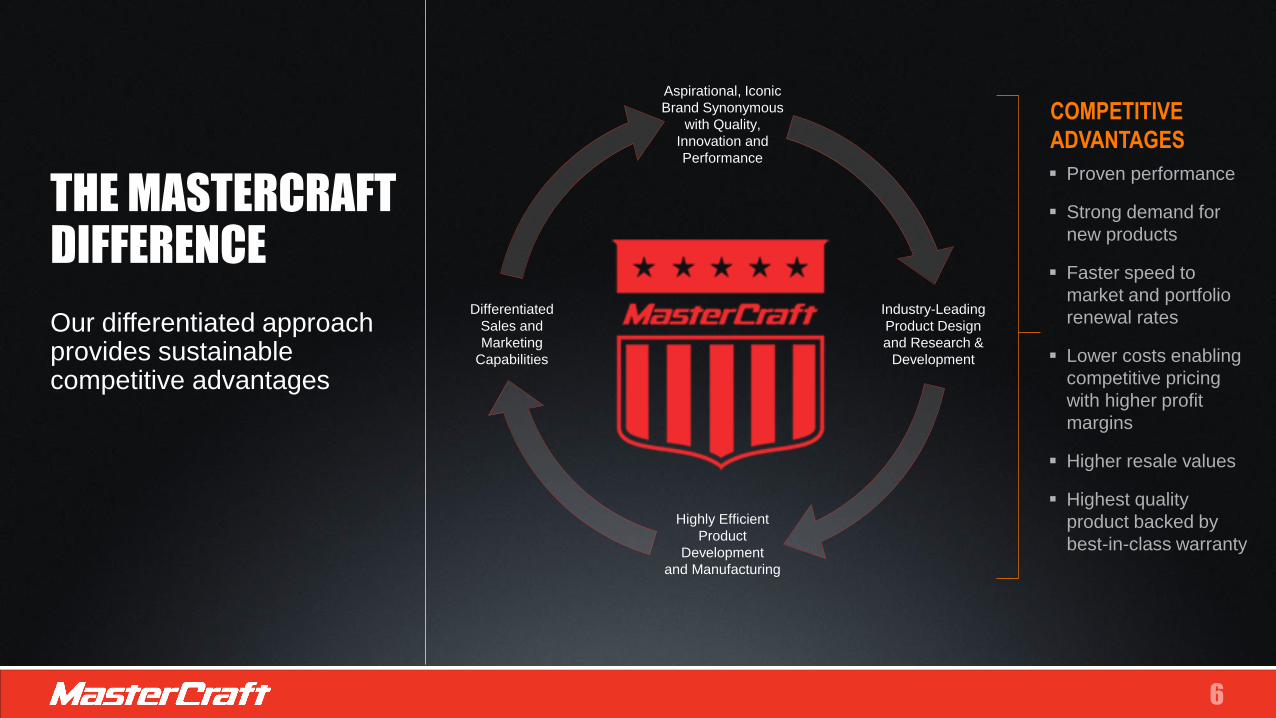
THE MASTERCRAFT DIFFERENCE
Our differentiated approach provides sustainable competitive advantages
▪ Proven performance
▪ Strong demand for
new products
▪ Faster speed to
market and portfolio
renewal rates
▪ Lower costs enabling
competitive pricing
with higher profit
margins
▪ Higher resale values
▪ Highest quality
product backed by
best-in-class warranty
COMPETITIVE
ADVANTAGES
Differentiated
Sales and
Marketing
Capabilities
Aspirational, Iconic
Brand Synonymous
with Quality,
Innovation and
Performance
Industry-Leading
Product Design
and Research &
Development
Highly Efficient
Product
Development
and Manufacturing

PRODUCT PORTFOLIO ATTRACTING WIDE CUSTOMER BASENXT Series XSeries Star Series
ProStar XStar
Entry level series designed to appeal
to a younger demographic and
broader customer base in an effort to
move more people into the
MasterCraft brand
Appeal to a range of recreational
activities by optimizing key wake
characteristics to provide best-in-class
wakeboarding and wake surfing
performance and recreational water
skiing performance
Appeal to a range of recreational and
advanced riders by optimizing key
wake characteristics to provide best-
in-class wakeboarding and wake
surfing performance and recreational
water skiing performance
Engineered to offer
superior water ski
performance by
minimizing wake height
to create a nearly flat
surface required for
world-class water skiing
Engineered to offer
superior wakeboard
performance with a hull
designed for large,
powerful clean wakes
for advanced
wakeboarders
Retail Price Range:
$50K - $75K
Lengths: 20 – 22’
Retail Price Range:
$80K - $125K
Lengths: 20 –23’
Retail Price Range:
$70K - $175K
Lengths: 20 – 26’
Retail Price Range:
$60K - $75K
▪ Lengths: 20’
Retail Price Range:
$130K - $160K
▪ Lengths: 23’
Models: 3 Models: 4 Models: 4 Models: 1 Models: 1
Maximum Persons: 11 Maximum Persons: 16 Maximum Persons: 11-18 Maximum Persons: 7 Maximum Persons:
16
Maximum Power: 365 hp Maximum Power: 522 hp Maximum Power: 522 hp Maximum Power: 430
hp
Maximum Power:
522 hp
XT Series

… And Have the Results to Prove Our Execution on These Strategies
SUCCESSFULLY EXECUTING ON GROWTH STRATEGIES FROM IPO
_____________________
Source: Company Filings, Earnings Transcripts and the Annual New Boat Dealer Survey conducted by B. Riley & Co.
We Continue to Focus on the Growth Strategies Presented During the July 2015 IPO…
Further Strengthen Dealer Network
Continuous Operational Enhancement to Drive Margin
Expansion
Continue to Develop New and Innovative Products in Core
Markets
Penetrate the Entry-Level and Mid-Line Segment of the
Performance Sport Boat Category
Capture Additional Share from Adjacent Boating Categories
1
2
3
4
5
✓ 3 new models launched in 2017 including the XT23, XT20 and XT21
✓ 2 new models already launched in 2018 including the XT22 and XSTAR
✓ Revolutionary new technology showcased in the new DockStar Handling System
✓ Won 6 NMMA Innovation awards in the last seven years
✓ Launched NXT series (“$50k All Day”), connecting with target demographic for the
entry-level boat segment
✓ 43% of NXT buyers are new to boating and 33% are transitioning from sterndrives
✓ Launching XT to round out product offering and reach broader audience
✓ Increased presence with leading dealers; 6 dealers in the top 20 and 21 dealers in
the top 100
✓ Expanded the dealer network to 97 North American dealers with 157 locations and
48 international dealers with 81 locations
✓ 2015 IndustryWeek Best Plant in North America demonstrating operational
excellence

FY18 Q1 FINANCIAL HIGHLIGHTS▪ Net sales increased 7.2% to $65.0 million
▪ Adjusted EBITDA margin at 19.9% vs prior year of 21.9%
▪ Net income totaled $7.0 million for FY18 Q1 and FY17 Q1
▪ Fully diluted pro forma adjusted net income per share, a non-GAAP measure
declined slightly to $0.40 per share compared to $0.41 in the prior-year
period
▪ First quarter working capital management remained outstanding, as
evidenced by a cash conversion cycle of 3.9 days
▪ In October 2017, MasterCraft secured a new term loan of approximately
$115 million in conjunction with the purchase of NauticStar, LLC. This
represents about $80 million of incremental debt
▪ Interest rate savings in the 100 basis point range at comparable leverage ratios
Fiscal 2018 first-quarter results are being compared against our most profitable quarter. For the full fiscal year 2018, we continue to expect growth in adjusted EBITDA margins for MasterCraft, excluding NauticStar.
METRICFY2017
Q1
FY2018
Q1
Units Sold
Growth %
718
5.2%
775
7.9%
Net Sales
Growth %
$60.7
8.5%
$65.0
7.2%
Pro-Forma Adjusted EPS (1) $0.41 $0.40
Adjusted EBITDA
Growth %
Margin %
$13.3
24.8%
21.9%
$12.9
-0.3%
19.9%
_____________________
(1) Based on weighted average shares. See Appendix for calculation.

ATTRACTIVE MARKET DYNAMICS DRIVING DEMAND
▪ During CY 2016, PSB retail units sold continued to grow and capture
market share from Sterndrive
▪ Dealer sentiment has been positive as they continue to express an
optimistic outlook on the future
▪ Innovation continues to drive growth, especially in wake surfing
▪ Marine outperforming other Powersport segments
▪ Despite strong growth in recent years, new PSB units sold in 2016
remained more than 30% below 2006 level
▪ New unit sales of PSBs in the U.S. increased at a CAGR of 12.6% from
2013 to 2016 while new unit sales of all fiberglass power boats contracted
at a CAGR of -5.5% in the U.S. over the same period
Favorable macro tailwinds suggest a long runway for future growth
PSB INCREASING SHARE
12.6%
-5.5%-10.0%
-5.0%
0.0%
5.0%
10.0%
15.0%
20.0%
Performance Sport Boats Fiberglass Power Boats3 Y
ear
CA
GR
2013 - 2016 New Unit Sales CAGR - Source: SSI
4,915
5,509
6,157
7,141
7,868
8,782
26.4%
29.4%
34.3%
39.6%
43.9%
46.8%
20.0%
25.0%
30.0%
35.0%
40.0%
45.0%
50.0%
4,000
5,000
6,000
7,000
8,000
9,000
10,000
CY2011 CY2012 CY2013 CY2014 CY2015 CY2016
PSB
Share o
f PSB
and
Sternd
rive %
Per
form
ance
Sp
ort
Bo
at (
PSB
) R
etai
l Un
its
U.S. Performance Sport Boat (PSB) Retail Units and PSB Share of PSB and Sterndrive Units - Source: NMMA
Performance Sport Boat (PSB) Unit Sales PSB Share of PSB and Sterndrive

INVESTOR HIGHLIGHTS
World-renowned iconic brand synonymous
with quality, innovation and performance
Leading market share position in performance
sport boat category
Industry-leading product design and innovation
Highly efficient product development and manufacturing
Strong dealer network
Differentiated sales and marketing capabilities
Highly experienced management team leading
an engaged workforce
Strong financial position to support growth
Continue to seek strategic acquisitions that enhance
shareholder value
HIGHLY-VISIBLE
AVENUES FOR EARNINGS
GROWTH AND SUSTAINABLE
COMPETITIVE ADVANTAGES
1
2
3
4
5
6
7
8
9

ICONIC BRAND SYNONYMOUS WITH QUALITY, INNOVATION AND PERFORMANCEThe MasterCraft brand is built on a carefully crafted set of defining principles
LEGACYRich heritage defined by an engaged
and innovative culture since 1968
POWERRecognized for superior performance, with a
number of world records set and
championships won using MasterCraft boats
PRECISIONSignificant resale premiums and most
comprehensive warranty in the industry
PROGRESSIONIndustry leader in innovation and achievement
with numerous recent technological
innovations and industry awards
The premier aspirational brand in the performance sport boat category

We’ve consistently held a leading market share position in the U.S. over the past decade
Our emphasis has been and will continue to be about profitable, sustainable market share
LEADING MARKET SHARE POSITIONJust starting to realize benefits of many recent initiatives that management has executed
_____________________
Source: SSI and company SEC filings.
(1) Axis is an independent brand within Malibu Boats.
ROLLING QUARTERLY LTM MARKET SHARE THROUGH JUNE 2017 (1)
22.1% 21.7%
20.9% 20.9% 21.3% 21.5% 21.8%
22.3%
20.6% 21.0%
21.2%21.9% 22.1% 21.7% 21.8%
21.3%
16.3% 16.3% 15.9% 16.1% 15.9% 16.0% 16.4% 16.8%
10.3%11.0%
11.6% 11.4% 11.5% 11.3%10.7%
10.1%
LTM 9/2015 LTM 12/2015 LTM 3/2016 LTM 6/2016 LTM 9/2016 LTM 12/2016 LTM 3/2017 LTM 6/2017
(1)
MARKET SHARE KEY
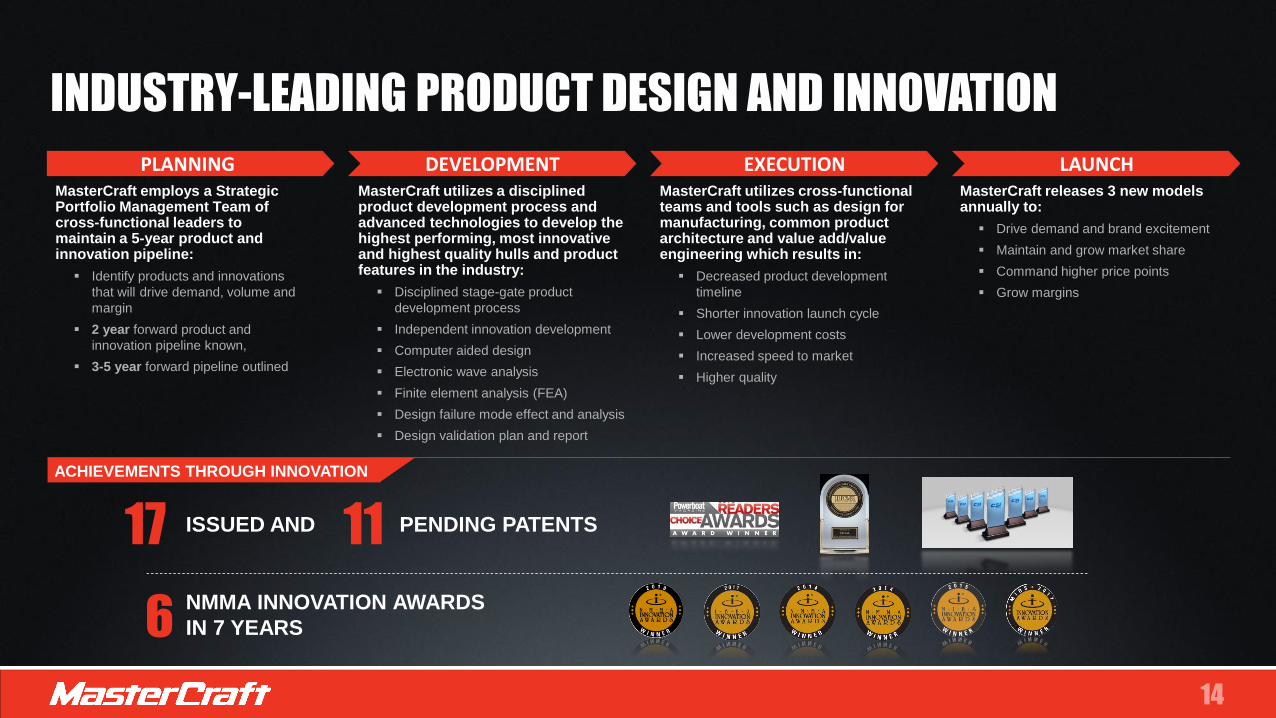
INDUSTRY-LEADING PRODUCT DESIGN AND INNOVATION
NMMA INNOVATION AWARDS
IN 7 YEARS
PLANNING DEVELOPMENT EXECUTION LAUNCHMasterCraft utilizes a disciplined product development process and advanced technologies to develop the highest performing, most innovative and highest quality hulls and product features in the industry:
▪ Disciplined stage-gate product
development process
▪ Independent innovation development
▪ Computer aided design
▪ Electronic wave analysis
▪ Finite element analysis (FEA)
▪ Design failure mode effect and analysis
▪ Design validation plan and report
MasterCraft employs a Strategic Portfolio Management Team of cross-functional leaders to maintain a 5-year product and innovation pipeline:
▪ Identify products and innovations
that will drive demand, volume and
margin
▪ 2 year forward product and
innovation pipeline known,
▪ 3-5 year forward pipeline outlined
MasterCraft utilizes cross-functional teams and tools such as design for manufacturing, common product architecture and value add/value engineering which results in:
▪ Decreased product development
timeline
▪ Shorter innovation launch cycle
▪ Lower development costs
▪ Increased speed to market
▪ Higher quality
MasterCraft releases 3 new models annually to:
▪ Drive demand and brand excitement
▪ Maintain and grow market share
▪ Command higher price points
▪ Grow margins
ISSUED AND PENDING PATENTS17
6
ACHIEVEMENTS THROUGH INNOVATION
11

HIGHLY EFFICIENT PRODUCT DEVELOPMENT AND MANUFACTURING
MasterCraft’s significant
investments in…
▪ infrastructure
▪ value-added processes
▪ engineering
…result in
▪ lower material waste
▪ reduced labor hours per boat
▪ reduced re-work
▪ increased production efficiencies
▪ improved quality
GROSS MARGIN EXPANSION WITH
MINIMAL BASE BOAT ASP INCREASES
2.8% 2.0% 2.7% 2.8% 2.7%
19.0%21.2%
23.9%
27.6% 27.8%
2013 2014 2015 2016 2017
Base Boat Price Increase Gross Margin
_____________________
(1) Weighted average base boat price increases, excluding options.
(1)
Fiscal
Year
Model
Year

COMMITTED TO QUALITY
250,000 Square foot facility
~40%Additional units/day
manufacturing capacity (1)
49Year history of making
boats
435 Critical checkpoints
100% Lake tested
ISO 9001 Quality control system
NMMA Certified
ONE GOALTo be the best on the
water
0.30
0.20 0.180.14
0.00
0.10
0.20
0.30
0.40
0.50
FY 2014 FY 2015 FY 2016 FY 2017
External Defects Per Unit
0.8
6.6
MasterCraft IndustryAverage
“OSHA Recordables” Injuries Per
100,000 Man-Hours
_____________________
(1) Assumes current footprint on one shift. Second shift lamination could increase capacity to 5,000 units

STRONG DEALER NETWORK
Dealer Location named in Boating
Magazines list of Top 100 dealers NORTH AMERICAN
DEALERS WITH …97
LOCATIONS157
INTERNATIONAL DEALERS
WITH …48
LOCATIONS IN …81COUNTRIES AROUND
THE WORLD37
ARE IN THE TOP THREE
PERFORMANCE SPORT BOAT
DEALERS IN THEIR
RESPECTIVE U.S. MARKETS
75%
17
7LOCATIONS IN
SOUTH AMERICA
5LOCATIONS IN
AUSTRALIA
7LOCATIONS IN
THE MIDDLE EAST
4
LOCATIONS
IN AFRICA3
LOCATIONS
IN ASIA42 LOCATIONS
IN EUROPE 157LOCATIONS IN
NORTH AMERICA
Note: Dealer count as of October 1, 2017.
LOCATIONS IN CENTRAL
AMERICA AND THE CARIBBEAN13

DIFFERENTIATED SALES AND MARKETING CAPABILITIES
AWARD-WINNING ADVERTISING CAMPAIGNS
HIGHEST # OF
FOLLOWERS
HIGHEST RANKED
CHANNEL
2X ENGAGEMENT
10k+ FOLLOWERS
HIGHLY ENGAGED CUSTOMER BASE
SPONSORSHIPS
#4 wakeboarder
#2 water ski jumper
#4 male slalom skier
#4 female slalom skier
ALSO PARTNER WITH MUSICIAN AND AVID SURFER DONAVON FRANKENREITER AND WELL-KNOWN EXTREME MOTORSPORTS ATHLETE TRAVIS PASTRANA
KEY LIFESTYLE AND INNOVATIVE CO-BRANDING

HIGHLY EXPERIENCED MANAGEMENT TEAMWITH 140 YEARS OF INDUSTRY EXPERIENCE
TERRY MCNEW
PRESIDENT AND CEO
30 years in the industry. Executive roles at both Brunswick Corp. and Correct Craft. Six Sigma Black Belt certification. 5 years with MasterCraft
TIM OXLEY
CFO27 years in the industry. 16 years at Brunswick. Certified Public Accountant. 11 years with MasterCraft
DAVID KIRKLAND
CIO14 years in the industry. 14 years with MasterCraft
JAY POVLIN
VP OF SALES AND MARKETING22 years in the industry. 4 years with MasterCraft. Has held numerous senior leadership positions at Brunswick Corp.
CHARLENE HAMPTON
VP OF HUMAN RESOURCES26 years in Human Resources. 7 years with MasterCraft
JIM BROWN
DIRECTOR OF MANUFACTURING5 years with MasterCraft.
TIM SCHIEK
PRESIDENT, NAUTICSTAR22 years in the industry. 20 years at Brunswick in a variety of leadership roles. President of Recreational Boat Group, Sea Ray, and Boston Whaler Group.
DAVE EKERN
DIRECTOR OF ENGINEERING13 years in the industry. 9 years with MasterCraft

CREATING A CULTURE OF OPERATIONAL EXCELLENCE
Highly skilled workforce of approximately 500 employees handcraft
our boats from hull to upholstery near Knoxville, Tennessee
Culture of continuous operational improvement, with nearly 20,000
employee suggestions implemented to improve our manufacturing
efficiency in 2016
Recognized by Industry Week as the winner of its North America
cross-industry 2015 Best Manufacturing Plant Award
HIGHLY ENGAGED WORKFORCE

NAUTICSTAR ACQUISITION▪ On October 2nd, 2017 announced the acquisition of NauticStar, LLC, a
leading manufacturer of 18-28 foot, high-quality bay boats, deck boats and
offshore center console boats
▪ Purchase price of approximately $79.8 million
▪ Deal unites two leading and complementary boat brands
▪ NauticStar portfolio adds to MasterCraft’s product diversity
▪ MasterCraft gains presence in salt water fishing and outboard propulsion –
two of the fastest growing segments in the broader boating industry
▪ Continued growth in revenue expected in CY2017 with net sales
approaching $80 million
METRIC CY2015 CY2016
Units Sold
Growth %
1739
17.5%
1847
6.2%
Net Sales
Growth %
$56.5
25.5%
$63.7
11.3%
Gross Profit
Margin %
$9.5
16.9%
$10.8
17.0%
Adjusted EBITDA
Growth %
Margin %
$6.1
26.0%
10.7%
$7.3
19.6%
11.4%_____________________
(1) Based on weighted average shares. See Appendix for calculation.

▪ Founded in 2002, located in Amory, Mississippi
▪ NauticStar has a reputation for reliability, quality and consistency
with a loyal network of dealers and customers including
professional and sport fisherman, and recreational and pleasure
boating enthusiast
▪ Established network of 70+ dealers in the US
▪ Operates a 200,000 square-foot manufacturing facility
ABOUT NAUTICSTAR

NAUTICSTAR COMPETITIVE OVERVIEW
INDUSTRY OVERVIEW
• NauticStar is a market leader across all its
product segments
• Strong Market share
• #1 in Bay Boats
• #3 in Deck Boats
• #5 in Offshore Boats
• Industry expectations are for continued growth
going forward
• Key Drivers remain positive
✓ Consumer Confidence
✓ Home Sales
✓ Disposable Income
✓ Interest Rates
✓ Gas Prices
• Particular strength in NauticStar categories
positions the Company for above market growth
• Continued innovation and new product
introductions differentiate the Company from its
peers
6% CAGR
Cumulative Growth since 2011
169,000+
2016 Retail Unit Sales*
$37 BillionTotal US Expenditures on Boats, Engines and
Accessories
$121 BillionRecreational Boating Overall Contribution to
US Economy
Source:
• IBEX, NMMA, and SSI

NAUTICSTAR COMPETITIVE OVERVIEW
MULTIPLE REVENUE STREAMS
Offshore Boats Deck Boats Bay Boats
34.7% of 2016 Sales
$47,000 – 2016 ASP
23.9% YOY Growth
✓ Lifetime hull warranty
✓ Design features catering to
the family
✓ Product line up ranges from
19’ to 28’
✓ Molded one-piece, foam filled
composite stringer system
25.7% of 2016 Sales
$31,500 – 2016 ASP
33.7% YOY Growth
✓ All composite with lifetime hull
warranty
✓ Deutche waterproof
connectors
✓ Hull design leads to faster
and more fuel efficient
performance than the leading
competitor
39.6% of 2016 Sales
$29,700 – 2016 ASP
-4.25% YOY Growth
✓ Lifetime hull warranty
✓ RTM closed molded
fiberglass lids
✓ Tried and proven hull
performance
✓ Unique, high-performance
XTS hull design (air-assist
chine)

MULTI-FACETEDGrowth Opportunities

R&D Growth Maturity
Cas
h flo
w (
$)
Cash Flows Over Product Development Lifecycle
ProductIntroduction
#1
ProductIntroduction
#2
ProductIntroduction
#3
Uni
ts
Demand for Boat Portfolio Over Time
Portfolio Demand Product Demand
CONTINUE TO DEVELOP NEW AND INNOVATIVE PRODUCTS IN CORE MARKETS
KEY PRODUCT INTRODUCTIONSFY2017
XT20
FY2017
XT21
1
2
3 4
5
▪ A more disciplined product innovation process allows
MasterCraft to spend on R&D more efficiently than
competitors
▪ Effective product development has accelerated new
product releases resulting in increased speed to market
▪ Fresher and more innovative products, especially when
first to market, command price premiums driving
increased cash flows versus competitors
▪ 3 new model releases per year accelerates replacement
lifecycle and drives demand
▪ The entire product portfolio has been renewed in the last 4
years, giving us the newest overall product offering in the
performance sport boat category and positioning us for
strong growth in the coming periods
1
2
3
4
5
Product
LaunchInception
FY2017XT23
FY2018XT22
FY2018
XSTAR

CAPTURE SHARE FROM ADJACENT BOAT CATEGORIESTargeting crossover customers seeking high performance powerboats for general recreation
X26 Features
TRADITIONAL LARGE
REC DAYBOATS
WATERSPORTS
VERSATILITY
CUSTOMIZED
STYLING
ENHANCED
SAFETY
ROOMY, PLUSH
INTERIOR
STORAGE /
SPACE
▪ Gen 2 Surf System
▪ 2.1k lbs ballast
▪ Swivel board racks
▪ Numerous color
combinations
▪ Pickle-fork bow
▪ Inboard prop
location
▪ Swim platform
▪ 18 person capacity
▪ Deluxe aft lounge
▪ Bow seating
▪ 101 cubic feet
▪ Sink and fridge
▪ Private toilet
1
1
2 23
3
4
4
5
5
9,800+ Sterndrive 20’-35’ units sold in the U.S. in 2016
_____________________
Source: SSI data.

FURTHER STRENGTHEN DEALER NETWORK
…And Maintain The
Highest Quality Dealers…
…While Thoughtfully
Managing Our Exposure
MOST DEALERS IN TOP 20 (1)
% #
30% 6
20% 4
15% 3
LOW DEALER CONCENTRATION
Dealer Ranks % Net Sales
Top 10 41%
Top 11-20 17%
Top 20 58%
Supply Dealers With High
Quality, Relevant Boats…
3Annual new model
releases keep
MasterCraft fresh
13Unique models
comprise robust
portfolio of choices
All backed by the best
warranty on the water
21dealers in Boating
Industry’s Top 100
_____________________
(1) Source: MRAA.
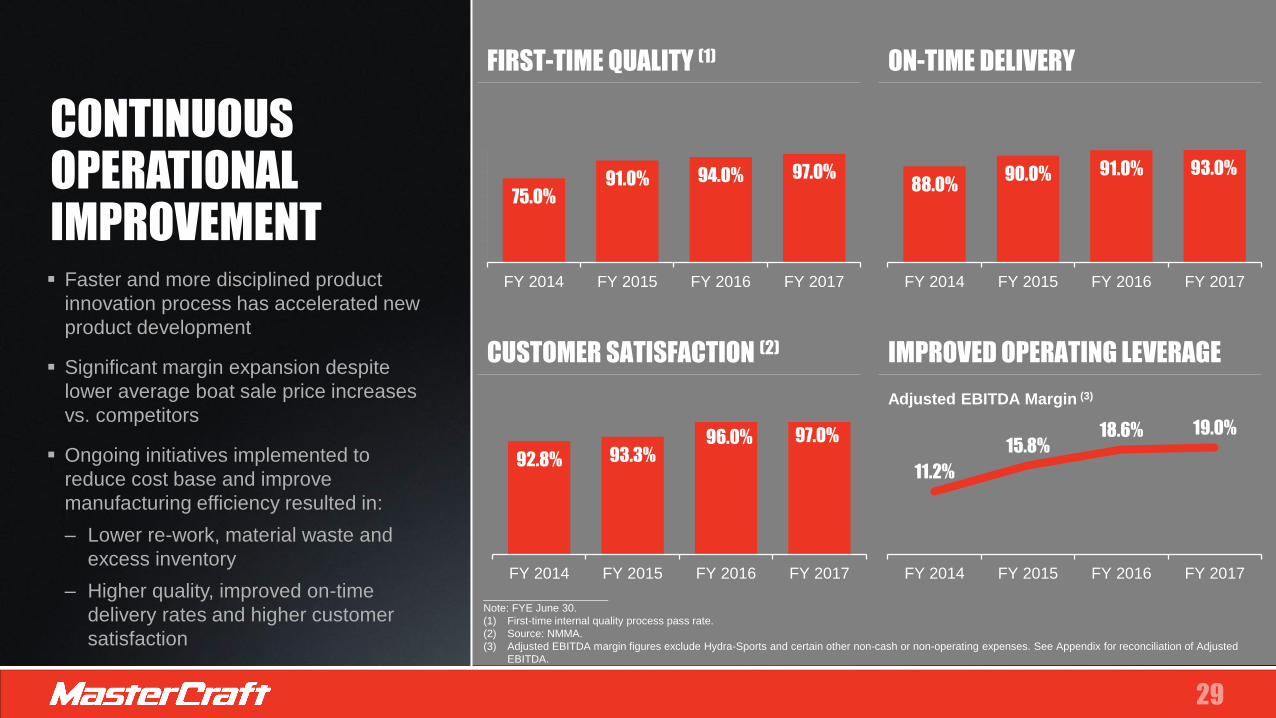
CONTINUOUS OPERATIONAL IMPROVEMENT▪ Faster and more disciplined product
innovation process has accelerated new
product development
▪ Significant margin expansion despite
lower average boat sale price increases
vs. competitors
▪ Ongoing initiatives implemented to
reduce cost base and improve
manufacturing efficiency resulted in:
‒ Lower re-work, material waste and
excess inventory
‒ Higher quality, improved on-time
delivery rates and higher customer
satisfaction
FIRST-TIME QUALITY (1) ON-TIME DELIVERY
75.0%91.0% 94.0% 97.0%
FY 2014 FY 2015 FY 2016 FY 2017
88.0%90.0% 91.0%
FY 2014 FY 2015 FY 2016 FY 2017
93.0%
CUSTOMER SATISFACTION (2)
92.8% 93.3%
FY 2014 FY 2015 FY 2016 FY 2017
97.0%
IMPROVED OPERATING LEVERAGE
11.2%
15.8%18.6% 19.0%
FY 2014 FY 2015 FY 2016 FY 2017
Adjusted EBITDA Margin (3)
_____________________
Note: FYE June 30.
(1) First-time internal quality process pass rate.
(2) Source: NMMA.
(3) Adjusted EBITDA margin figures exclude Hydra-Sports and certain other non-cash or non-operating expenses. See Appendix for reconciliation of Adjusted
EBITDA.
96.0%

KEY FINANCIALInformation

_____________________
Note: Figures exclude Hydra-Sports and certain other non-cash or non-operating expenses. See Appendix for reconciliation of Adjusted EBITDA. “YoY” defined as the current fiscal period over the prior fiscal period growth.
NET SALES$ in millions
ADJUSTED EBITDA$ in millions
STRONG FINANCIAL PERFORMANCE
MARGIN 19.0%11.2%7.9% 15.8%
$148.8$163.6
$199.9$221.6 $228.6
FY 2013 FY 2014 FY 2015 FY 2016 FY 2017
$11.8
$18.4
$31.5
$41.2 $43.5
FY 2013 FY 2014 FY 2015 FY 2016 FY 2017
YoY GROWTH 56% 71%601%YoY GROWTH 3.2%26% 22%10% 11% 31%
18.6%
5%

CASH CONVERSION CYCLE($ in thousands) FY 2015 FY 2016 FY 2017 FY 2018 Q1
Net Sales $214,386 $221,600 $228,634 $65,049
Cost of Sales $163,220 $160,521 $165,158 $46,886
Beginning Inventory $11,685 $11,541 $13,268 $11,676
Ending Inventory $11,541 $13,268 $11,676 $11,569
Beginning Accounts Receivable $4,406 $2,653 $2,966 $3,500
Ending Accounts Receivable $2,653 $2,966 $3,500 $6,705
Beginning Accounts Payable $13,020 $14,808 $13,112 $11,008
Ending Accounts Payable $14,808 $13,112 $11,008 $15,678
Days Inventory Outstanding (DIO) (1) 26.0 28.2 27.6 23.1
Days Sales Outstanding (DSO) (2) 6.0 4.6 5.2 7.3
Days Payable Outstanding (DPO) (3) 31.1 31.7 26.7 26.5
Cash Conversion Cycle (CCC) (Days) (4) 0.9 1.1 6.1 3.9_____________________
Note:
(1) The DIO is calculated as the average inventory divided by the cost of sales per day - 365 days for each FY and 93 days for FY 2018 Q1
(2) The DSO is calculated as the average receivable divided by net sales per day - 365 days for each FY and 93 days for FY 2018 Q1
(3) The DPO is calculated as the average accounts payable divided by cost of sales per day - 365 days for each FY and 93 days for FY 2018 Q1
(4) The CCC, is calculated as the sum of DIO plus the DSO, minus the DPO - 365 days for each FY and 93 days for FY 2018 Q1

FISCAL 2018 COMBINEDGUIDANCE
METRIC FYE 2018 TARGET
Revenue Growth35 percent range (NauticStar representing ~ 20 percent)
Adjusted EBITDA Margin Mid to high 17 percent range
EPS Growth 25 percent growth range
_____________________
Note: These goals are forward-looking, are subject to significant business, economic, regulatory and competitive uncertainties and contingencies, many of which are beyond the control of the Company and its management, and are based upon assumptions with respect to future
decisions, which are subject to change. Actual results will vary and those variations may be material. For discussion of some of the important factors that could cause these variations, please consult the “Risk Factors” section of the prospectus. Nothing in this presentation
should be regarded as a representation by any person that these goals will be achieved and the Company undertakes no duty to update its goals.
(1) Estimated Integration costs associated with our NauticStar, LLC acquisition have been considered in providing this guidance.
(2) Adjusted net income per proforma share growth
(1)
(2)

WRAP UP
World-renowned iconic brand synonymous
with quality, innovation and performance
Leading market share position in performance
sport boat category
Industry-leading product design and innovation
Highly efficient product development and manufacturing
Strong dealer network
Differentiated sales and marketing capabilities
Highly experienced management team leading
an engaged workforce
Strong financial position to support growth
Continue to seek strategic acquisitions that enhance
shareholder value
HIGHLY-VISIBLE
AVENUES FOR EARNINGS
GROWTH AND SUSTAINABLE
COMPETITIVE ADVANTAGES
1
2
3
4
5
6
7
8
9

APPENDIX

DETAILED FINANCIAL SUMMARY($ in millions, actual units)
_____________________
Note: FY June 30. Consolidated figures include Hydra-Sports and certain other non-cash or non-operating expenses. See next page in appendix for reconciliation of Adjusted
EBITDA. “YoY” defined as the current fiscal period over the prior fiscal period.
FY 2014 FY 2015 FY 2016 FY 2017 FY 2018 Q1
MasterCraft (Including Hydra-Sports in FY14 & FY15)
Total Boats Sold 2,185 2,592 2,742 2,790 775YoY % Change 9.4% 18.6% 5.8% 1.8% 7.9%
Net Sales $177.6 $214.4 $221.6 $228.6 $65.0YoY Growth % 9.6% 20.7% 3.4% 3.2% 7.1%
Cost of goods 140.0 163.2 160.5 165.2 46.9
Gross Profit $37.6 $51.2 $61.1 $63.5 $18.1% of net sales 21.2% 23.9% 27.6% 27.8% 27.9%
Operating Expenses 19.0 27.2 39.1 30.0 7.1% of net sales 10.7% 12.7% 17.6% 13.1% 10.9%
Capex $3.4 $3.5 $3.8 $4.1 $0.7
MasterCraft Only
Boats Sold 2,135 2,547 2,742 2,790 775YoY % Change 9.5% 19.3% 7.7% 1.8% 7.9%
Net Sales $163.6 $199.9 $221.6 $228.6 $65.0YoY Growth % 10.0% 22.2% 10.9% 3.2% 7.1%
Adjusted EBITDA $18.4 $31.5 $41.2 $43.5 $12.9YoY Growth(Decline) % 55.8% 71.4% 30.7% 5.5% -2.7%% of net sales 11.2% 15.8% 18.6% 19.0% 19.9%

DETAILED FINANCIAL SUMMARY($ in millions, actual units)
FY 2017 FY 2017 FY 2017
MasterCraft NauticStar Consolidated
Total Boats Sold 2,790 2,145 4,935
YoY % Change 1.8% 20.1% 9.0%
Net Sales $228.6 $77.1 $305.7
YoY Growth % 3.2% 30.3% 8.9%
Cost of goods 165.2 62.9 228.1
Gross Profit $63.5 $14.1 $77.6
% of net sales 27.8% 18.4% 25.3%
Operating Expenses
30.0 5.1 35.1
% of net sales 13.1% 6.6% 11.4%

ADJUSTED EBITDA RECONCILIATIONFY 2014 FY 2015 FY 2016 FY 2017 FY 2018 Q1
Net Income $19.9 $5.5 $10.2 $19.6 $7.0
Income Tax Expense (Benefit) (1) (11.4) 6.6 8.3 11.7 3.5
Interest Expense 7.5 5.2 1.3 2.2 0.5
Depreciation and Amortization 2.5 3.3 3.4 3.2 0.7
EBITDA $18.5 $20.6 $23.2 $36.7 $11.8
Change in Common Stock Warrant Fair Value(2) 2.5 6.6 3.4 0.0 0.0
Transaction Expenses (3) 0.0 7.1 0.5 0.1 0.8
Litigation charge (4) 0.0 0.5 1.6 6.0 0.0
Litigation settlement (5) 0.0 0.0 (1.2) 0.0 0.0
Hydra-Sports (6) (2.6) (3.3) 0.0 0.0 0.0
Stock-based compensation 0.0 0.0 13.7 0.7 0.3
Adjusted EBITDA $18.4 $31.5 $41.2 $43.5 $12.9
_____________________
Note:
(1) Fiscal 2014 income tax benefit primarily represents the reversal of a valuation allowance for deferred tax assets.
(2) Represents non-cash expense related to increases in the fair market value of the restructuring warrant.
(3) Represents fees and expenses related to our initial public offering, payment of a special cash dividend in June 2016, expenses associated with recapitalization activities completed in March 2015, secondary offering in September 2016, and our
follow-on offering in December 2016. Also includes amount paid for the NauticStar, LLC acquisition which occurred on October 2nd 2017.
(4) Represents legal and advisory fees related to our litigation with Malibu Boats, LLC, which includes settling the Malibu patent case and settlement of a litigation matter for fiscal 2015.
(5) Represents receipt of a one-time payment to settle certain litigation matters.
(6) Represents the operating income attributable to the operations of our Hydra-Sports business and the related manufacturing agreement, adjusted to exclude depreciation and amortization related to Hydra-Sports. We previously divested the Hydra-
Sports business in June 2012, but continued to manufacture Hydra-Sports boats for the purchaser of the business pursuant to an agreement that expired on June 30, 2015 (and which was not renewed). This adjustment was calculated by identifying
the applicable cost of sales and operating expenses directly attributable to the Hydra-Sports business for such period, excluding any corporate overhead or other shared costs.
($ in millions)
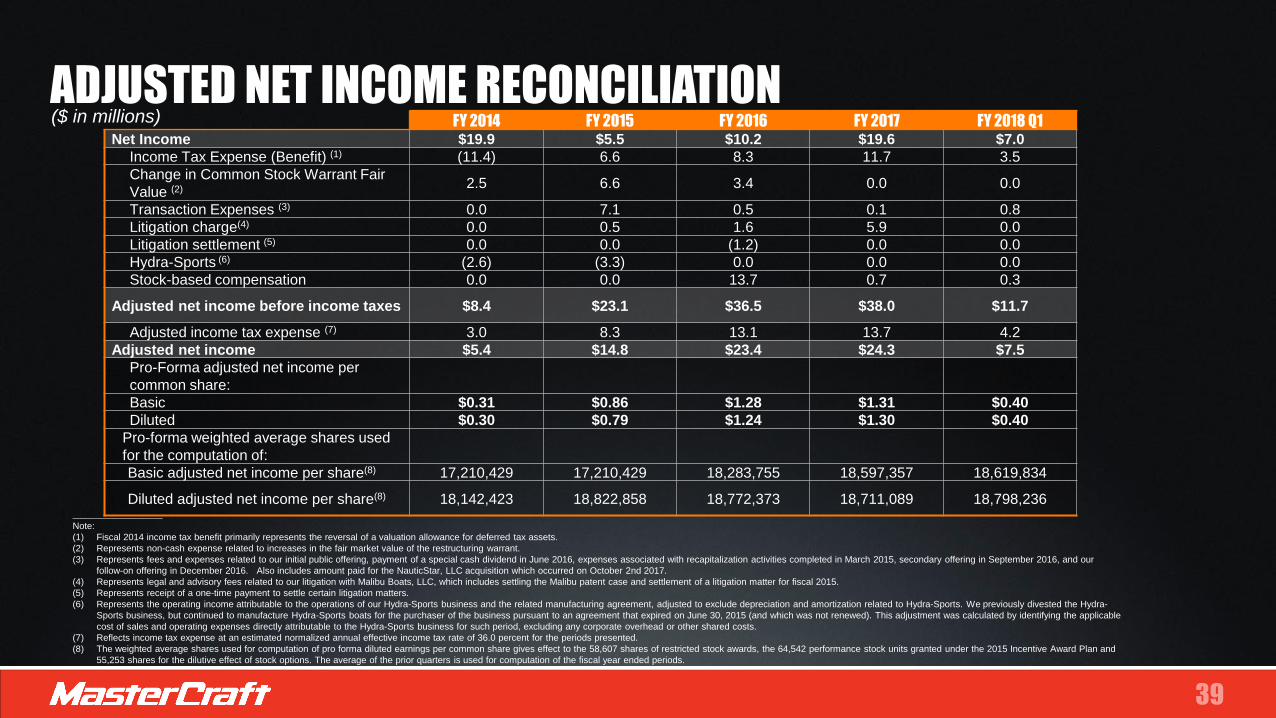
ADJUSTED NET INCOME RECONCILIATIONFY 2014 FY 2015 FY 2016 FY 2017 FY 2018 Q1
Net Income $19.9 $5.5 $10.2 $19.6 $7.0
Income Tax Expense (Benefit) (1) (11.4) 6.6 8.3 11.7 3.5
Change in Common Stock Warrant Fair
Value (2) 2.5 6.6 3.4 0.0 0.0
Transaction Expenses (3) 0.0 7.1 0.5 0.1 0.8
Litigation charge(4) 0.0 0.5 1.6 5.9 0.0
Litigation settlement (5) 0.0 0.0 (1.2) 0.0 0.0
Hydra-Sports (6) (2.6) (3.3) 0.0 0.0 0.0
Stock-based compensation 0.0 0.0 13.7 0.7 0.3
Adjusted net income before income taxes $8.4 $23.1 $36.5 $38.0 $11.7
Adjusted income tax expense (7) 3.0 8.3 13.1 13.7 4.2
Adjusted net income $5.4 $14.8 $23.4 $24.3 $7.5
Pro-Forma adjusted net income per
common share:
Basic $0.31 $0.86 $1.28 $1.31 $0.40
Diluted $0.30 $0.79 $1.24 $1.30 $0.40
Pro-forma weighted average shares used
for the computation of:
Basic adjusted net income per share(8) 17,210,429 17,210,429 18,283,755 18,597,357 18,619,834
Diluted adjusted net income per share(8) 18,142,423 18,822,858 18,772,373 18,711,089 18,798,236_____________________
Note:
(1) Fiscal 2014 income tax benefit primarily represents the reversal of a valuation allowance for deferred tax assets.
(2) Represents non-cash expense related to increases in the fair market value of the restructuring warrant.
(3) Represents fees and expenses related to our initial public offering, payment of a special cash dividend in June 2016, expenses associated with recapitalization activities completed in March 2015, secondary offering in September 2016, and our
follow-on offering in December 2016. Also includes amount paid for the NauticStar, LLC acquisition which occurred on October 2nd 2017.
(4) Represents legal and advisory fees related to our litigation with Malibu Boats, LLC, which includes settling the Malibu patent case and settlement of a litigation matter for fiscal 2015.
(5) Represents receipt of a one-time payment to settle certain litigation matters.
(6) Represents the operating income attributable to the operations of our Hydra-Sports business and the related manufacturing agreement, adjusted to exclude depreciation and amortization related to Hydra-Sports. We previously divested the Hydra-
Sports business, but continued to manufacture Hydra-Sports boats for the purchaser of the business pursuant to an agreement that expired on June 30, 2015 (and which was not renewed). This adjustment was calculated by identifying the applicable
cost of sales and operating expenses directly attributable to the Hydra-Sports business for such period, excluding any corporate overhead or other shared costs.
(7) Reflects income tax expense at an estimated normalized annual effective income tax rate of 36.0 percent for the periods presented.
(8) The weighted average shares used for computation of pro forma diluted earnings per common share gives effect to the 58,607 shares of restricted stock awards, the 64,542 performance stock units granted under the 2015 Incentive Award Plan and
55,253 shares for the dilutive effect of stock options. The average of the prior quarters is used for computation of the fiscal year ended periods.
($ in millions)

BALANCE SHEET
June 30, 2017 October 1st, 2017
Assets:
Cash $4,038 $12,680
Accounts Receivable 3,500 6,705
Inventories - Net 11,676 11,569
Other Current Assets 2,438 2,624
Property, Plant and Equipment - Net 14,827 14,627
Intangible Assets - Net 16,643 16,616
Goodwill 29,593 29,593
Other 606 576
Total Assets $83,321 $94,990
Liabilities
Accounts Payable $11,008 $15,678
Accrued Expenses and Other Current Liabilities 22,190 23,145
Total Debt, net of unamortized debt issuance costs 34,477 33,558
Unrecognized Tax Positions and Deferred Income Taxes 3,885 3,581
Total Liabilities $71,560 $75,962
Shareholders’ Equity 11,761 19,028
Total Liabilities and Shareholders’ Equity $83,321 $94,990
($ in thousands)
Recommended