9th April 2015 Microsec Research
Investment Rationale
Key Financials Highlights (Figure in INR CR)
INITIATING COVERAGE REPORT
RECOMMENDATION- “STRONG BUY “
Ramkrishna Forging Ltd –Forging Ahead Sector – Forging
POWER GENERATION
RETAIL + +
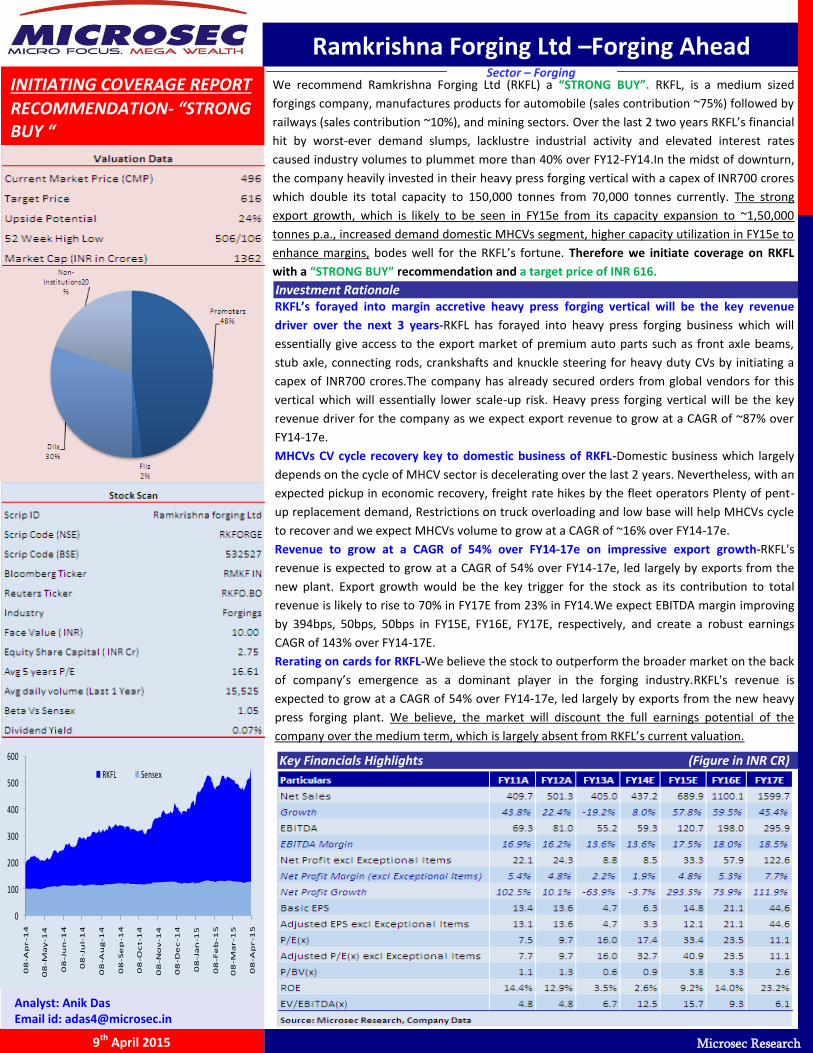
We recommend Ramkrishna Forging Ltd (RKFL) a “STRONG BUY”. RKFL, is a medium sized
forgings company, manufactures products for automobile (sales contribution ~75%) followed by
railways (sales contribution ~10%), and mining sectors. Over the last 2 two years RKFL’s financial
hit by worst-ever demand slumps, lacklustre industrial activity and elevated interest rates
caused industry volumes to plummet more than 40% over FY12-FY14.In the midst of downturn,
the company heavily invested in their heavy press forging vertical with a capex of INR700 crores
which double its total capacity to 150,000 tonnes from 70,000 tonnes currently. The strong
export growth, which is likely to be seen in FY15e from its capacity expansion to ~1,50,000
tonnes p.a., increased demand domestic MHCVs segment, higher capacity utilization in FY15e to
enhance margins, bodes well for the RKFL’s fortune. Therefore we initiate coverage on RKFL
with a “STRONG BUY” recommendation and a target price of INR 616.
RKFL’s forayed into margin accretive heavy press forging vertical will be the key revenue
driver over the next 3 years-RKFL has forayed into heavy press forging business which will
essentially give access to the export market of premium auto parts such as front axle beams,
stub axle, connecting rods, crankshafts and knuckle steering for heavy duty CVs by initiating a
capex of INR700 crores.The company has already secured orders from global vendors for this
vertical which will essentially lower scale-up risk. Heavy press forging vertical will be the key
revenue driver for the company as we expect export revenue to grow at a CAGR of ~87% over
FY14‐17e.
MHCVs CV cycle recovery key to domestic business of RKFL-Domestic business which largely
depends on the cycle of MHCV sector is decelerating over the last 2 years. Nevertheless, with an
expected pickup in economic recovery, freight rate hikes by the fleet operators Plenty of pent-
up replacement demand, Restrictions on truck overloading and low base will help MHCVs cycle
to recover and we expect MHCVs volume to grow at a CAGR of ~16% over FY14‐17e.
Revenue to grow at a CAGR of 54% over FY14‐17e on impressive export growth-RKFL's
revenue is expected to grow at a CAGR of 54% over FY14‐17e, led largely by exports from the
new plant. Export growth would be the key trigger for the stock as its contribution to total
revenue is likely to rise to 70% in FY17E from 23% in FY14.We expect EBITDA margin improving
by 394bps, 50bps, 50bps in FY15E, FY16E, FY17E, respectively, and create a robust earnings
CAGR of 143% over FY14-17E.
Rerating on cards for RKFL-We believe the stock to outperform the broader market on the back
of company’s emergence as a dominant player in the forging industry.RKFL's revenue is
expected to grow at a CAGR of 54% over FY14‐17e, led largely by exports from the new heavy
press forging plant. We believe, the market will discount the full earnings potential of the
company over the medium term, which is largely absent from RKFL’s current valuation.
Analyst: Anik Das Email id: [email protected]
0
100
200
300
400
500
600
08
-Ap
r-1
4
08
-Ma
y-1
4
08
-Ju
n-1
4
08
-Ju
l-1
4
08
-Au
g-1
4
08
-Se
p-1
4
08
-Oc
t-1
4
08
-No
v-1
4
08
-De
c-1
4
08
-Ja
n-1
5
08
-Fe
b-1
5
08
-Ma
r-1
5
08
-Ap
r-1
5
RKFL Sensex
- 2 -
Microsec Research
9th April 2015
Quarterly Result Update
Quarterly Snapshot 9-Months
Particulars Q3FY15A Q3FY14A Q2FY14A YoY QoQ FY2015A FY2014A % Change
Net Sales 189.4 83.5 140.9 126.8% 34.4% 443.2 273.5 62.0%
Other Operating Income 24.0 5.3 21.7 56.0 20.7
Total Operating Income 213.4 88.8 162.6 140.2% 31.2% 499.2 294.2 69.7%
Total Expenditure 175.4 77.2 135.8 416.5 258.3
EBITDA 38.0 11.6 26.8 226.1% 41.5% 82.6 35.9 130.4%
EBITDA Margin (%) 17.8% 13.1% 16.5% 469 Bps 130 Bps 16.6% 12.2% 436 Bps
Other Income 0.5 0.9 0.8 -48.9% -37.7% 5.2 1.8 183.0%
Operating Profit 38.4 12.6 27.6 205.6% 39.3% 87.8 37.7 132.9%
Depreciation 7.7 5.5 7.5 22.0 17.3
PBIT 30.8 7.1 20.1 332.3% 53.4% 65.8 20.4 222.6%
Interest 8.9 6.0 7.2 22.5 14.6
Exceptional Items 0.0 0.0 7.5 7.5
PBT 21.8 1.2 20.4 1782.8% 7.2% 50.8 5.8 776.5%
Tax 4.1 0.4 3.9 10.6 2.0
PAT 17.7 0.8 16.5 2201.3% 7.3% 40.1 3.8 964.2%
PAT Margin (%) 8.3% 0.9% 10.2% 744 Bps (185)Bps 8.0% 1.3% 676 Bps
PAT excl exceptional items 17.7 0.8 9.1 2201.3% 95.6% 32.7 3.8 766.3%
PAT Margin excl exceptional items (%) 8.3% 0.9% 5.6% 744 Bps 273 Bps 6.5% 1.3% 526 Bps
EPS 6.5 0.0 0.6 23122.4% 982.4% 14.6 1.4 964.2%
Adjusted EPS 6.5 0.0 0.3 23122.4% 1873.6% 11.9 1.4 766.3%
Source: Company Data, Microsec Research. All data in INR crores unless specified.
Quaterly Snapshot 9-Months
Particulars Q3FY15A Q3FY14A Q2FY14A YoY QoQ FY2015A FY2014A % Change
Geographical Revenue
Domestic 81.8 66.8 77.0 22.5% 6.3% 256.6 229.7 11.7%
as a % of total sales 41.2% 73.6% 51.6% 54.5% 77.0%
Export 116.5 24.0 72.3 385.5% 61.1% 214.5 68.8 211.9%
as a % of total sales 58.8% 26.4% 48.4% 45.5% 23.0%

- 3 -
Microsec Research
9th April 2015
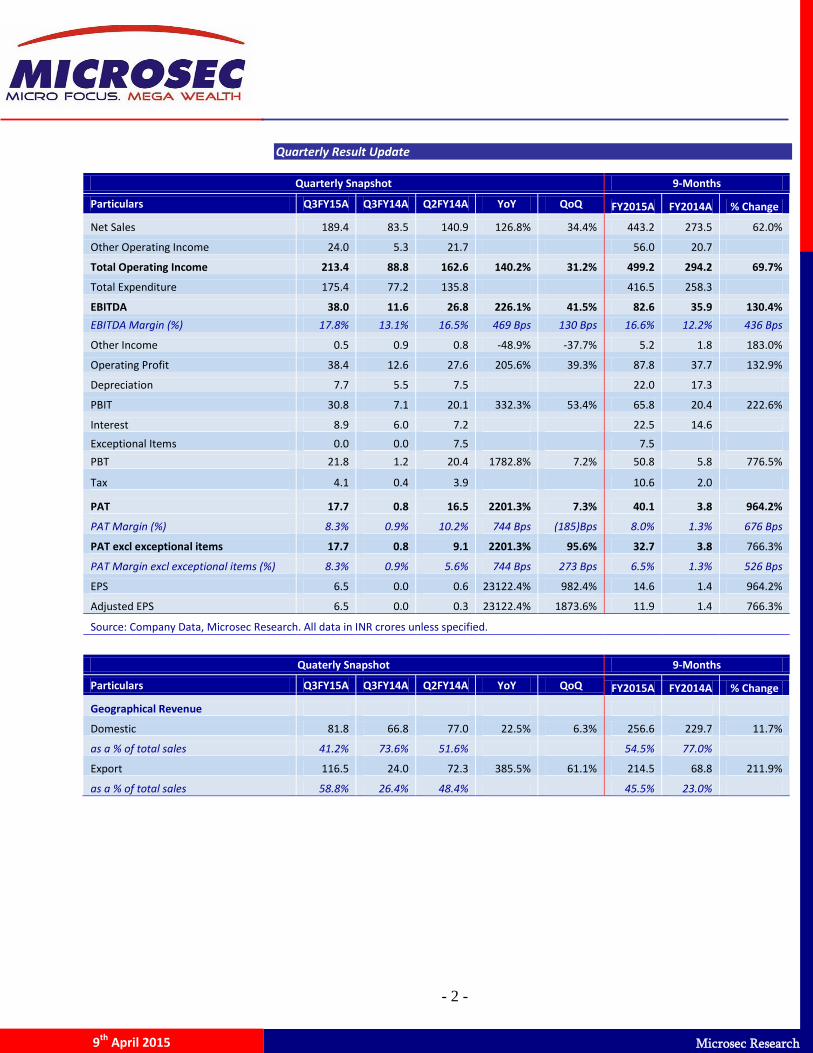
RKFL has posted a good set of numbers for Q3FY15, with
revenues increasing by ~140% YoY at INR213 crore as the
company gets benefited from the higher export number (Export
up by ~385% YoY).The company’s average revenue growth has
been ~ 18% over the past ~14 quarters.
The domestic sales arrived at ~INR81 crores, which constitutes
~41.2% of the overall revenue. The remaining were exports,
which brought about ~INR116 crores, up 385% on YoY basis,
helped by the ramp up heavy press forging unit which essentially
give access to the export market of premium auto parts such as
front axle beams, stub axle, connecting rods, crankshafts and
knuckle steering
The EBITDA came at INR38 crores, which was up by ~226% on YoY
basis and ~42% on QoQ basis. The reasons for boosted EBITDA
were (1) a higher capacity utilization (2) contribution of high margin
exports rises.
Raw material to sales stood at 47.80%, down by 11 bps YoY & up by
82 bps QoQ. Employee costs at 5% also contracted by 269 bps YoY
& 100 bps QoQ. The EBITDA Margin for the Q3FY15 was ~17.8%, up
by ~469bps on YoY basis.
The PAT (excluding exceptional items) grew by ~2201% YoY and
~7.3% QoQ.The PAT Margin expanded by ~744bps YoY and
marginally contracted by ~185bps QoQ. On YoY basis, the drop in
margin was on account of ~37.7% fall in other income and ~2%
increase in depreciation.
RKFL has reported a marginal tax rate of ~18.8% Vs normalised
rate of ~30-31%.
Solid quarterly numbers, Revenues up by ~140% & ~31% on a YoY/QoQ basis
PAT grew by ~2201% to INR 18 Crore and PAT margin expanded by ~744Bps on YoY basis
EBITDA grew by ~226% to INR 38 Crore and EBITDA margin expanded by ~469Bps on YoY basis
Source: Company Data, Microsec Research
- 4 -
Microsec Research
9th April 2015
Product Portfolio
Crankshafts
Connecting Rods
Front Axles
Steering Knuckles
Transmission Parts
Investment Rationale
RKFL’s forayed into margin accretive heavy press forging vertical will be the key revenue driver over the next 3 years-RKFL has forayed into
heavy press forging business which will essentially give access to the export market of premium auto parts such as front axle beams, stub
axle, connecting rods, crankshafts and knuckle steering for heavy duty CVs by initiating a capex of INR700 crores, which double its total
capacity to 150,000 tonnes from 70, 000 tonnes currently. The company has already secured orders from global vendors for this vertical
which will essentially lower scale-up risk. Heavy press forging vertical will be the key revenue driver for the company as we expect export
revenue to grow at a CAGR of ~87% over FY14‐17e.With the addition of heavy
press forging unit, the company has forayed into production of premium auto
parts for global OEM players like Dana, Volvo, Meritor, Volswagen, Paccar
etc.This new facility will mark the shift from low end forging business to high
margin products, namely front axle beams, stub axle, connecting rods,
crankshafts and knuckle steering, ranging from 50kg to 180kg in weight.
Heavy press forging unit is a capex heavy project for the company as the company
willing to exploit the exorbitant export demand for high weightage CV parts. The
company over the years proves its frugal engineering, precision and cost
competitiveness to the global players. According to the management, equipment
for the heavy press unit is imported from Germany and it is fully automated and
operated by seven robots and will produce product every 45 seconds, giving the
company competitive advantage over peers. As per management, the new heavy
pressing unit will give 18-20% pricing advantage over its competitors given its
manufacturing facilities close proximity to raw material suppliers.
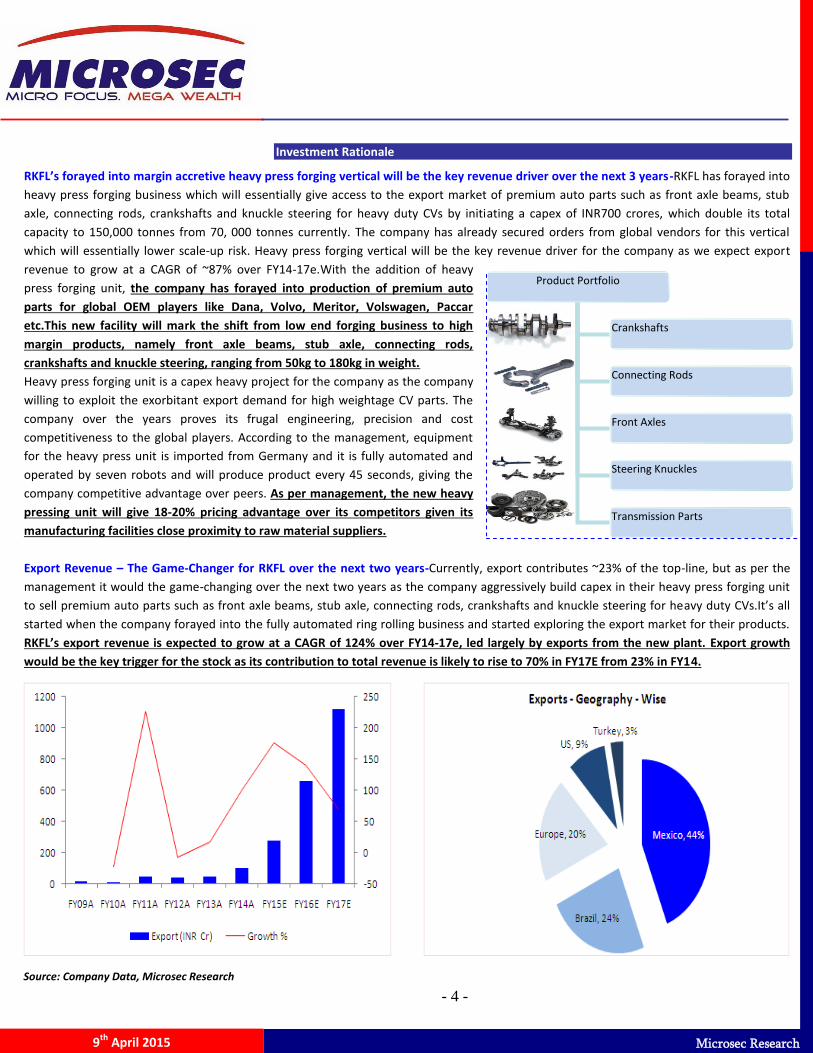
Export Revenue – The Game-Changer for RKFL over the next two years-Currently, export contributes ~23% of the top-line, but as per the
management it would the game-changing over the next two years as the company aggressively build capex in their heavy press forging unit
to sell premium auto parts such as front axle beams, stub axle, connecting rods, crankshafts and knuckle steering for heavy duty CVs.It’s all
started when the company forayed into the fully automated ring rolling business and started exploring the export market for their products.
RKFL’s export revenue is expected to grow at a CAGR of 124% over FY14‐17e, led largely by exports from the new plant. Export growth
would be the key trigger for the stock as its contribution to total revenue is likely to rise to 70% in FY17E from 23% in FY14.
Source: Company Data, Microsec Research

- 5 -
Microsec Research
9th April 2015
MHCVs and HCV Industry- Entering a period of high growth-The year FY2011-2012 was the beginning of a prolong slowdown for the MHCV & HCV industry as slowing industrial growth and weakening investment sentiment across sectors deep plummeting of CV sales.MHCV segment bore the brunt of slowing industrial activity with weak investment sentiment and the impact of significant fleet capacity addition on over the past three years, especially in the heavy-duty categories of the trucking market. Being a cyclical nature of the business, MHCV volumes growth exhibits fierce demand growth and slowdown. We believe, the cycle has reversed on the back of sharp economic recovery, mundane interest rate and lifting of restrictions on mining activities coupled with pick-up in the
construction segment. In the commercial vehicle segment, local players such as Tata Motors, Mahindra & Mahindra, Asia Motors Works (AMW) and Ashok Leyland have dominated the marketplace with local commercial vehicle manufacturers still accounting for more than 95 percent of the market share. Lack of market-specific products from global players has limited their ability to find acceptance among the core customer segments such as Indian truckers, bus/fleet operators and transporters. This is expected to change as more global companies such as Daimler (BharatBenz), MAN trucks, Volvo, Navistar International and Eicher Trucks enter India through strategic partnerships and joint ventures. The truck business has seen a lot of joint ventures between International players and local players.
Navistar International’s pact with Mahindra & Mahindra has led to Mahindra Navistar brand of trucks. Ashok Leyland, which was originally a joint venture between Hinduja group’s Ashok Motors and Leyland Motors, has partnered with the Japanese Nissan Motors for making light commercial vehicles. Famous German truck-makers MAN AG’s joint venture with Force Motors has led to MAN Force trucks. As more International players set up shop in India, the manufacturing activity in commercial vehicles is expected to get a strong fillip. MHCVs CV cycle recovery key to domestic business of RKFL-
Domestic business which largely depends on the cycle of
MHCV sector is decelerating over the last 2 years. The sector
itself recovering from the worst ever demand slowdown
when elevated interest rates coupled with mundane industrial activities caused deep plummeting of CV sales. Nevertheless, with an
expected pickup in economic recovery, freight rate hikes by the fleet operators, plenty of pent-up replacement demand, Restrictions on
truck overloading and low base will help MHCVs cycle to recover and we expect MHCVs volume to grow at a CAGR of ~16% over
FY14‐17e.Domestic revenue contributes ~77% to its top-line and this segment largely depends domestic CV sales. Over the past few years,
the company has formed a strategic relationship with local OEMs on the back of its strong customer engagement, robust product mix,
precision and cost competitiveness.
CAGR 2008-12: 22%
CAGR 2012-21: 11%

- 6 -
Microsec Research
9th April 2015
Capex predominantly over for the fresh 70,000 tonne-RKFL’s heavy press forging unit has will commission its forging capacity - from
70,000 tonnes per annum (TPA) to 150,000 TPA with an estimated capex of INR 700 crore. The company has financed this project with a
concoction of debt and equity. RKFL secured a debt of INR 500 Crore of its total capex of INR 700 Crore. As per management, the company
has been able to secure the debt with average 8 year tenure and 6.5% average interest rate for overall debt, which will bolster its
working capital management once the project scales up. With an additional debt on its book which will propel the D/E ratio well above
the comfort zone but we believe that the new head pressing unit has the strong scale-up potential coupled with robust order book from
export market provides high revenue visibility in the medium term context which will negate the near term liquidity risk.
Utilisation levels to increase over medium term-With the revival
in MHCV & LCV sales, demand for auto components
manufactured by RKFL namely front axle beams, stub axle,
connecting rods, crankshafts and knuckle steering will increase
materially. The business cycle of MHCV sector is decelerating over
the last 2 years. The sector itself recovering from the worst ever
demand slowdown when elevated interest rates coupled with
mundane industrial activities caused deep plummeting of CV
sales. Over the years RKFL’s utilisation rate has been linked to the
sales of MHCVs.RKFL’s capacity utilisation declined to ~59% in
FY14 from 80% in FY12 as MHCV sales volume decreased by 23%.,
with an expected pickup in economic recovery, freight rate hikes
by the fleet operators,plenty of pent-up replacement demand,
Restrictions on truck overloading and low base will help MHCVs
cycle to recover and we expect MHCVs volume to grow at a CAGR
of ~16% over FY14‐17e.
Funding for the new heavy press forging project
Debt raised (INR/USD - Mn) Equity raised
Exim Bank INR 1,000 IFC INR 275
IFC USD 14 Wayzata II Indian Ocean INR 494
DBS Bank USD 10 Promoters INR 680
LBBW EUR 18 Internal Accruals INR 601
SBI INR 700
Heavy press forging project status
Press (Tonnes) Capex (INR Cr) Commissioning
3150 Production runs
4500 500 Production runs
6300 Production runs
12500 180 By Q1 FY16
- 7 -
Microsec Research
9th April 2015
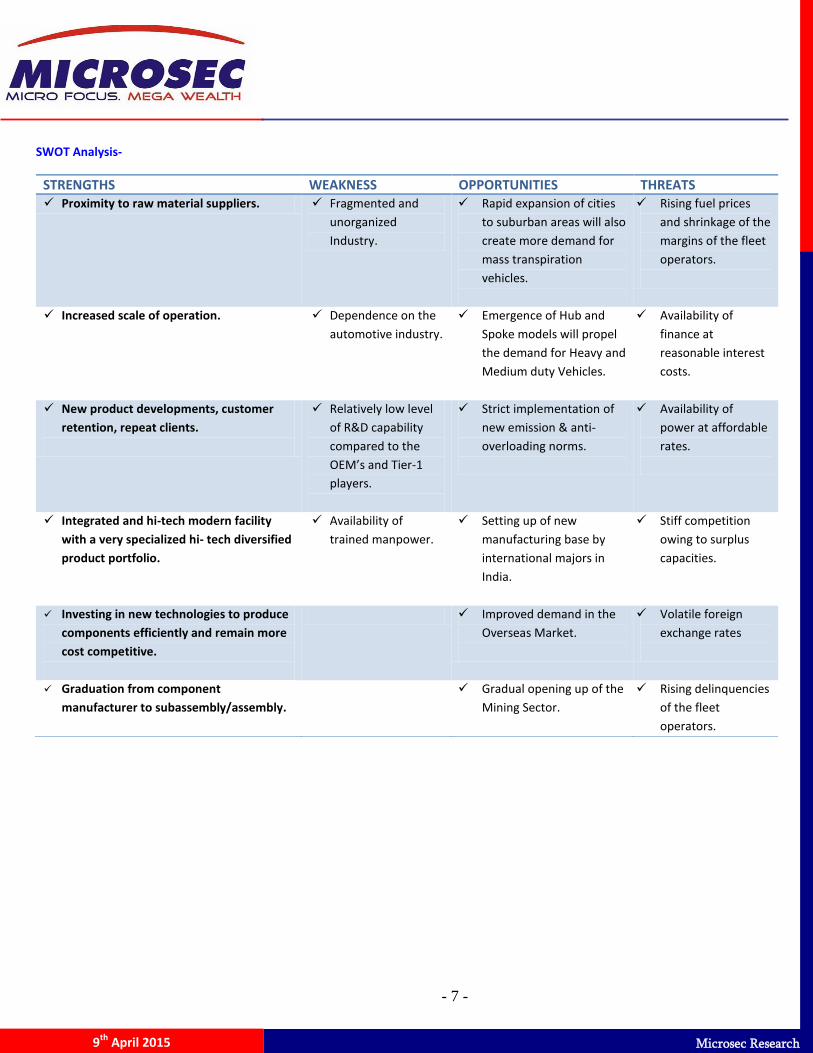
SWOT Analysis-
STRENGTHS WEAKNESS OPPORTUNITIES THREATS
Proximity to raw material suppliers. Fragmented and
unorganized
Industry.
Rapid expansion of cities
to suburban areas will also
create more demand for
mass transpiration
vehicles.
Rising fuel prices
and shrinkage of the
margins of the fleet
operators.
Increased scale of operation.
Dependence on the
automotive industry.
Emergence of Hub and
Spoke models will propel
the demand for Heavy and
Medium duty Vehicles.
Availability of
finance at
reasonable interest
costs.
New product developments, customer
retention, repeat clients.
Relatively low level
of R&D capability
compared to the
OEM’s and Tier-1
players.
Strict implementation of
new emission & anti-
overloading norms.
Availability of
power at affordable
rates.
Integrated and hi-tech modern facility
with a very specialized hi- tech diversified
product portfolio.
Availability of
trained manpower.
Setting up of new
manufacturing base by
international majors in
India.
Stiff competition
owing to surplus
capacities.
Investing in new technologies to produce
components efficiently and remain more
cost competitive.
Improved demand in the
Overseas Market.
Volatile foreign
exchange rates
Graduation from component
manufacturer to subassembly/assembly.
Gradual opening up of the
Mining Sector.
Rising delinquencies
of the fleet
operators.
- 8 -
Microsec Research
9th April 2015
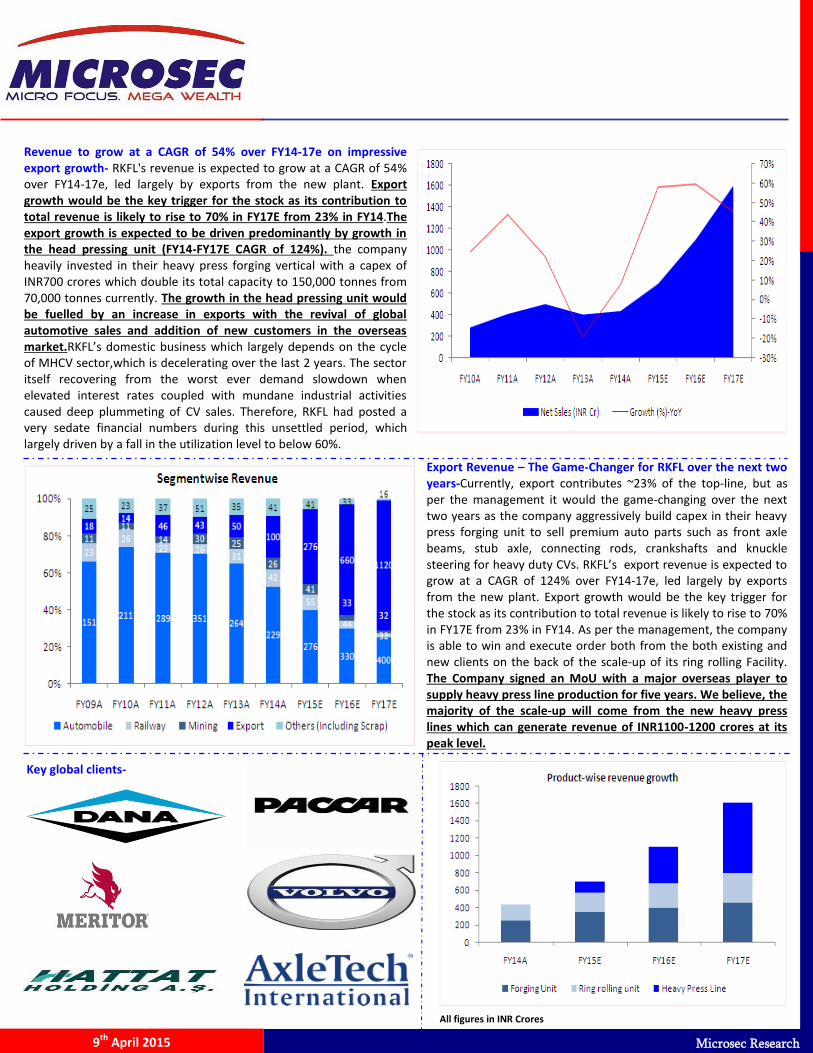
Revenue to grow at a CAGR of 54% over FY14‐17e on impressive export growth- RKFL's revenue is expected to grow at a CAGR of 54% over FY14‐17e, led largely by exports from the new plant. Export growth would be the key trigger for the stock as its contribution to total revenue is likely to rise to 70% in FY17E from 23% in FY14.The export growth is expected to be driven predominantly by growth in the head pressing unit (FY14-FY17E CAGR of 124%). the company heavily invested in their heavy press forging vertical with a capex of INR700 crores which double its total capacity to 150,000 tonnes from 70,000 tonnes currently. The growth in the head pressing unit would be fuelled by an increase in exports with the revival of global automotive sales and addition of new customers in the overseas market.RKFL’s domestic business which largely depends on the cycle of MHCV sector,which is decelerating over the last 2 years. The sector itself recovering from the worst ever demand slowdown when elevated interest rates coupled with mundane industrial activities caused deep plummeting of CV sales. Therefore, RKFL had posted a very sedate financial numbers during this unsettled period, which largely driven by a fall in the utilization level to below 60%.
Export Revenue – The Game-Changer for RKFL over the next two years-Currently, export contributes ~23% of the top-line, but as per the management it would the game-changing over the next two years as the company aggressively build capex in their heavy press forging unit to sell premium auto parts such as front axle beams, stub axle, connecting rods, crankshafts and knuckle steering for heavy duty CVs. RKFL’s export revenue is expected to grow at a CAGR of 124% over FY14‐17e, led largely by exports from the new plant. Export growth would be the key trigger for the stock as its contribution to total revenue is likely to rise to 70% in FY17E from 23% in FY14. As per the management, the company is able to win and execute order both from the both existing and new clients on the back of the scale-up of its ring rolling Facility. The Company signed an MoU with a major overseas player to supply heavy press line production for five years. We believe, the majority of the scale-up will come from the new heavy press lines which can generate revenue of INR1100-1200 crores at its peak level.
Key global clients-
All figures in INR Crores

- 9 -
Microsec Research
9th April 2015
Higher exports to aid margin recovery- RKFL enjoyed EBITDA
margins of ~17% in FY11, when top line grew ~44% YoY, but margin
decline by ~254bps in the later years due to demand slowdown of
MHCV sector when elevated interest rates coupled with mundane
industrial activities caused deep plummeting of CV sales and
increase in operating costs. As per the management, any increase in
raw material cost is passed on to customers but any increase in
other costs is borne by the company. Nevertheless, with an
expected pickup in economic recovery, freight rate hikes by the fleet
operators, Plenty of pent-up replacement demand, restrictions on
truck overloading and low base will help MHCVs cycle to recover
plus commissioning of heavy press forging unit will pave the way for
margin accretive export business, fuelled by increase in exports with
the revival of global automotive sales and addition of new
customers in the overseas market. Therefore, we expect EBITDA
margin to improve by 394bps, 50bps, 50bps in FY15E, FY16E,
FY17E, respectively, and create a robust earnings CAGR of 143%
over FY14-17E.
D/E ratio- Not a Cliffhanger- RKFL’s heavy press forging unit has will
commission its forgings capacity - from ~70,000 tonnes per annum
(TPA) to ~150,000 TPA with an estimated capex of INR 700 crore. The
company has financed this project with a concoction of debt and
equity. RKFL secured a debt of INR 500 Crore of its total capex of INR
700 Crore. As per management, the company has been able to secure
the debt with average 8 year tenure and 6.5% average interest rate
for overall debt, which will bolster its working capital management
once the project scales up. With an additional debt on its book which
will propel the D/E ratio well above the comfort zone, but we
believe that the new head pressing unit has the strong scale-up
potential coupled with a robust order book from export market
provides high revenue visibility in the medium term context which
will negate the near term liquidity risk.
RKFL to report a higher level of ROE over the next 2 years-
Forging is a capital intensive business where companies always
scout for fund for working capital requirement plus asset turnover
for this industry is low vis-à-vis other industries. So when the
capacity utilization level falls during the down cycle, return ratios
get affected. With an expected pickup in economic recovery,
freight rate hikes by the fleet operators, plenty of pent-up
replacement demand, will help MHCVs cycle to recover plus
commissioning of heavy press forging unit will pave the way for
margin accretive export business will propel company to post
significant ROE accretion.
- 10 -
Microsec Research
9th April 2015
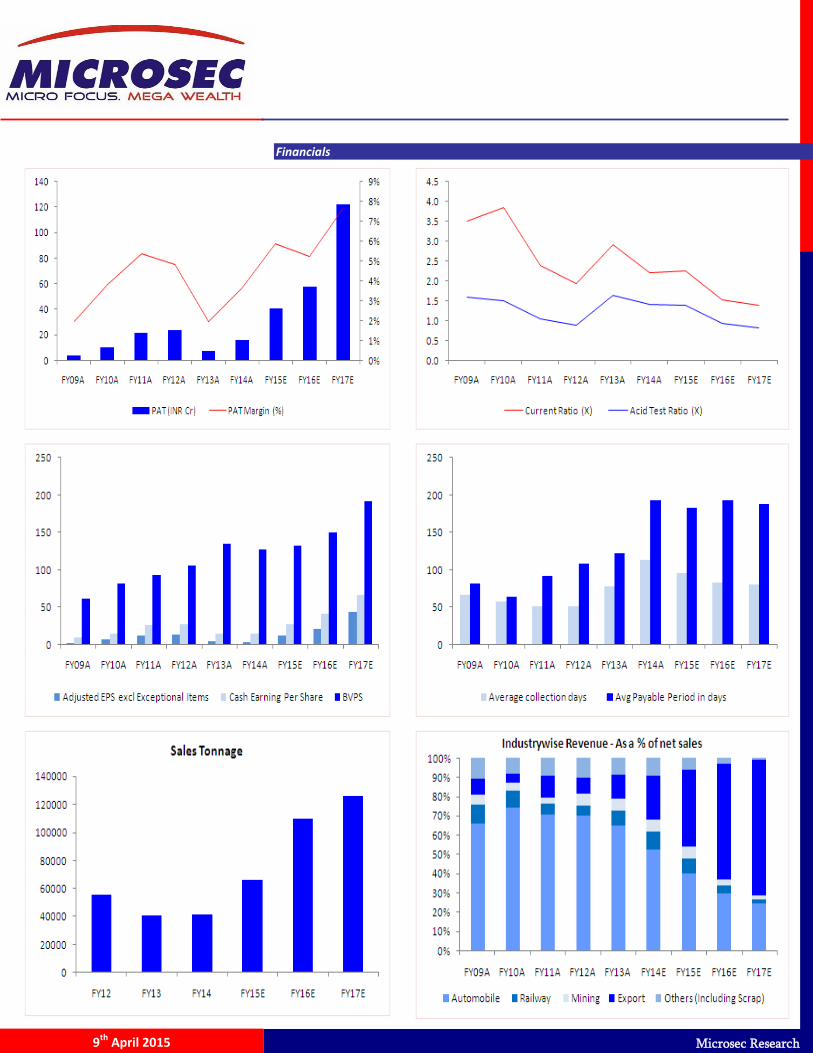
Financials
Source: Company, Microsec Research
- 11 -
Microsec Research
9th April 2015
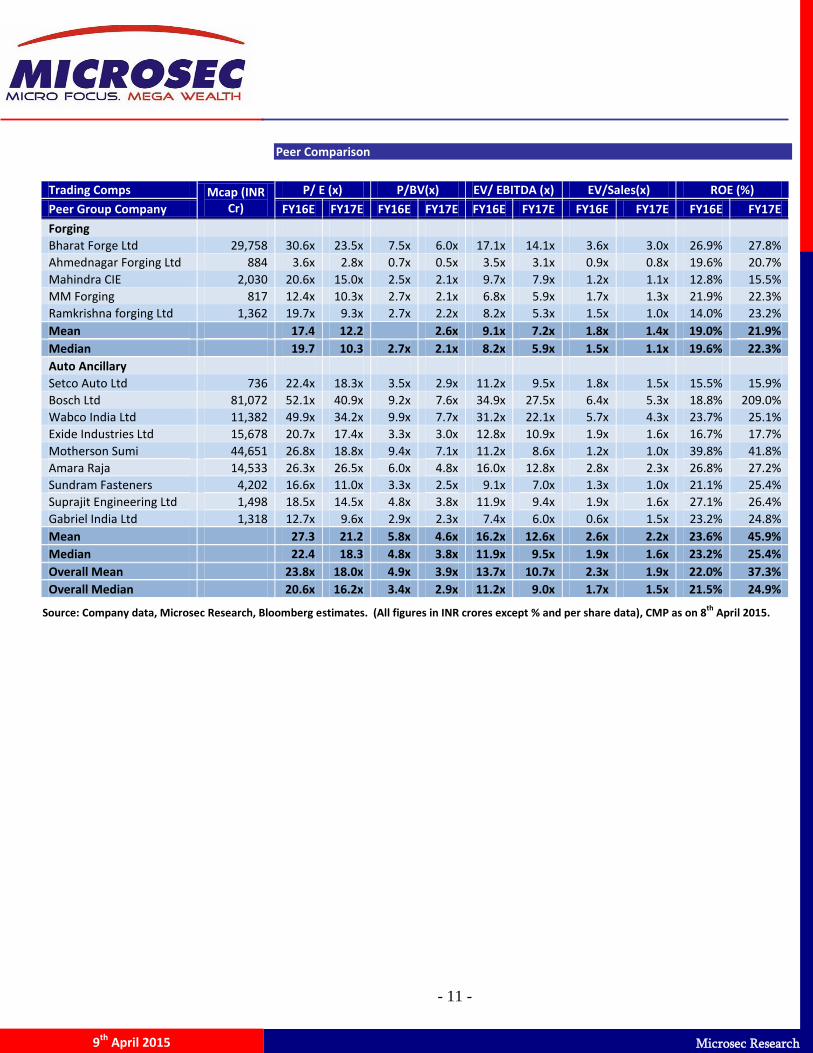
Peer Comparison
Source: Company data, Microsec Research, Bloomberg estimates. (All figures in INR crores except % and per share data), CMP as on 8th
April 2015.
Trading Comps Mcap (INR Cr)
P/ E (x) P/BV(x) EV/ EBITDA (x) EV/Sales(x) ROE (%)
Peer Group Company FY16E FY17E FY16E FY17E FY16E FY17E FY16E FY17E FY16E FY17E
Forging
Bharat Forge Ltd 29,758 30.6x 23.5x 7.5x 6.0x 17.1x 14.1x 3.6x 3.0x 26.9% 27.8%
Ahmednagar Forging Ltd 884 3.6x 2.8x 0.7x 0.5x 3.5x 3.1x 0.9x 0.8x 19.6% 20.7%
Mahindra CIE 2,030 20.6x 15.0x 2.5x 2.1x 9.7x 7.9x 1.2x 1.1x 12.8% 15.5%
MM Forging 817 12.4x 10.3x 2.7x 2.1x 6.8x 5.9x 1.7x 1.3x 21.9% 22.3%
Ramkrishna forging Ltd 1,362 19.7x 9.3x 2.7x 2.2x 8.2x 5.3x 1.5x 1.0x 14.0% 23.2%
Mean 17.4 12.2
2.6x 9.1x 7.2x 1.8x 1.4x 19.0% 21.9%
Median 19.7 10.3 2.7x 2.1x 8.2x 5.9x 1.5x 1.1x 19.6% 22.3%
Auto Ancillary
Setco Auto Ltd 736 22.4x 18.3x 3.5x 2.9x 11.2x 9.5x 1.8x 1.5x 15.5% 15.9%
Bosch Ltd 81,072 52.1x 40.9x 9.2x 7.6x 34.9x 27.5x 6.4x 5.3x 18.8% 209.0%
Wabco India Ltd 11,382 49.9x 34.2x 9.9x 7.7x 31.2x 22.1x 5.7x 4.3x 23.7% 25.1%
Exide Industries Ltd 15,678 20.7x 17.4x 3.3x 3.0x 12.8x 10.9x 1.9x 1.6x 16.7% 17.7%
Motherson Sumi 44,651 26.8x 18.8x 9.4x 7.1x 11.2x 8.6x 1.2x 1.0x 39.8% 41.8%
Amara Raja 14,533 26.3x 26.5x 6.0x 4.8x 16.0x 12.8x 2.8x 2.3x 26.8% 27.2%
Sundram Fasteners 4,202 16.6x 11.0x 3.3x 2.5x 9.1x 7.0x 1.3x 1.0x 21.1% 25.4%
Suprajit Engineering Ltd 1,498 18.5x 14.5x 4.8x 3.8x 11.9x 9.4x 1.9x 1.6x 27.1% 26.4%
Gabriel India Ltd 1,318 12.7x 9.6x 2.9x 2.3x 7.4x 6.0x 0.6x 1.5x 23.2% 24.8%
Mean 27.3 21.2 5.8x 4.6x 16.2x 12.6x 2.6x 2.2x 23.6% 45.9%
Median 22.4 18.3 4.8x 3.8x 11.9x 9.5x 1.9x 1.6x 23.2% 25.4%
Overall Mean 23.8x 18.0x 4.9x 3.9x 13.7x 10.7x 2.3x 1.9x 22.0% 37.3%
Overall Median 20.6x 16.2x 3.4x 2.9x 11.2x 9.0x 1.7x 1.5x 21.5% 24.9%
- 12 -
Microsec Research
9th April 2015
Valuation
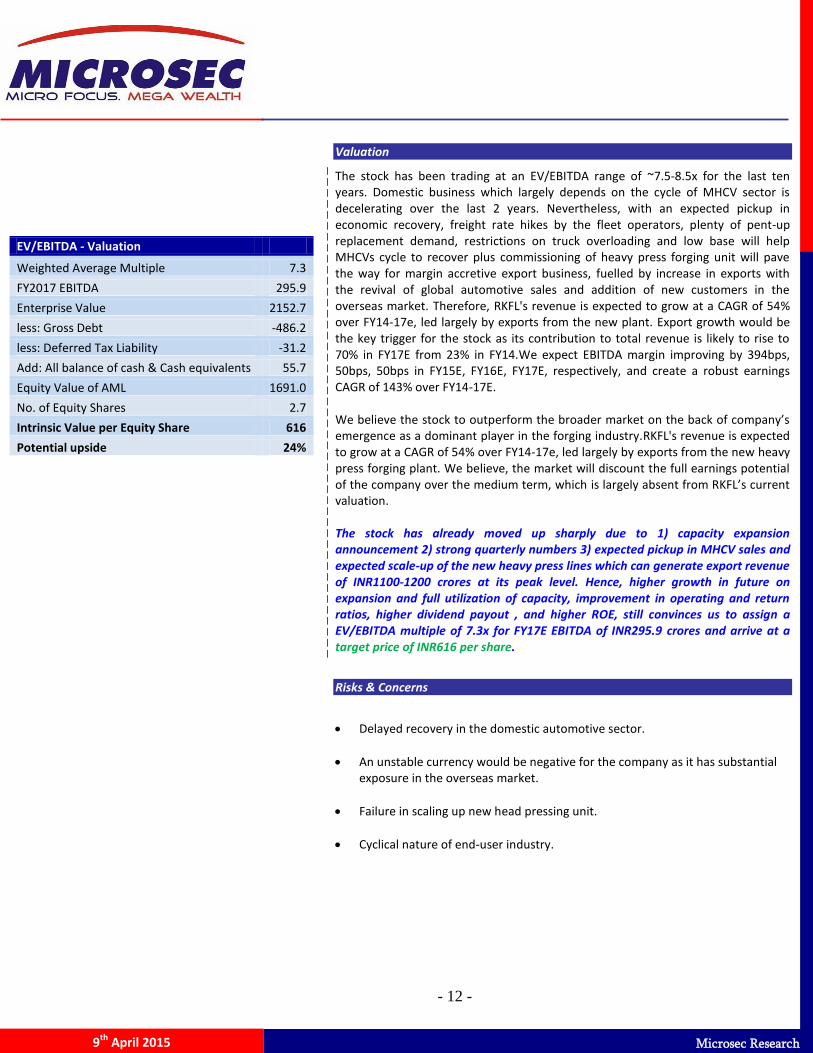
The stock has been trading at an EV/EBITDA range of ~7.5‐8.5x for the last ten years. Domestic business which largely depends on the cycle of MHCV sector is decelerating over the last 2 years. Nevertheless, with an expected pickup in economic recovery, freight rate hikes by the fleet operators, plenty of pent-up replacement demand, restrictions on truck overloading and low base will help MHCVs cycle to recover plus commissioning of heavy press forging unit will pave the way for margin accretive export business, fuelled by increase in exports with the revival of global automotive sales and addition of new customers in the overseas market. Therefore, RKFL's revenue is expected to grow at a CAGR of 54% over FY14‐17e, led largely by exports from the new plant. Export growth would be the key trigger for the stock as its contribution to total revenue is likely to rise to 70% in FY17E from 23% in FY14.We expect EBITDA margin improving by 394bps, 50bps, 50bps in FY15E, FY16E, FY17E, respectively, and create a robust earnings CAGR of 143% over FY14-17E. We believe the stock to outperform the broader market on the back of company’s emergence as a dominant player in the forging industry.RKFL's revenue is expected to grow at a CAGR of 54% over FY14‐17e, led largely by exports from the new heavy press forging plant. We believe, the market will discount the full earnings potential of the company over the medium term, which is largely absent from RKFL’s current valuation. The stock has already moved up sharply due to 1) capacity expansion announcement 2) strong quarterly numbers 3) expected pickup in MHCV sales and expected scale-up of the new heavy press lines which can generate export revenue of INR1100-1200 crores at its peak level. Hence, higher growth in future on expansion and full utilization of capacity, improvement in operating and return ratios, higher dividend payout , and higher ROE, still convinces us to assign a EV/EBITDA multiple of 7.3x for FY17E EBITDA of INR295.9 crores and arrive at a target price of INR616 per share.
Risks & Concerns
Delayed recovery in the domestic automotive sector.
An unstable currency would be negative for the company as it has substantial exposure in the overseas market.
Failure in scaling up new head pressing unit.
Cyclical nature of end-user industry.
EV/EBITDA - Valuation
Weighted Average Multiple 7.3
FY2017 EBITDA 295.9
Enterprise Value 2152.7
less: Gross Debt -486.2
less: Deferred Tax Liability -31.2
Add: All balance of cash & Cash equivalents 55.7
Equity Value of AML 1691.0
No. of Equity Shares 2.7
Intrinsic Value per Equity Share 616
Potential upside 24%

- 13 -
Microsec Research
9th April 2015
Income Statement Figures in INR Cr
Particulars (INR in Crores) FY09A FY10A FY11A FY12A FY13A FY14A FY15E FY16E FY17E
Net Sales 229.0 285.0 409.7 501.3 405.0 437.2 689.9 1100.1 1599.7
Growth (%)-YoY -6.2% 24.4% 43.8% 22.4% -19.2% 8.0% 57.8% 59.5% 45.4%
Total Income 229.0 285.0 409.7 501.3 405.0 437.2 689.9 1100.1 1599.7
Growth (%)-YoY 24.4% 43.8% 22.4% -19.2% 8.0% 57.8% 59.5% 45.4%
TOTAL EXPENDITURE 194.0 241.3 340.4 420.2 349.8 377.9 569.2 902.1 1303.8
as % of sales 84.7% 84.7% 83.1% 83.8% 86.4% 86.4% 82.5% 82.0% 81.5%
EBITDA 35.0 43.7 69.3 81.0 55.2 59.3 120.7 198.0 295.9
EBITDA Margin (%) 15.3% 15.3% 16.9% 16.2% 13.6% 13.6% 17.5% 18.0% 18.5%
Other Income 1.1 0.9 1.5 0.7 3.7 1.6 1.6 1.9 2.3
Operating Profit 36.1 44.6 70.8 81.7 58.9 60.9 122.3 199.9 298.2
Depreciation 11.0 13.1 21.0 27.1 22.7 25.1 36.5 58.1 61.6
EBIT 25.1 31.4 49.8 54.6 36.2 35.8 85.8 141.8 236.6
EBIT Margin (%) 11.0% 11.0% 12.2% 10.9% 8.9% 8.2% 12.4% 12.9% 14.8%
Interest 17.8 15.1 16.5 18.8 20.3 22.9 31.5 53.5 49.5
PBT 7.4 16.3 33.3 35.8 16.0 12.9 54.3 88.3 187.1
Exceptional items 0.0 0.0 0.0 0.0 7.5 7.5 0.0 0.0
PBT after exceptional items 7.4 16.3 33.3 35.8 16.0 20.4 61.8 88.3 187.1
PBT Margin (%) 3.2% 5.7% 8.1% 7.2% 3.9% 3.0% 7.9% 8.0% 11.7%
Tax 2.8 5.5 11.3 11.6 8.0 4.5 21.1 30.5 64.6
Tax (%) 38.4% 33.4% 33.8% 32.2% 50.0% 34.6% 34.1% 34.5% 34.5%
PAT 4.5 10.9 22.1 24.3 8.0 15.9 40.7 57.9 122.6
PAT Margin (%) 2.0% 3.8% 5.4% 4.8% 2.0% 3.6% 5.9% 5.3% 7.7%
Minority Interests 0 0 0 0 -0.8 7 7 0 0
Consolidated PAT 4.5 10.9 22.1 24.3 8.8 8.5 33.3 57.9 122.6
PAT Margin (%) (excl EI) 2.0% 3.8% 5.4% 4.8% 2.2% 1.9% 4.8% 5.3% 7.7%
PAT Growth (%) - YoY -89.7% 139.8% 102.5% 10.1% -63.9% -3.7% 293.3% 73.9% 111.9%
Basic EPS 3.0 7.1 13.4 13.6 4.7 6.3 14.8 21.1 44.6
Adjusted EPS excl exceptional items 2.5 7.0 13.1 13.6 4.7 3.3 12.1 21.1 44.6
Source: Company data, Microsec Research, (All figures in INR crores except % and per share data)
- 14 -
Microsec Research
9th April 2015
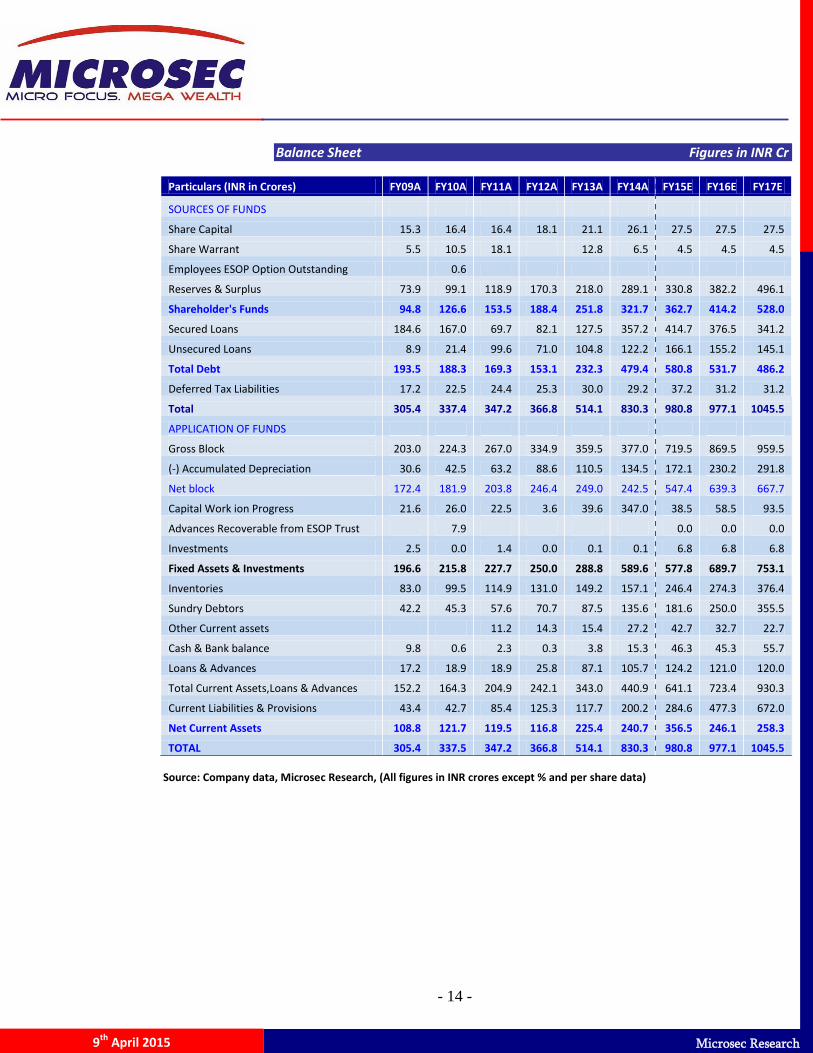
Balance Sheet Figures in INR Cr
Income Statement
Particulars (INR in Crores) FY09A FY10A FY11A FY12A FY13A FY14A FY15E FY16E FY17E
SOURCES OF FUNDS
Share Capital 15.3 16.4 16.4 18.1 21.1 26.1 27.5 27.5 27.5
Share Warrant 5.5 10.5 18.1 12.8 6.5 4.5 4.5 4.5
Employees ESOP Option Outstanding 0.6
Reserves & Surplus 73.9 99.1 118.9 170.3 218.0 289.1 330.8 382.2 496.1
Shareholder's Funds 94.8 126.6 153.5 188.4 251.8 321.7 362.7 414.2 528.0
Secured Loans 184.6 167.0 69.7 82.1 127.5 357.2 414.7 376.5 341.2
Unsecured Loans 8.9 21.4 99.6 71.0 104.8 122.2 166.1 155.2 145.1
Total Debt 193.5 188.3 169.3 153.1 232.3 479.4 580.8 531.7 486.2
Deferred Tax Liabilities 17.2 22.5 24.4 25.3 30.0 29.2 37.2 31.2 31.2
Total 305.4 337.4 347.2 366.8 514.1 830.3 980.8 977.1 1045.5
APPLICATION OF FUNDS
Gross Block 203.0 224.3 267.0 334.9 359.5 377.0 719.5 869.5 959.5
(-) Accumulated Depreciation 30.6 42.5 63.2 88.6 110.5 134.5 172.1 230.2 291.8
Net block 172.4 181.9 203.8 246.4 249.0 242.5 547.4 639.3 667.7
Capital Work ion Progress 21.6 26.0 22.5 3.6 39.6 347.0 38.5 58.5 93.5
Advances Recoverable from ESOP Trust 7.9 0.0 0.0 0.0
Investments 2.5 0.0 1.4 0.0 0.1 0.1 6.8 6.8 6.8
Fixed Assets & Investments 196.6 215.8 227.7 250.0 288.8 589.6 577.8 689.7 753.1
Inventories 83.0 99.5 114.9 131.0 149.2 157.1 246.4 274.3 376.4
Sundry Debtors 42.2 45.3 57.6 70.7 87.5 135.6 181.6 250.0 355.5
Other Current assets 11.2 14.3 15.4 27.2 42.7 32.7 22.7
Cash & Bank balance 9.8 0.6 2.3 0.3 3.8 15.3 46.3 45.3 55.7
Loans & Advances 17.2 18.9 18.9 25.8 87.1 105.7 124.2 121.0 120.0
Total Current Assets,Loans & Advances 152.2 164.3 204.9 242.1 343.0 440.9 641.1 723.4 930.3
Current Liabilities & Provisions 43.4 42.7 85.4 125.3 117.7 200.2 284.6 477.3 672.0
Net Current Assets 108.8 121.7 119.5 116.8 225.4 240.7 356.5 246.1 258.3
TOTAL 305.4 337.5 347.2 366.8 514.1 830.3 980.8 977.1 1045.5
Source: Company data, Microsec Research, (All figures in INR crores except % and per share data)
- 15 -
Microsec Research
9th April 2015
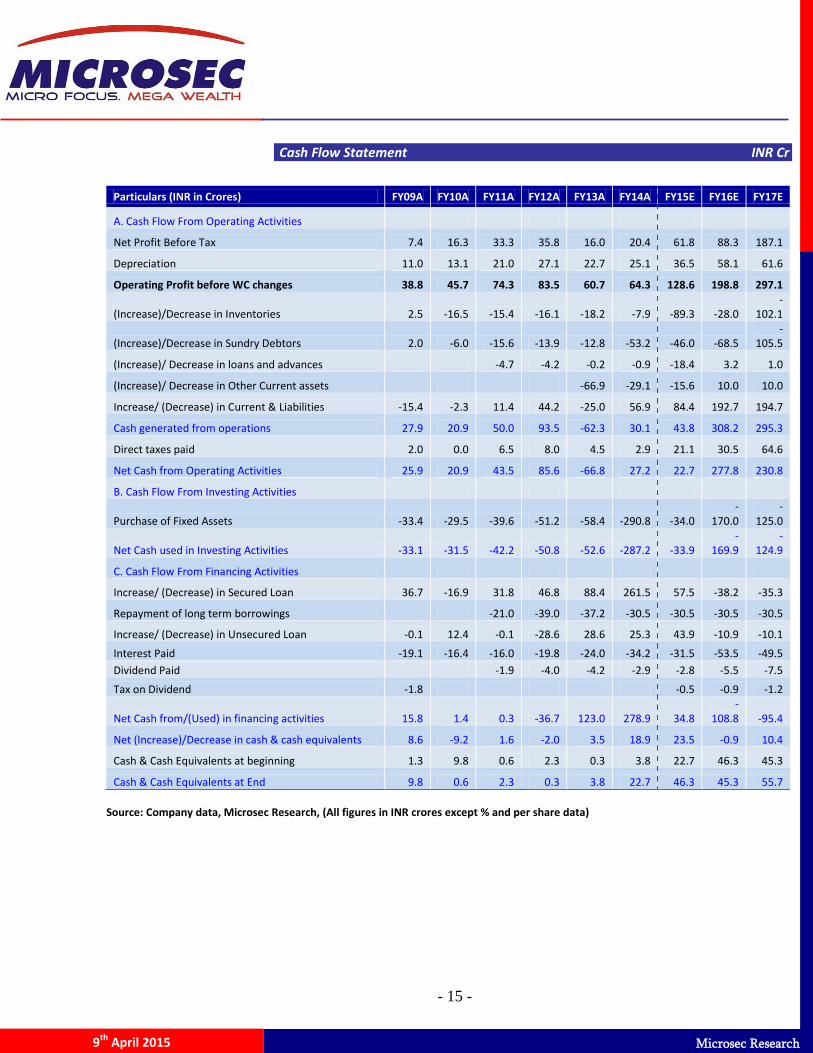
Cash Flow Statement INR Cr
Particulars (INR in Crores) FY09A FY10A FY11A FY12A FY13A FY14A FY15E FY16E FY17E
A. Cash Flow From Operating Activities
Net Profit Before Tax 7.4 16.3 33.3 35.8 16.0 20.4 61.8 88.3 187.1
Depreciation 11.0 13.1 21.0 27.1 22.7 25.1 36.5 58.1 61.6
Operating Profit before WC changes 38.8 45.7 74.3 83.5 60.7 64.3 128.6 198.8 297.1
(Increase)/Decrease in Inventories 2.5 -16.5 -15.4 -16.1 -18.2 -7.9 -89.3 -28.0 -
102.1
(Increase)/Decrease in Sundry Debtors 2.0 -6.0 -15.6 -13.9 -12.8 -53.2 -46.0 -68.5 -
105.5
(Increase)/ Decrease in loans and advances -4.7 -4.2 -0.2 -0.9 -18.4 3.2 1.0
(Increase)/ Decrease in Other Current assets -66.9 -29.1 -15.6 10.0 10.0
Increase/ (Decrease) in Current & Liabilities -15.4 -2.3 11.4 44.2 -25.0 56.9 84.4 192.7 194.7
Cash generated from operations 27.9 20.9 50.0 93.5 -62.3 30.1 43.8 308.2 295.3
Direct taxes paid 2.0 0.0 6.5 8.0 4.5 2.9 21.1 30.5 64.6
Net Cash from Operating Activities 25.9 20.9 43.5 85.6 -66.8 27.2 22.7 277.8 230.8
B. Cash Flow From Investing Activities
Purchase of Fixed Assets -33.4 -29.5 -39.6 -51.2 -58.4 -290.8 -34.0 -
170.0 -
125.0
Net Cash used in Investing Activities -33.1 -31.5 -42.2 -50.8 -52.6 -287.2 -33.9 -
169.9 -
124.9
C. Cash Flow From Financing Activities
Increase/ (Decrease) in Secured Loan 36.7 -16.9 31.8 46.8 88.4 261.5 57.5 -38.2 -35.3
Repayment of long term borrowings -21.0 -39.0 -37.2 -30.5 -30.5 -30.5 -30.5
Increase/ (Decrease) in Unsecured Loan -0.1 12.4 -0.1 -28.6 28.6 25.3 43.9 -10.9 -10.1
Interest Paid -19.1 -16.4 -16.0 -19.8 -24.0 -34.2 -31.5 -53.5 -49.5
Dividend Paid -1.9 -4.0 -4.2 -2.9 -2.8 -5.5 -7.5
Tax on Dividend -1.8 -0.5 -0.9 -1.2
Net Cash from/(Used) in financing activities 15.8 1.4 0.3 -36.7 123.0 278.9 34.8 -
108.8 -95.4
Net (Increase)/Decrease in cash & cash equivalents 8.6 -9.2 1.6 -2.0 3.5 18.9 23.5 -0.9 10.4
Cash & Cash Equivalents at beginning 1.3 9.8 0.6 2.3 0.3 3.8 22.7 46.3 45.3
Cash & Cash Equivalents at End 9.8 0.6 2.3 0.3 3.8 22.7 46.3 45.3 55.7
Source: Company data, Microsec Research, (All figures in INR crores except % and per share data)
- 16 -
Microsec Research
9th April 2015
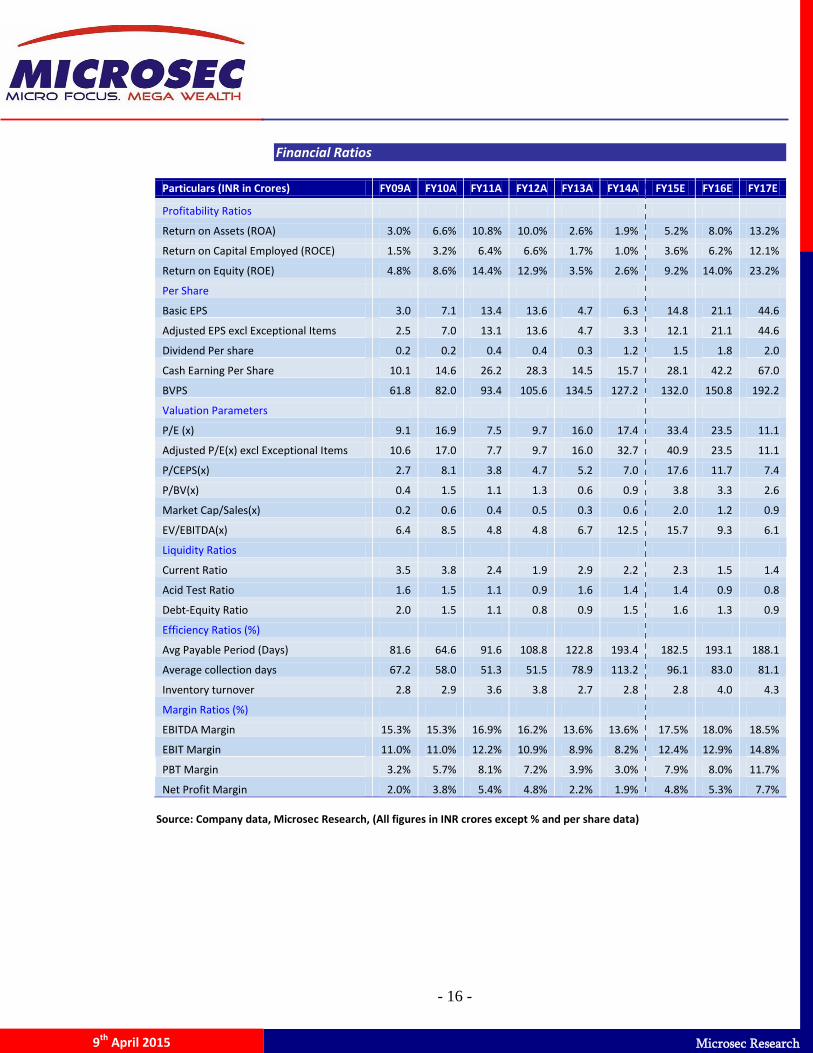
Financial Ratios
Particulars (INR in Crores) FY09A FY10A FY11A FY12A FY13A FY14A FY15E FY16E FY17E
Profitability Ratios
Return on Assets (ROA) 3.0% 6.6% 10.8% 10.0% 2.6% 1.9% 5.2% 8.0% 13.2%
Return on Capital Employed (ROCE) 1.5% 3.2% 6.4% 6.6% 1.7% 1.0% 3.6% 6.2% 12.1%
Return on Equity (ROE) 4.8% 8.6% 14.4% 12.9% 3.5% 2.6% 9.2% 14.0% 23.2%
Per Share
Basic EPS 3.0 7.1 13.4 13.6 4.7 6.3 14.8 21.1 44.6
Adjusted EPS excl Exceptional Items 2.5 7.0 13.1 13.6 4.7 3.3 12.1 21.1 44.6
Dividend Per share 0.2 0.2 0.4 0.4 0.3 1.2 1.5 1.8 2.0
Cash Earning Per Share 10.1 14.6 26.2 28.3 14.5 15.7 28.1 42.2 67.0
BVPS 61.8 82.0 93.4 105.6 134.5 127.2 132.0 150.8 192.2
Valuation Parameters
P/E (x) 9.1 16.9 7.5 9.7 16.0 17.4 33.4 23.5 11.1
Adjusted P/E(x) excl Exceptional Items 10.6 17.0 7.7 9.7 16.0 32.7 40.9 23.5 11.1
P/CEPS(x) 2.7 8.1 3.8 4.7 5.2 7.0 17.6 11.7 7.4
P/BV(x) 0.4 1.5 1.1 1.3 0.6 0.9 3.8 3.3 2.6
Market Cap/Sales(x) 0.2 0.6 0.4 0.5 0.3 0.6 2.0 1.2 0.9
EV/EBITDA(x) 6.4 8.5 4.8 4.8 6.7 12.5 15.7 9.3 6.1
Liquidity Ratios
Current Ratio 3.5 3.8 2.4 1.9 2.9 2.2 2.3 1.5 1.4
Acid Test Ratio 1.6 1.5 1.1 0.9 1.6 1.4 1.4 0.9 0.8
Debt-Equity Ratio 2.0 1.5 1.1 0.8 0.9 1.5 1.6 1.3 0.9
Efficiency Ratios (%)
Avg Payable Period (Days) 81.6 64.6 91.6 108.8 122.8 193.4 182.5 193.1 188.1
Average collection days 67.2 58.0 51.3 51.5 78.9 113.2 96.1 83.0 81.1
Inventory turnover 2.8 2.9 3.6 3.8 2.7 2.8 2.8 4.0 4.3
Margin Ratios (%)
EBITDA Margin 15.3% 15.3% 16.9% 16.2% 13.6% 13.6% 17.5% 18.0% 18.5%
EBIT Margin 11.0% 11.0% 12.2% 10.9% 8.9% 8.2% 12.4% 12.9% 14.8%
PBT Margin 3.2% 5.7% 8.1% 7.2% 3.9% 3.0% 7.9% 8.0% 11.7%
Net Profit Margin 2.0% 3.8% 5.4% 4.8% 2.2% 1.9% 4.8% 5.3% 7.7%
Source: Company data, Microsec Research, (All figures in INR crores except % and per share data)

- 17 -
Microsec Research
9th April 2015
- 18 -
Microsec Research
9th April 2015
- 19 -
Microsec Research
9th April 2015
Recommended