Research ArticleInversion Calculation Analysis of Operational Tunnel StructureBased on the Distributed Optical-Fiber Sensing System
Jie Zhao,1 Jiang Feng,1 and Liang Ren2
1Dalian University R&D Center of the Civil Engineering Technology, Dalian 116622, China2School of Civil and Hydraulic Engineering, Dalian University of Technology, Dalian 116024, China
Correspondence should be addressed to Jie Zhao; zhaojie [email protected]
Received 31 March 2017; Revised 7 June 2017; Accepted 12 July 2017; Published 17 August 2017
Academic Editor: Deodato Tapete
Copyright © 2017 Jie Zhao et al.This is an open access article distributed under the Creative Commons Attribution License, whichpermits unrestricted use, distribution, and reproduction in any medium, provided the original work is properly cited.
In combination of the actual project in Dalian Baiyun Mountain Tunnel, this paper introduces the principle of fiber optic sensormonitoring system based on optical time domain reflectometer.Then, based on the orthogonal design and even design scheme, thispaper carries out a numerical experiment on the tunnel surrounding rock and establishes a regressionmodel of themapping relationbetween surrounding rock parameters of operation tunnel and the monitored displacement in order to set the difference betweenthe monitored displacement and the calculated displacement as the fitness function. In the end, this paper carries out parameteridentification based on the differential evolution algorithm. Achievements of the study proved that real-time safety warning couldbe realized inside the tunnel by monitoring the deformation parameters of tunnel vault at real time relying on the optical-fibersensing system of the optical time domain reflectometer (OTDR). Parameters identification was carried out on the structurewith differential evolution according to measured data and selected parameters, and great coincidence was obtained between themeasured displacement and the identified parameters displacement, which proved the strong adaptability of the method.
1. Introduction
Thedistributed fiber optic sensing technology is a new type ofsensing technology which is developed on the basis of opticaltime domain reflectometry (OTDR) in optical-fiber engi-neering [1]. Along with the development of the optical-fibersensing technology, the distributed optical-fiber sensor isusedmore andmore extensively in fields like civil, machinery,and aerospace structure for monitoring (Bao and Chan 2011,Feng et al., 2014). The strain monitoring system based on thedistributed optical-fiber sensor is featured with long distanceof monitoring and strong resistance against corrosion andinterference and so forth, which solves the low-precisionspatial resolution problems existing in discrete sensor basedmonitoring system (Glisic and Yao, 2012). Mohamad et al.(2010) analyzed the influence of newly constructed tunnelsin different positions on the above old brick tunnels throughBOTDR-based novel distributed optical-fiber strain measur-ing system [2]. Klar et al. (2014) established 2D and 3D earthshift models by utilizing the model parameters determined
according to the data which is measured by the optical-fiber sensor on the spot. The earth shift model parametershave excellent anti-interference performance and accuracyaccording to validation [3]. When the distributed optical-fiber sensor is embedded into or surface bonded to surface ofthe structure, the real continuous and distributed measuringon the strain and the temperature at different points can berealized. Furthermore, different from the high cost of thediscrete sensing system, the distributed optical-fiber sensingsystemproves effectiveways to cut down the cost for structuremonitoring. At present, the researches on and applicationof the optical time domain reflectometer (OTDR) baseddistributed optical-fiber sensing technology are still at thestarting stage in China.
As the quantum leaps in computer technology, the sitesafetymonitoring of tunnel andmethodwhich adopts variousinverse analysis calculations have been hotly focused andresearched on by the engineering community. Consequently,carrying out quantitative identification analysis from the levelof mechanical model is of great engineering significance
HindawiAdvances in Civil EngineeringVolume 2017, Article ID 6159095, 9 pageshttps://doi.org/10.1155/2017/6159095
2 Advances in Civil Engineering
and academic value [4, 5]. Scholars at home and abroadhave applied particle swarm algorithm and genetic algorithm[6, 7] in the inverse calculation of parameters in rockengineering, which has achieved excellent results. However,this kind of algorithm has several disadvantages, such asslow convergence speed, long calculation time, and hugecalculation amount, which are yet to be improved. Later,the differential evolution algorithm (DE) is a new globaloptimization algorithm brought up by Rainer Storm andKen Price in 1995, which has no requirement for the initialvalues and possesses advantages, such as quick convergencespeed, strong adaptability for various functions, and parallelcalculation. Especially, it is applicable to the optimizationof complex problems [8–11]. In order to master the stabilityof tunnel in which the vehicle load and environmentalconditions change constantly in normal operation periodand dynamically follow as well as evaluate the safety statusof the tunnel, this paper developed a real-time monitoringsystem for tunnel vault based on OTDR distributed sensor.According to the tunnel surrounding rock structure andthe vault displacement information, this paper introducesDE algorithm and then combines with orthogonal design tocarry out inverse analysis on the major mechanical impactparameters of tunnel lining structure. In addition, this papercarries analysis and evaluation on the stability of tunnelstructure. Furthermore, the accuracy of inverse parametersand prediction results are illustrated.
2. OTDR Theories and Application forReal-Time Tunnel Monitoring
As a photoelectric integrated instrument for testing opti-cal fiber, optical Time Domain Reflectometer (OTDR) canmeasure the length of optical fiber, transmission loss ofoptical fiber, splice attenuation, and fault location. Specifi-cally, OTDR is a photoelectric integrated instrument whichuses the backward scattering of Rayleigh scattering andFresnel reflection of light to test the optical fiber when itis transmitted through optical fiber. This backward Rayleighscattering technology mainly measures the time it takes forthe pulse light wave to transmit in the optical fiber forlocating the place with scattering loss [12–14]. Widely appliedin the maintenance and construction of cable circuits, itcan measure the length of optical fiber, transmission loss ofoptical fiber, splice attenuation, and fault location.
OTDR test is realized by emitting optical pulses intothe optical fiber and later receiving returned information atthe OTDR port. The optical pulses will scatter and reflectwhen transmitting in the optical fiber, due to the properties,connectors, junction points, bending, or other similar events,of the optical fiber, and some scattering and reflectionwill return to OTDR. The returned useful information ismeasured by the detector of OTDR and will be used as thetime or curve slices at different points inside the optical fiber.This process repeats again and again and the final results willbe averaged and shown as a track. This track indicates thestrength (strong or weak) of signals in the whole optical-fiber section [15, 16]. Therefore, quick determination on the
nature and location of event points in the optical-fiber linkcan be realized by merely observing signal graphs on theoscilloscope. This monitoring way may realize measuring ofsensing volume of each point distributed along the sensorfiber and thus enjoys wide prospect for use. In addition,OTDR has advantages like easy installation, no harm totunnel structure, low minimum resolution, strong resistanceto interference, and capability for long-distance real-timeonline monitoring.
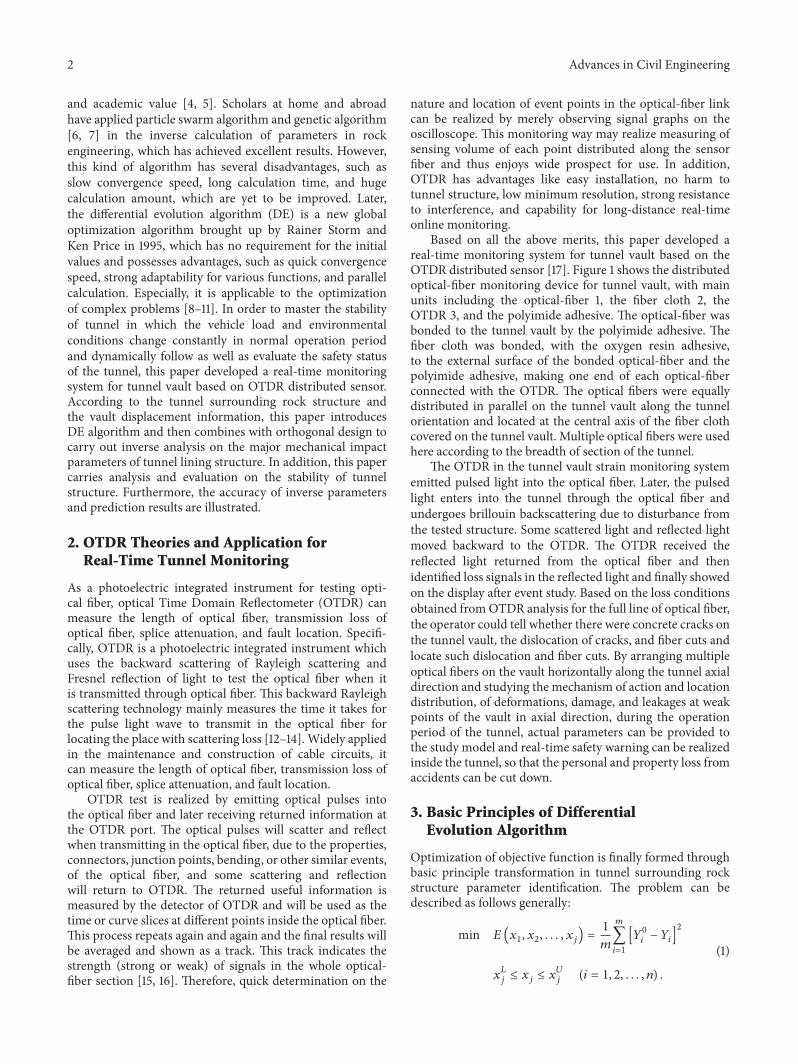
Based on all the above merits, this paper developed areal-time monitoring system for tunnel vault based on theOTDR distributed sensor [17]. Figure 1 shows the distributedoptical-fiber monitoring device for tunnel vault, with mainunits including the optical-fiber 1, the fiber cloth 2, theOTDR 3, and the polyimide adhesive. The optical-fiber wasbonded to the tunnel vault by the polyimide adhesive. Thefiber cloth was bonded, with the oxygen resin adhesive,to the external surface of the bonded optical-fiber and thepolyimide adhesive, making one end of each optical-fiberconnected with the OTDR. The optical fibers were equallydistributed in parallel on the tunnel vault along the tunnelorientation and located at the central axis of the fiber clothcovered on the tunnel vault. Multiple optical fibers were usedhere according to the breadth of section of the tunnel.
The OTDR in the tunnel vault strain monitoring systememitted pulsed light into the optical fiber. Later, the pulsedlight enters into the tunnel through the optical fiber andundergoes brillouin backscattering due to disturbance fromthe tested structure. Some scattered light and reflected lightmoved backward to the OTDR. The OTDR received thereflected light returned from the optical fiber and thenidentified loss signals in the reflected light and finally showedon the display after event study. Based on the loss conditionsobtained fromOTDR analysis for the full line of optical fiber,the operator could tell whether there were concrete cracks onthe tunnel vault, the dislocation of cracks, and fiber cuts andlocate such dislocation and fiber cuts. By arranging multipleoptical fibers on the vault horizontally along the tunnel axialdirection and studying the mechanism of action and locationdistribution, of deformations, damage, and leakages at weakpoints of the vault in axial direction, during the operationperiod of the tunnel, actual parameters can be provided tothe study model and real-time safety warning can be realizedinside the tunnel, so that the personal and property loss fromaccidents can be cut down.
3. Basic Principles of DifferentialEvolution Algorithm
Optimization of objective function is finally formed throughbasic principle transformation in tunnel surrounding rockstructure parameter identification. The problem can bedescribed as follows generally:
min 𝐸 (𝑥1, 𝑥2, . . . , 𝑥𝑗) = 1𝑚𝑚
∑𝑖=1
[𝑌0𝑖 − 𝑌𝑖]2
𝑥𝐿𝑗 ≤ 𝑥𝑗 ≤ 𝑥𝑈𝑗 (𝑖 = 1, 2, . . . , 𝑛) .(1)
Advances in Civil Engineering 3
31
2600
600600 25002500 2000
10200
2000
600
600
6000
1020
0
Optical loop
Flame retardant glass fiber (1.0 mm)
Flame retardant glass fiber (1.0Epoxy resin structural ashesive Skin line �ber
KaptonConcrete
mm)
Figure 1: Layout of distributed optical-fiber sensors in the tunnel.
Constraint is
𝑘𝑢 (𝑥) = 𝐹. (2)
In the formula, 𝑌0𝑖 refers to measured strain value, 𝑌𝑖refers to calculating strain value, 𝑚 refers to observationnumber, 𝑥𝑗 refers to to-be-inverted parameters, 𝑗 refers toparameter number, 𝑥𝐿𝑗 and 𝑥𝑈𝑗 are, respectively, upper limitand lower limit of parameters.𝐾 and𝐹 are, respectively, finiteelement stiffness matrix and equivalent node force.
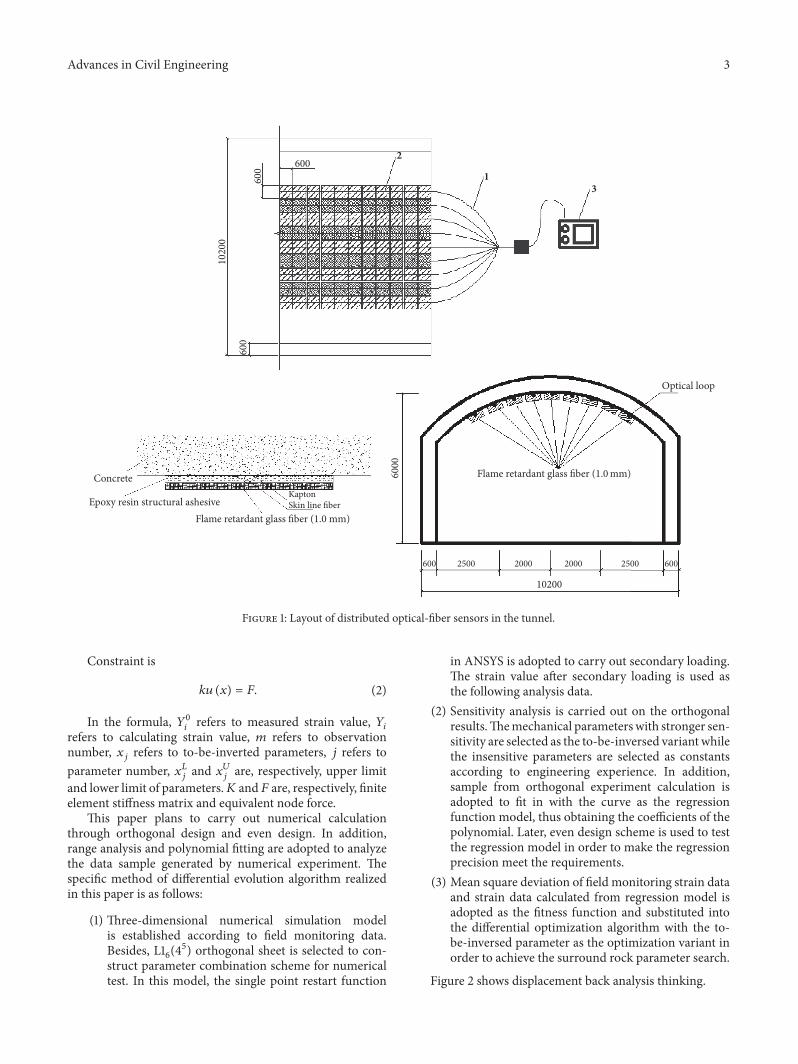
This paper plans to carry out numerical calculationthrough orthogonal design and even design. In addition,range analysis and polynomial fitting are adopted to analyzethe data sample generated by numerical experiment. Thespecific method of differential evolution algorithm realizedin this paper is as follows:
(1) Three-dimensional numerical simulation modelis established according to field monitoring data.Besides, L16(4
5) orthogonal sheet is selected to con-struct parameter combination scheme for numericaltest. In this model, the single point restart function
in ANSYS is adopted to carry out secondary loading.The strain value after secondary loading is used asthe following analysis data.
(2) Sensitivity analysis is carried out on the orthogonalresults.Themechanical parameterswith stronger sen-sitivity are selected as the to-be-inversed variant whilethe insensitive parameters are selected as constantsaccording to engineering experience. In addition,sample from orthogonal experiment calculation isadopted to fit in with the curve as the regressionfunction model, thus obtaining the coefficients of thepolynomial. Later, even design scheme is used to testthe regression model in order to make the regressionprecision meet the requirements.
(3) Mean square deviation of field monitoring strain dataand strain data calculated from regression model isadopted as the fitness function and substituted intothe differential optimization algorithm with the to-be-inversed parameter as the optimization variant inorder to achieve the surround rock parameter search.
Figure 2 shows displacement back analysis thinking.
4 Advances in Civil Engineering
Orthogonal test design parameter plan
Numerical simulation calculated displacement
Analysis on parameter sensitivity
Determination of to-be-inverted parameters
Uniform design and veri�cation of regression coe�cients
Rearrangement of parameter orthogonal plan
ANSYS calculated displacement
Polynomial regression analysis
Search for inversion parameters by DE algorithm
Displacement contrast
Figure 2: Implementation of displacement back analysis ideas.
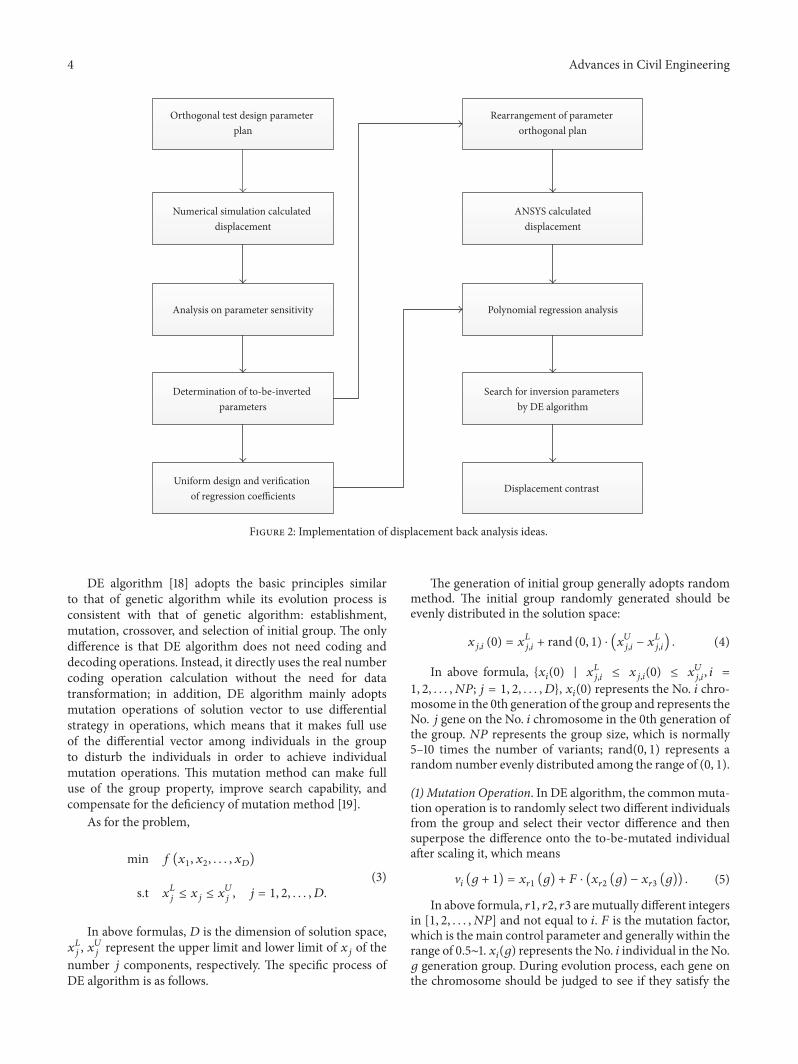
DE algorithm [18] adopts the basic principles similarto that of genetic algorithm while its evolution process isconsistent with that of genetic algorithm: establishment,mutation, crossover, and selection of initial group. The onlydifference is that DE algorithm does not need coding anddecoding operations. Instead, it directly uses the real numbercoding operation calculation without the need for datatransformation; in addition, DE algorithm mainly adoptsmutation operations of solution vector to use differentialstrategy in operations, which means that it makes full useof the differential vector among individuals in the groupto disturb the individuals in order to achieve individualmutation operations. This mutation method can make fulluse of the group property, improve search capability, andcompensate for the deficiency of mutation method [19].
As for the problem,
min 𝑓 (𝑥1, 𝑥2, . . . , 𝑥𝐷)s.t 𝑥𝐿𝑗 ≤ 𝑥𝑗 ≤ 𝑥𝑈𝑗 , 𝑗 = 1, 2, . . . , 𝐷.
(3)
In above formulas, 𝐷 is the dimension of solution space,𝑥𝐿𝑗 , 𝑥𝑈𝑗 represent the upper limit and lower limit of 𝑥𝑗 of thenumber 𝑗 components, respectively. The specific process ofDE algorithm is as follows.
The generation of initial group generally adopts randommethod. The initial group randomly generated should beevenly distributed in the solution space:
𝑥𝑗,𝑖 (0) = 𝑥𝐿𝑗,𝑖 + rand (0, 1) ⋅ (𝑥𝑈𝑗,𝑖 − 𝑥𝐿𝑗,𝑖) . (4)
In above formula, {𝑥𝑖(0) | 𝑥𝐿𝑗,𝑖 ≤ 𝑥𝑗,𝑖(0) ≤ 𝑥𝑈𝑗,𝑖, 𝑖 =1, 2, . . . , 𝑁𝑃; 𝑗 = 1, 2, . . . , 𝐷}, 𝑥𝑖(0) represents the No. 𝑖 chro-mosome in the 0th generation of the group and represents theNo. 𝑗 gene on the No. 𝑖 chromosome in the 0th generation ofthe group. 𝑁𝑃 represents the group size, which is normally5–10 times the number of variants; rand(0, 1) represents arandom number evenly distributed among the range of (0, 1).(1) Mutation Operation. In DE algorithm, the commonmuta-tion operation is to randomly select two different individualsfrom the group and select their vector difference and thensuperpose the difference onto the to-be-mutated individualafter scaling it, which means
V𝑖 (𝑔 + 1) = 𝑥𝑟1 (𝑔) + 𝐹 ⋅ (𝑥𝑟2 (𝑔) − 𝑥𝑟3 (𝑔)) . (5)
In above formula, 𝑟1, 𝑟2, 𝑟3 aremutually different integersin [1, 2, . . . , 𝑁𝑃] and not equal to 𝑖. 𝐹 is the mutation factor,which is the main control parameter and generally within therange of 0.5∼1. 𝑥𝑖(𝑔) represents the No. 𝑖 individual in the No.𝑔 generation group. During evolution process, each gene onthe chromosome should be judged to see if they satisfy the
Advances in Civil Engineering 5
To-be-invertedparameters
Generation of initial population
Evaluation
Variation
Cross
Selection
Termination conditions
Strart
Finish
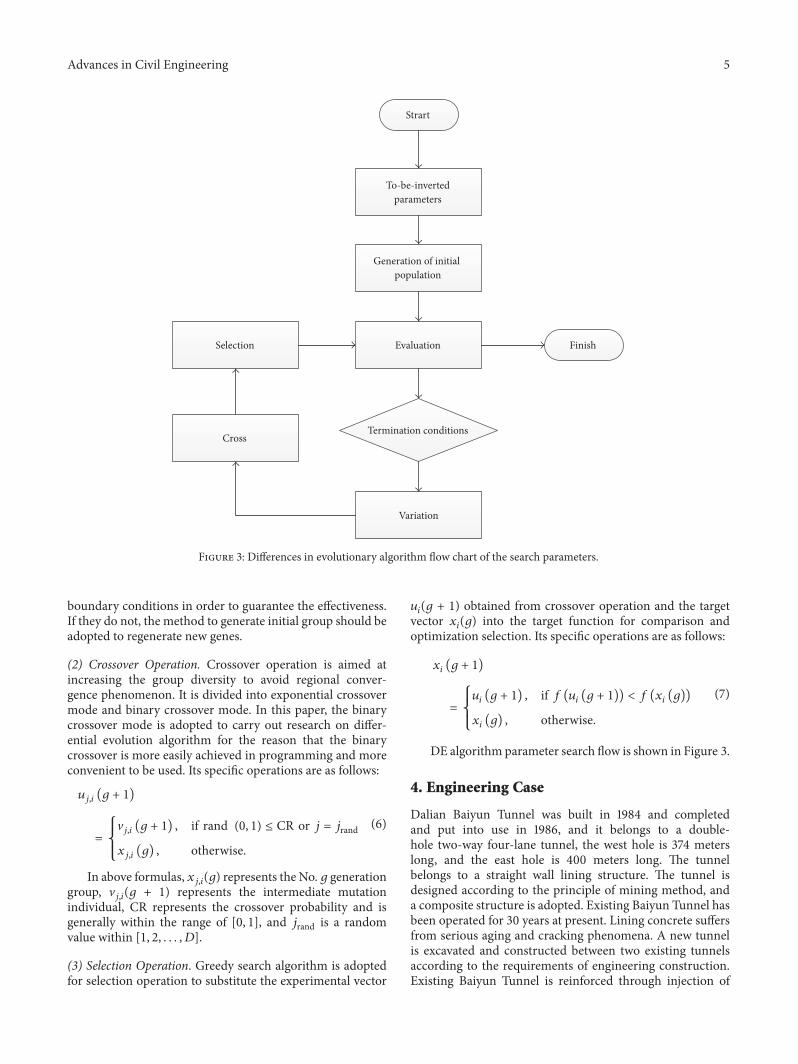
Figure 3: Differences in evolutionary algorithm flow chart of the search parameters.
boundary conditions in order to guarantee the effectiveness.If they do not, the method to generate initial group should beadopted to regenerate new genes.
(2) Crossover Operation. Crossover operation is aimed atincreasing the group diversity to avoid regional conver-gence phenomenon. It is divided into exponential crossovermode and binary crossover mode. In this paper, the binarycrossover mode is adopted to carry out research on differ-ential evolution algorithm for the reason that the binarycrossover is more easily achieved in programming and moreconvenient to be used. Its specific operations are as follows:
𝑢𝑗,𝑖 (𝑔 + 1)
= {{{V𝑗,𝑖 (𝑔 + 1) , if rand (0, 1) ≤ CR or 𝑗 = 𝑗rand𝑥𝑗,𝑖 (𝑔) , otherwise.
(6)
In above formulas, 𝑥𝑗,𝑖(𝑔) represents the No. 𝑔 generationgroup, V𝑗,𝑖(𝑔 + 1) represents the intermediate mutationindividual, CR represents the crossover probability and isgenerally within the range of [0, 1], and 𝑗rand is a randomvalue within [1, 2, . . . , 𝐷].(3) Selection Operation. Greedy search algorithm is adoptedfor selection operation to substitute the experimental vector
𝑢𝑖(𝑔 + 1) obtained from crossover operation and the targetvector 𝑥𝑖(𝑔) into the target function for comparison andoptimization selection. Its specific operations are as follows:
𝑥𝑖 (𝑔 + 1)
= {{{
𝑢𝑖 (𝑔 + 1) , if 𝑓 (𝑢𝑖 (𝑔 + 1)) < 𝑓 (𝑥𝑖 (𝑔))𝑥𝑖 (𝑔) , otherwise.
(7)
DE algorithm parameter search flow is shown in Figure 3.
4. Engineering Case
Dalian Baiyun Tunnel was built in 1984 and completedand put into use in 1986, and it belongs to a double-hole two-way four-lane tunnel, the west hole is 374 meterslong, and the east hole is 400 meters long. The tunnelbelongs to a straight wall lining structure. The tunnel isdesigned according to the principle of mining method, anda composite structure is adopted. Existing Baiyun Tunnel hasbeen operated for 30 years at present. Lining concrete suffersfrom serious aging and cracking phenomena. A new tunnelis excavated and constructed between two existing tunnelsaccording to the requirements of engineering construction.Existing Baiyun Tunnel is reinforced through injection of
6 Advances in Civil Engineering
(a)
H
I
GFEDC
B
A
(b)
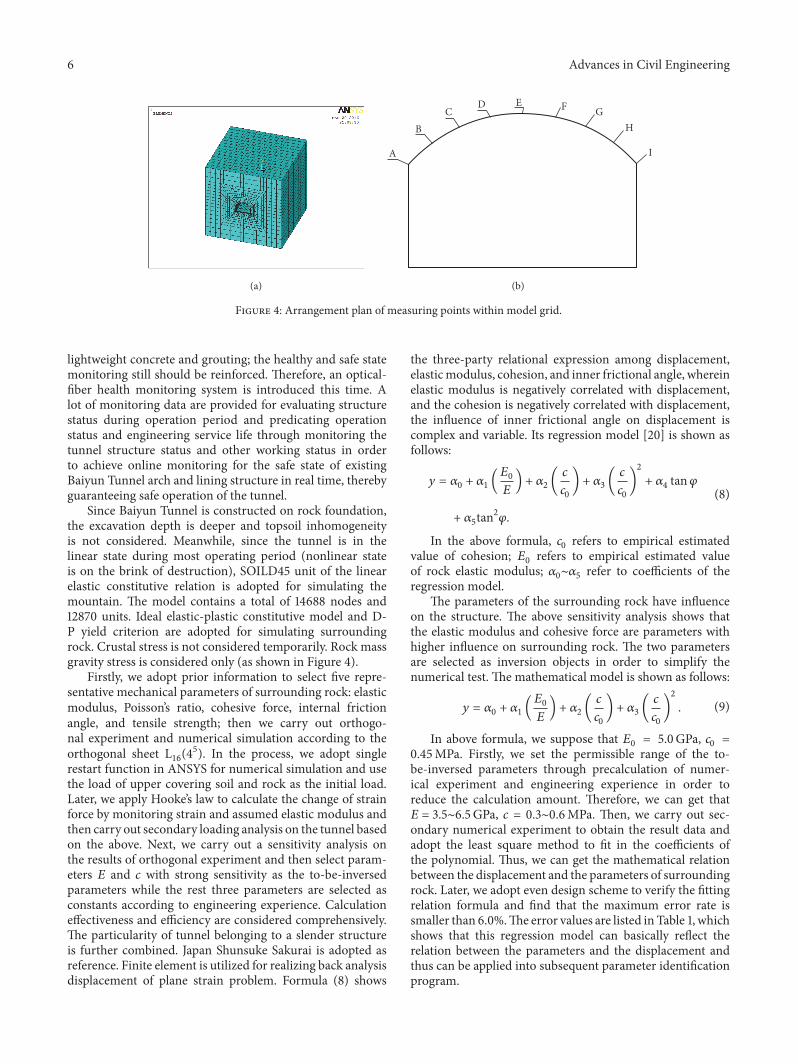
Figure 4: Arrangement plan of measuring points within model grid.
lightweight concrete and grouting; the healthy and safe statemonitoring still should be reinforced. Therefore, an optical-fiber health monitoring system is introduced this time. Alot of monitoring data are provided for evaluating structurestatus during operation period and predicating operationstatus and engineering service life through monitoring thetunnel structure status and other working status in orderto achieve online monitoring for the safe state of existingBaiyun Tunnel arch and lining structure in real time, therebyguaranteeing safe operation of the tunnel.
Since Baiyun Tunnel is constructed on rock foundation,the excavation depth is deeper and topsoil inhomogeneityis not considered. Meanwhile, since the tunnel is in thelinear state during most operating period (nonlinear stateis on the brink of destruction), SOILD45 unit of the linearelastic constitutive relation is adopted for simulating themountain. The model contains a total of 14688 nodes and12870 units. Ideal elastic-plastic constitutive model and D-P yield criterion are adopted for simulating surroundingrock. Crustal stress is not considered temporarily. Rock massgravity stress is considered only (as shown in Figure 4).
Firstly, we adopt prior information to select five repre-sentative mechanical parameters of surrounding rock: elasticmodulus, Poisson’s ratio, cohesive force, internal frictionangle, and tensile strength; then we carry out orthogo-nal experiment and numerical simulation according to theorthogonal sheet L16(4
5). In the process, we adopt singlerestart function in ANSYS for numerical simulation and usethe load of upper covering soil and rock as the initial load.Later, we apply Hooke’s law to calculate the change of strainforce by monitoring strain and assumed elastic modulus andthen carry out secondary loading analysis on the tunnel basedon the above. Next, we carry out a sensitivity analysis onthe results of orthogonal experiment and then select param-eters 𝐸 and 𝑐 with strong sensitivity as the to-be-inversedparameters while the rest three parameters are selected asconstants according to engineering experience. Calculationeffectiveness and efficiency are considered comprehensively.The particularity of tunnel belonging to a slender structureis further combined. Japan Shunsuke Sakurai is adopted asreference. Finite element is utilized for realizing back analysisdisplacement of plane strain problem. Formula (8) shows
the three-party relational expression among displacement,elasticmodulus, cohesion, and inner frictional angle, whereinelastic modulus is negatively correlated with displacement,and the cohesion is negatively correlated with displacement,the influence of inner frictional angle on displacement iscomplex and variable. Its regression model [20] is shown asfollows:
𝑦 = 𝛼0 + 𝛼1 (𝐸0𝐸 ) + 𝛼2 ( 𝑐
𝑐0) + 𝛼3 ( 𝑐𝑐0)2
+ 𝛼4 tan𝜑+ 𝛼5tan2𝜑.
(8)
In the above formula, 𝑐0 refers to empirical estimatedvalue of cohesion; 𝐸0 refers to empirical estimated valueof rock elastic modulus; 𝛼0∼𝛼5 refer to coefficients of theregression model.
The parameters of the surrounding rock have influenceon the structure. The above sensitivity analysis shows thatthe elastic modulus and cohesive force are parameters withhigher influence on surrounding rock. The two parametersare selected as inversion objects in order to simplify thenumerical test. The mathematical model is shown as follows:
𝑦 = 𝛼0 + 𝛼1 (𝐸0𝐸 ) + 𝛼2 ( 𝑐
𝑐0) + 𝛼3 ( 𝑐𝑐0)2
. (9)
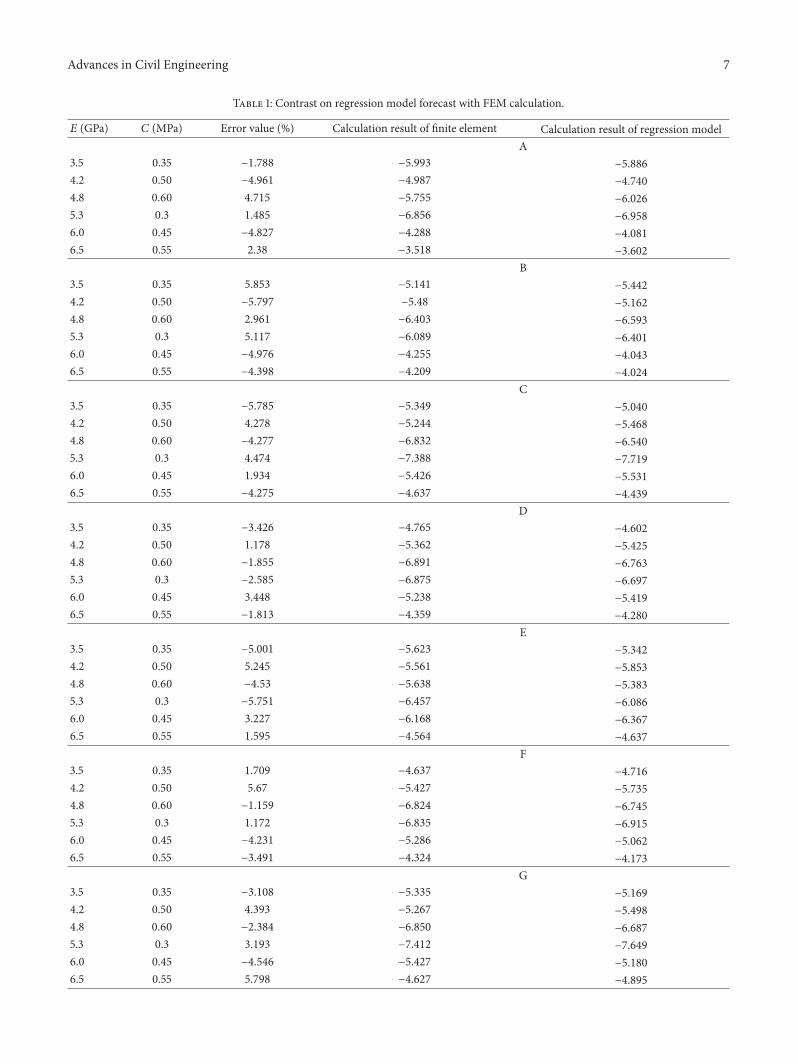
In above formula, we suppose that 𝐸0 = 5.0GPa, 𝑐0 =0.45MPa. Firstly, we set the permissible range of the to-be-inversed parameters through precalculation of numer-ical experiment and engineering experience in order toreduce the calculation amount. Therefore, we can get that𝐸 = 3.5∼6.5GPa, 𝑐 = 0.3∼0.6MPa. Then, we carry out sec-ondary numerical experiment to obtain the result data andadopt the least square method to fit in the coefficients ofthe polynomial. Thus, we can get the mathematical relationbetween the displacement and the parameters of surroundingrock. Later, we adopt even design scheme to verify the fittingrelation formula and find that the maximum error rate issmaller than 6.0%.The error values are listed in Table 1, whichshows that this regression model can basically reflect therelation between the parameters and the displacement andthus can be applied into subsequent parameter identificationprogram.
Advances in Civil Engineering 7
Table 1: Contrast on regression model forecast with FEM calculation.
𝐸 (GPa) 𝐶 (MPa) Error value (%) Calculation result of finite element Calculation result of regression modelA
3.5 0.35 −1.788 −5.993 −5.8864.2 0.50 −4.961 −4.987 −4.7404.8 0.60 4.715 −5.755 −6.0265.3 0.3 1.485 −6.856 −6.9586.0 0.45 −4.827 −4.288 −4.0816.5 0.55 2.38 −3.518 −3.602
B3.5 0.35 5.853 −5.141 −5.4424.2 0.50 −5.797 −5.48 −5.1624.8 0.60 2.961 −6.403 −6.5935.3 0.3 5.117 −6.089 −6.4016.0 0.45 −4.976 −4.255 −4.0436.5 0.55 −4.398 −4.209 −4.024
C3.5 0.35 −5.785 −5.349 −5.0404.2 0.50 4.278 −5.244 −5.4684.8 0.60 −4.277 −6.832 −6.5405.3 0.3 4.474 −7.388 −7.7196.0 0.45 1.934 −5.426 −5.5316.5 0.55 −4.275 −4.637 −4.439
D3.5 0.35 −3.426 −4.765 −4.6024.2 0.50 1.178 −5.362 −5.4254.8 0.60 −1.855 −6.891 −6.7635.3 0.3 −2.585 −6.875 −6.6976.0 0.45 3.448 −5.238 −5.4196.5 0.55 −1.813 −4.359 −4.280
E3.5 0.35 −5.001 −5.623 −5.3424.2 0.50 5.245 −5.561 −5.8534.8 0.60 −4.53 −5.638 −5.3835.3 0.3 −5.751 −6.457 −6.0866.0 0.45 3.227 −6.168 −6.3676.5 0.55 1.595 −4.564 −4.637
F3.5 0.35 1.709 −4.637 −4.7164.2 0.50 5.67 −5.427 −5.7354.8 0.60 −1.159 −6.824 −6.7455.3 0.3 1.172 −6.835 −6.9156.0 0.45 −4.231 −5.286 −5.0626.5 0.55 −3.491 −4.324 −4.173
G3.5 0.35 −3.108 −5.335 −5.1694.2 0.50 4.393 −5.267 −5.4984.8 0.60 −2.384 −6.850 −6.6875.3 0.3 3.193 −7.412 −7.6496.0 0.45 −4.546 −5.427 −5.1806.5 0.55 5.798 −4.627 −4.895
8 Advances in Civil Engineering
Table 1: Continued.
𝐸 (GPa) 𝐶 (MPa) Error value (%) Calculation result of finite element Calculation result of regression modelH
3.5 0.35 −5.578 −5.216 −4.9254.2 0.50 4.788 −5.452 −5.7134.8 0.60 1.23 −6.473 −6.5535.3 0.3 −2.907 −6.028 −5.8536.0 0.45 4.773 −4.243 −4.4466.5 0.55 −2.701 −4.242 −4.127
I3.5 0.35 −3.926 −5.914 −5.6824.2 0.50 3.748 −4.963 −5.1494.8 0.60 −5.586 −5.728 −5.4085.3 0.3 2.429 −6.893 −7.0606.0 0.45 4.786 −4.273 −4.4786.5 0.55 −4.768 −3.535 −3.366
0
20
40
60
80
100
120
Con
verg
ence
val
ue
500 1000 1500 2000 2500 3000 3500 4000 4500 50000Iteration steps
F = 0.9,CR = 0.8
F = 0.9,CR = 0.7
F = 0.9,CR = 0.6
F = 0.9,CR = 1.0F = 0.9,CR = 0.9
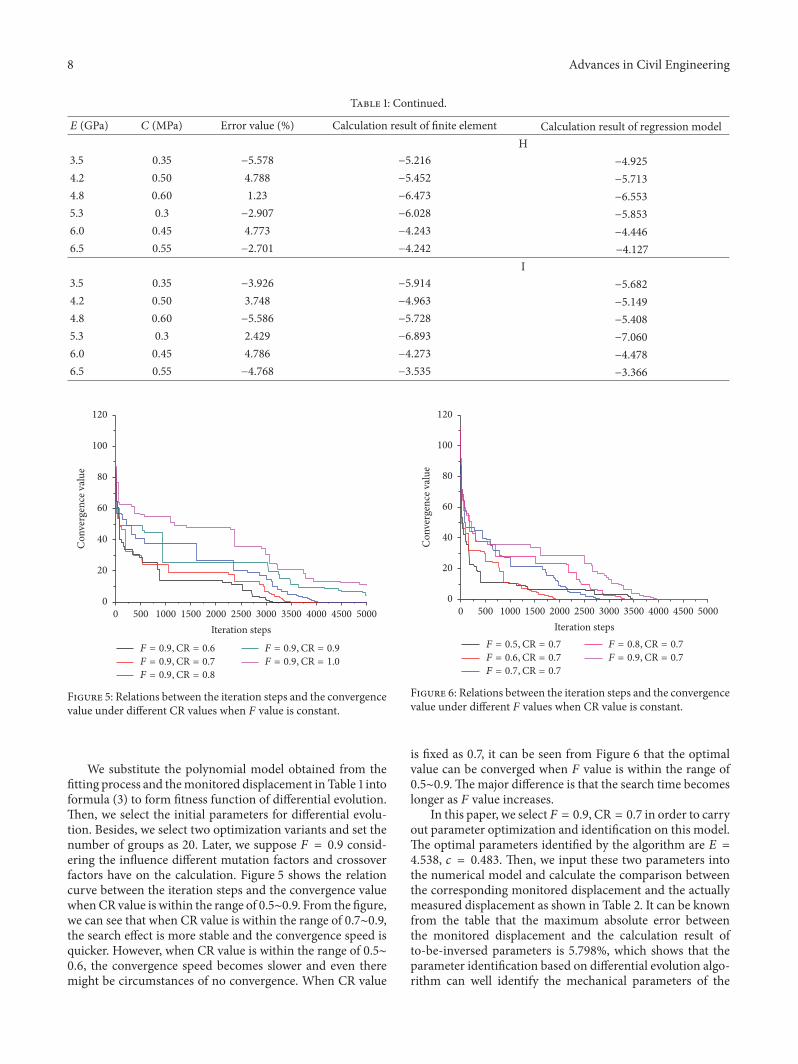
Figure 5: Relations between the iteration steps and the convergencevalue under different CR values when 𝐹 value is constant.
We substitute the polynomial model obtained from thefitting process and themonitored displacement in Table 1 intoformula (3) to form fitness function of differential evolution.Then, we select the initial parameters for differential evolu-tion. Besides, we select two optimization variants and set thenumber of groups as 20. Later, we suppose 𝐹 = 0.9 consid-ering the influence different mutation factors and crossoverfactors have on the calculation. Figure 5 shows the relationcurve between the iteration steps and the convergence valuewhenCR value is within the range of 0.5∼0.9. From the figure,we can see that when CR value is within the range of 0.7∼0.9,the search effect is more stable and the convergence speed isquicker. However, when CR value is within the range of 0.5∼0.6, the convergence speed becomes slower and even theremight be circumstances of no convergence. When CR value
0
20
40
60
80
100
120C
onve
rgen
ce v
alue
500 1000 1500 2000 2500 3000 3500 4000 4500 50000Iteration steps
F = 0.5,CR = 0.7F = 0.6,CR = 0.7
F = 0.8,CR = 0.7F = 0.9,CR = 0.7
F = 0.7,CR = 0.7
Figure 6: Relations between the iteration steps and the convergencevalue under different 𝐹 values when CR value is constant.
is fixed as 0.7, it can be seen from Figure 6 that the optimalvalue can be converged when 𝐹 value is within the range of0.5∼0.9.Themajor difference is that the search time becomeslonger as 𝐹 value increases.
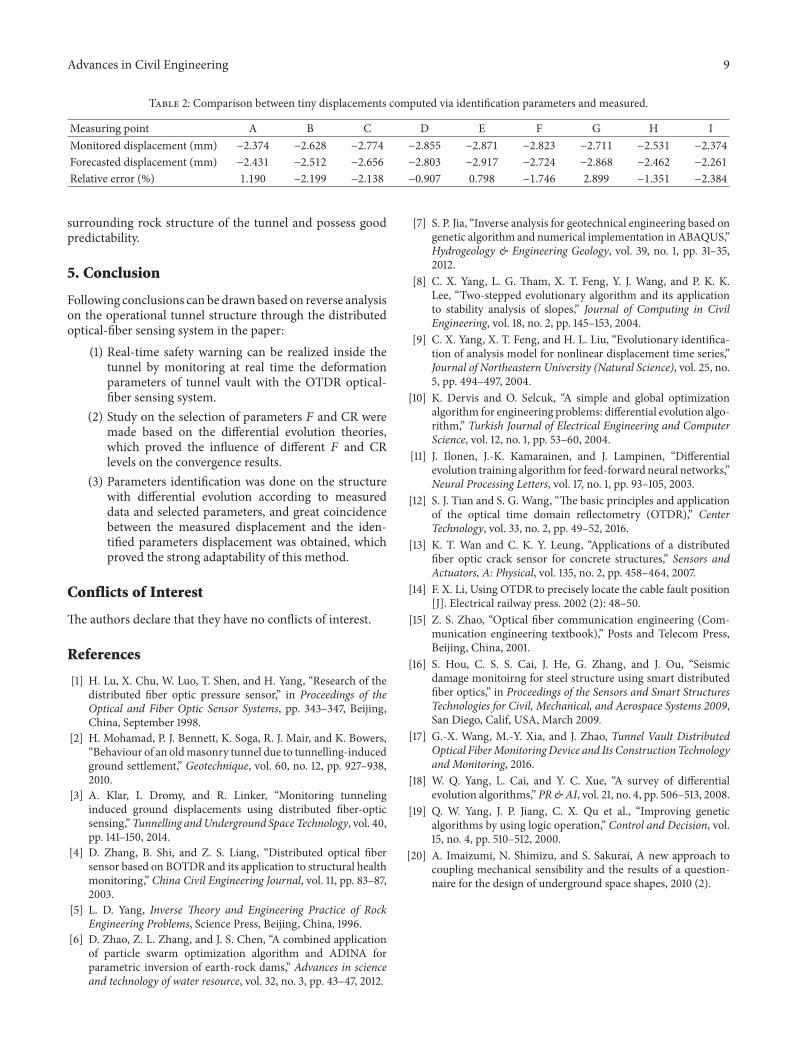
In this paper, we select𝐹 = 0.9, CR = 0.7 in order to carryout parameter optimization and identification on this model.The optimal parameters identified by the algorithm are 𝐸 =4.538, 𝑐 = 0.483. Then, we input these two parameters intothe numerical model and calculate the comparison betweenthe corresponding monitored displacement and the actuallymeasured displacement as shown in Table 2. It can be knownfrom the table that the maximum absolute error betweenthe monitored displacement and the calculation result ofto-be-inversed parameters is 5.798%, which shows that theparameter identification based on differential evolution algo-rithm can well identify the mechanical parameters of the
Advances in Civil Engineering 9
Table 2: Comparison between tiny displacements computed via identification parameters and measured.
Measuring point A B C D E F G H IMonitored displacement (mm) −2.374 −2.628 −2.774 −2.855 −2.871 −2.823 −2.711 −2.531 −2.374Forecasted displacement (mm) −2.431 −2.512 −2.656 −2.803 −2.917 −2.724 −2.868 −2.462 −2.261Relative error (%) 1.190 −2.199 −2.138 −0.907 0.798 −1.746 2.899 −1.351 −2.384
surrounding rock structure of the tunnel and possess goodpredictability.
5. Conclusion
Following conclusions can be drawnbased on reverse analysison the operational tunnel structure through the distributedoptical-fiber sensing system in the paper:
(1) Real-time safety warning can be realized inside thetunnel by monitoring at real time the deformationparameters of tunnel vault with the OTDR optical-fiber sensing system.
(2) Study on the selection of parameters 𝐹 and CR weremade based on the differential evolution theories,which proved the influence of different 𝐹 and CRlevels on the convergence results.
(3) Parameters identification was done on the structurewith differential evolution according to measureddata and selected parameters, and great coincidencebetween the measured displacement and the iden-tified parameters displacement was obtained, whichproved the strong adaptability of this method.
Conflicts of Interest
The authors declare that they have no conflicts of interest.
References
[1] H. Lu, X. Chu, W. Luo, T. Shen, and H. Yang, “Research of thedistributed fiber optic pressure sensor,” in Proceedings of theOptical and Fiber Optic Sensor Systems, pp. 343–347, Beijing,China, September 1998.
[2] H. Mohamad, P. J. Bennett, K. Soga, R. J. Mair, and K. Bowers,“Behaviour of an oldmasonry tunnel due to tunnelling-inducedground settlement,” Geotechnique, vol. 60, no. 12, pp. 927–938,2010.
[3] A. Klar, I. Dromy, and R. Linker, “Monitoring tunnelinginduced ground displacements using distributed fiber-opticsensing,”Tunnelling andUnderground Space Technology, vol. 40,pp. 141–150, 2014.
[4] D. Zhang, B. Shi, and Z. S. Liang, “Distributed optical fibersensor based on BOTDR and its application to structural healthmonitoring,” China Civil Engineering Journal, vol. 11, pp. 83–87,2003.
[5] L. D. Yang, Inverse Theory and Engineering Practice of RockEngineering Problems, Science Press, Beijing, China, 1996.
[6] D. Zhao, Z. L. Zhang, and J. S. Chen, “A combined applicationof particle swarm optimization algorithm and ADINA forparametric inversion of earth-rock dams,” Advances in scienceand technology of water resource, vol. 32, no. 3, pp. 43–47, 2012.
[7] S. P. Jia, “Inverse analysis for geotechnical engineering based ongenetic algorithm and numerical implementation in ABAQUS,”Hydrogeology & Engineering Geology, vol. 39, no. 1, pp. 31–35,2012.
[8] C. X. Yang, L. G. Tham, X. T. Feng, Y. J. Wang, and P. K. K.Lee, “Two-stepped evolutionary algorithm and its applicationto stability analysis of slopes,” Journal of Computing in CivilEngineering, vol. 18, no. 2, pp. 145–153, 2004.
[9] C. X. Yang, X. T. Feng, and H. L. Liu, “Evolutionary identifica-tion of analysis model for nonlinear displacement time series,”Journal of Northeastern University (Natural Science), vol. 25, no.5, pp. 494–497, 2004.
[10] K. Dervis and O. Selcuk, “A simple and global optimizationalgorithm for engineering problems: differential evolution algo-rithm,” Turkish Journal of Electrical Engineering and ComputerScience, vol. 12, no. 1, pp. 53–60, 2004.
[11] J. Ilonen, J.-K. Kamarainen, and J. Lampinen, “Differentialevolution training algorithm for feed-forward neural networks,”Neural Processing Letters, vol. 17, no. 1, pp. 93–105, 2003.
[12] S. J. Tian and S. G. Wang, “The basic principles and applicationof the optical time domain reflectometry (OTDR),” CenterTechnology, vol. 33, no. 2, pp. 49–52, 2016.
[13] K. T. Wan and C. K. Y. Leung, “Applications of a distributedfiber optic crack sensor for concrete structures,” Sensors andActuators, A: Physical, vol. 135, no. 2, pp. 458–464, 2007.
[14] F. X. Li, Using OTDR to precisely locate the cable fault position[J]. Electrical railway press. 2002 (2): 48–50.
[15] Z. S. Zhao, “Optical fiber communication engineering (Com-munication engineering textbook),” Posts and Telecom Press,Beijing, China, 2001.
[16] S. Hou, C. S. S. Cai, J. He, G. Zhang, and J. Ou, “Seismicdamage monitoirng for steel structure using smart distributedfiber optics,” in Proceedings of the Sensors and Smart StructuresTechnologies for Civil, Mechanical, and Aerospace Systems 2009,San Diego, Calif, USA, March 2009.
[17] G.-X. Wang, M.-Y. Xia, and J. Zhao, Tunnel Vault DistributedOptical FiberMonitoringDevice and Its Construction Technologyand Monitoring, 2016.
[18] W. Q. Yang, L. Cai, and Y. C. Xue, “A survey of differentialevolution algorithms,” PR&AI, vol. 21, no. 4, pp. 506–513, 2008.
[19] Q. W. Yang, J. P. Jiang, C. X. Qu et al., “Improving geneticalgorithms by using logic operation,” Control and Decision, vol.15, no. 4, pp. 510–512, 2000.
[20] A. Imaizumi, N. Shimizu, and S. Sakurai, A new approach tocoupling mechanical sensibility and the results of a question-naire for the design of underground space shapes, 2010 (2).

RoboticsJournal of
Hindawi Publishing Corporationhttp://www.hindawi.com Volume 2014
Hindawi Publishing Corporationhttp://www.hindawi.com Volume 2014
Active and Passive Electronic Components
Control Scienceand Engineering
Journal of
Hindawi Publishing Corporationhttp://www.hindawi.com Volume 2014
International Journal of
RotatingMachinery
Hindawi Publishing Corporationhttp://www.hindawi.com Volume 2014
Hindawi Publishing Corporation http://www.hindawi.com
Journal of
Volume 201
Submit your manuscripts athttps://www.hindawi.com
VLSI Design
Hindawi Publishing Corporationhttp://www.hindawi.com Volume 201
Hindawi Publishing Corporationhttp://www.hindawi.com Volume 2014
Shock and Vibration
Hindawi Publishing Corporationhttp://www.hindawi.com Volume 2014
Civil EngineeringAdvances in
Acoustics and VibrationAdvances in
Hindawi Publishing Corporationhttp://www.hindawi.com Volume 2014
Hindawi Publishing Corporationhttp://www.hindawi.com Volume 2014
Electrical and Computer Engineering
Journal of
Advances inOptoElectronics
Hindawi Publishing Corporation http://www.hindawi.com
Volume 2014
The Scientific World JournalHindawi Publishing Corporation http://www.hindawi.com Volume 2014
SensorsJournal of
Hindawi Publishing Corporationhttp://www.hindawi.com Volume 2014
Modelling & Simulation in EngineeringHindawi Publishing Corporation http://www.hindawi.com Volume 2014
Hindawi Publishing Corporationhttp://www.hindawi.com Volume 2014
Chemical EngineeringInternational Journal of Antennas and
Propagation
International Journal of
Hindawi Publishing Corporationhttp://www.hindawi.com Volume 2014
Hindawi Publishing Corporationhttp://www.hindawi.com Volume 2014
Navigation and Observation
International Journal of
Hindawi Publishing Corporationhttp://www.hindawi.com Volume 2014
DistributedSensor Networks
International Journal of
Recommended