Introduction to the Impact Assessment Process
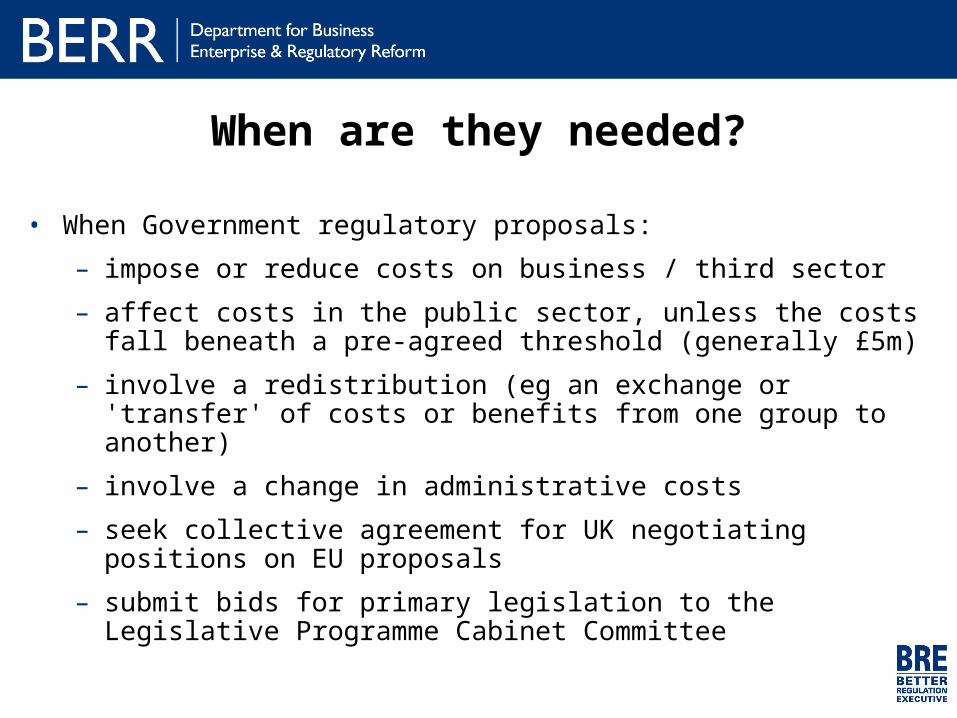
• When Government regulatory proposals:
– impose or reduce costs on business / third sector
– affect costs in the public sector, unless the costs fall beneath a pre-agreed threshold (generally £5m)
– involve a redistribution (eg an exchange or 'transfer' of costs or benefits from one group to another)
– involve a change in administrative costs
– seek collective agreement for UK negotiating positions on EU proposals
– submit bids for primary legislation to the Legislative Programme Cabinet Committee
When are they needed?

• where policy changes will not lead to costs or savings for business, the public sector, third sector organisations, regulators or consumers
• for road closure orders
• where changes to statutory fees or taxes are covered by a predetermined formula such as the rate of inflation, or in respect of other changes to taxes or tax rates where there are no associated administrative costs or savings.
But not ….

Is this a new thing?
• Absolutely not.
– Cost Compliance Assessments since the late 1980s
– Regulatory Impact Assessments required since mid 1990s
– Impact Assessment with fixed format introduced in 2007
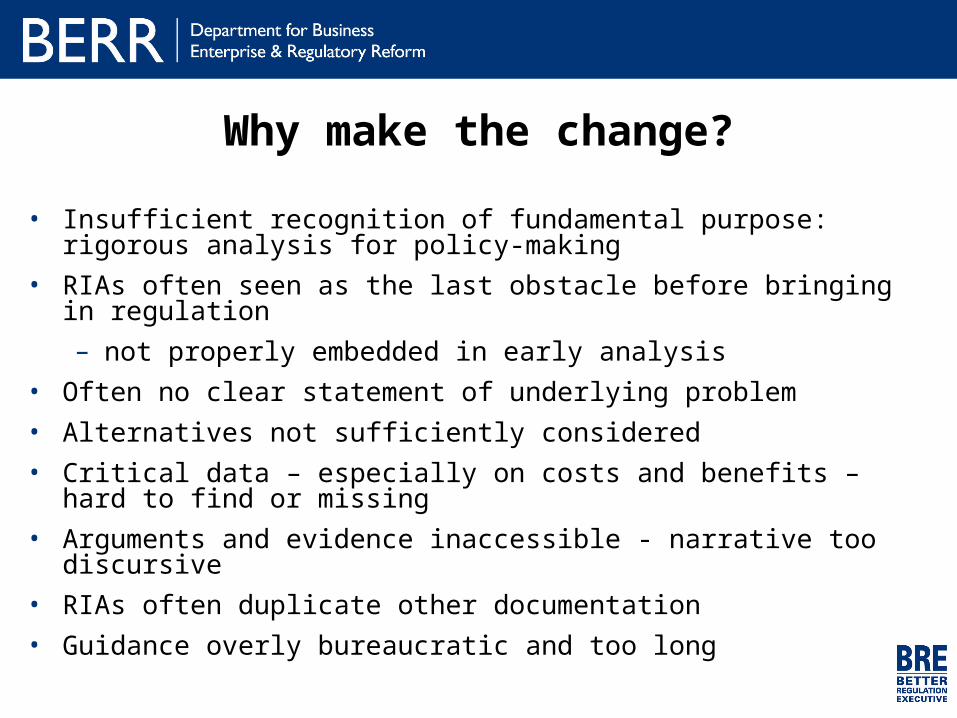
Why make the change?
• Insufficient recognition of fundamental purpose: rigorous analysis for policy-making
• RIAs often seen as the last obstacle before bringing in regulation
– not properly embedded in early analysis
• Often no clear statement of underlying problem
• Alternatives not sufficiently considered
• Critical data – especially on costs and benefits – hard to find or missing
• Arguments and evidence inaccessible - narrative too discursive
• RIAs often duplicate other documentation
• Guidance overly bureaucratic and too long
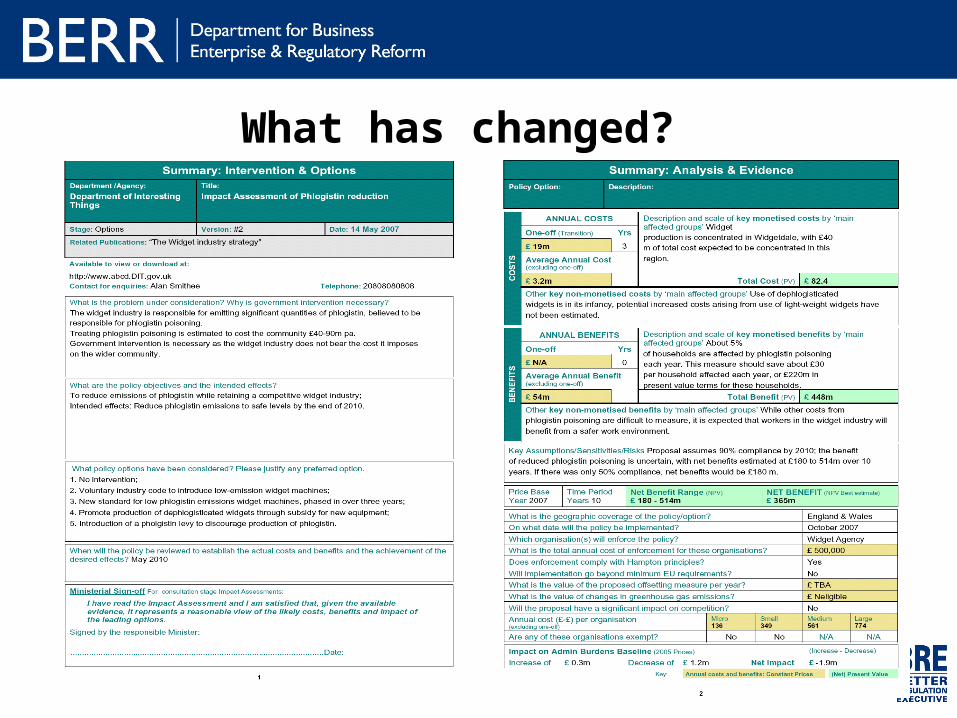
What has changed?

• Improved quality of economic and other analysis that underpins policy-making
– Sharpened focus on policy rationale
– More prominence given to costs and benefits
– Stronger commitment to specify ex post review date
– Integrated with the Standard Cost Model
– Integrated approach maintained – Specific Impact Tests
• Increase transparency of analysis
– Fixed template
– Improved Ministerial Declaration
– Impact assessment part of consultation and final policy decision
• Embed impact assessments at the heart of policy-making
What has changed?
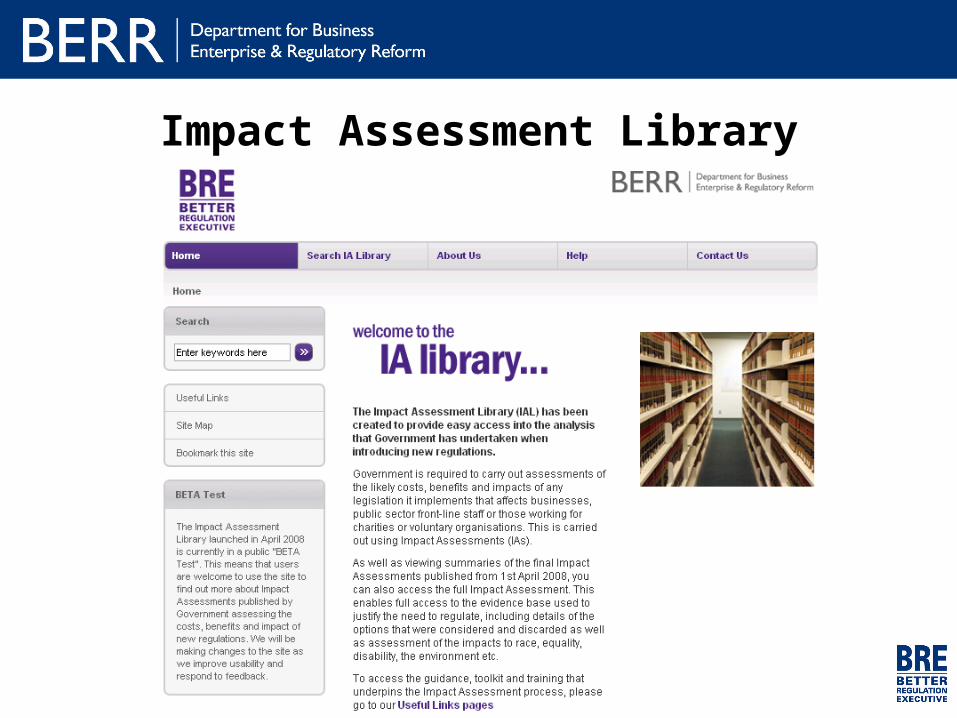
Impact Assessment Library
Where you can find more information
• IA Guidance: http://www.berr.gov.uk/files/file44544.pdf
• IA Toolkit: http://www.berr.gov.uk/bre/policy/scrutinising-new-regulations/preparing-impact-assessments/toolkit/page44199.html
• IA online Training: http://www.iatraining.berr.gov.uk
• Treasury Greenbook: http://greenbook.treasury.gov.uk

Measuring administrative burdens, UK outcomes and next steps

Headlines Measurement and simplification planning
exercises between May 2005 and Dec 2006 Simplification plans and measurement results
published in December 2006, 2007 and 2008 Plans published for 19 departments Over 500 simplification measures identified
delivering an estimated £3.4bn of savings by May 2010
240 simplification measures implemented reducing admin burdens, savings business and third sector organisations an estimated £1.9bn each year
Context
Well developed better regulation agenda but no specific focus on administrative burdens
BRTF report “Less is More” stated ‘what gets measured gets done’
Politically driven timescales – one year from start to finish
3 exercises covering Tax and customs, Financial services and the rest of government, but led centrally
Limited information at start – number of regulations, populations, etc

Key points about the Standard Cost Model
Simple, pragmatic framework for measuring costs
Indicative - not statistically representative
Means to an end: aim is reductions in burdens
Provides consistent baseline for setting targets
Rapidly growing international use, including EU and OECD, and effective SCM network

Main measurement exercise: approach
Departments identified regulations summer 2005
Central procurement exercise - PwC appointed September 2005
Mobilisation and mapping (legal and process) September to November 2005
Fieldwork between October 2005 and April 2006
Departmental reports with measurement outcomes April to July 2006
A sense of scale…
20,000 Information Obligations measured
Over 90% of baseline (by cost) measured by direct engagement with business
Over 75% through engagement with small & medium sized enterprises
Over 8,500 interviews and over 200 expert panels
At peak over 700 PwC people, over 300 in departments and up to 23 in BRE team

Lessons learnt
More time for preparatory work Better departmental buy-in from outset at top level More prioritisation and be realistic Strong project and resource planning Manage departments’ expectations of the extent
of their involvement Allow time to sanity check numbers before they go
anywhere Support of business stakeholders is essential
Business As Usual Adjustments
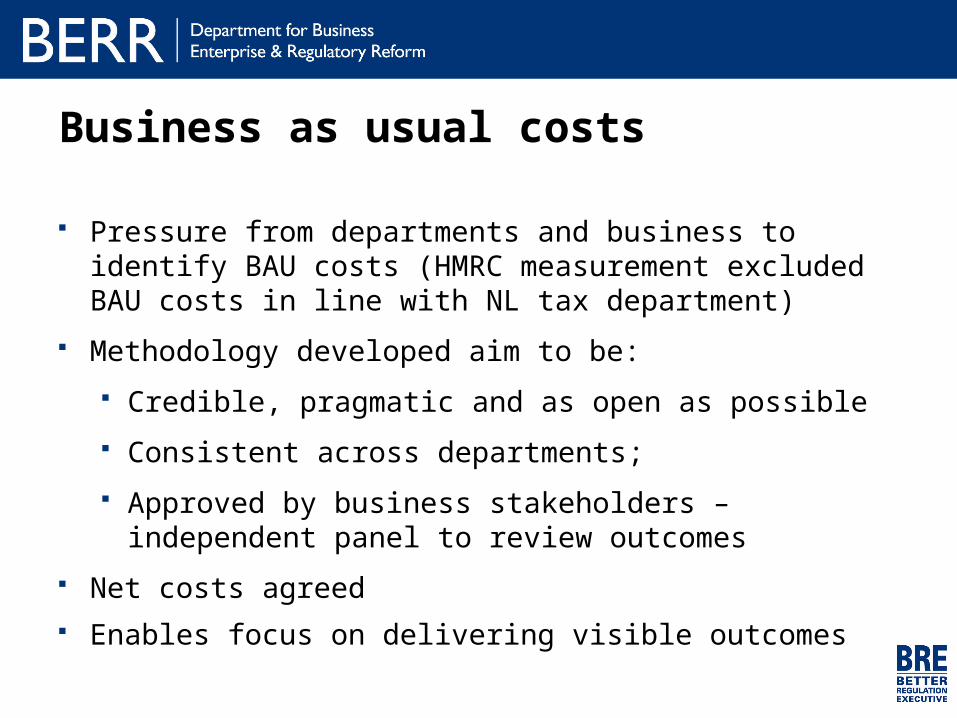
Business as usual costs
Pressure from departments and business to identify BAU costs (HMRC measurement excluded BAU costs in line with NL tax department)
Methodology developed aim to be:
Credible, pragmatic and as open as possible
Consistent across departments;
Approved by business stakeholders – independent panel to review outcomes
Net costs agreed Enables focus on delivering visible outcomes
Summary of UK Administrative Burden
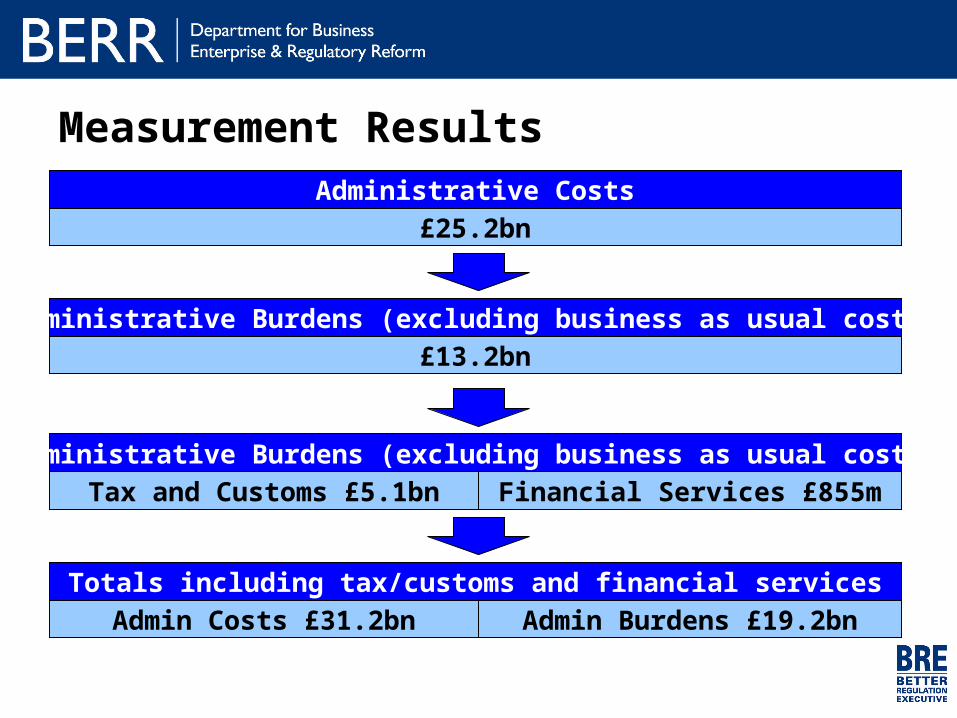
Administrative Costs
£25.2bn
Administrative Burdens (excluding business as usual costs)
£13.2bn
Administrative Burdens (excluding business as usual costs)
Tax and Customs £5.1bn Financial Services £855m
Totals including tax/customs and financial services
Admin Costs £31.2bn Admin Burdens £19.2bn
Measurement Results
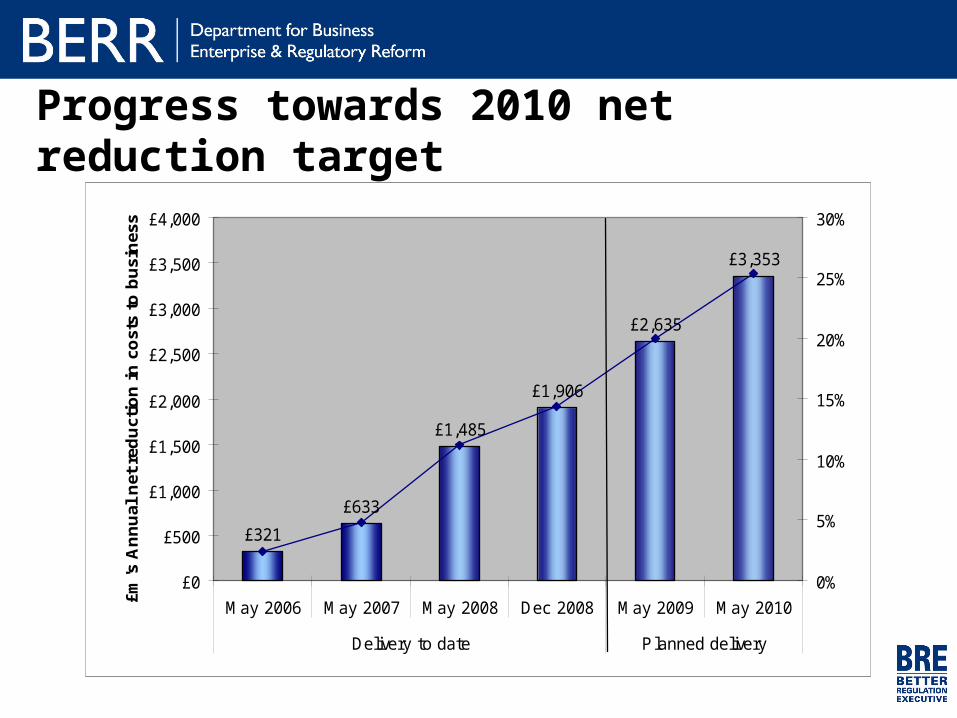
Progress towards 2010 net reduction target
£321
£633
£1,485
£1,906
£2,635
£3,353
£0
£500
£1,000
£1,500
£2,000
£2,500
£3,000
£3,500
£4,000
May 2006 May 2007 May 2008 Dec 2008 May 2009 May 2010
Delivery to date Planned delivery
£m's
An
nu
al n
et r
edu
ctio
n i
n c
ost
s to
bu
sin
ess
0%
5%
10%
15%
20%
25%
30%
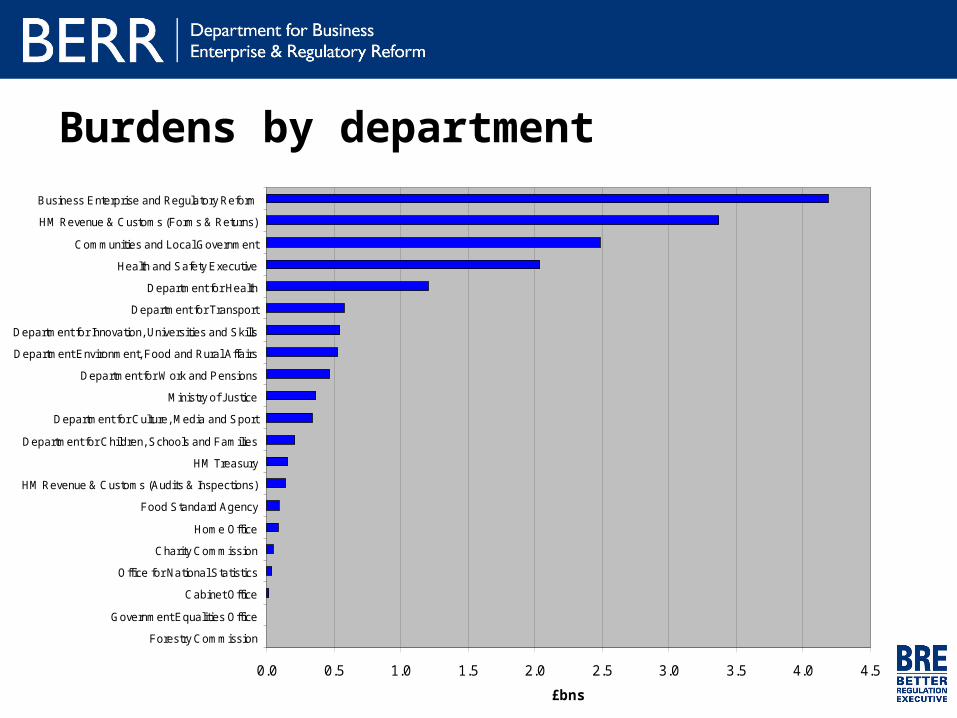
Burdens by department
0.0 0.5 1.0 1.5 2.0 2.5 3.0 3.5 4.0 4.5
Forestry Commission
Government Equalities Office
Cabinet Office
Office for National Statistics
Charity Commission
Home Office
Food Standard Agency
HM Revenue & Customs (Audits & Inspections)
HM Treasury
Department for Children, Schools and Families
Department for Culture, Media and Sport
Ministry of Justice
Department for Work and Pensions
Department Environment, Food and Rural Affairs
Department for Innovation, Universities and Skills
Department for Transport
Department for Health
Health and Safety Executive
Communities and Local Government
HM Revenue & Customs (Forms & Returns)
Business Enterprise and Regulatory Reform
£bns
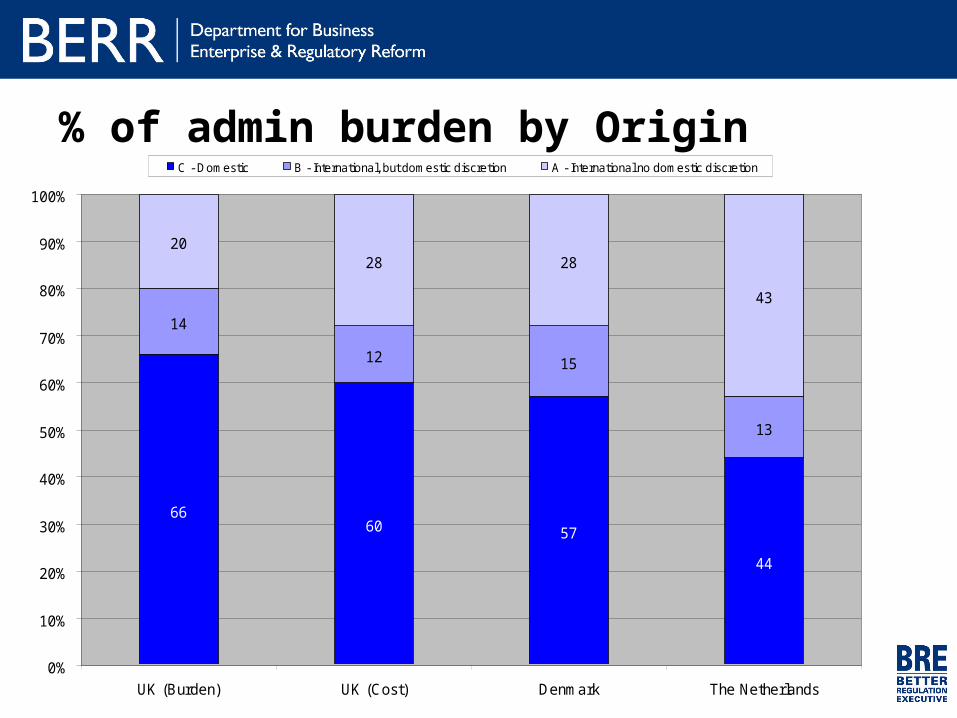
% of admin burden by Origin
6660 57
44
14
12 15
13
2028 28
43
0%
10%
20%
30%
40%
50%
60%
70%
80%
90%
100%
UK (Burden) UK (Cost) Denmark The Netherlands
C - Domestic B - International, but domestic discretion A - International no domestic discretion

Department Regulation IO Description Admin Burden
Communities and Local Government
Town and Country Planning Act 1990
Application for planning permission
£1,110 million
Health and Safety Executive
Management of Health & Safety at Work Regulations
1999Risk assessment £600 million
Business, Enterprise and
Regulatory ReformEmployment Rights Act 1996
Written statement of employment
£586 million
Business, Enterprise and
Regulatory Reform
Consumer Protection Act 1987
Provision of safety information
£443 million
Health and Safety Executive
Gas Safety (Installation and Use) Regulations 1998
Gas safety checks £237 million
Department of Health
Medicines for Human Use (Marketing Authorisations
Etc.) Regulations 1994
Authorisation for marketing of
medicines£208 million
Communities and Local Government
Housing Act 1985Houses in multiple
occupation£207 million
Biggest information obligations

Type of information obligation
% of Baseline
0% 5% 10% 15% 20% 25% 30% 35%
Requesting information
Agreeing contracts
Carrying documentation
Framing complaints and appeals
Entry in a register
Updating commercial emergency plans & programmes
Carrying out inspections of…
Applications for subsidies or grants for…
Cooperating with audits/inspections of…
Applications for authorisation
Notification of activities
Statutory labelling for the third parties
Returns and reports
Applications for permission for or exemption from…
Keeping records
Providing statutory information for third parties
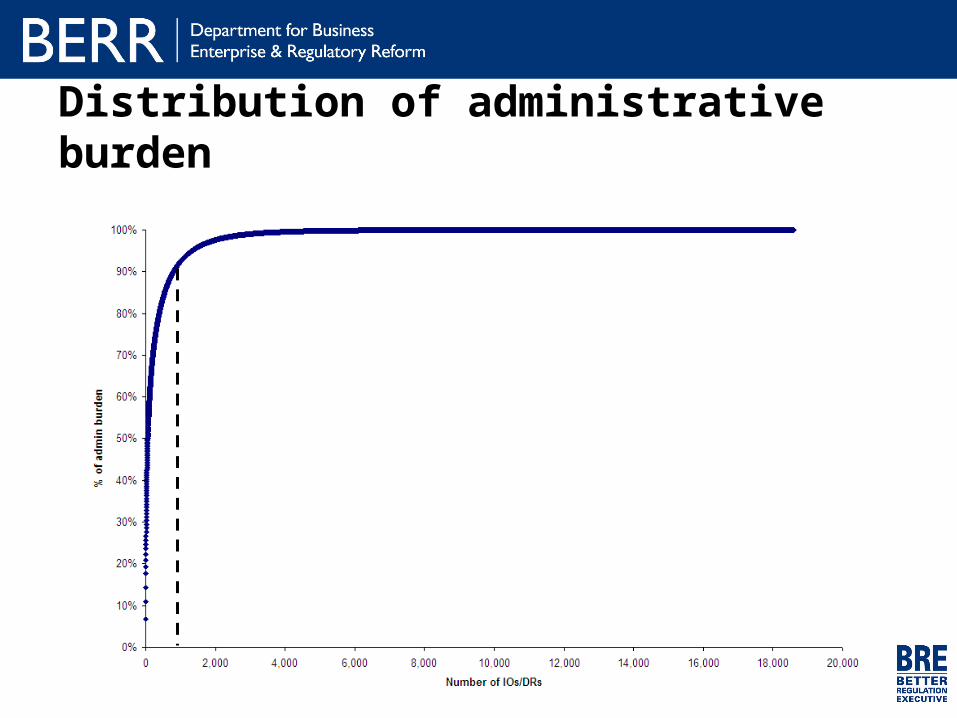
Distribution of administrative burden

And after initial measurement…
The next challenge…
Measuring administrative burden of new regulations
Identify further simplification measures
Both are crucial to ensure that net reduction targets are meet

Measurement approaches
High cost / high profile / high irritants Use approaches developed by PwC including:
Interviews with business (face-to-face or telephone)
Expert Panels
Low cost / low profile / low irritants Use Admin Burdens Calculator
Identify similar regulations / obligations as a basis for modelling
Guidance
Simplification Guidance & checklist for departments
Training
Facilitated sessions for Better Regulation Units and economists
On-line training for policy officials etc.
Tools
Admin Burdens Calculator and Database
Spreadsheet
UK Framework
Simplification Plans
Simplification Plans• An annual insight into individual Departments’ efforts/
work to reduce administrative and policy costs and to address main regulatory irritants:
- Covering:
Business with a dedicated strategy for Small Firms,
Third sector organisations
Public sector’s front line workers (since June 2007)
- Focusing on three main areas: Whether simplifications measures that have been
implemented delivered planned reductions Further quantification for simplification measures yet to be
implemented New simplifications measures to meet reduction targets

Targets, reductions identified and delivered
-100%
-80%
-60%
-40%
-20%
0%
20%
40%
60%
80%
BE
RR
Ca
bin
et
Off
ice
Ch
ari
ty C
om
mis
sio
n
CL
G
DC
MS
DC
SF
DE
CC
DE
FR
A
DfT
DH
DIU
S
DW
P
Fo
res
try
Co
mm
iss
ion
FS
A
GE
O
HM
Tre
as
ury
Ho
me
Off
ice
HS
E
Mo
J
ON
S
% R
ed
uti
on
by
20
10
% reduction identified
Target
Net savings delivered to date(Dec 08)

Validating achievements
Making sure savings are felt by business
• External Validation Panel
– Members: representatives of key business organisations (British Chambers of Commerce, Confederation of British Industry, Federation of Small Businesses, Institute of Directors and the Trades Union Congress)
– Role: review and challenge the assumptions underpinning the top administrative burden reductions Departments have implemented from May 2005 to May 2008
– Outcome: An estimated £1.5bn of gross simplifications approved

Examples of simplifications

Improvements to Employment Guidance (BERR)
The Employment Guidance Programme was established to reduce the administrative burdens imposed by employment law, improve peoples perceptions and drive wider business cultural change around compliance.
The programme has produced and promoted free to use and legally compliant online tools, proforma letters and agreement forms, accessible through the BusinessLink website.
Independent research shows that peoples perceptions are changing with the introduction of these tools.
£418 million of annual net savings have also been achieved by December 2008
Fewer Annual General Meetings for private companies (BERR)
Company Law has been substantially rewritten to make it easier for the UK’s one million companies to understand, and more flexible for them to manage, especially for small businesses.
The changes have removed a number of outdated and often archaic rules such as the need to hold an AGM and the need for paper-based communication with shareholders.
The new Companies Act also brings together measures from many separate pieces of legislation in to a single place and introduces easier and cheaper forms of decision-making for companies
By simplifying company law and making it easier to understand, companies over time should be easier to manage and businesses.
500 – 750,000 private companies no longer need to hold an annual general meeting (AGM) delivering £45m annual savings delivered.
Around 60,000 private companies no longer need to appoint a company secretary, saving £50 – £100 per business each a year.
Sensible Risk Management– Risk Assessments (HSE)
Small businesses often find it difficult to work out what health and safety rules mean for their workplace, and are unsure where to go for advice on developing a health and safety plan.
The Health and Safety Executive have published guidance on how to complete a health and safety risk assessment in one place at www.hse.gov.uk/risk. The site tells them what the key risks are for their industry, what practical measures they need to have in place, and has examples on what ‘good enough’ looks like for their industry.
Convenience stores, estate agencies, dry cleaners, and hairdressing salons are among the 18 sector-specific businesses that can now benefit from these example risk assessments. This means lower risk businesses will spend significantly less time completing their assessments as a result.
£182 million of annual net savings have been achieved by December 2008
Electronic Planning Applications (CLG)
Inconsistencies and over-regulation in the planning system have long been an irritant for business. Changes have been introduced to provide a faster, more efficient planning system with less red tape.
One example is that planning applications can now be submitted electronically, using a single national application form. This makes the process for obtaining planning consents simpler and more consistent across all local authority areas, and gives businesses greater certainty for planning and fewer administration costs.
Greater consistency is also being achieved through access to better information and clearer criteria on what is needed for applications.
£120 million of annual net savings have been achieved by December 2008

Where you can find more information
BRE site: www.berr.gov.uk/bre
Admin Burdens Calculator: https://www.abcalculator.berr.gov.uk
SCM Training: www.scmtraining.berr.gov.uk
International SCM Network site: www.administrative-burdens.com
HMRC report: http://www.hmrc.gov.uk/news/admin-burdens.pdf
Portal: www.betterregulation.gov.uk

Mark Hammond
Better Regulation Executive,
Department for Business, Enterprise and Regulatory Reform
1 Victoria Street,
London, SW1H 0ET
+44 20 7215 0339
Any questions?
Recommended


