Proceeding of the 1st International Conference
Public Transport &
Smart Mobility
Innovative Solutions for
Smart Urban Mobility
Zagreb, Croatia, 27th November, 2020
Faculty of Transport and Traffic
Department of Urban Transport
Sciences


Innovative Solutions for
Smart Urban Mobility
www.fpz.unizg.hr/ptsm/
Public Transport & Smart Mobility 2020
Proceedings of the 1st International Conference
DOI: https://doi.org/10.7307/ptsm.2020
Editors Ljupko Šimunović
Marko Slavulj Mario Ćosić
Publisher University of Zagreb Faculty of Transport and Traffic Sciences
Design Matija Sikirić
Technical support Marko Slavulj Matija Sikirić
Printed by University of Zagreb Faculty of Transport and Traffic Sciences
Place and year Zagreb, 2021
ISBN: 978-953-243-121-6


1st International Conference Public Transport & Smart Mobility
Word of the Conference Director
Marko Slavulj
Assistant Professor, PhD, Faculty of Transport and Traffic Sciences
University of Zagreb, Conference Director
On November 27, 2020, the 1st international conference "Public Transport & Smart
Mobility (PTSM 2020) - Innovative solutions for smart urban mobility" was held
through the online platform, organized by the Department of Urban Transport,
Faculty of Transport Sciences.
The conference was divided into two parts. The first part focused on works in the
thematic area of smart mobility, while the second was on the thematic area of
public transport.
A total of 11 papers were presented, which will be published in the Proceedings of
the conference "1st International Conference Public Transport & Smart Mobility
2020: Innovative solutions for smart urban mobility".
The organizers of the Conference express their thanks to all Businesses and
Institutions, which support this Conference. Special thanks to network CIVINET
Slovenia-Croatia-South East Europe.
The Editors commends all authors for excellent papers contributed to these
Proceedings, and wishes to thank members of International Program Committee
and Organizing Committee.

1st International Conference Public Transport & Smart Mobility
Content
COMMITTEES
1 Program Committee
2 Organizing Committee
2 Technical Committee
PUBLIC TRANSPORT
4 INCREASING THE MOBILITY OF UNIVERSITY NORTH STUDENTS BY IMPROVING THE RAILWAY INFRASTRUCTURE: CASE STUDY ON THE VARAŽDIN-KOPRIVNICA ROUTE Predrag Brlek, Krešimir Grđan, Ljudevit Krpan, Ivan Cvitković
14 ANALYSIS OF PUBLIC TRANSPORT DEMAND IN THE MUNICIPALITY OF STUPNIK Ljupko Šimunović, Marko Slavulj, Mario Ćosić, Matija Sikirić
25 ANALYSIS OF THE CURRENT STATE OF PUBLIC PASSENGER TRANSPORT IN THE AREA OF DUBROVNIK Davor Brčić, Božo Radulović
33 ANALYSIS OF PARAMETERS FOR VEHICLES M2 AND M3 CATEGORY – CASE STUDY REPUBLIC OF CROATIA Marko Slavulj, Julijan Jurak, Marko Emanović, Matija Sikirić
39 ANALYSIS OF LOCAL PUBLIC TRANSPORT FOR PASSENGERS IN THE CITY OF VELIKA GORICA Luka Vidan, Marko Slavulj, Dino Šoajt
SMART MOBILITY
51 SUSTAINABLE URBAN MOBILITY BOOST SMART TOOLBOX Marko Šoštarić, Marijan Jakovljević, Orsat Lale, Krešimir Vidović, Saša Vojvodić
56 AN IMPLEMENTATION FRAMEWORK FOR DEVELOPING CITIES – THE WAY TO SMART MOBILITY Beti Angelevska, Vaska Atanasova

1st International Conference Public Transport & Smart Mobility
63
CAFE REGULATIONS AND THE OVERVIEW OF THE PASSENGER CAR MARKET WITHIN THE EUROPEAN UNION Luka Međurečan, Matija Sikirić
73
USE OF TECHNOLOGY IN IMPROVING URBAN TRANSPORT Iva Toš
80 THE IMPACT OF TELEMATICS ON TRAFFIC SAFETY Igor Jelić, Maja Balenović
87 CAR SHARING INTEGRATION IN THE CITY OF MILAN Ivana Krijan

1st International Conference Public Transport & Smart Mobility
1
Committees
PROGRAM COMMITTEE
Marko Slavulj University of Zagreb, Faculty of Transport and Traffic Sciences, Zagreb, Croatia
Nebojša Bojović University of Belgrade, Faculty of Transport and Traffic Engineering, Belgrade, Serbia
Ljupko Šimunović University of Zagreb, Faculty of Transport and Traffic Sciences, Zagreb, Croatia
Dalibor Pešić University of Belgrade, Faculty of Transport and Traffic Engineering, Belgrade, Serbia
Davor Brčić University of Zagreb, Faculty of Transport and Traffic Sciences, Zagreb, Croatia
Vaska Atanasova St. Climent Ohridski University, Faculty of Technical Science, Bitola, Republic of North Macedonia
Marko Šoštarić University of Zagreb, Faculty of Transport and Traffic Sciences, Zagreb, Croatia
Vuk Bogdanović University of Novi Sad, Faculty of Technical Sciences, Novi Sad, Serbia
Mario Ćosić University of Zagreb, Faculty of Transport and Traffic Sciences, Zagreb, Croatia
Valentina Mirović University of Novi Sad, Faculty of Technical Sciences, Novi Sad, Serbia
Adam Torok Budapest University of Technology and Economics, Department of Transport Technolgy and Transport, Hungary
Pavle Gladović University of Novi Sad, Faculty of Technical Sciences, Novi Sad, Serbia
André Bruns University of Applied Sciences, Wiesbaden Rüsselsheim, Germany
Bojan Marić University of East Sarajevo, Faculty of Traffic Engineering, Doboj, Bosnia and Herzegovina
Mykhailo Krystopchuk National University of Water and Environmental Engineering, Department of Transport Technologies and Technical Service, Rivne, Ukraine
Osman Lindov University of Sarajevo, Faculty of Traffic and Communication, Sarajevo, Bosnia and Herzegovina

1st International Conference Public Transport & Smart Mobility
2
ORGANIZING COMMITTEE
Matija Sikirić University of Zagreb, Faculty of Transport and Traffic Sciences, Zagreb, Croatia
Matija Vuger City of Zagreb, Zagreb, Croatia
Dino Šojat University of Zagreb, Faculty of Transport and Traffic Sciences, Zagreb, Croatia
Lidija Pavić Rogošić ODRAZ – Sustainable Community Development, Zagreb, Croatia
Julijan Jurak University of Zagreb, Faculty of Transport and Traffic Sciences, Zagreb, Croatia
Marko Stančec ODRAZ – Sustainable Community Development, Zagreb, Croatia
Božo Radulović University of Zagreb, Faculty of Transport and Traffic Sciences, Zagreb, Croatia
TECHNICAL COMMITTEE
Marko Slavulj University of Zagreb, Faculty of Transport and Traffic Sciences, Zagreb, Croatia
Matija Sikirić University of Zagreb, Faculty of Transport and Traffic Sciences, Zagreb, Croatia

3
Public Transport

1st International Conference Public Transport & Smart Mobility
4
Increasing the mobility of University North students by
improving the railway infrastructure: Case study on the Varaždin-
Koprivnica route DOI: https://doi.org/10.7307/ptsm.2020.1
Predrag Brlek1, Krešimir Grđan2, Ljudevit Krpan1, Ivan Cvitković1
University North, Trg Dr Žarka Dolinara 1, 48000 Kprivnica1; HŽ Infrastruktura d.o.o., Mihanovićeva 12, 10000 Zagreb2;
Keywords:
Abstract Sustainable
mobility
Transport
infrastructure
Public transport
Students
The trend of an increasing number of student travellers from the University of the
North, the University Centers of Koprivnica and Varaždin also affects the quality
of their mobility. The mobility of student-passengers in rail passenger transport is
directly related to the quality of service and the inevitable maximum safety aspect,
but also to the appropriate railway infrastructure. According to the above, it is
necessary to analyse the current state of transport infrastructure and propose
activities to increase the mobility of student-passengers. This paper analyses the
current status of student-passenger mobility in railway passenger transport, and
also analyses the regional features of road and railway transport infrastructure,
state road DC-2 and railway R202 Varaždin-Dalj, located between the cities of
Varaždin and Koprivnica, with regard to route characteristics and infrastructure
facilities. As part of the work, a survey was conducted through questionnaires, and
questionnaires were completed by students-travellers of the University of the
North.
Introduction
University North is the young public university in the Republic of Croatia. About 4,000 students’ study in two
centres, Varaždin and Koprivnica. About 1500 of them in Koprivnica, and the rest in Varaždin. About 80% of the
27 undergraduate, graduate, and doctoral programs are in the STEM field. Spatial mobility is a characteristic of
today's population of students-travellers of the University North who, for the purpose of studying, travel daily to
the City of Koprivnica or Varaždin. The growth and development strategy of the University North is aimed at
expanding and expanding the existing study programs, which will result in higher demands of transport service
users, and as a result a larger number of daily migrations between Varaždin and Koprivnica. Given this, the current
situation indicates the need to create new lines and optimize existing ones, as the current situation does not meet
the identified needs of service users. One of the safest modes of transport is rail transport [1], which emphasizes
the need for additional investments in the development of railway infrastructure on the route Varaždin-Koprivnica.
Furthermore, the analysis of the number of tickets sold during 2017 and 2018 showed an increase in the number
of rail trips by 22.91%, which further indicates the need to invest and optimize this mode of transport.
Regarding the daily migration of trips to the university by different modes of transport, the trend of an increasing
number of students from the University North, University Centres Koprivnica and Varaždin also affects the quality
of their mobility. The mobility of student-passengers on the route Varaždin-Koprivnica may depend on the quality
of service, which is reflected in the comfort of travel, travel speed, accuracy of the timetable, travel costs and the
inevitable safety aspect.
Given the insufficient mobility of student-passengers of the University North on the route Varaždin-Koprivnica,
it is necessary to analyse the current state of mobility of student-passengers, road and railway infrastructure – stat

Brlek, P., Grđan, K., Krpan, Lj., Cvitković, I. / Public Transport & Smart Mobility 2020, 4-13
5
road DC-2 road and railway R202, vehicles used by student-passengers on the route, and analysis of timetables
and segments in railway passenger traffic.
The main goal of this paper is to show the need for the creation of new railways on the Varaždin-Koprivnica
railway, as well as to show the need for investment in infrastructure to respond to growing traffic requirements.
Primary and secondary research and survey methodology
The primary goal of the research is to identify the number of students and passengers using rail transport. The
main goal of the secondary research is to present current trends in the development of mobility in European cities
and identify possible solutions that will increase the mobility of students and passengers on the route Varaždin-
Koprivnica.
Focus on the primary and secondary research
This paper is based on a primary study in which 265 students from the University of the North participated.
Respondents were selected by targeted sampling, because the main goal of the research is to prove that the current
level of mobility of students of the University North and passengers who use rail transport on the route Varaždin-
Koprivnica does not meet current needs.
In addition to primary research, the paper is based on secondary research that covers literary references of
professional and scientific papers published in relevant databases. Moreover, the aim is to identify previous
research and its results in order to point out the insufficient number of professional and scientific papers dealing
with problems related to the quality of transport service provision and the optimization of current railway
infrastructure capacities.
Following the primary research, the results of secondary research related to the analysis of road and railway
infrastructure were presented in order to show the real situation and determine the potentials for improving the
transport service through infrastructure improvements and related superstructures.
2.2. Primary research - Survey methodology of the Mobility of Students and Passengers on the Varaždin –
Koprivnica Route
The research was conducted by surveying students of the University of the North, through a survey form, users of
rail passenger transport, on the route Varaždin-Koprivnica, and the final procedure of electronic data processing
in the table Excell operating system Microsoft Office.
2.2.1. Questionnaire
In order to determine the current situation and current needs for passenger transport on the route Varaždin-
Koprivnica, a primary survey was conducted on a sample of 265 respondents. The questionnaire consisted of
questions aimed at identifying the most commonly used modes of transport, assessing the safety of a particular
mode of transport, assessing satisfaction with the technology available in passenger trains running on the route
Varaždin-Koprivnica, comfort of such trains and questions focused on user opinions related to the need for
additional by investing in infrastructure.
2.2.2. Survey analysis
When asked which mode of transport students used on the route Varaždin-Koprivnica, 53.33% of students
answered that they used the train as a means of transport, while 46.67% of students used a car for transport, which
is shown in Chart 1.

Brlek, P., Grđan, K., Krpan, Lj., Cvitković, I. / Public Transport & Smart Mobility 2020, 4-13
6
This indicates to the greater attractiveness of public transport in the eyes of students in relation to the use of cars,
and can be interpreted by subsidizing public transport for students, which significantly reduces the cost of using
a car.
Chart 1. Modes of student transport for travelling on the Varaždin-Koprivnica route
Source: created by the author
When asked from the aspect of safety which mode of transport is more acceptable for travel to the university on
the route Varaždin-Koprivnica (see Chart 2), 86.67% of respondents stated that the railway method is more
acceptable for transport compared to car use, while 13.33 % of respondents considered a car safer than rail
transport.
Chart 2. The most acceptable transport mode from the safety aspect
Source: created by the author
When it comes to the quality of rail service, the term technology refers to the availability of internet connection
and electrical connection. Of the total number of respondents, 45.83% rated the train technology as good, 29.17%
rated it as very good, 12.5% rated it as excellent, 8.33% rated it as sufficient, and 4.16% rated the technology as
insufficient. The obtained results can be interpreted with regard to the average age of trains running on the route
Varaždin-Koprivnica and the increasing demands in relation to the development and availability of technology in
the daily lives of respondents.
Chart 3. Student satisfaction with the state of technology found in the train they travel with
Source: created by the author
46,67%53,33%
PERSONAL CAR
TRAIN
13,33%
86,67%
PERSONAL CAR
TRAIN
4,17%8,33%
45,83%
29,17%
12,50%
1 2 3 4 5

Brlek, P., Grđan, K., Krpan, Lj., Cvitković, I. / Public Transport & Smart Mobility 2020, 4-13
7
One of the parameters of the quality of the provided transport service is the comfort, ie the accuracy of the train.
Of the total number of respondents, 8.33% said they were not satisfied with either the accuracy or comfort of the
train, 16.67% were partially satisfied with the accuracy and comfort of the train, 62.50% rated the comfort and
accuracy as good, while 12.50% rated the accuracy and rated the comfort as very good. None of the respondents
were completely satisfied with the accuracy and comfort.
Chart 4. Stud. satisfaction with the accuracy and comfort of the train according to the timetable Source: created by the author
When asked if they think the level of quality of passenger train service should be improved, 100% of respondents
said that the level of quality should be improved. This indicates that the existing level of quality, which is reflected
in the comfort of the train, accuracy and available technologies in the passenger compartments, is not sufficient,
and that respondents consider it necessary to invest in the above, to increase the quality of service provided.
When asked if they think that investments in railway infrastructure should be increased, 91.67% of respondents
answered that they should be increased, while 8.33% of respondents said that it is not necessary to increase
investments. According to the research, it was determined that the respondents believe that it is necessary to further
invest in the development and upgrade of existing infrastructure, which in turn will increase the quality of the
provided transport service.
However, in order to conclude on the feasibility of investing in infrastructure and to explain the reasons why
respondents mentioned rail transport as safer and much more attractive than road transport, it is necessary to
analyze the current road transport infrastructure used for passenger car transport. on the Varaždin-Koprivnica
route. Similarly, it is necessary to analyze the railway superstructure, as well as the infrastructure, in order to
determine the places where improvements can be made.
2.4. Secondary research - Literature Review
The use of public transport compared to the use of cars results in significantly less congestion and environmental
pollution. However, the use of public transport provides users with much less comfort compared to the use of cars,
as public transport often involves a greater number of transfers and the use of different modes of transport to reach
the desired destination. [2] However, the use of public transport, especially rail transport, is of great importance
when it comes to urban development due to the speed of connection and safety of passengers using rail for
transport [3]. Furthermore, the use of rail transport is also encouraged by the European Union, which emphasizes
the importance of increasing the total number of passengers transported by rail by 10%, which will result in a
reduction in environmental pollution by about 50%. In addition, expert and scientific research has shown that,
compared to other modes of transport, rail transport has the least impact on the environment. [4] The use of public
transport is often highlighted as one way to increase the mobility of older people and people who do not own a
car.
Furthermore, with the growth of the urban population, it is necessary to reduce the number of cars on city roads
in order to reduce traffic congestion and air pollution, i.e. to maintain satisfactory air quality in urban areas. [5]
8,33%16,67%
62,50%
12,50%
0,00%
1 2 3 4 5

Brlek, P., Grđan, K., Krpan, Lj., Cvitković, I. / Public Transport & Smart Mobility 2020, 4-13
8
One of the characteristics of rail transport is the timetable and its accuracy. In order to ensure the accuracy of rail
transport, it is necessary to optimize the existing railways. Optimization is based on the application of tools from
operational research, ie mathematical models that simulate the current mode of traffic flow and identify possible
improvements. [6] However, the optimization of the current capacity of the railway network often depends on the
condition of the infrastructure and its use. Insufficient track gauge with growing demand for transportation has
much less potential for optimization. Given this, in practice, desire lines are often developed that indicate the need
to upgrade or expand existing infrastructure capacity. Wish lines are often determined by the number of
inhabitants, ie the number of passengers of a certain mode of transport; and they are often irrational, which is why
in many cases the created lines of desire need to be optimized. [7] Expert and scientific research has shown that
the relationship between infrastructure and demand, ie transport demand, is complex and that defining and creating
an optimal strategy requires consideration of a large number of different variables, which further affects the
complexity of the optimization process. [8]
However, it should be emphasized that the railway mode of transport is the basis for the integration of transport,
since due to its capacity and speed it can transport a large amount of cargo, ie a large number of passengers over
long distances. A previous survey, which focused on determining the existing satisfaction, the current situation in
passenger transport in the Varaždin area, found that in 2015, almost 40.57% of passengers transported by rail were
actually students. Furthermore, the same survey showed that almost 42.29% of passengers listed Varaždin as their
final destination, while 29.14% of passengers started their journey in Varaždin. [9]
Speaking about the quality of transport and the parameters that users take into account when assessing the quality
of transport by rail, it should be mentioned that almost every passenger experiences the quality of transport
differently. Some of the most frequently cited criteria for assessing the quality of transport are speed, duration of
the trip, temperature in the passenger compartment, toilets and their cleanliness in the passenger compartment and
interior, or the condition of the seat in which passengers are transported. [10] Modern trends arising from the
development of Industry 4.0 also place the application of new technologies that can significantly affect the quality
of transport and the passenger experience as one of the requirements of the railway system. [11]
3. Transport infrastructure analysis on the Varaždin – Koprivnica route
The Varaždin-Koprivnica route lies on the section of the state road no. 2 (DC-2), whose total length is 347.5
kilometers, of which 47.30 kilometers are within the route and the R202 Varaždin-Dalj railway (Varaždin-
Koprivnica route) that is a regional single-track railway and connects the northern counties with the eastern
counties, merging with the TNT-RH2 railway corridor.
3.1. Analysis of the Road and Rail Transport Infrastructure on the Varaždin – Koprivnica Route
According to a study by the independent body EuroRAP (European Road Assessment Programs) that conducted
a safety analysis of DC-2 (state roads), it was rated with five different safety levels, 41% of DC-2 sections received
three stars (3 stars for high-risk sections ), 30% received two stars (2 stars for high-risk stocks), 20% received four
stars (4 stars for low-risk sections), 8% received 1 star (1 star for high-risk stocks), and less than 2% of the section
received five stars (5 stars for the least risk sections). The DC-2 section from Varaždin to Ludbreg was assessed
as particularly risky. The mentioned section is an integral part of the Varaždin-Koprivnica route. [12]. It follows
that the potential of rail transport is significantly higher in terms of safety than the potential of road transport.
The Varaždin-Koprivnica railway is parallel to the Croatian-Hungarian border, and the total length of the railway
(from Varaždin to Dalj) is 250 km, while the distance between Varaždin and Koprivnica is 41.989 km. The speed
of the railway train that allows the allowed infrastructure speed of 100 km/h is partially limited by the speeds
Vmax = 40 km/h (total length of 1742 m), 50 km/h (total length of 1464 m) and 80 km/h total at a length of 2160
m).

Brlek, P., Grđan, K., Krpan, Lj., Cvitković, I. / Public Transport & Smart Mobility 2020, 4-13
9
These limitations of the permitted infrastructure speed on the line cause an extension of train running time and
consequently significantly reduce the mobility of students-passengers of the University of the North.
4. Discussion
Based on the conducted primary and secondary research, it was determined that the current users of railway
transport believe that there is room for improvement of the existing infrastructure.
In addition, users were found to find rail transport to be significantly safer than road transport. This is supported
by the fact that EuroRAP assessed the Varaždin-Ludbreg route as a section of high-risk road. This implies that
there is potential for the development of rail transport through the investment cycle.
Furthermore, based on the conducted research, it was determined that there are four possible directions for
developing and increasing the mobility of students and travelers of the University of the North; reconstruction and
modernization of railway infrastructure, modernization of railway superstructure, increase of transport accuracy
and timetable modeling.
Better conditions for passenger and freight traffic are provided by the railway R202 Varaždin-Dalj, where regular
speeds of 100 km/h (with speed limits), in contrast to the state road DC-2, where the transit is very high, and
consequently a large number of traffic accidents.
The regional importance of railways is extremely important for the City of Varaždin, and the networks have a
favorable geographical position at the so-called northwestern gates of Croatia and good transport links with the
rest of Croatia and important transport hubs abroad.
4.1.Reconstruction and Modernization of Railway Infrastructure and Suprastructure
Reconstruction of the railway section Varaždin-Koprivnica, envisages an allowed infrastructure speed of 100
km/h, and includes upper and lower construction, signaling and safety devices, plans for security and
modernization of railway-road crossings, all in order to improve the railway infrastructure in terms of passenger
and student mobility.
On that section, on the lower railway structure, due to the poor condition of the railway body, it is planned to
install a layer of geotextile and geogrid, possibly as a geocomposite, with the installation of tampons, while the
upper structure is planned to be renewed with new rails 60E1. with new prestressed concrete sleepers and elastic
fasteners in crushed stone. It is planned to raise the level of security at the railway-road crossings by installing
devices for securing the crossings with light and sound signalization and half-bumpers. [13]
Considering that the discussion is focused on the modernization of the vehicle fleet and the introduction of modern
technology trains in passenger transport on the route Varaždin-Koprivnica, and as a result, a low-floor diesel-
motor train is proposed, because it allows:
- increasing the quality of transport service: comfort, air conditioning, multiple seats, passenger information
system, wheelchair transport, bicycle transport, top speed of 120 km / h, video surveillance,
- increasing the mobility of student-travelers,
- increasing the level of passenger transport safety.
4.2 Improving Timetble Accuracy
The accuracy of the timetable largely depends on the age of the fleet of the operator HŽ Putnički prijevoz d.o.o.,
on possible failures that directly affect the accuracy of the timetable, the delay in the departure of trains from the
station or stop. The operator or provider of passenger transport services, by diverting from other railways and / or
introducing technologically advanced low-floor diesel motor trains on route Varaždin-Koprivnica, may affect the
accuracy driving according to the timetable.
Brlek, P., Grđan, K., Krpan, Lj., Cvitković, I. / Public Transport & Smart Mobility 2020, 4-13
10
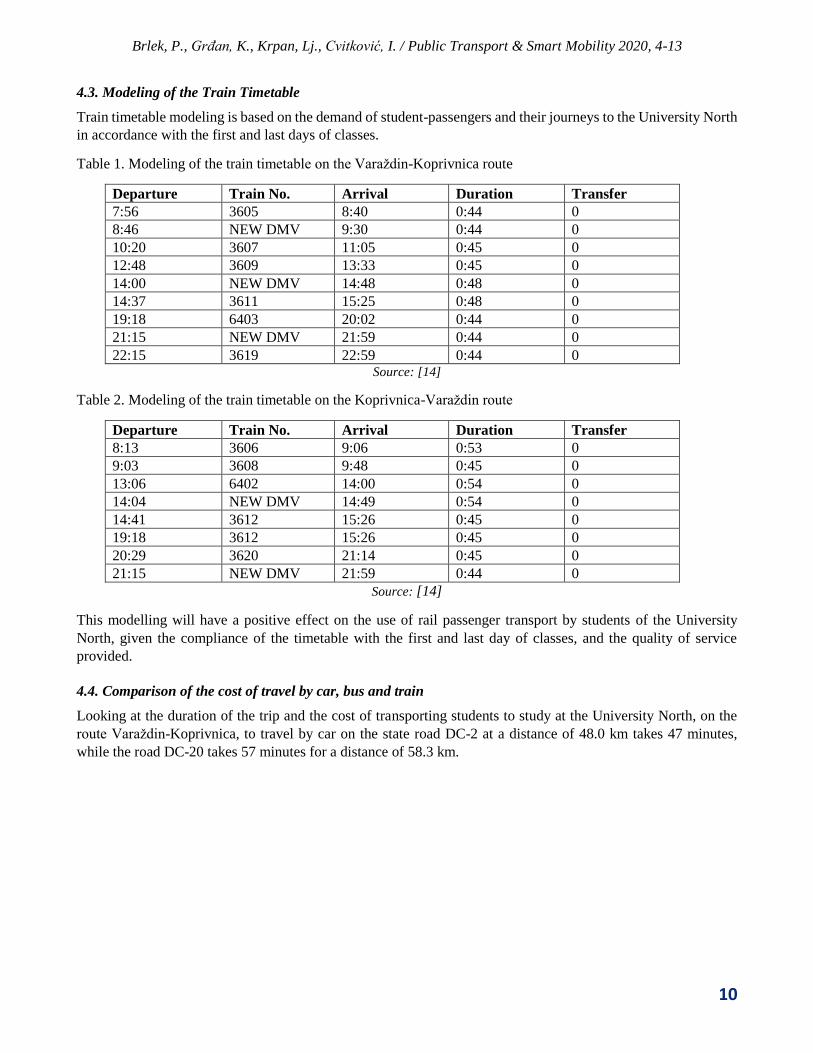
4.3. Modeling of the Train Timetable
Train timetable modeling is based on the demand of student-passengers and their journeys to the University North
in accordance with the first and last days of classes.
Table 1. Modeling of the train timetable on the Varaždin-Koprivnica route
Departure Train No. Arrival Duration Transfer
7:56 3605 8:40 0:44 0
8:46 NEW DMV 9:30 0:44 0
10:20 3607 11:05 0:45 0
12:48 3609 13:33 0:45 0
14:00 NEW DMV 14:48 0:48 0
14:37 3611 15:25 0:48 0
19:18 6403 20:02 0:44 0
21:15 NEW DMV 21:59 0:44 0
22:15 3619 22:59 0:44 0 Source: [14]
Table 2. Modeling of the train timetable on the Koprivnica-Varaždin route
Departure Train No. Arrival Duration Transfer
8:13 3606 9:06 0:53 0
9:03 3608 9:48 0:45 0
13:06 6402 14:00 0:54 0
14:04 NEW DMV 14:49 0:54 0
14:41 3612 15:26 0:45 0
19:18 3612 15:26 0:45 0
20:29 3620 21:14 0:45 0
21:15 NEW DMV 21:59 0:44 0
Source: [14]
This modelling will have a positive effect on the use of rail passenger transport by students of the University
North, given the compliance of the timetable with the first and last day of classes, and the quality of service
provided.
4.4. Comparison of the cost of travel by car, bus and train
Looking at the duration of the trip and the cost of transporting students to study at the University North, on the
route Varaždin-Koprivnica, to travel by car on the state road DC-2 at a distance of 48.0 km takes 47 minutes,
while the road DC-20 takes 57 minutes for a distance of 58.3 km.

Brlek, P., Grđan, K., Krpan, Lj., Cvitković, I. / Public Transport & Smart Mobility 2020, 4-13
11
Figure 1. Distance and travel time by car on the state road DC-2 and DC-20
Source: https://www.google.com/maps/dir/
In the calculation of travel costs by road, ie car, diesel fuel at the price of 9.52 kn and car consumption 7 l/100
km, on the route of travel on the state road D2 for the distance traveled 48.0 km in a time of 47 minutes, and
consumption 3.37 liters of diesel fuel, the cost of travel is 32.08 kn in one direction, including departure from the
parking lot at the Varaždin railway station to the University North, University Center Koprivnica. For bus travel,
the bus ticket costs 40 kn in one direction, from Varaždin bus station to Koprivnica bus station, the journey takes
1 hour to 1 hour and 10 minutes according to the schedule of Varaždin bus station at a distance of 47.5 km. There
is no discount on the bus ticket for students because the distance does not exceed 50 km.
For a train journey, a one-way ticket costs 14.90 kn, and the ride takes 44 to 48 minutes, while the maximum lasts
1 hour and 12 minutes, depending on the train you are traveling on, for a distance of 41,989 km. Figure 2 shows
railway stations and stops on the route Varaždin-Koprivnica.
Figure 2. Distance and display of railway stations and stops of the Varaždin-Koprivnica
Source: http://www.hzpp.hr/karta?p=16&mp=743
Table 3. Comparison of the cost of travel by car, bus and train on the route Varaždin-Koprivnica with the time
of travel and distance travelled
DIESEL (kn) Ticket (kn) Distance (km) TIME SPENT (min)
Car 32,08 - 48,00 47,00
Bus - 40,00 47,50 60,00
Train - 14,90 41,989 44,00
Source: [14]

Brlek, P., Grđan, K., Krpan, Lj., Cvitković, I. / Public Transport & Smart Mobility 2020, 4-13
12
4.5. Results from the point of view of sustainability
The consequences of the results from the point of view of sustainable student mobility by rail passenger transport
on the line Varaždin-Koprivnica and modernization of railway infrastructure and rolling stock are manifested in
strengthening modernization and development, and socially responsible management of railway infrastructure.
Investing in the safety and stability of railway infrastructure and student mobility in rail passenger transport, is a
visible aspect of sustainability, as well as an indispensable factor in continuing cooperation with carriers and other
partners in connecting with the wider community and direct and indirect impacts, their growth and development.
In the area of Koprivnica-Križevci, Međimurje and Varaždin counties - northern Croatia, on February 21, 2019,
the Agreement on long-term partnership in the development of railway transport and integrated passenger
transport was signed, and integrated transport is only one of the introductions to increased mobility of students.
Although there is a system of public bicycles in Koprivnica, it is planned to install e-bicycles at the railway stations
in Varaždin and Koprivnica in 2021, which would directly contribute to the mobility of students of the University
North, to arrive at the university on time and in an environmentally and energy-friendly manner.
5. Conclusions
This paper explores the possibilities and proposes measures with activities related to increasing the mobility of
students-travelers of the University of the North on the route Varaždin-Koprivnica. The analysis of the traffic
infrastructure revealed that on the state road DC-2, regardless of its rehabilitation, ie reconstruction, a large
number of traffic accidents still occur, with material damage, minor and major injuries and fatalities.
Unfortunately, the human factor is mostly crucial in traffic practices, where it directly affects safety and the
possibility of causing traffic accidents. On the railway infrastructure on the line R202 Varaždin-Dalj, route
Varaždin-Koprivnica, it was determined that the infrastructure requires urgent renovation and modernization,
given the age of the facilities, installed materials and devices and equipment.
The survey found dissatisfaction of student passengers with the level of quality of passenger train service, the
existing technology of trains running on the line R202 Varaždin-Dalj, route Varaždin-Koprivnica, and
dissatisfaction with the comfort and accuracy of the timetable. Moreover, the vast majority of surveyed student-
passengers also stated that it is necessary to increase investments in railway infrastructure.
In order to increase the mobility of students on the route Varaždin-Koprivnica and, as a result, reduce travel time,
it is proposed to improve the railway infrastructure by reconstructing the railway R202 Varaždin-Dalj, Varaždin-
Koprivnica. The reconstruction includes upper and lower buildings, signaling and safety devices, with the
simultaneous provision and modernization of level crossings, all with the aim of improving the railway
infrastructure in terms of passenger and student mobility. Improving the railway infrastructure would remove
sporadic speed limits of Vmax = 40 km / h, Vmax = 50 km / h and 80 km / h by introducing an infrastructure
speed of 100 km / h.
New modeling of train timetables, introduction of new routes within the existing ones and introduction of DMV
series 7 022 or 7 023 would correct and harmonize the departure time of trains on the Varaždin-Koprivnica route
and vice versa towards the first and last days of classes at the University North. With the introduction of additional
DMVs (low-floor diesel motor trains) there is the potential for increased demand, which also influences the
railway service provider to further improve the quality of service.
Improving the railway infrastructure and quality of service in railway passenger transport on the route Varaždin-
Koprivnica will increase the mobility of students-passengers, minimize travel time, adjust train schedules to the
first and last days of classes, and travel comfort will improve by introducing more modern trains using modern
technologies, timetable accuracy and travel speed will be improved, passengers will be better informed, all of
which will increase the safety of student-passengers in rail passenger transport.

Brlek, P., Grđan, K., Krpan, Lj., Cvitković, I. / Public Transport & Smart Mobility 2020, 4-13
13
The limitations of the research are related to the impossibility of generalizing the obtained results to the rest of
the territory of the Republic of Croatia that encounters a similar or the same problem, a similar or the same
potential. Future researchers in this field are advised to conduct research that would cover the entire territory of
the Republic of Croatia, as well as to investigate the satisfaction with rail passenger traffic in the territory of the
Republic of Croatia. Such research would provide a basis for drawing a conclusion on the development potential
of rail passenger transport.
References
[1] Jones-Lee, M., Spackman, M. The development of road and rail transport safety valuation in the United
Kingdom, Research in transportation economics, 23-40, 2013.
[2] Oliveira, L., Bruen, C., Birrell, S., Cain, R. What passengers really want: Assessing the value of rail
innovation to improve experiences, Transportation Research Interdisciplinary Perspectives, 2019.
[3] Akiyama, T., Okushima, M. Analysis of railway user travel behaviour patterns of different age groups,
IATSS research, 6-17, 2009.
[4] Lingaitis, V., Sinkevičius, G. Passenger transport by railway: evaluation of economic and social
Phenomenon, Procedia-Social and Behavioral Sciences, 549-559, 2014.
[5] Camporeale, R., Wretstrand, A., Andersson, M., How the built environment and the railway network can
affect the mobility of older people: Analyses of the southern Swedish region of Scania, Research in
Transportation Business & Management, 2019.
[6] Vojtek, M., Kendra, V., Stoilova, S. Optimization of railway vehicles circulation in passenger transport,
Transportation Research Procedia, 586-593, 2019.
[7] Negishi, K., Bissell, D. Transport imaginations: Passenger experiences between freedom and constraint,
Journal of Transport Geography, 2020.
[8] D’Acierno, L., Gallo, M., Montella, B., Placido, A. Evaluation of travel demand impacts in the case of
rail system failure, Procedia-Social and Behavioral Sciences, 75-84, 2013.
[9] Abramović, B. Analysis of the mobility of railway passenger transport in small urban areas, WIT
Transactions on The Built Environment, 665-674, 2015.
[10] Maskeliūnaite, L., Sivilevičius, H., Podvezko, V. Research on the quality of passenger transportation
by railway, Transport, 100-112, 2009.
[11] Fraga-Lamas, P., Fernández-Caramés, T., Castedo, L. Towards the Internet of smart trains: A review
on industrial IoT-connected railways, Sensors, 2017.
[12] EuroRAP, Sigurnost odvijanja prometa na državnoj cesti D2, Zagreb: HAK, 2010
[13] Izvedbeni projekt obnove (remonta) pružne dionice Čakovec (uključivo) – Virovitica (isključivo),
Zagreb, 2015, zajednice ponuditelja ŽPD d.d., TEB-Inženjering d.d., Granova d.o.o., Geotehnički studio
d.o.o.
[14] Grđan, K. Povećanje mobilnosti studenata Sveučilišta Sjever poboljšanjem željezničke infrastructure na
relaciji Varaždin - Koprivnica, diploma thesis, University North, Koprivnica, 2019

1st International Conference Public Transport & Smart Mobility
14
Analysis of public transport demand in the Municipality of Stupnik
DOI: https://doi.org/10.7307/ptsm.2020.2
Ljupko Šimunović1, Marko Slavulj1, Mario Ćosić1, Matija Sikirić1
Faculty of Transport and Traffic Sciences, University of Zagreb1
Keywords:
Abstract Public transport
Transport demand
Bus transport
Stupnik
Public transport is the backbone of urban mobility, providing people with access
to employment, education, trade and daily activities. It provides a special benefit
to people who do not own a car and are dependent on well-organized public
transport. The paper presents an analysis of the demand for public transport
services in the Municipality of Stupnik, otherwise organized in the form of bus
transport. The paper presents the methodology used, as well as the obtained results,
and the associated discussion and conclusion.
Introduction
Public transport, (also called mass transport) is the movement of people within urban areas using group travel
technologies such as bus, train, metro and tram. [1] Public transport of passengers in the municipality of Stupnik
is organized as bus transport. [2] Buses use conventional roads to transport numerous passengers on shorter travel
routes. They operate at low capacity compared to trams or trains and can operate on conventional roads, with
relatively inexpensive bus stops serving to collect passengers. Therefore, buses are commonly used in smaller
cities and rural areas, as well as for transportation services that complement other types of transit in large cities.
[1]
Most of the inhabitants of the Municipality using public transport fulfil their needs for transport by bus, and only
a small part uses the railway (HŽ Passenger transport), i.e. the railway station in Hrvatski Leskovac. The paper is
based on a study prepared by the Faculty of Transport and Traffic Sciences, entitled “Analysis of public transport
in the territory of the Municipality of Stupnik”. The second chapter describes the scope and organization of public
transport. The third chapter describes the research methodology used, referring to the counting of passengers in
public transport vehicles and conducting a survey. The fourth chapter presents the results of the research, followed
by discussion and conclusions.
Catchment area
The area of the Municipality of Stupnik has been determined for conducting the research. The municipality of
Stupnik is located in the western part of Zagreb County. It borders the City of Zagreb to the north, east and south,
to the northwest to the Municipality of Sveta Nedelja, and to the west with the City of Samobor. The total area of
the municipality of Stupnik is 24.87 km2. According to the 2011 census, the municipality has 3,735 inhabitants.
Territorially, the Municipality of Stupnik includes three settlements: Gornji Stupnik, Donji Stupnik and Stupnički
Obrež. The population density is 149.3 inhabitants / km2, from which it can be concluded that the Municipality
of Stupnik is quite sparsely populated in terms of its characteristics and belongs to the suburbs of the City of
Zagreb, Zagreb County. [3]
Public transport in the area of the Municipality of Stupnik is performed by the Zagreb Electric Tram operator from
Zagreb d.o.o. (hereinafter ZET). The analysed area is shown in Figure 1.

Šimunović, Lj., Slavulj, M., Ćosić, M., Sikirić, M. / Public Transport & Smart Mobility 2020, 14-24
15
Figure 1. Spans of bus lines in the municipality of Stupnik
Source: [2]
There are three bus routes operated by ZET [4]:
111 Savski most – Stupnički Obrež;
164 Savski most – Horvati;
165 Savski most – Klinča Sela.
All three bus routes serve as transport collectors and provide passengers with traffic connections to the Savski
most terminal in Zagreb, where passengers can continue to use other ZET’s tram and bus routes.
Methodology
In order to get an overview of transport demand in the Stupnik area, research was conducted in the form of
counting passengers on bus lines and conducting a survey of the population.
Passenger counting
The counting of passengers on bus lines was carried out with the aim of obtaining the actual load on the lines and
the number of passengers using public transport by bus in the observed area. Also, passenger counting data are
used to compare the transport demand model in public transport (data obtained from a survey of transport system
users) with the actual state of passenger flows on the lines. [5] [6]
In order to obtain a better sample and the possibility of correcting errors in the process, the counting of passengers
was carried out over two working days - Thursday, March 22, 2018 and Tuesday, March 26, 2018 on three bus
lines [2]:
111 Savski most – Stupnički Obrež;
164 Savski most – Horvati;
165 Savski most – Klinča Sela.
The exact number of "entered" and "exited" passengers, and the exact number of passengers between stops could
be determined with high accuracy by one passenger counter in one vehicle (because vehicle occupancy never
exceeded 50% of standing places, and meters did not have to manually record driving times). [5] [6]

Šimunović, Lj., Slavulj, M., Ćosić, M., Sikirić, M. / Public Transport & Smart Mobility 2020, 14-24
16
Survey research
Survey - The analysis of public transport in the Municipality of Stupnik was conducted methodologically in two
ways. The first way was a web survey, and the second was the physical completion of a survey form that
elementary school students in Stupnik took home and filled out with other household members. The survey was
conducted on a sample of 242 respondents. With an accuracy of 95%, the error is 6.1%. Implementation time is
the second half of March 2018. [2]
Figure 2. Example of a survey questionnaire
Source: [2]
The aim of the survey is to gather information about [2]:
age and gender structure of residents;
employment status of residents;
possession of a driver's license;
number of personal vehicles and bicycles in the household;
share of bus transport and car users;
distance of bus stops from the place of residence;
form of car parking;
determine the reasons for using a personal car, public transport and bicycle;
establish the desire lines of the residents;
purpose of travel;
main mode of travel;
reasons for dissatisfaction with the public transport service.
Results
The results of passenger counting and survey research in the area of the Municipality of Stupnik are presented
below.
Passenger counting
Counting passengers on bus lines showed that the occupancy of buses on any line never exceeds 27%, so due to
the large share of seats of 35%, typical for suburban buses, most buses do not fill seats on average. [2]

Šimunović, Lj., Slavulj, M., Ćosić, M., Sikirić, M. / Public Transport & Smart Mobility 2020, 14-24
17
The following results were determined by counting the passengers who entered and left the area of the
Municipality of Stupnik in three counting periods (morning, early afternoon and late afternoon) [2]:
in the morning counting period, most passengers leave at the Mercatone stop (18 passengers), while most
of them enter at the stops Gornjostupnička (14 passengers) and Stupnik – Osnovna škola (11 passengers).;
at other stops, the number of passengers entered is higher than the number of passengers;
in the early afternoon counting, most passengers enter at the stop Osnovna škola (11 passengers), while
most passengers leave at the stops Gornjostupnička (13 passengers), Domovićeva (5 passengers) and
Stupnički obrež (5 passengers);
at other stops the number of passengers entered and exited is the same;
in the late afternoon, most passengers leave at Gornjostupnička (17 passengers), Domovićeva (9
passengers) and Donjnostupnička (9 passengers), while most passengers enter at Gornjostupnička (7
passengers);
at other stops, the number of exited passengers is many times higher.
Number of passengers per vehicle, and the number of passengers who boarded and disembarked at stops for one
typical ride on each line in periods [2]:
06:45-08:15 (morning, which represents morning trips to work and school);
13:00-14:30 (early afternoon, which represents trips from the place of school to the place of residence);
15:00-16:30 (late afternoon, which represents trips from work to the place of residence).
According to the collected data, the number of passengers using the bus from the area of the Municipality of
Stupnik and their share in the total number of passengers is shown in Table 1. According to Table 1, line 111
(ending in the Municipality of Stupnik) carries 70% of the passengers of the Municipality of Stupnik, and the
remaining two lines passing through the Municipality of Stupnik carry 23% (164) and 28% (165). [2]
Table 1. Number and share of passengers from the Municipality of Stupnik by lines and directions
Line 06:45 – 08:15 13:00 – 14:30 15:00 – 16:30
111 Savski most – Stupnički Obrež 26 (65 %) 17 (55 %) 29 (67 %)
111 Stupnički Obrež – Savski most 47 (59 %) 34 (92 %) 12 (80 %)
164 Savski most – Horvati 4 (18 %) 3 (5 %) 8 (33 %)
164 Horvati – Savski most 11 (69 %) 2 (8 %) 3 (15 %)
165 Savski most – Klinča sela 5 (26 %) 8 (26 %) 15 (37 %)
165 Klinča sela – Savski most 7 (64 %) 1 (2 %) 2 (12 %)
Source: [2]
Based on the traffic counting data, an analysis of the occupancy of public transport vehicles was made. Vehicle
occupancy in most cases is less than the number of filled seats. The obtained average occupancy of the vehicle in
relation to the capacity is [2]:
on the line 111: 24%;
on the line 164: 15%;
on the line 165: 17%.
Vehicle occupancy is classified into three categories and shown in Table 2 [2]:
seats filled 0% - 100%, standing capacity unfilled;
filled seats, standing capacity filled 0% - 25%;
filled seats, standing capacity filled 25% - 50%.

Šimunović, Lj., Slavulj, M., Ćosić, M., Sikirić, M. / Public Transport & Smart Mobility 2020, 14-24
18
Table 2. Vehicle occupancy on bus lines
Line 06:45 – 08:15 13:00 – 14:30 15:00 – 16:30
0%
- 1
00
%
0%
- 2
5%
25
% -
50
%
Ave
rag
e
0%
- 1
00
%
0%
- 2
5%
25
% -
50
%
Ave
rag
e
0%
- 1
00
%
0%
- 2
5%
25
% -
50
%
Ave
rag
e
111 69% 26% 5% 23% 66% 34% 0% 27% 73% 27% 0% 22%
164 82% 12% 6% 19% 100% 0% 0% 13% 100% 0% 0% 14%
165 100% 0% 0% 16% 100% 0% 0% 15% 78% 22% 0% 21%
Source: [2]
It is observed that cases prevail in which the occupancy of vehicles does not exceed the number of filled seats
along the lines in any observed period. Furthermore, data on vehicle occupancy show insufficient utilization of
the offered transport work on the lines (it is better used on line 111). [2]
Survey research
The survey was conducted on a sample of 242 respondents. With an accuracy of 95%, the error is 6.1%.
Implementation time is the second half of March 2018. In total, 38% of men and 62% of women completed the
survey. The largest share (38%) belongs to the age group of 40 to 65 years, followed by the age group of 25 to 39
years to which 34% of respondents belong. The least number of respondents belongs to the age groups of
respondents older than 65 years (8%) and age groups of respondents aged 15 to 19 years (7%), and persons
younger than 14 years (2%). The average age of the surveyed respondents is 39.5 years. [2]
The survey covered 65% of employed persons, 8% of schoolchildren, 17% of pensioners and 5% of students. The
average number of household members of the surveyed participants was 4.8 members. According to the possession
of a driver's license, 76% of respondents answered in the affirmative, and 24% of respondents answered in the
negative. [2]
According to the number of passenger cars they own, 37% of respondents own one car, 36% of respondents own
two cars, three cars 17% of respondents and four or more cars own 7% of respondents while 4% of respondents
do not own a car. The average number of cars per household of the surveyed respondents is 1.91. [2]
According to the number of personal bicycles they own, 25% of respondents own two bicycles, while 21% of
respondents own one bicycle, three bicycles 20% of respondents and four 13% of respondents. 5 and more bicycles
are owned by 12% of respondents while 7% of respondents do not own a bicycle. The average number of bicycles
per household of the surveyed respondents is 2.58. [2]
Bus transport is used by 59% of respondents while 41% of respondents stated that they do not use bus transport.
[2]
The distance that respondents travel to the bus stop is between 400 - 800 m for 32% of respondents, 800 - 1200
m for 29% of respondents. A distance of up to 400 m to the stop is covered by 28% of respondents and a distance
greater than 1200 m is covered by 11% of respondents. Most of the respondents reach the bus stop on foot. The
average distance considering all the answers of the respondents is 675 m. [2]
Regarding the use of a car, 66% of respondents use a car as a driver, and 34% of respondents use a car as a
passenger. When it comes to parking a car, the largest number of respondents (29%) park their car in the marked

Šimunović, Lj., Slavulj, M., Ćosić, M., Sikirić, M. / Public Transport & Smart Mobility 2020, 14-24
19
parking zone, while 26% of respondents park their car in the parking lot at work. 15% of respondents park in an
unmarked parking lot, while 14% of respondents use public garages. [2]
Respondents were asked about the reasons for using a bicycle. A large proportion of respondents (24% of the
survey sample) point out that the main reason for using a bicycle is that it is healthier. Other reasons for using a
bicycle are that the bicycle is cheaper (17%), environmentally friendly (16%), comfortable and has no problems
with parking (11%), while the bicycle is considered a fast form of transport (2%). [2]
The most common reason for using a personal car, among the surveyed users is speed (37%), followed by
accessibility (27%) and comfort (14%). Of all surveyed users, 11% use a personal car because there are no
problems with parking. Safety, as a reason for using a car points out (4%) respondents. [2]
Also, respondents were asked about the reasons for using the bus. A large part of the respondents (23% of the
survey sample) point out that the main reason for using buses is that they do not have problems with parking and
because such a mode of transport is cheaper (22%). Other reasons for using the bus are that the bus is accessible
and safe (10%), comfortable (9%) and fast (7%). [2]
Table 3. Travels from the Municipality of Stupnik to other zones
Destination Proportion of passengers from the Municipality of Stupnik in percent
Centre 41.1%
Dubrava 4.5%
Žitnjak 4.9%
Jankomir 4.5%
Novi Zagreb 18.1%
Brezovica 0.8%
Lučko 10.2%
Samobor 3.0%
Klinča Sela 0.4%
Jastrebarsko 0.8%
Other 11.7%
Source: [2]
Due to the gravity of the Municipality of Stupnik towards the City of Zagreb, trips from the Municipality of
Stupnik to the area of the City of Zagreb are highly represented in the morning peak period. [2]
From the table and figure it can also be seen that, considering the selected zones in the City of Zagreb, the largest
share of trips to the zone of the centre of Zagreb (Centre), Novi Zagreb and Lučko, i.e. all trips are in the northeast
direction (in the direction of the City of Zagreb), which is in line with the larger offer of facilities that attract a
large number of passengers in the centre of Zagreb. [2]
Due to the gravity of the Municipality of Stupnik towards the City of Zagreb, travel from the area of the City of
Zagreb to the Municipality of Stupnik is highly represented in the afternoon peak period. [2]

Šimunović, Lj., Slavulj, M., Ćosić, M., Sikirić, M. / Public Transport & Smart Mobility 2020, 14-24
20
Figure 3. Graphic representation of desire lines from the Municipality of Stupnik
Source: [2]
Table 3. Travels from other zones to the Municipality of Stupnik
Destination Proportion of passengers to the Municipality of Stupnik in percent
Centre 41.0%
Dubrava 2.8%
Žitnjak 6.3%
Jankomir 6.3%
Novi Zagreb 18.1%
Brezovica 0.7%
Lučko 10.4%
Samobor 2.8%
Klinča Sela 0.0%
Jastrebarsko 0.0%
Other 11.8%
Source: [2]
If the data are compared with those in the morning peak period, the table and figure show that afternoon trips are
practically a copy of morning trips in terms of travel share, which indicates the constancy of travel desire lines
and their usual character (trips are direct and take place on the route - housing or schooling – housing). Most trips
come from the same observed zones as in the morning peak period - the center of Zagreb, Novi Zagreb and Lučko.
The interaction of a significant share of passengers with the Lučko zone is a consequence of the position of the
municipality between the Municipality of Stupnik and the City of Zagreb. [2]

Šimunović, Lj., Slavulj, M., Ćosić, M., Sikirić, M. / Public Transport & Smart Mobility 2020, 14-24
21
Figure 4. Graphic presentation of travel desire lines to the Municipality of Stupnik
Source: [2]
When asked about the purpose of the trip, the majority of respondents stated that the purpose of their trip was
most often to return home (29%) and go to work (34%). Furthermore, the most common purpose of travel for
respondents is going shopping (13%), going to school or college (6%), recreation (3%) and other reasons as the
purpose of travel (14%). [2]
Figure 5. The main mode of travel obtained from the survey

Šimunović, Lj., Slavulj, M., Ćosić, M., Sikirić, M. / Public Transport & Smart Mobility 2020, 14-24
22
Source: [2]
As the main mode of travel for the surveyed users, the respondents most often state the use of cars as drivers
(50%), followed by the bus (37%), the use of cars as passengers (7%) and to a lesser extent bicycles (2%),
motorcycles (1%) and train (1%). [2]
In the survey, passengers were given the opportunity to comment on the existing bus system. Traveller comments
were divided into nine general categories [2]:
inadequate information for passengers;
low operating speed, poor vehicle priority, buses stuck in traffic jams;
poor response of the vehicle in relation to the given timetable - poor accuracy of arrivals;
unsatisfactory timetable and regularity of vehicles;
poor tariff system, tariff zones, method of payment, high freight rates;
vehicle overcrowding, poor vehicle interior maintenance, poor vehicle interior design;
unsatisfactory line routes, stop positions, small number of lines;
unfriendly driving staff and aggressive driving;
poor infrastructure for passengers and vehicles.
According to the above categories, the obtained results are shown in Figure 6. It can be noticed that the biggest
problem for passengers is poor timetable and regularity of vehicles (62%), in which the higher number of
departures in a short time and the lack of departures in the period that follows (departures are non-uniform). Also,
passengers complained about the network itself - line routes, stop positions and number of lines (21%). In addition,
passengers also highlighted infrastructure as a problem (11%), highlighting the lack of sidewalks in the
Municipality of Stupnik, which causes reduced safety for pedestrians, especially for children and pensioners. [2]
Figure 6. The categories that passengers complained about the most
Source: [2]
Discussion
The counting of passengers on bus lines in the Municipality of Stupnik was carried out with the aim of obtaining
the actual load on the lines, and the number of passengers in the observed area who use public transport by bus.
In none of the observed vehicles did the occupancy exceed 27%. There are cases where the occupancy of vehicles
is below the level of filled seats, so that on line 111 the average occupancy is 24%, and on lines 164 and 165 even
lower - 15% on line 164, and 17% on line 165.
The most represented age group in the surveyed sample was between 40 - 65 years (38%) and between 25 - 39
years (34%), which represents the share of the working age population. Accordingly, employed persons, pupils

Šimunović, Lj., Slavulj, M., Ćosić, M., Sikirić, M. / Public Transport & Smart Mobility 2020, 14-24
23
and students comprise 74% of respondents. When it comes to owning a personal car, 37% of respondents own
one car while 36% of respondents own two cars. The average number of cars per household of respondents is
1.91.
Only 7% of respondents do not own a bicycle, while 25% of respondents own two bicycles in the household. The
average number of bicycles per household of the surveyed respondents is 2.58.
Bus transport is used by 59% of respondents. The average distance to the bus stop is 675 m. The main reasons for
using the bus are the lack of parking problems and the favourable price. The most frequent parking space for
personal cars of the surveyed respondents is in the marked parking zones 29%, and in the parking space at work
26%.
The main purpose of travel for about 2/3 of respondents is to go to work and / or return home, and the main way
to travel is a car 57% (driver and passenger), and a bus 37%.
Considering the selected zones in the City of Zagreb, the largest share of travel is towards the zones of the centre
of Zagreb, Novi Zagreb and Lučko, i.e. almost all travel routes are in the direction of the City of Zagreb. The
share of travel to Samobor is a slight 3%.
Conclusion
The analysis of the modal distribution of travel shows that the largest share of the population of the Municipality
uses a car (57%) for travel to work, school, and other needs towards the City of Zagreb. Public transport
participates in the modal distribution in the amount of 37%, while the bicycle with a share of 2% does not play a
significant role in transport to the City of Zagreb. It is estimated that the share of car travel in the modal distribution
is too high, if we look at trips to work, school and other activities.
Analysing the transport offer, it can be concluded that all three lines that serve the area of the Municipality
(especially in peak periods of the day with the purpose of going to work and school), have sufficient capacity, bus
units are filled on average 24%, line 111 and 15-17%, lines 164, 165).
The railway, whose stop is in nearby Hrvatski Leskovac, is faster as a way of traveling, but has a smaller number
of departures, which are even rarer in off-peak periods. The problem of accessibility of the railway is the main
reason for its insignificant use by the inhabitants of the Municipality of Stupnik (only 2% of the population uses
the railway as a way of traveling).
Since the Municipality of Stupnik is a settlement in the Zagreb County, its travel needs gravitate to the City of
Zagreb and the settlements in the Municipality are suburban, it is possible to conclude that the existing public
passenger transport is not sufficiently stimulating for a large number of passengers from the Municipality of
Stupnik to use public passenger transport to perform their regular activities (traveling to work and school).
Since one of the goals is to increase the orientation, i.e. the share of travel by public, instead of personal transport,
it is necessary to find solutions that would give the population easier access to public transport, primarily rail.
References
[1] Brčić, D., Slavulj, M. Urbana mobilnost. Fakultet prometnih znanosti. Zagreb. 2019.
[2] Fakultet prometnih znanosti. Analiza javnog prijevoza na području Općine Stupnik. Fakultet prometnih
znanosti. Zagreb. 2018.
[3] Općina Stupnika. Ostali dokumenti. Available at: http://www.stupnik.hr/ostali-dokumenti/ [Accessed:
April 15, 2018]
[4] Zagrebački električni tramvaj. Dnevne linije. Available at: https://www.zet.hr/autobusni-prijevoz/dnevne-
linije-251/251 [Accessed: April 18, 2018]

Šimunović, Lj., Slavulj, M., Ćosić, M., Sikirić, M. / Public Transport & Smart Mobility 2020, 14-24
24
[5] Štefančić, G. Tehnologija gradskog prometa I. Fakultet prometnih znanosti. Zagreb. 2008.
[6] Štefančić, G. Tehnologija gradskog prometa II. Fakultet prometnih znanosti. Zagreb. 2010.

1st International Conference Public Transport & Smart Mobility
25
Analysis of the current state of public passenger transport in the
area of Dubrovnik
DOI: https://doi.org/10.7307/ptsm.2020.3
Davor Brčić1, Božo Radulović1
Faculty of Transport and Traffic Sciences 1
Keywords:
Abstract Public transport
Suburban transport
Transport demand
Dubrovnik
Public transport line
Public transport is of great importance for the development of urban and suburban
areas, so high importance is attached to the analysis of the current situation in order
to identify certain shortcomings and room for improvement. The area of
Dubrovnik is of a specific character, apart from its location along the coast, it has
the character of a very attractive tourist centre. This paper will present the results
of the analysis of the organization of public transport in this area and present
certain conclusions from it.
Introduction
Public transportation (also called mass transportation) is the movement of people within urban areas using group
travel technologies such as bus, train, subway and tram [1] Public transport in the area of Dubrovnik is organized
as a bus transport, and is carried out by the transport company Libertas d.o.o. The article is based on the data of a
study prepared by the Faculty of Transport and Traffic Sciences entitled “Study analysis of urban, suburban and
county lines performed by the company Libertas d.o.o. with a proposal of timetables and work schedules of
drivers”. The second chapter presents the scope of the research. The third chapter refers to the research
methodology used in making the analysis of the current situation. The fourth chapter presents the results of the
research, and at the end a discussion and conclusion are presented.
Catchment area
Dubrovačko-neretvanska County is the southernmost County in the Republic of Croatia and is territorially
organized into 22 units of local government and self-government, i.e. 5 cities (Dubrovnik, Korčula, Ploče,
Metković and Opuzen) and 17 municipalities (Blato, Dubrovnik coast, Janjina, Konavle, Kula Norinska, Lastovo,
Lumbarda, Mljet, Orebić, Pojezerje, Slivno, Smokvica, Ston, Trpanj, Vela Luka, Zažablje and Župa dubrovačka).
The county center is located in the City of Dubrovnik. [2]
Dubrovačko-neretvanska County covers a total area of 9272 km2 (10.32% of the total area of the Republic of
Croatia), of which 1782 km2 refers to the land territory of the county, and 7490 km2 maritime territory. [4].

Brčić, D.., Radulović, B. / Public Transport & Smart Mobility 2020, 25-32
26
Figure 1. Cartographic representation of the coverage area
Source: [3]
Public passenger transport company Libertas d.o.o. performs in the administrative area of the City of Dubrovnik
and in all municipalities located in the Dubrovačko-neretvanska County. The division of the lines follows below
[3]:
a total of 25 city/urban (utility) lines within the City of Dubrovnik and two municipalities (Konavle and
Mljet), with a total of 844 departures during the working day, 843 departures during Saturday and 803
departures on Sundays and holidays during the autumn period;
703 departures during the working day, 667 departures on Saturdays and 551 departures on Sundays and
public holidays during the winter period under the Public Service Agreement between the City of
Dubrovnik and Libertas Dubrovnik;
on 19 county (suburban) lines based on permits obtained from the competent office of the Dubrovnik-
Neretva County with 171 departures during the day according to the official data of Libertas d.o.o. from
Dubrovnik.
Methodology
For the purposes of the research, data obtained from the company Libertas Dubrovnik were used. The data refer
to the routes of the lines, the number of vehicles per line, the number and location of stops, and the number of
transported passengers. [3]
Based on the obtained data, with the help of the software tool GIS (Geographic information system), the following
was created:
graphical representation of network lines;
graphical representation of locations, and the gravitational area of terminals and stops;
display of the load of city lines in the autumn and winter period of observation.

Brčić, D.., Radulović, B. / Public Transport & Smart Mobility 2020, 25-32
27
Results of public transport research in the area of the City of Dubrovnik
Urban passenger transport
According to the analysis of the data submitted by Libertas d.o.o., the basic data of city (utility) lines are shown
in Table 1.
Table 1. Basic data of city lines for 2018
Line Number of
vehicles per
line
Line length in
Km
Number of
stops
Number of
transported
passengers
1 Pile – Autobusni kolodvor 1 6 14 10.492
1A Pile – Stara Mokošica 4 27 36 1.562.555
1B Pile – Nova Mokošica 4 26 35 1.340.933
1C Pile – Mokošica 1 23 32 51.722
1D Lozica – Kantafig 1 14 4 769
1E Shuttle bus AK – Pile 1 13 8 15.143
2 Pile – Gorica 1 11 26 186.189
2A Glavica B. Kuk – Pile 1 10 23 154.809
3 Pile – Nuncijata 1 14 23 572.305
3A Nuncijata – Pile 2 11 14 73.658
4 Pile – H. Pallace 1 9 24 1.097.949
5 H. Neptun – Viktorija 3 17 38 187.425
6 Pile – Babin Kuk 1 10 23 2.332.819
8 Kantafig – Babin Kuk 5 12 25 331.439
8 Viktorija – Gruž 1 10 23 578.893
9 Pile – O. bolnica 2 8 20 156.254
17 Bosanka – Pile 1 28 18 35.673
17A Šumet – Komolac 1 12 7 0
20 Šipan 1 5 2 0
28 DBK – Osojnik 1 19 17 14.108
35 Brsečine – Dubrovnik 1 48 21 68.010
In total 36 335 433 8.771.145 Source: [3]
Based on the obtained data and their processing, it is evident that over 2,840,000 car kilometers are realized on
city lines in a year (2018).
An additional reason for such values is the large impact of return trips due to the characteristics of the lines (radial
type of line). Figure 2 graphically shows the routes of all city (communal) lines, except lines 35 (Dubrovnik -
Brsečine) and 28 (Dubrovnik - Osojnik).

Brčić, D.., Radulović, B. / Public Transport & Smart Mobility 2020, 25-32
28
Figure 2. Graphic representation of the city line network
Source: [3]
Figure 3 shows the locations of terminals that use city (utility) lines. The picture shows that all terminals are
located on the outskirts or in the centers of the settlement, while only the Pile terminal is located in the center of
the City of Dubrovnik.
Figure 3. Graphic representation of terminal locations in the area of the City of Dubrovnik
Source: [3]
The locations of stops for city (communal) lines are graphically shown in Figure 3. Taking into account that there
are more than a hundred bus stops in the City of Dubrovnik and that in most cases their mutual distance is not
more than 300 meters (Figure 4), it can be concluded that availability of public passenger transport (bus stops) in
the City of Dubrovnik is very good.

Brčić, D.., Radulović, B. / Public Transport & Smart Mobility 2020, 25-32
29
Figure 4. Graphic representation of the gravity area (300 meters) of the stop together with the locations of the
terminals in the area of the City of Dubrovnik
Source: [3]
Figure 4 graphically shows the load of the network of city (utility) lines during the characteristic month during
the autumn period (October 2018). It can be seen from the picture that the busiest route is towards Babin Kuk (in
both directions) and towards Mokošica and Hotel Palace.
Figure 5. Load of city lines in the autumn period (October 2018)
Source: [3]
Figure 5 graphically shows the load of the network of city (utility) lines during the characteristic month during
the autumn period (October 2018). It can be seen from the picture that the busiest route is towards Babin Kuk (in
both directions) and towards Mokošica and Hotel Palace.
Comparing the two periods, there is a large difference in load (number of transported passengers) between autumn
and winter, ie the number of transported passengers is three times higher in the characteristic month of the autumn
Brčić, D.., Radulović, B. / Public Transport & Smart Mobility 2020, 25-32
30
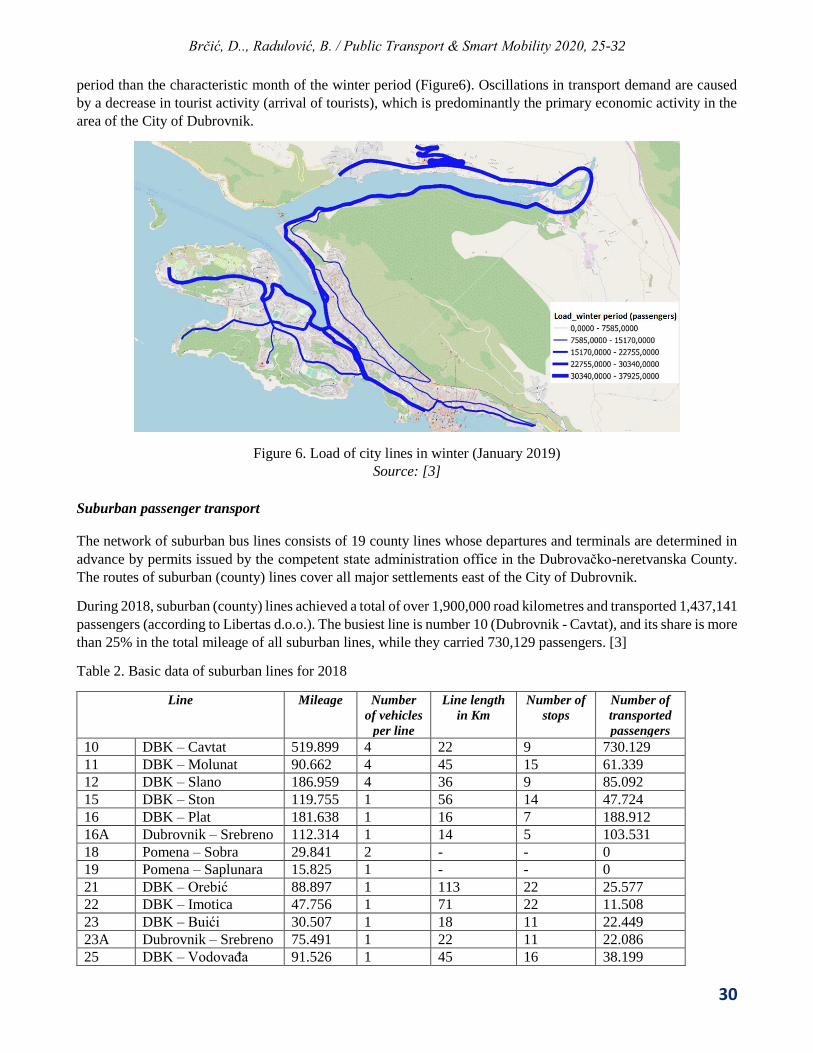
period than the characteristic month of the winter period (Figure6). Oscillations in transport demand are caused
by a decrease in tourist activity (arrival of tourists), which is predominantly the primary economic activity in the
area of the City of Dubrovnik.
Figure 6. Load of city lines in winter (January 2019)
Source: [3]
Suburban passenger transport
The network of suburban bus lines consists of 19 county lines whose departures and terminals are determined in
advance by permits issued by the competent state administration office in the Dubrovačko-neretvanska County.
The routes of suburban (county) lines cover all major settlements east of the City of Dubrovnik.
During 2018, suburban (county) lines achieved a total of over 1,900,000 road kilometres and transported 1,437,141
passengers (according to Libertas d.o.o.). The busiest line is number 10 (Dubrovnik - Cavtat), and its share is more
than 25% in the total mileage of all suburban lines, while they carried 730,129 passengers. [3]
Table 2. Basic data of suburban lines for 2018
Line Mileage Number
of vehicles
per line
Line length
in Km
Number of
stops
Number of
transported
passengers
10 DBK – Cavtat 519.899 4 22 9 730.129
11 DBK – Molunat 90.662 4 45 15 61.339
12 DBK – Slano 186.959 4 36 9 85.092
15 DBK – Ston 119.755 1 56 14 47.724
16 DBK – Plat 181.638 1 16 7 188.912
16A Dubrovnik – Srebreno 112.314 1 14 5 103.531
18 Pomena – Sobra 29.841 2 - - 0
19 Pomena – Saplunara 15.825 1 - - 0
21 DBK – Orebić 88.897 1 113 22 25.577
22 DBK – Imotica 47.756 1 71 22 11.508
23 DBK – Buići 30.507 1 18 11 22.449
23A Dubrovnik – Srebreno 75.491 1 22 11 22.086
25 DBK – Vodovađa 91.526 1 45 16 38.199

Brčić, D.., Radulović, B. / Public Transport & Smart Mobility 2020, 25-32
31
26 DBK – Majkovi 83.060 1 32 10 16.321
27/27A DBK – Vitaljina 107.648 1 49 17 51.237
29 Duba – Cavtat 32.962 1 - - 3.535
30 Vodovođa – Cavtat 28.880 1 - - 3.029
31 Vitaljina – Cavtat 67.079 1 - - 12.016
38 Dubrovnik - Gruda 21.237 1 34 20 14.457
In total 1.931.936 29 573 188 1.437.141 Source: [3]
Lines that cover more than 100,000 kilometres on an annual basis and carry from about 50,000 to over 100,000
passengers are:
Line 12 (Dubrovnik – Slano);
Line 15 (Dubrovnik – Ston);
Line 16 (Dubrovnik – Plat);
Line 16A (Dubrovnik – Srebreno);
Line 27/27A (Dubrovnik – Vitaljina).
Comparing the number of travelled kilometres with the number of transported passengers on individual lines
(Table 2), it can be seen that on part of the suburban (county) lines there is less than one transported passenger
per kilometre. [3]
It can be stated that the above data indicate a disproportionately large transport supply in relation to transport
demand (number of passengers).
Assuming that the transport on the suburban (county) lines is conditioned due to the strong gravity zone of the
City of Dubrovnik, a significant subsidy of certain municipalities is necessary in which the transport demand is
low to the carrier Libertas d.o.o. Otherwise, for some suburban (county) lines there is no economic justification
for operational use.
Discussion
The main attractors of travel on the transport network are the central terminal Pile (Old Town) where most of the
administrative, catering and cultural sights of the City of Dubrovnik are located, while the producers are: Babin
Kuk (a large number of hotels are in the area or in that direction), Luka Gruž (seaport, bus station and cruise port)
and the settlement of Mokošica (mostly residential buildings with the purpose of housing). Precisely on these
routes are the main roads in the City of Dubrovnik, which are accordingly roads with higher capacity with the
offered higher quality of service. [3]
The analysis of transported passengers on city (utility) lines shows that the average number of transported
passengers per year (2018) per kilometre is 3.1 passengers / km. This data shows that the network of city (utility)
lines is dispersed with relatively long lines, so it follows that although many passengers are transported during the
year, the average number of passengers per kilometre is not large. The routes of city lines are conceived as radial
lines that connect the city centre with the peripheral parts of the city. [3]
Public transport terminals also follow the concept of radial lines where the Pile terminal is the central terminal
and the starting point towards other destinations or terminals. Public transport lines for city (utility) lines and bus
stops are positioned in such a way that their gravity zone covers the entire city. Therefore, the entire area of the
City of Dubrovnik is very well served by public regular passenger transport. [3]
The load of the lines shows a large influence of the dominant lines (lines 1A, 1B, 4 and 6) which achieve most of
the transport performance during the year. It is also necessary to note that a large oscillation was observed in the
number of transported passengers between summer - autumn and winter. [3]

Brčić, D.., Radulović, B. / Public Transport & Smart Mobility 2020, 25-32
32
Transport demand on suburban (county) lines is significantly lower than on city (communal) lines, which is
indicated by the fact that on average less than one passenger travels per kilometre per year. Suburban lines are
divided into western and eastern suburban lines that serve all major settlements in the Dubrovačko-neretvanska
County. Therefore, the fact remains that the operation of suburban lines engages Libertas d.o.o. significant
resources (buses) and human resources (drivers - traffic service and other employees). [3]
Conclusion
Public transport in the area of the City of Dubrovnik and surrounding municipalities located in the area of
Dubrovačko-neretvanska County is performed by the carrier Libertas d.o.o. which is in the public domain. In total,
transport is performed on 35 different types of lines, a significant part of which refers to county lines (19), while
by far the most departures are made on city (utility) lines.
It should be noted that on the road network of the City of Dubrovnik there has been a disparity between transport
demand (especially in season) and the capacity of roads and intersections for many years. The high density of the
total traffic flow on the road network affects the reduction of the quality of public transport of passengers in the
area of the City of Dubrovnik, since public transport does not have special and separate lanes, i.e. there is no
secured priority at intersections.
Uneven transport demand puts a heavy burden on Libertas d.o.o. in the operational organization of the traffic
process, both in human resources (traffic service, drivers, maintenance service) and in material resources (buses
and vehicle maintenance facilities).
References
[1] Brčić D., Slavulj M. Urbana mobilnost. Fakultet prometnih znanosti. Zagreb. 2019.
[2] Libertas - Dubrovnik d.o.o. Potpuni tekst. Društveni ugovor 27. lipnja 2018. Dubrovnik. 2018.
[3] Faculty of Transport and Traffic Sciences. Studijska analiza gradskih, prigradskih i županijskih linija koje
obavlja tvrtka Libertas d.o.o. s prijedlogom voznih redova i rasporeda rada vozača. Faculty of Transport
and Traffic Sciences. Zagreb. 2020.
[4] DUNEA. Županijska razvojna strategija Dubrovačko-neretvanske županije 2016.-2020. Dubrovačko-
neretvanska županija. Dubrovnik. 2016.

1st International Conference Public Transport & Smart Mobility
33
Analysis of Parameters for Vehicles M2 and M3 Category – Case
Study Republic of Croatia
DOI: https://doi.org/10.7307/ptsm.2020.4
Julijan Jurak1, Marko Slavulj1, Marko Emanović2, Matija Sikirić1
University of Zagreb, Faculty of Transport and Traffic Sciences1; Center for Vehicles of Croatia (CVH)2
Keywords:
Abstract Buses
Age of buses
Number of buses
Influence
Vehicles category can be separated into two main categories, M and N category.
M categories represent motor vehicles which are used for passenger transport, and
N category is used for freight transport. This paper will present one sub-category
of M category (M2 and M3 category). M2 and M3 categories are motor vehicles
which have more than 8 passenger seats (without seat for driver), also known as
buses. Aim of paper is detect what parameters of buses influence on different
variables, mainly considering ages and number of vehicles in Croatia and other
countries. The paper consists of introduction, overview of vehicles category in the
Republic of Croatia regarding to age, discussion, and conclusion.
Introduction
Vehicles M3 category represent all motor vehicles that can drive more than 8 passengers, without including driver.
Other name for M3 category is common know as bus. Buses are widely used for city, intercity and international
passenger’s lines and for touristic purposes. Mainly owners of buses are companies which means they are used
for economic reasons. Knowing that fact, it can be assumed that buses travel more kilometres regarding to vehicles
owned by private persons. Also, it can be assumed that are buses generally older than vehicles owned by private
persons. Classification of vehicle categories is generated from the ordinance on technical conditions of vehicles
in road traffic (M) category, personal vehicles (M1) category, and buses (M2) and (M3) categories. [1]
Vehicle M2category represent motor vehicles for the passenger’s transport with more than 8 seats in addition to
the driver's seat and a maximum permissible mass ≤ 5000 kg. Vehicle M3 category represent motor vehicles for
the passenger’s transport, in addition to the driver's seat, have more than 8 seats and a maximum permissible mass
> 5000 kg.
Categories M2 and M3 are divided into the following [2]:
First (I) class - buses with more than 23 seats including the driver, designed for the transport of passengers
primarily in a standing position and whose interior is designed to allow passengers to pass quickly through
the interior of the vehicle;
Second (II) class - buses with more than 23 seats including a driver designed primarily for the transport
of seated passengers who can also drive standing passengers located only in the aisle space and/or in a
space not exceeding the area occupied by two double seats;
Third (III) class - buses with more than 23 seats including a driver designed to transport passengers in a
seated position only;
A class - buses with a maximum of 23 seats or less including a driver designed to transport passengers in
sitting and standing positions;
B class - buses with a maximum of 23 seats or less including a driver designed to transport passengers in
a sitting position only.

Jurak, J., Slavulj, M., Emanović, M., Sikirić, M. / Public Transport & Smart Mobility 2020, 33-38
34
Furthermore, will be presented and analysed the parameters that include the age of the vehicle (M3) category, the
number of buses, as well as the display of the average annual distance travelled in kilometres.
Overview of vehicles category in the Republic of Croatia regarding to age
Period of 5 years was considered regarding to the average age of vehicles in the Republic of Croatia for the
category of vehicles (M3), more precisely from 2014 to 2019. In the observed time period, the largest number of
vehicles for the observed (M3) category was recorded in 2019 and it amounted to 5375 vehicles, where the average
age was 11,55 years, which is also the lowest value for the age of the vehicle. The highest data for the average
age was recorded in 2015 and 2017, and for the observed years it was 12,02. Data for other observed years are
visible in figure 1. [3]
Figure 1. Overview of the total number of vehicles (M3) category and the average age for the period from 2014.
to 2019.
Source: [3]
Figure 2 shows the number of vehicles of category (M3) with an age of ten or more. In the year of 2014, a data of
2635 vehicles were recorded, which is also the lowest recorded number of vehicles for the observed age. Through
other years, a growth trend is noticeable, which reached its peak in 2019, where a data of 3652 vehicles was
recorded. [3]

Jurak, J., Slavulj, M., Emanović, M., Sikirić, M. / Public Transport & Smart Mobility 2020, 33-38
35
Figure 2. Number of vehicles (M3) of the category with ten or more years of ages for 2014 to 2019
Source: [3]
Figure 3 shows the number of vehicles (M3) of the category with the age from six to nine years. It is noticeable
that the lowest number of vehicles was recorded in the last observed year (2019), and it is 622 vehicles. The largest
number was recorded in 2015 and it was 1360. After the observed year, a negative trend followed. [3]
Figure 3. Number of vehicles (M3) of the category from six to nine years of age for 2014 to 2019
Source: [3]
Figure 4 shows statistical data on the age of vehicles from two to five years of age for the observed (M3) category
of vehicles. For the observed ages, the lowest data of such vehicles was recorded in 2015 and it was 304. The
highest recorded data was detected in 2019 and it is 644. [3]
Figure 4. Number of vehicles (M3) of the category from two to five years of age for 2014 to 2019
Source: [3]

Jurak, J., Slavulj, M., Emanović, M., Sikirić, M. / Public Transport & Smart Mobility 2020, 33-38
36
Figure 5 shows statistics for vehicles (M3) of the age category up to one year of age. In the first observed year, in
the five-year period, the lowest data was recorded, and it amounted to 171 vehicles. The highest data was recorded
in 2019, where it was 457. From 2014 to 2019, the figure shows a growth trend for the observed age of the vehicle.
[3]
Figure 5. Number of vehicles (M3) of the category up to one year of age for 2014 to 2019
Source: [3]
Figure 6 shown average ages for M3 vehicle category.
Figure 6. Average ages for M3 vehicle category
Source: [3]
Figure 7 shows average annual travelled kilometres regarding to all vehicle’s categories in the Republic of Croatia.
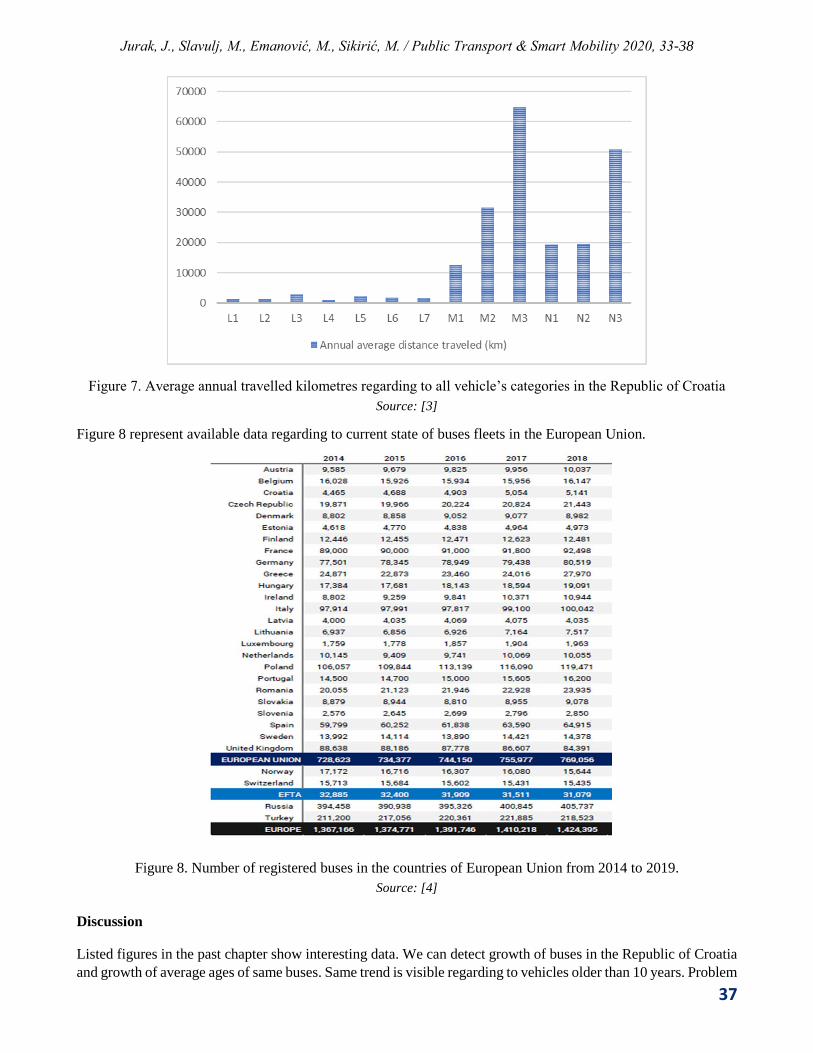
Jurak, J., Slavulj, M., Emanović, M., Sikirić, M. / Public Transport & Smart Mobility 2020, 33-38
37
Figure 7. Average annual travelled kilometres regarding to all vehicle’s categories in the Republic of Croatia
Source: [3]
Figure 8 represent available data regarding to current state of buses fleets in the European Union.
Figure 8. Number of registered buses in the countries of European Union from 2014 to 2019.
Source: [4]
Discussion
Listed figures in the past chapter show interesting data. We can detect growth of buses in the Republic of Croatia
and growth of average ages of same buses. Same trend is visible regarding to vehicles older than 10 years. Problem

Jurak, J., Slavulj, M., Emanović, M., Sikirić, M. / Public Transport & Smart Mobility 2020, 33-38
38
is detected with buses older than 6 years and younger than 9 years. In this area the number of buses is decreasing
every single year. Good signs are buses younger than 6 years, where is visible larger number of vehicles every
single year. Average ages of vehicle M3 category in the past decade shown constantly growth of ages from 10,55
to 13,82, which is growth more than 20 %. If considering annual average distance travelled (in kilometres), M3
categories are first and M2 category is third.
Conclusion
This paper show interested possible conclusion regarding to buses fleet in Republic of Croatia (M2 and M3
categories). Analysing the number of buses regarding to ages, we can detect that buses are getting older and older
with same trend. Also, problem is that buses are vehicle categories that travel most kilometres (almost 4 times
regarding to private cars). By comparing to other countries in the European Union, it can be seen that are growing
number of buses in almost all countries (approximately 5 % in the last five years), while in Croatia that number is
more than 10 % which can be justify by becoming part of European Union which which made it possible to
procure cheaper buses from most developed countries. Analyzing that data, two conclusions can be determined.
Fist is constant growth of buses in Croatia and other countries, and second is constant growth of older bus fleet.
References
[1] Bošković. I., “Tehnički pregledi vozila iz perspektive pravila o tržišnom natjecanju”, ZPR 4, vol. 2, no.
2015, pp. 171-205
[2] Hrvatski Autoklub, https://www.hak.hr/vozila/tehnicki-pregledi/popis-stp/, [accessed: november 2020.]
[3] Center for Vehicles of Croatia, https://www.cvh.hr/tehnicki-pregled/stanice-za-tehnicki-pregled/,
[accessed: november 2020.]
[4] ACEA European Automobile Manufacturers Association. ACEA Report Vehicles in use Europe 2019.
ACEA. Brussels. 2019

1st International Conference Public Transport & Smart Mobility
39
Analysing County and Local Public Passenger Transport in the
City of Velika Gorica
DOI: https://doi.org/10.7307/ptsm.2020.5
Luka Vidan1, Marko Slavulj2, Dino Šojat2
Faculty of Transport and Traffic Sciences, Student1; Faculty of Transport and Traffic Sciences
Keywords:
Abstract bus
City of Velika Gorica
public transport
timetable
transport demand
This paper presents an analysis of the existing local public transport in the
City of Velika Gorica and a few solutions to optimize the existing local
public transport. In this paper, the management of passenger transport was
analysed from a theoretical point of view, with data on transport demand
between Zagreb and Velika Gorica being used. Transport demand analysis
is shown by graphs, tables, and route data. In the proposed solution, smaller
buses on some routes were introduced, timetables were changed, and Route
330 was cancelled.
Introduction
Citizen mobility of today is a significant factor in quality of life. Therefore, traffic planning faces the task of
successfully solving mobility challenges, to ensure maximum savings for the users. Today’s connection between
Zagreb and Velika Gorica relies mostly on private cars and bus public transport. The aim of this paper is to conduct
an analysis of the current situation, and to assess the existing transport service.
The chapter “General data” describes the conditions in the City of Velika Gorica. The data about population of
the 58 settlements in the gravitational area of Velika Gorica and daily migrations between Velika Gorica and
Zagreb is presented.
In chapter “Analysis of existing organization and infrastructure of public transport”, an analysis of local public
transport and inter-county transport between Zagreb and Velika Gorica is presented. A survey on 180 passengers
was conducted to show the results graphically.
The chapter “Transport demand” shows travel time distributions between Zagreb and Velika Gorica, bus
occupancy, and characteristics of vehicle fleet operating in Velika Gorica.
The last chapter, “Quality assessment of the existing transport service”, provides an evaluation of the data analysed
in the paper. Based on the evaluation, hypothetical solution scenarios were proposed.

Vidan, L., Slavulj, M., Šojat, D. / Public Transport & Smart Mobility 2020, 39-49
40
Analysis of the current public transport service
The area of the City of Velika Gorica is 330 km2 and it contains 58 settlements of which Velika Gorica is the only
one that is considered an urban settlement. By 2011 census, the City of Velika Gorica had 31,553 residents, with
63,517 residents in the urban area, which makes it the sixth most populous city in Croatia. Figure 1 shows the
population from 1900 to the 2001, and currently, there are 63,517 residents in urban area. The census from 2011.
resulted in the same population compared to 2001. [1]
Figure 1. The number of residents in Velika Gorica
Source: [1]
Figure 2 shows all 58 settlements and population in every settlement.
Figure 2. Settlement population in the administrative area of Velika Gorica
Source: [2]
Velika Gorica is a city in Zagreb County, bordering Zagreb County and the City of Zagreb. Due to its position in
the gravitational area of Zagreb, about 50 to 60% of residents travel to Zagreb daily, which is shown in Figure 3.
Settlment Population Settlment Population Settlment Population
Bapća 129 Kuče 1,453 Rakitovec 570
Bukovčak 65 Lazi Turopoljski 57 Ribnica 803
Buševec 886 Lazina Čička 566 Sasl 159
Cerovski Vrh 93 Lekneno 383 Selnica Ščitarjevska 535
Cvetković Brdo 32 Lukavec 1,140 Sop Bukevski 85
Črnkovec 412 Mala Buna 261 Staro Čiče 790
Donja Lomnica 1,732 Mala Kosnica 49 Strmec Bukevski 366
Donje Podotočje 375 Markuševec Turopoljski 328 Ščitarjevo 442
Drenje Ščitarjevsko 203 Mičevec 1,286 Šiljakovina 672
Dubranec 349 Mraclin 1,074 Trnje 62
Gornja Lomnica 580 Novaki Ščitarjevski 158 Turopolje 953
Gornje Podotočje 491 Novo Čiče 1,255 Velika Buna 856
Gradići 1,860 Obrezina 555 Velika Gorica 31,553
Gudci 374 Ogulinec 292 Velika Kosnica 770
Gustelnica 118 Okuje 467 Velika Mlaka 3,334
Jagodno 521 Petina 213 Vukomerić 158
Jerebić 41 Petravec 76 Vukovina 947
Ključić Brdo 214 Petrovina Turopoljska 708 Zablatje Posavsko 61
Kobilić 533 Poljana Čička 688
Kozjača 342 Prvonožina 42

Vidan, L., Slavulj, M., Šojat, D. / Public Transport & Smart Mobility 2020, 39-49
41
Figure 3. Daily citizen migrations from Velika Gorica
Source: [3]
Local public transport
Local public transport is currently organized to connect surrounding settlements and the administrative territory
of the City of Velika Gorica. In total, there is 196 km of local public transport routes in the city, achieving
953,000.00 km yearly.
There are 13 local transport routes connecting surrounding settlements with the administrative territory, [5]:
1. Route 302 → from Velika Gorica to Velika Buna. Some rides go off route to Ključić Brdo and then to
Velika Buna
2. Route 303 → from Velika Gorica to Kozjača. Sometimes, depending on the schedule, on its way back to
Velika Gorica, the buses pass through Velika Buna with a few more stops on the route
3. Route 304 → from Velika Gorica to Mraclin, with some rides extending to Vukojevac
4. Route 305 → from Velika Gorica to Turopolje
5. Route 309 → from Velika Gorica to Sasi
6. Route 310 → two types:
from Glavni Kolodvor to Petrovina Turopoljska;
from Velika Gorica to Glavni Kolodvor passing through Petrovina Turopoljska
7. Route 319 → from Velika Gorica to Lukavec
8. Route 321 → from Velika Gorica to Strmec Bukevski, sometimes off route to Sasi and back on route to
Strmec Bukevski
9. Route 323 → from Velika Gorica through Ribnica and Lazina, making a small loop and returning to
Velika Gorica
10. Route 324 → from Velika Gorica to Čička Poljana
11. Route 325 → from Velika Gorica to Vukojevac and sometimes, depending on its schedule, stops at
Mraclin
12. Route 326 → from Velika Gorica to ZTC (Zrakoplovno Tehnički Centar)
13. Route 335→ from Velika Gorica to Pleso, extending to Donja Lomnica and returning to Velika Gorica.

Vidan, L., Slavulj, M., Šojat, D. / Public Transport & Smart Mobility 2020, 39-49
42
Figure 4. Local public transport routes
Source: [3]
Figure 4 shows local public transport routes in the City of Velika Gorica and the connections with the city. The
routes connecting rural areas mostly are not economically effective because of less passengers, but the routes
operate subsidized to create acceptable conditions for residents travelling from those parts of region. [3]
Inter-county public transport
Because Velika Gorica is close to the capital and the largest city of the Republic of Croatia, daily migrations
between the cities are high. As already shown in Chapter 2, 50 to 60% of residents migrate to Zagreb and among
the people, not only commuters (most of them own a private car) travel, but also children to school and students
to universities in Zagreb. Local public transport needs to perfectly function mostly because of schoolchildren and
students. The routes that operate in between the counties are 268, 290 and 330. These three routes transport most
passengers between the cities.
In the purpose of exploring traffic demand and questioning quality of transportation service, a survey on 180
subjects on these three routes was conducted. Survey on route 330, was conducted on Monday 15th of May 2017.
For route 268, survey was conducted on Tuesday 16th of May 2017, and the last route 290 was conducted on
Monday 22nd of May 2017.
The passengers were asked about their social status, and 60% of them declared as students and 30% as employed,
shown in Figure 5. [1]

Vidan, L., Slavulj, M., Šojat, D. / Public Transport & Smart Mobility 2020, 39-49
43
Figure 5. Social status of subjects
Source: [1]
When asked about the purpose of traveling by bus, 29.1% of them stated that the most common purpose is
education (school or university), and 23.9% opted to work, as shown in Figure 6. [1]
Figure 6. Travel purpose
Source: [1]
Figure 7 shows that 68.3% of subjects travel by route 268, 21.7% by route 330 and 10% by route 290. [3]
7%
60%
30%
3%
0%
pupil student employed unemployed retired
29.1%
23.9%
15.7%
20.9%
3.7%
6.7%
school/collage work shopping recreation work related other

Vidan, L., Slavulj, M., Šojat, D. / Public Transport & Smart Mobility 2020, 39-49
44
Figure 7. Routes the subjects are using daily
Source: [1]
Figure 8 shows passenger satisfaction with the service for different quality categories – safety, speed, comfort,
accuracy and punctuality of transport.
Figure 8. Quality of service and passenger satisfaction
Source: [1]
Transport demand
Transport demand always changes, and it depends on number of factors. The highest transport demand is in
commuter periods (6:00 a.m. – 9:00 a.m.) and it’s the easiest to predict. But there are other factors influencing
demand more difficult to predict such as: weather, social activities, personal errands and day of week, because
people tend to get from work earlier on Friday. That’s why it’s important to conduct surveys and monitor the
passenger movements so that demand does not exceed the supply.
27
48
30
90
5448
63
90
57
7581
60
51
12
33
18
60
1815
63
93 3
0
10
20
30
40
50
60
70
80
90
100
security speed comfort accuracy punctuality
unsatisfied mostly unsatisfied mostly satisfied satisfied can't estimate

Vidan, L., Slavulj, M., Šojat, D. / Public Transport & Smart Mobility 2020, 39-49
45
Figure 9. Daily travel distribution between Zagreb and Velika Gorica
Source: [3]
Figure 9, showing daily travel distribution in one-hour segments, reveals the unbalanced travel demand. This
unbalanced demand affects vehicle occupancy. [3]
Based on the conducted analysis of public transport routes operating in Velika Gorica (Table 1), there are
significant variations in driving speed, mainly depending on traffic conditions. [3]
Table 1. Features of travelling on public transport routes
Route Travel duration (min) Average speed (km/h)
Type Number
Loca
l
303 29 32,90
304 28 38,36
305 20 35,70
309 20,5 33,37
319 18 31,00
321 19 37,58
323 32 30,75
324 18 43,50
335 26 23,08
Average 21,05 33,56
Co
un
ty
301 47,5 43,26
302 49,5 38,30
306 45,5 37,71
322 52 43,62
Average 48,63 40,72
Inte
r-co
un
ty
307 40,5 26,96
308 35 29,31
310 34,5 30,96
311 57 41,79
313 40,5 37,04
315 31,5 33,14

Vidan, L., Slavulj, M., Šojat, D. / Public Transport & Smart Mobility 2020, 39-49
46
325 17 50,47
268 35 26,23
330 30 30,60
Average 35,67 33,66
AVERAGE 35,11 35,98
Source: [3]
Table 1 shows the average speed of 36 km/h in the city of Velika Gorica. The average speed is acceptable, but
given that most of the routes don’t operate in urban conditions, the average speed should be higher.
Table 2. Bus occupancy
Route Bus occupancy, %
Workday Saturday Sunday Week
Loca
l
303 17 11 2 13,5
304 16 8 14,6
305 17 17 5 15,3
309 5 8 1 4,9
319 11 6 3 9,1
321 6 8 10 69
323 19 0 0 19,0
324 17 13 0 15
335
6 2 0 4,0
11 0 0 11,0
In total 8,5 1 0 7,5
TOTAL 12,50 7,30 2,10 11,33
Cou
nty
301 28 23 14 25,3
302 15 17 4 13,7
306 21 18 10 19,0
322 20 11 3 16,0
TOTAL 21,00 17,25 7,75 18,51
Inte
r-co
un
ty
307 26 15 9 21,4
308 23 13 7 19,2
310 18 12 16,6
311 29 12 25,4
313 10 10,0
315 19 18 8 16,7
325 22 13 0 17,5
268 50 33 23 42,9
330 43 43,0
TOTAL 26,67 16,57 9,40 23,47
Source: [3]
As the data in Table 2 shows, bus occupancy is relatively small. Among local routes, the average usage is only
11.33%, among county routes 18.51% and 23.47% among inter-county routes. The highest occupancy is on route
268 (Zagreb – Velika Gorica), with 50% on workdays and on route 330, with 43% on workdays. [3]

Vidan, L., Slavulj, M., Šojat, D. / Public Transport & Smart Mobility 2020, 39-49
47
Regarding the fact that the study of public transport was done 15 years ago, and the lack of significant changes in
quality of service, it’s obvious how transport changes are necessary for the City of Velika Gorica. [3]
Table 3 shows bus travel data for 2005 (when the last public transport study was made) and Table 4 shows the
data for 2009, where it is evident how transport organization made only small changes – the operator cancelled
routes 301 and 306, and route 302 operates only locally to Velika Buna. [3]
Table 3. Bus travel data, 2005
Source: [3]
Table 4. Bus travel data, 2009
Type Numberwork
daysaturday sunday weekly
work
daysaturday sunday weekly yearly
1 303 15,9 3 18 14 6 55 286,2 222,6 95,4 1749 89644,20
2 304 17,9 1 10,5 5,5 0 58 187,95 98,45 0 1038,2 52742,35
3 305 11,9 1 32 22 6 188 380,8 261,8 71,4 2237,2 114216,20
4 309 11,4 2 20 12 6 118 228 136,8 68,4 1345,2 69038,40
5 319 9,3 1 3 4 10 29 27,9 37,2 93 269,7 14656,80
6 321 11,9 2 12 6 4 70 142,8 71,4 47,6 833 42863,80
7 323 16,4 1 9 0 0 45 147,6 0 0 738 37785,60
8 324 13,05 1 6 4 0 34 78,3 52,2 0 443,7 22498,20
9 325 14,3 2 23 15 0 130 328,9 214,5 0 1859 94279,90
10 335 13,2(10) 1 18 6 0 96 196 60 0 1040 52996,00
151,5 88,5 32 823 2004,5 1155 375,8 11553 590721,45
11 301 14,3 4 25 15 14 154 357,5 214,5 200,2 2202,2 11401,90
12 302 14,1 4 17 13 4 102 239,7 183,3 56,4 1438,2 73475,10
13 306 9,05 4 26 15 6 151 235,3 135,75 54,3 1366,6 69983,65
14 322 22,5 5 6 5 6 41 135 112,5 135 922,5 48217,50
74 48 30 448 967,5 646,05 445,9 5929,5 305690,15
15 307 14,8 3 17 13 6 104 251,6 192,4 88,8 1539,2 78958,00
16 308 13,7 3 41 23 6 234 561,7 315,1 82,2 3205,8 163701,30
17 310 14,8 2 30 10 0 160 444 148 0 2368 120620,00
18 311 20,65 5 14 10 0 80 289,1 206,5 0 1652 83715,10
19 313 14,6 3 4 0 0 20 58,4 0 0 292 14950,40
20 315 3,7 2 28 16 10 166 103,6 59,2 37 614,2 31598,00
21 268 5,6 2 269 215 159 1719 1506,4 1204 890,4 9626,4 497431,20
22 330 5,6 2 104 520 582,4 0 0 2912 149094,40
507 287 181 3003 3797,2 2125,2 1098,4 22210 1140068,40
732,5 423,5 243 4274 6769,2 3926,2 1920,1 39692 2036480
Inter-county
In total
In total
Distance traveled, km
In total
County
In total
RouteOrdinal
number
Length,
km
Tariff
zone
Number of departures
Local

Vidan, L., Slavulj, M., Šojat, D. / Public Transport & Smart Mobility 2020, 39-49
48
Source: [3]
From the data in Table 3 and Table 4, it’s obvious how, no matter the two cancelled routes (301 and 306) and
shortened route 302, in 2009, travelled distance became larger.
Discussion
After analysing public passenger transport in Velika Gorica and its surrounding settlements, it’s evident that there
are some improvements needed. In the study of public transport from 2005, the analysis showed many public
transport routes poorly utilizing available passenger seats (Table 2), which indicates a need to consolidate the
process.
In terms of low vehicle occupancy, there’s insufficient transport demand, which can be solved by introducing low-
capacity buses, or by reducing the number of departures. Many routes don’t justify their existence economically
because of low vehicle occupancy (Table 2), but they are important for the residents depending on these routes,
despite the lack of space for improvement. These routes should start using minibuses to increase vehicle
occupancy and reduce the costs, improving their economic justification. Departure frequency is also important
because of transport demand. As explained in Chapter 4, transport demand is the highest in the morning, when
many adults and children go to work or school, and yet some of the routes don’t departure in the morning.
By analysing routes 268 and 330, the average speed difference is relatively small despite that the Route 330
(Zagreb - Velika Gorica) is an express route. Therefore, Route 330 should be terminated, and Route 268 should
increase departure frequency. Consequently, the passengers would be more satisfied, as the survey reported many
of the passengers unhappy with the regularity and comfort of the service.
To implement any of the given alternatives in practice, a detailed analysis of public transport demand, with
investigating possibilities to reconstruct public transport network, should be conducted.
Conclusion
Demand for local public transport is growing every year. More people are starting to use buses, trains, trams, and
other modes of public transport rather than private car. The cost of owning a private vehicle is pushing people
towards public transport because of the costs, such as registration, gas, yearly maintenance and so on. Public
Type Numberwork
daysaturday sunday weekly
work
daysaturday sunday weekly yearly
1 302 10 3 32 16 10 102 320 160 100 1860 95640
2 303 15,9 3 22 14 6 55 349,8 222,6 95,4 2067 105925,80
3 304 17,9 1 11 5,5 0 60,5 196,9 98,45 0 1083 55033,55
4 305 11,9 1 32 24 6 190 380,8 285,6 71,4 2261 115334,80
5 309 11,4 2 20 12 6 118 228 136,8 68,4 1345,2 69038,40
6 319 9,3 1 4 4 10 34 37,2 37,2 93 316,2 17037,60
7 321 11,9 2 12 6 5 71 142,8 71,4 59,5 844,9 43601,60
8 323 16,4 1 9 0 0 45 147,6 0 0 738 37785,60
9 324 13,05 1 32 15 8 183 417,6 195,75 104,4 2388,2 122578,65
10 335 13,2(10) 1 18 7 0 96 196 60 0 1040 52996,00
160 87,5 41 852,5 2096,7 1107,8 492,1 12083 714972,00
12 325 14,3 2 25 15 0 140 357,5 214,5 0 2002 101601,50
13 25 15 0 140 357,5 214,5 0 2002 101601,50
14 307 14,8 3 17 13 5 104 251,6 192,4 74 1524,4 78040,40
15 308 13,7 3 38 23 6 234 520,6 315,1 82,2 3000,3 153179,70
16 310 14,8 2 50 17 0 160 740 251,6 0 3951,6 201265,20
17 311 20,65 5 14 10 0 80 289,1 206,5 0 1652 83715,10
18 313 14,6 3 5 3 0 20 73 43,8 0 408,8 20746,60
19 315 3,7 2 31 18 10 166 114,7 66,6 37 677,1 34787,40
20 268 5,6 2 275 225 167 1719 1540 1260 935,2 9895,2 511442,40
21 330 5,6 2 103 520 576,8 0 0 2884 147660,80
22 322 22,5 5 6 5 6 41 135 112,5 135 922,5 48217,50
539 314 194 3044 4240,8 2448,5 1263,4 24916 1279055,1
724 416,5 235 4036,5 6695 3770,8 1755,5 39001 2095628,6
Inter-county
In total
In total
Distance traveled, km
In total
CountyIn total
RouteOrdinal
number
Length,
km
Tariff
zone
Number of departures
Local

Vidan, L., Slavulj, M., Šojat, D. / Public Transport & Smart Mobility 2020, 39-49
49
transport is not only cost-effective, but it’s also better for environment and for future city growth. But for the
people to use public transport, it needs to be punctual, comfortable, fast, secure and cheap.
Local public transport in City of Velika Gorica is fairly spread given it contains 58 settlements. As a lot of those
settlements have a population smaller than 1000 residents, many of those routes aren’t economically effective but
if these routes didn’t exist, the conditions for residents wouldn’t be acceptable.
Based on conducted survey, the majority of passengers are unhappy with current public transport service, and the
greatest dissatisfactions are related to frequent bus delays, departure regularity and schedule adherence. With the
new timetables proposed for these three routes, based on the survey, the problem with regularity would be solved,
but the travel time problem wouldn’t, because in commuter periods, buses share the infrastructure with private
cars.
References
[1] Kušević D. Prijedlog poboljšanja prijevoza putnika na relaciji Velika Gorica – Zagreb (master's thesis).
Faculty of Transport and Traffic Sciences. Zagreb. 2017.
[2] Census of Population, Households and Dwellings 2011. Zagreb: Croatian Bureau of Statistics.
[3] Gradski ured za strategijsko planiranje i razvoj grada. Available at: https://www.zagreb.hr/gradski-ured-
za-strategijsko-planiranje-i-razvoj-g/821 [Accessed: November 10,2020]
[4] Prometis d.o.o. Prometna studija Grada Velika Gorica. Prometis d.o.o. Zagreb. 2010.
[5] Upravni odjel za komunalne djelatnosti i promet. Grad Velika Gorica. Available at:
http://www.gorica.hr/upravni-odjel-za-izgradnju-komunalne-djelatnosti-i-promet/ [Accessed: November
13,2020]

1st International Conference Public Transport & Smart Mobility
50
Smart Mobility

1st International Conference Public Transport & Smart Mobility
51
Sustainable Urban Mobility Boost Smart Toolbox
DOI: https://doi.org/10.7307/ptsm.2020.6
Marko Šoštarić1, Marijan Jakovljević1, Orsat Lale1, Krešimir Vidović2, Saša Vojvodić2
University of Zagreb Faculty of Transport and Traffic Sciences1; Ericsson Nikola Tesla2
Keywords:
Abstract Big data
Transport
planning
Commuter pattern
Urban mobility
Traffic system analysis and planning is a very complex process that requires quality input data
collected on a relevant sample and over a relevant time period. The project Sustainable Urban
Mobility Boost Smart Toolbox aims at development of the methodology (toolbox) in data rich
reality, which is combining traditional and novel data science approach for transport system
analysis and planning. It enables digital transformation of existing (traditional, ingrained)
analytic methodologies by novel utilization of mobile network infrastructure as urban mobility
data sources (spatio-temporal data on population migrations gathered from anonymized
mobile network logs) and data science capabilities. The project is funded by the EIT Urban
Mobility Regional Innovation Scheme RIS 2020.
The end product will provide transport planners with insight in spatial distribution of
commuters and their transport means. Also, it will propose methodology for the identification
and implementation of the measures for improvement of the transport system based on input
data. Primary goal of the Project is to provide universal methodology suitable for any city to
create sustainable transport system.
Introduction
In the context of the global problem of the excessive harmful impact of traffic system on the environment, and
especially transport in urban centres, the European Union prescribes numerous tenders for the co-financing of
scientific projects. One of those is the Urban Mobility Boost Smart Toolbox funded by the EIT Urban Mobility
Regional Innovation Scheme RIS 2020.
The toolbox aims at utilizing and combining both traditional and novel methodologies to determine key transport
findings and propose alternative, sustainable solutions in urban mobility domain. Traditional methodology
involves analysis of spatial characteristics of population migration obtained from classical research (field counting
and household/roadside interviewing). Novel methodology will utilize data science approach on telecom
originated anonymized big data sets, together with other available datasets for the case study. Proposed
methodology will be used to determine specific commuter patterns, and to identify transport demand that is being
realized by using ecologically non preferred modes of transport (personal cars). Also, the potential for
development of sustainable mobility services in order to address those migrations will be analyzed from various
perspectives (infrastructure for sustainable mobility, availability of public transport services etc.)
With a vision of achieving the main goal, the project team made of University of Zagreb Faculty of Transport and
Traffic Sciences, Ericsson Nikola Tesla and City of Rijeka developed and described a detailed scheme of a
universally applicable toolbox. To demonstrate the operational functionality of the toolbox, the project team
selected the City of Rijeka as an adequate city for the conduction of a case study.
The main part of the case study is conducted through big data collecting and traditional field research. The main
goal is to validate the big data with the field research results. In the next chapters the process and methods will be
described together with the results.
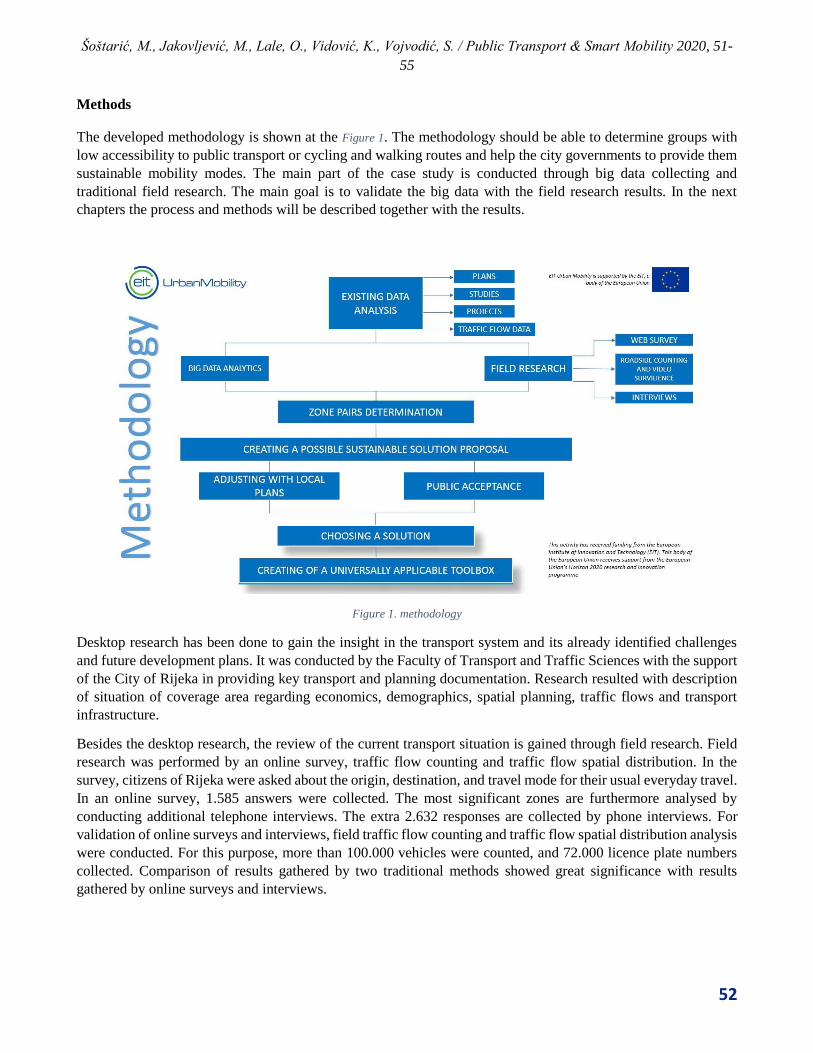
Šoštarić, M., Jakovljević, M., Lale, O., Vidović, K., Vojvodić, S. / Public Transport & Smart Mobility 2020, 51-
55
52
Methods
The developed methodology is shown at the Figure 1. The methodology should be able to determine groups with
low accessibility to public transport or cycling and walking routes and help the city governments to provide them
sustainable mobility modes. The main part of the case study is conducted through big data collecting and
traditional field research. The main goal is to validate the big data with the field research results. In the next
chapters the process and methods will be described together with the results.
Figure 1. methodology
Desktop research has been done to gain the insight in the transport system and its already identified challenges
and future development plans. It was conducted by the Faculty of Transport and Traffic Sciences with the support
of the City of Rijeka in providing key transport and planning documentation. Research resulted with description
of situation of coverage area regarding economics, demographics, spatial planning, traffic flows and transport
infrastructure.
Besides the desktop research, the review of the current transport situation is gained through field research. Field
research was performed by an online survey, traffic flow counting and traffic flow spatial distribution. In the
survey, citizens of Rijeka were asked about the origin, destination, and travel mode for their usual everyday travel.
In an online survey, 1.585 answers were collected. The most significant zones are furthermore analysed by
conducting additional telephone interviews. The extra 2.632 responses are collected by phone interviews. For
validation of online surveys and interviews, field traffic flow counting and traffic flow spatial distribution analysis
were conducted. For this purpose, more than 100.000 vehicles were counted, and 72.000 licence plate numbers
collected. Comparison of results gathered by two traditional methods showed great significance with results
gathered by online surveys and interviews.
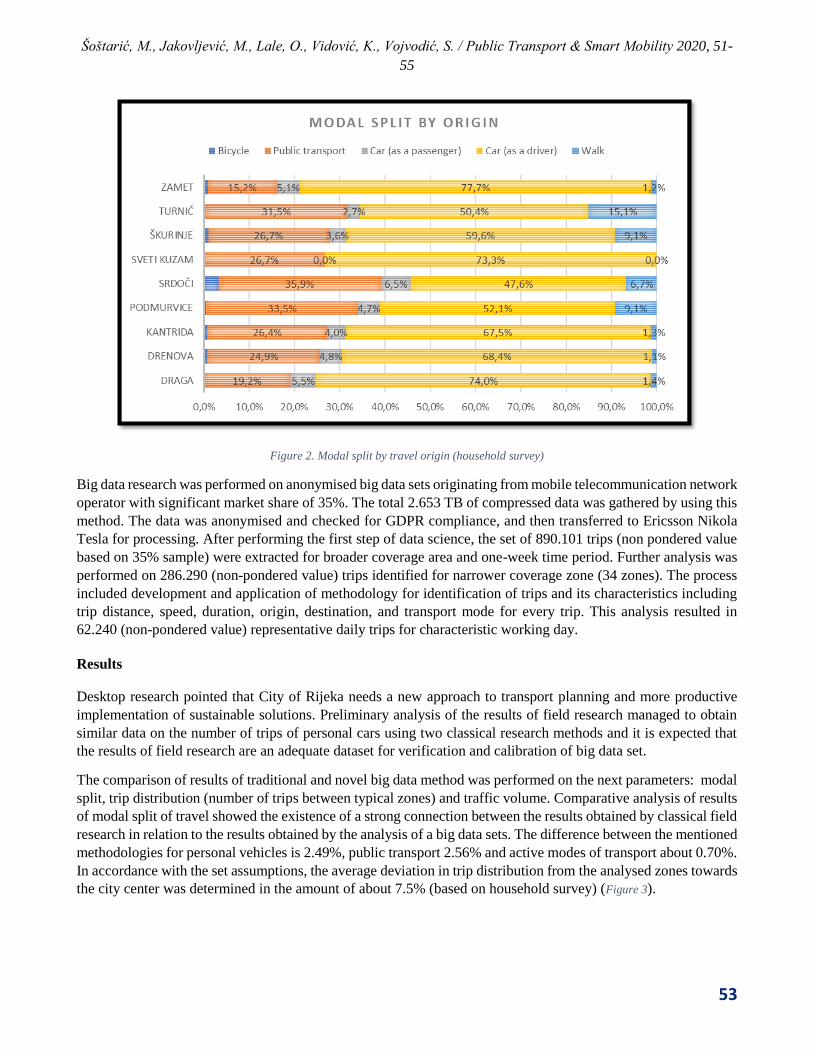
Šoštarić, M., Jakovljević, M., Lale, O., Vidović, K., Vojvodić, S. / Public Transport & Smart Mobility 2020, 51-
55
53
Figure 2. Modal split by travel origin (household survey)
Big data research was performed on anonymised big data sets originating from mobile telecommunication network
operator with significant market share of 35%. The total 2.653 TB of compressed data was gathered by using this
method. The data was anonymised and checked for GDPR compliance, and then transferred to Ericsson Nikola
Tesla for processing. After performing the first step of data science, the set of 890.101 trips (non pondered value
based on 35% sample) were extracted for broader coverage area and one-week time period. Further analysis was
performed on 286.290 (non-pondered value) trips identified for narrower coverage zone (34 zones). The process
included development and application of methodology for identification of trips and its characteristics including
trip distance, speed, duration, origin, destination, and transport mode for every trip. This analysis resulted in
62.240 (non-pondered value) representative daily trips for characteristic working day.
Results
Desktop research pointed that City of Rijeka needs a new approach to transport planning and more productive
implementation of sustainable solutions. Preliminary analysis of the results of field research managed to obtain
similar data on the number of trips of personal cars using two classical research methods and it is expected that
the results of field research are an adequate dataset for verification and calibration of big data set.
The comparison of results of traditional and novel big data method was performed on the next parameters: modal
split, trip distribution (number of trips between typical zones) and traffic volume. Comparative analysis of results
of modal split of travel showed the existence of a strong connection between the results obtained by classical field
research in relation to the results obtained by the analysis of a big data sets. The difference between the mentioned
methodologies for personal vehicles is 2.49%, public transport 2.56% and active modes of transport about 0.70%.
In accordance with the set assumptions, the average deviation in trip distribution from the analysed zones towards
the city center was determined in the amount of about 7.5% (based on household survey) (Figure 3).

Šoštarić, M., Jakovljević, M., Lale, O., Vidović, K., Vojvodić, S. / Public Transport & Smart Mobility 2020, 51-
55
54
Figure 3. Comparative analysis of travel distribution (household surveys)
A comparative analysis of daily distribution during the characteristic day of the week also revealed the existence
of strong connection between the results obtained by classical field research in relation to the results obtained by
the analysis of a big data sets (R2=96%).The results prove that using of presented big data science methods can
be appropriate for transport planning and that those methods can support or in some cases replace conventional
researches. For total replacement of traditional analysis by big data science, some further studies need to be
performed.
Based on big data and traditional analysis, five zones with significant usage of a personal car for daily commuting
are determined. The average percentage of personal car usage for daily commuting in City of Rijeka is 72% while
those five zones have a higher percentage. The reason for that increased usage of personal car is mostly the
unsuitability or the lack of public transport and the hilly terrain with lack of appropriate footpaths or cycling lanes
that restricts the use of bicycle or walking.
Discussion
During the validation of the big data, it was found that the big data set sometimes provides a more detailed database
than required for understanding of transport system. The big data detects all the trips that user makes during the
day. It records all type of movement, short trips within the zone or even short recreative walking. That kind of
movement are usually not the transport research objective.
Conclusion
The main results and conclusion are that approach that combines big data science methods with traditional
methodologies is appropriate and applicable for transport planning and that the symbiose of those methods can
significantly improve conventional researches. In addition to this positive conclusion the project has identified
additional potential for big data and data science methodology application in transportation planning, which will
be further researched and developed.

Šoštarić, M., Jakovljević, M., Lale, O., Vidović, K., Vojvodić, S. / Public Transport & Smart Mobility 2020, 51-
55
55
References
[1] City of Rijeka, “General Urban Plan of the City of Rijeka”, 2019.
[2] Primorje. Gorski Kotar county “Master Plan for the Development of the Transport System of the
Functional Region of North Adriatic”, 2018.
[3] Gonçalves, D. N. S., Gonçalves, C. D. M., Assis, T. F. De, & Silva, M. A. Da. (2014). Analysis of the
difference between the euclidean distance and the actual road distance in Brazil. Transportation Research
Procedia, 3(July), 876–885.
[4] Buczkowska, S., Coulombel, N., & Lapparent, M. De. (2016). Euclidean versus network distance in
business location: A probabilistic mixture of hurdle-Poisson models. Annals of Regional Science, (964),
21 p.

1st International Conference Public Transport & Smart Mobility
56
An implementation framework for developing cities – the way to
smart mobility
DOI: https://doi.org/10.7307/ptsm.2020.7
Beti Angelevska1, Vaska Atanasova1
Faculty of Technical Sciences, University “St. Kliment Ohridski”, Bitola, Republic of North Macedonia1
Keywords:
Abstract
smart mobility
developing cities
sustainability
environment
The smart mobility is a concept, where with various past and real-time data, and
with the help of information and communication technologies, travel time is
optimized, resulting in reductions of space usage, road congestion, road accidents
and emissions of harmful gases and noise. [1]
For implementation of smart mobility it will be necessary to combine sustainable
solutions and smart innovations at the same time. This will contribute for moving
forward in developing cities, which are lacking behind considering inclusion of
smart mobility in their urban transport systems. Also, smart mobility will
contribute for improved environmental footprint of urban transport, having in mind
that environmental issues (air pollution in particular) in these cities are very
serious. More specifically, the paper identifies implementation framework for
smart mobility, along with drivers and barriers for its implementation, as well as
strategies in transport that are environmentally friendly.
Turning carbon-dependent transport sector in developing cities into a clean and
smart mobility system might seem like a mission impossible. But, it can be done
and it is also a must, given the current transport system's impacts on the
environment and public health [2]. At the end, this is an indispensable opportunity
to start with changes and to build a better and sustainable future.
Introduction
The transport sector has substantial negative impacts on human health and the environment, causing air pollution,
noise pollution and habitat fragmentation [2]. The current mix of transport modes and fuels is simply not
sustainable. The goal is to build a clean, accessible, coherent, climate-resilient mobility system that greatly
contributes to quality of life and well-being.
Smart mobility is a part of the smart city concept, based on optimizing transport sector in urban areas. Optimizing
the mobility could be done by introducing new information and communication technologies with a goal to reduce
the economic, environmental and time costs. [1]
Developing cities are faced with serious problems: ineffective transport system from one side, and environmental
problems caused by that system, from the other. Changes are needed, not just to reduce the problems with
congestion, land use, accidents, traffic delays, fuel consumption etc, but also to modernize the whole transport
systems and to mitigate environmental impacts. Hence, innovation actions in developing cities should be directed
to integration of sustainable solutions and smart innovation into transport system operations. This framework is
elaborated in the paper, considering that development of the institutional and regulatory framework should
correspond to mobility policy and strategy in developing cities. Presented framework covers also drivers and
barriers to smart and sustainable mobility in developing cities, and through the example of the city of Skopje, and
integration between sustainable strategies and smart solutions is given, highlighting the expected benefits.

Anglevska, B., Atanasova, V. / Public Transport & Smart Mobility 2020, 56-62
57
Smart and innovative mobility
As mobility technologies are developing rapidly, technology investments will be only a stepping stone. Most
important, governments need a comprehensive approach in the entire transport ecosystem, which consists of six
elements (figure 1).
Figure 1. The six elements in the smart mobility ecosystem
Source: [3]
Smart mobility can combine different modes and options (public transport, car-sharing, car rental services, taxis
and a bicycle system) to cater for mobility needs by using IT, apps, and smart invoicing. Innovation and research
will certainly be one of the driving forces behind the transition towards smarter and cleaner mobility. [2]
Innovative solutions can actually challenge some of consumption patterns while still meeting the need for mobility
[2]. Innovation does not involve engine designs and energy efficiency only, but also covers new business and
ownership models.
Apart of this, smart mobility services and systems will need to interface with multi-sectoral and city-wide
strategies for optimizing the use of energy, spatial, economic and material resources [4].
Smart mobility and environment
In spite of modest, evolutionary innovations, transport continues to represent over 20% of CO2 emissions and is
projected to continue to rise significantly to 2050 [4]. Transport is responsible for a quarter of the EU's greenhouse
gas (GHG) emissions. More concretely, transport is the only major economic sector in Europe where GHGs have
increased since 1990 and is also the largest contributor to nitrogen oxides emissions, which harm health and the
environment. [2]

Anglevska, B., Atanasova, V. / Public Transport & Smart Mobility 2020, 56-62
58
The transport sector is estimated to be responsible for up to 50 percent of particulate emissions in developing
countries — compared to about 30 percent in developed countries — mostly due to diesel traffic [3].
Recent scenarios offer little confidence that the policy mix currently deployed towards mitigation will have
sufficient decarbonisation impact. Projections toward 2050 appear to offer a stabilisation of current absolute CO2
emissions from global transport at best and a rather more probable increase of CO2 emissions, albeit with a reduced
rate of increase. [4]
Global trends concerning local air quality, noise levels and climate change put immense societal pressure on
research and innovation activities in transport [5]. The overall direction of the transition is clear: towards a
combined emerging technologies at vehicles, infrastructure and transport system, as well as in-force regulation.
In short, integration of sustainable and smart solutions.
Smart mobility uses innovative digital technologies and solutions to create open and connected transportation
networks that can move people and freight more efficiently and sustainably than in the past. By making vehicles
and transportation infrastructure technology-enabled and data-informed, smart mobility has the potential to
transform society. [3]
Assessments of future development illustrate realistic possibilities to build online data systems with real time
information on three specific, transport related data streams [5]:
1. Service supply: on-line, real time information provided by transport suppliers on the main aspects of their
services (capacity, route, transfer time, price, etc.).
2. Infrastructure capacity: on-line information on real time traffic streams (intensity) and available
capacities of infrastructure, generated by dedicated ITS networks, built into vehicles and into rail/road
infrastructure.
3. Impact on climate/environment: on-line information on energy use and air quality/noise aspects of specific
transport choices, generated by combining info on chosen vehicle type, transportation mode, real time
traffic situation, etc.
A key requirement is for new mobility services to build on zero- and low-carbon technologies, and to contribute
to modal shift, efficient demand management and sustainable land use [4].
Smart mobility systems and services have the promise to contribute to the needed decarbonisation of the transport
sector and might also help address persistent problems of congestion and accessibility [4].
An example for implementation framework: the city of Skopje
Population growth and increased urbanization will only exacerbate environmental and health problems caused by
transport. Given the scope of the challenges, simply investing in more roads, bridges, and other traditional
infrastructure will not be enough. [3] Instead, governments need to rethink their approach to transport and focus
on smart mobility.
The city of Skopje is doing modest steps towards sustainability and smart mobility. Roundabounds, cycling and
walking paths are already a visible change in the city. Public transport is modernized with new vehicles (although
at fossil fuel), and provides real time passenger information and intelligent payment. Zone parking is in function
for several years, but smart solutions must further enforce the parking process. The “smartest” solution
implemented so far is the centre for traffic management and control, which uses video-cameras at every major
crossroad (52 in total), and provides 24 hours control of the traffic flows.
During the autumn-winter, the biggest environmental problem in the city is air pollution, especially with particles.
Their level is 6-9 times higher than allowed when the highest pollution occurs. Other environmental problems
(noise pollution, vehicle disposal) are also serious, and transport system additionally contributes for their

Anglevska, B., Atanasova, V. / Public Transport & Smart Mobility 2020, 56-62
59
deterioration. Hence, the city of Skopje needs to take more dedicated steps towards smart solutions, and this
proposed framework is a good starting point.
Developing cities can use smart mobility to reduce traffic congestion, increase road safety, improve the
environment, and make transport more accessible and affordable [3].
To use the benefits of smart mobility, and avoid or mitigate the problems, authorities need to learn to manage a
fast-moving set of technologies and solutions. They can develop the smart mobility ecosystem through a three-
step approach (figure 2).
Figure 2. Three steps to promote a smart mobility agenda
Source: [3]
As has been previously mentioned, integration between sustainability and smart mobility will provide expected
results. As an example for integration, table 1 lists various transport emission reduction strategies, considering
that currently air pollution is one of the major treats in the environment.
Presented emission reduction strategies are divided into two major categories: cleaner vehicles (more efficient
and alternative fuel vehicles which reduce per-mile emission rates), and mobility management. Cleaner vehicle
strategies reduce emission rates per vehicle-mile, while mobility management strategies reduce the total vehicle
travel.
Table 1: Transport emission reduction strategies
Source: [6]
It is clear that decarbonising transport sector will take time. It requires a combination of measures, including better
urban planning, technological improvements, a wider use of alternative fuels, stronger price signals, innovative

Anglevska, B., Atanasova, V. / Public Transport & Smart Mobility 2020, 56-62
60
research, continuous adoption of cutting-edge technology and stricter enforcement of existing rules. [2] It also
requires all investments in infrastructure and policy measures to be designed to this end.
Applying smart mobility will lead to broader benefits in several areas [3]:
Safer roads. Vehicle automation (either full or partial) and better safety technology can reduce the
number of traffic accidents, leading to fewer roadway fatalities and injuries.
Less traffic. Smart mobility can move vehicles and people more efficiently over existing roadway
networks with less congestion. It can also provide people with alternative options such as shared rides,
scooters, bicycles, or mass transit, leading to reduced travel times.
Cleaner environment. Smart mobility can lead to a reduction in negative environmental effects of the
transport sector by providing travellers and transport system operators with more environmentally friendly
options.
More effective workforce. Reinventing mobility will have an important effect on the workforce. Some
households will be able to move closer to urban areas (and dispose of private vehicles), increasing their
employment prospects and options. Others that choose to move farther away from urban centres can do
so as travel times decrease and as autonomous vehicles and other transit options allow commuters to be
productive while travelling.
Several developing cities have already incorporated smart mobility into their urban planning. The city of Skopje
and other developing cities could use their experience as a good base to build an experience of their own.
Smart and sustainable mobility in developing cities: drivers and barriers
Smart mobility that make broad use of digital technologies has been touted as possible solution for the population
pressures faced by many cities in developing countries and may help meet the rising demand for services and
infrastructure. Nevertheless, the high financial cost involved in infrastructure maintenance, the substantial size of
the informal economies, and various governance challenges are real obstacles regarding smart mobility. [7]
Rather than just investing in roads and public transit systems, governments need to consider all aspects of smart
mobility, including the user experience, transport modes currently in use, more advanced solutions still in
development, data and technology, infrastructure, and governance and regulation. Once they have such a
comprehensive approach as a foundation, governments need a three-part implementation framework [3]:
1. establish a policy and strategy for smart mobility
2. develop an institutional and regulatory framework
3. collaborate through partnerships and platforms.
The results from the systematic review suggest that eight important driving factors propel the rise of smart city
development in developing countries (table 2). Besides technology development, these drivers emphasise the
development of economic and financing capacity, as well as the strengthening of regulatory development, human
capital, and citizen engagement. In addition, the involvement of the private sector (which tends to have an edge
in technology and resources) in creating a supportive ecosystem that promotes innovation will further boost smart
city development in developing countries. [7]
Table 2: Drivers for smart mobility development in developing cities
financing capacity of the government
building a strong regulatory environment that fosters the confidence and trust of
citizens and investors
technology and infrastructure readiness
human capital
stability in economic development
active citizen engagement and participation
Anglevska, B., Atanasova, V. / Public Transport & Smart Mobility 2020, 56-62
61
knowledge transfer and participation from the private sector
creating the supportive ecosystem that promotes innovations and learning
Source: [7]
Smart mobility development in developing cities faces exclusive challenges that are fundamentally different from
those facing developed countries due to existing socioeconomic challenges (table 3).
Table 3: Barriers to smart mobility development in developing cities
budget constraints and financing issues
lack of investment in basic infrastructure
lack of technology-related infrastructure readiness
fragmented authority
lack of governance frameworks and regulatory safeguards for smart cities
lack of skilled human capital
lack of inclusivity
environmental concerns
lack of citizen participation
technology illiteracy and knowledge deficit among the citizens
Source: [7]
Governments need to step up their efforts to fulfil the basic infrastructure needs of citizens, raise more revenue,
construct clear regulatory frameworks to mitigate the technological risks involved, develop human capital, ensure
digital inclusivity, and promote environmental sustainability. A supportive ecosystem that encourages citizen
participation, nurtures start-ups, and promotes public–private partnerships needs to be created to realize their smart
mobility vision. [7]
Conclusion
Implementing smart technologies into real transport sector brings significant improvements in road safety,
congestion, accessibility and affordability, as well as in impact on the environment in general. The implementation
of the smart technologies is expected to increase in future years, depending on budgets and funding because of
higher awareness to use new and modern technologies in optimising system performance. [1]
Cleaner and smarter transport can actually meet need for mobility, and at the same time deliver many public health
benefits, including cleaner air, fewer accidents, less congestion and less noise pollution [2].
This is very important for developing cities, who already struggle with all these problems together with the lack
of financial support to implement smart measures. Hence, this presented framework for implementation of smart
and sustainable solutions could serve as a starting point with a potential to change behaviour of the authorities and
the public toward smart mobility.
City authorities should conduct a thorough assessment of their current mobility challenges to identify the most
urgent problems and pain points. They could also use the offered framework, additionally making benefits of the
drivers and avoiding barriers to smart mobility.
Next, city authorities need to establish broad policies for the deployment of smart mobility technologies. These
policies can be part of a broader national transport vision or, in the absence of a national plan they can become a
building block for governments to begin developing such a vision. [3] Every developing city should build a
sustainable, smart and comprehensive mobility system that caters to mobility needs by offering a service tailored
to user requirements.
Although still in the early stages of development, smart mobility has already changed the way people, goods, and
services move. Used correctly, it can reshape cities and transform society. [3]

Anglevska, B., Atanasova, V. / Public Transport & Smart Mobility 2020, 56-62
62
References
[1] Brčić, D., Slavulj, M., et al. The role of smart mobility in smart cities. 5th International Conference on
Road and Rail Infrastructure CETRA 2018. 17-19 may 2018, Zadar, Croatia. 1601-1606. DOI:
https://doi.org/10.5592/CO/CETR A.2018.812.
[2] European Environmental Agency. Towards clean and smart mobility - Transport and environment in
Europe. EEA SIGNALS 2016, 2443-7662. ISBN 978-92-9213-739-7. ISSN 2443-7662. DOI:
10.2800/090074. Copenhagen, Denmark. 2016.
[3] Strategy& - Part of the PwC network. Smart mobility in GCC cities - Fast track to the future. Strategy&.
Dubai, UAE. 2019.
[4] European Commission. Smart Mobility and services, Expert group report studies and reports. EUR KI-
02-17-940-EN-N. EPUB ISBN 978-92-79-71850-2. ISSN KI-01-17-928-EN-N. DOI: 10.2777/490085.
Brussels, Belgium. 2017.
[5] Hofhuis, P., Luining, M., Rood, J. EU Transition Towards Green and Smart Mobility - Action Toolbox to
Unleash Innovation Potentials. Clingendael Report. Netherlands Institute of International Relations.
Hague, The Netherlands. 2016.
[6] Litman, T., Smart transportation emission reduction strategies identifying truly optimal ways to conserve
energy and reduce emissions. Victoria Transport Policy Institute. Victoria, Canada. 2017.
[7] Tan, S., Y., Taeihagh, A. Smart city governance in developing countries: a systematic literature review.
Sustainability 2020, 12, 899, 1-29. DOI:10.3390/su12030899.

1st International Conference Public Transport & Smart Mobility
63
CAFE regulations and the overview of the passenger car market
within the European Union
DOI: https://doi.org/10.7307/ptsm.2020.8
Luka Međurečan1, Matija Sikirić2
Gašparić Grupa1, Faculty of Transport and Traffic Sciences2
Keywords:
Abstract CAFÉ regulation
Passenger vehicle
Vehicle emission
Vehicle market
European Union
Vehicles with internal combustion engines (ICE) currently represent the most
prevalent form of road transport. Although level of emission per vehicle have
drastically decreased, their emissions have significant impacts on the environment
and health. The emergence of vehicles powered by more environmentally friendly
systems has resulted in a change in perceptions, as they result in a reduction in
pollution and other negative impacts of the transport system. It is for this reason
that the goal has been set, to reduce the market for vehicles with only internal
combustion and focus on encouraging the purchase of more sustainable options.
The aim of this paper is to review the regulations in the field of passenger car
markets in the European Union, and to establish historical trends, as well as to
identify goals for future market development.
Introduction
Vehicles with internal combustion engines (ICE) currently represent the most prevalent form of road transport.
Although level of emission per vehicle have drastically decreased, their emissions have significant impacts on
the environment and health.
The transport sector represents more than a quarter of Europe’s greenhouse gas emissions, with over 70% of
transport emissions coming from road transport. [1] Internal combustion engine (ICE) vehicles are also key
sources of air pollution, such as particulate matter (PM) and nitrogen oxides (NOx). [2]
In Europe, authorities in the United Kingdom, France, Germany, Ireland, the Netherlands and Norway have
declared their intention to implement bans on the sale or registration of new ICE vehicles with starting dates
ranging from 2030 to 2040. Moreover, many countries have already adopted purchase or tax incentive
programs for electric vehicles (EV): 24 Member States currently offer some form of tax incentive, while 12
offer bonus payments or premiums to buyers.
CAFÉ regulative
CAFE regulative stands for Clean Air for Europe programme (CAFE). The CAFE programme was established
to support the European Commission’s development of the Thematic Strategy on air pollution, the Directive
on Ambient Air Quality and Cleaner Air for Europe and its Impact Assessment. [3]
In total passenger ICE vehicles are responsible for around 12% of total EU emissions of carbon dioxide (CO2),
the main greenhouse gas. Regulation (EC) 443/2009, set mandatory emission reduction targets for new cars.
The first target fully applied from 2015 onward and a new target will be phased in in 2020 and fully apply
from 2021 onward. On 17 April 2019, the European Parliament and the Council adopted Regulation (EU)
2019/631 which introduces CO2 emission performance standards for new passenger cars and new vans for
2025 and 2030. The new Regulation started applying on 1 January 2020 and has replaced and repealed
Regulation (EC) 443/2009. [3]

Međurečan, L., Sikirić, M. / Public Transport & Smart Mobility 2020, 63-72
64
Target 2015
Following a phase in from 2012 onward, a target of 130 grams of CO2 per kilometre applied for the EU fleet-
wide average emission of new passenger cars between 2015 and 2019. Emissions of 130 g CO2/km correspond
to a fuel consumption of around 5.6 litres per 100 km (l/100 km) of petrol or 4.9 l/100 km of diesel. This EU
fleet-wide target was already reached in 2013, two years ahead of schedule. The average emissions of new
cars registered in 2019 in the EU28, Iceland and Norway were 122.4 g CO2/km (provisional EEA data). [4]
Target 2020-21
From 2021, phased in from 2020, the EU fleet-wide average emission target for new cars will be 95 g CO2/km.
This emission level corresponds to a fuel consumption of around 4.1 l/100 km of petrol or 3.6 l/100 km of
diesel. [4]
Specific emission targets for manufacturers
The binding emission targets for manufacturers are set according to the average mass of their vehicles, using
a limit value curve. This means that manufacturers of heavier cars are allowed higher emissions than
manufacturers of lighter cars. The curve is set in such a way that the targets for the EU fleet-wide average
emissions are achieved. [3]
In 2020, the emission targets will apply for each manufacturer’s 95% least emitting new cars. From 2021
onward, the average emissions of all newly registered cars of a manufacturer will have to be below the target.
[4]
Phase-in of requirements
The target of 130 g/km was phased in between 2012 and 2015. A phase-in period will also apply to the target
of 95 g/km. In 2020, the emission targets will apply for each manufacturer’s 95% least emitting new cars.
From 2021 on, the average emissions of all newly registered cars of a manufacturer will have to be below the
target. [4]
Penalty payments for excess emissions
If the average CO2 emissions of a manufacturer's fleet exceed its target in a given year, the manufacturer has
to pay an excess emissions premium for each car registered. Since 2019, the penalty is €95 for each g/km of
target exceedance. [4]
Eco-innovations
To encourage eco-innovation, manufacturers can be granted emission credits for vehicles equipped with
innovative technologies for which it is not possible to demonstrate the CO2-reducing effects during the test
procedure used for vehicle type approval. Such emission savings must be demonstrated based on
independently verified data. The maximum emission credits for these eco-innovations per manufacturer are 7
g/km per year. [5]
The eco-innovations mechanism rewards innovative technologies that produce real-world CO2 savings
beyond what is measured over the standardized test cycle during vehicle type approval. Because CO2 savings
from eco-innovation technologies count toward manufacturers’ CO2 targets, manufacturers have an incentive
to develop and deploy cost-effective eco-innovations to meet CO2 standards. In theory, providing credits to
manufacturers for technologies that reduce real-world emissions can both reduce the cost of complying with
the CO2 standards and increase total real-world reductions. However, if estimated eco-innovations CO2
savings exceed the amount of real-world reductions, or if credits are given that double-count CO2 reductions

Međurečan, L., Sikirić, M. / Public Transport & Smart Mobility 2020, 63-72
65
on the type-approval test, they can become a loophole and erode the benefits of the CO2 standards. Thus, it is
critical to properly account for the real-world benefits of eco-innovations. [5]
Table 1. List of approved eco-innovations
Company Eco-innovation Company Eco-innovation
Audi LED lights DENSO Efficient alternator
Valeo Efficient alternator Toyota LED lights
Daimler Engine compartment
encapsulation system
Mitsubishi Electric
Corporation
Efficient alternator
Bosch Adaptive state of charge
control in hybrids
Bosch Efficient alternator
Automotive
Lighting
Reutlingen
LED lights Valeo Efficient alternator
DENSO Efficient alternator MAHLE Behr Enthalpy storage tank
Webasto Roof &
Components
Solar roof Honda LED lights
Bosch Efficient alternator Mazda LED lights
Bosch Efficient alternator Toyota LED lights
Daimler LED lights a2solar Solar roof
Asola
Technologies
Solar roof Valeo Efficient alternator
Mitsubishi Electric
Corporation
Efficient alternator BMW Coasting function
Porsche Coasting function Source: [5]
Super credits
Manufacturers are given additional incentives to put on the market zero- and low-emission cars emitting less
than 50 g/km through a “super-credits” system. This already applied between 2012 and 2015 and will apply
again for the period 2020-2022. [4]
For the purpose of calculating a manufacturer’s average specific emissions, such cars will then be counted as
[4]:
2 vehicles in 2020;
1.67 vehicles in 2021;
1.33 vehicles in 2022.
A cap on the super-credits is set at 7.5 g/km per manufacturer over the three years. [4]
Manufacturer Pools
Manufacturers can group together and act jointly to meet their emissions target. In forming such a pool,
manufacturers must respect the rules of competition law. Passenger cars and vans ('light commercial vehicles')
are responsible for around 12% and 2.5%, respectively, of total EU emissions of carbon dioxide (CO2), the
main greenhouse gas. [6]

Međurečan, L., Sikirić, M. / Public Transport & Smart Mobility 2020, 63-72
66
Benefits
The new Regulation will [6]:
contribute to the achievement of the EU's commitments under the Paris Agreement;
reduce fuel consumption costs for consumers;
strengthen the competitiveness of EU automotive industry and stimulate employment.
Expected benefits include [6]:
a 23% reduction of greenhouse gas emissions from road transport in 2030 compared to 2005. This
will support Member States in meeting their national targets under the Effort Sharing Regulation;
savings for consumers of around €1,100 over the lifetime of an average new car bought in 2030 and
nearly €4,000 for an average new van;
positive impacts on employment across the overall economy, with around 60,000 jobs created by 2030
and up to 80,000 if batteries are produced in the EU;
a smooth and gradual transition towards zero-emission mobility allowing for sufficient time to provide
for an adequate reskilling and reallocation of workers in the automotive sector;
a signal for investors in refuelling and recharging infrastructure, which will ensure that the enabling
conditions for deploying zero- and low-emission vehicles are fulfilled.
Target levels
Regulation (EU) 2019/631 sets new EU fleet-wide CO2 emission targets are set for the years 2025 and 2030,
both for newly registered passenger cars and for newly registered vans. These targets are defined as a
percentage reduction from the 2021 starting points [6]:
Cars: 15% reduction from 2025 on and 37.5% reduction from 2030 on;
Vans: 15% reduction from 2025 on and 31% reduction from 2030 on;
The specific emission targets for manufacturers to comply with, are based on the EU fleet-wide targets,
considering the average test mass of a manufacturer's newly registered vehicles. [6]
In-service verification
Manufacturers are required to ensure correspondence between the CO2 emissions recorded in the certificates
of conformity of their vehicles and the CO2 emissions of vehicles in-service measured according to the
Worldwide Harmonised Light Vehicle Test Procedure (WLTP). This correspondence shall be verified by type-
approval authorities in selected vehicles. The authorities shall also verify the presence of any strategies
artificially improving the vehicle’s performance in the type-approval tests. [6]
Based on their findings, type-approval authorities shall, where needed, ensure the correction of the certificates
of conformity and may take other necessary measures set out in the Type Approval Framework Regulation.
Deviations found in the CO2 emissions of vehicles in service shall be reported to the Commission, who shall
take them into account for the purpose of calculating the average specific emissions of a manufacturer. [6]
Real-world emissions
To prevent the gap between emissions tested in the laboratory and real-world emissions from increasing, the
Commission shall, from 2021 on, regularly collect data on the real-world CO2 emissions and energy
consumption of cars and vans using the on-board fuel consumption monitoring devices (OBFCM).
The Commission shall monitor how that gap evolves between 2021 and 2026 and, on that basis, assess the
feasibility of a mechanism to adjust the manufacturer’s average specific CO2 emissions as f 2030. The detailed
procedures for collecting and processing the data shall be adopted by means of implementing acts. [6]

Međurečan, L., Sikirić, M. / Public Transport & Smart Mobility 2020, 63-72
67
Life-cycle emissions
By 2023, the Commission shall evaluate the possibility of developing a common methodology for the
assessment and reporting of the full life-cycle CO2 emissions of cars and vans. [6]
Commission shall review
The Commission shall review the effectiveness of the Regulation and report on this to the European Parliament
and the Council.
This review shall cover the following [6]:
real world representativeness of the CO2 emission and energy consumption values,
deployment of ZLEV,
roll-out of recharging and refuelling infrastructure,
role of synthetic and advanced alternative fuels produced with renewable energy,
emission reductions observed for the existing fleet,
ZLEV incentive mechanism,
impacts for consumers,
aspects related to the just transition,
impacts for consumers, aspects related to the just transition,
2030 targets and identification of a pathway for emission reductions beyond 2030.
As part of the review, the Commission shall assess the feasibility of developing real-world emission test
procedures, as well as the possibility to assign revenues from the fines to a specific fund or relevant programme
with the objective to ensure a just transition towards a climate neutral economy.
Finally, the Commission shall review the Car Labelling Directive by end 2020, covering both CO2 and air
pollutant emissions of cars and evaluating the options for introducing a fuel economy and CO2 emissions label
for vans. [6]
In 2018, new car registrations in the EU remained roughly constant at 15.1 million. Possibly due to consumer
uncertainty concerning Brexit, sales in the United Kingdom (UK) dropped by 7 % compared to 2017. During
the same time period, the market in Spain expanded by 7 %. By far the strongest growth in vehicle sales took
place in the sport utility vehicle (SUV) segment. Approximately 5 million new cars in 2018 were SUVs, more
than 8 times as many as in 2001. At the same time, small diesel, small gasoline, and medium-sized diesel
vehicles – all with comparatively low CO2 emission values – lost more than 15 percentage points from 2015
to 2018. These relatively small vehicles were replaced by medium-sized gasoline vehicles and SUVs. The
increase in the latter group was particularly problematic for fleet-average CO2 reductions, because SUVs had
comparatively high CO2 emission values. [7]
In the aftermath of the Dieselgate scandal, sales of new diesel cars dropped significantly. In 2011–2012, about
55 % of newly registered cars in the EU were powered by diesel fuel, an all-time high. Since then, the market
share of diesel vehicles decreased slowly, to 49 % in 2016, but then declined more quickly, to 36 % in 2018.
In France, where the diesel market share used to be significantly higher than the EU average, the market share
dropped from a high of 77 % in 2008 to 39 % by 2018. This decline in diesel car sales began before Dieselgate
and is likely related to the fact that the French government is equalizing taxes on diesel and gasoline fuel. In
Germany, on the other hand, the diesel market share remained stable from 2011 to 2015 at about 48 % but
began dropping noticeably towards the end of 2016, declining to 30 % in late-2018. This recent decrease in
diesel car sales is likely due to a loss in trust from consumers who are increasingly concerned about the threat
of diesel bans in urban areas. [7]

Međurečan, L., Sikirić, M. / Public Transport & Smart Mobility 2020, 63-72
68
Figure 1. Historical development of the new car diesel market share in selected European member states
Source: [7]
Figure 2. Market share of diesel vehicles (in %)
Source: [7]
Within ten years, the diesel market share dropped from an EU-average of 52% in 2008 to 36% in 2018. The
decline of diesel has been particularly strong since ‘Dieselgate’ was uncovered in 2015. Today, only Volvo,
Mercedes-Benz and BMW still sell more than 50% of their new cars as diesel. On the other end of the
spectrum, Toyota and Suzuki have successfully phased out new diesel vehicles. [7]

Međurečan, L., Sikirić, M. / Public Transport & Smart Mobility 2020, 63-72
69
Figure 3. Diesel share of new car registrations by brand, 2008 to 2018.
Source: [7]
The vast majority of Europe’s new cars are powered by gasoline or diesel motors. The market share of hybrid
electric vehicles (HEV) in the EU was 3 % of all new car sales in 2018. Sales of HEVs increased in particular
in Finland, where the market share increased to 9 % in 2018. Toyota continues to dominate the market for
HEVs in Europe, with about 58 % of all new Toyota vehicles in 2018 being hybrid electric. In 2018, plug-in
hybrid (PHEV) and battery electric vehicles (BEV) each made up about 1 % of new vehicle registrations in
the EU. Top EU markets include Sweden, where 6 % of new sales were PHEVs, and the Netherlands, where
5 % of new sales were BEVs. Outside the EU, sales of electric vehicles are particularly high in Norway, where
18 % of new cars sold in 2018 were PHEV, 31 % were BEV, and an additional 11 % were HEV. [7]
In terms of manufacturer brands, BMW was among the top sellers of PHEVs in 2018, with 5 % of its new cars
being equipped with this technology. Nissan led sales of BEVs models, with 6% of the brand’s sales being
battery electric. An analysis of the compliance options for selected manufacturers shows the respective 2021
CO2 targets can be met by deploying an increased share of electric vehicles. For a company such as BMW, it
is estimated that by 2021 a market share of about 13 % of PHEV and BEV will be required. [7]
The total market share of hybrid electric cars was 3 % in 2018. Sales went up particularly in Finland, where it
reached 9 % in 2018. Hybrid electric cars were also relatively popular in Ireland, Spain and Sweden, with each
having a 6 % market share (Figure 4). Nearly 60 % of all new vehicles manufactured by Toyota which are
sold in the EU are hybrid electric. Sales of plug-in hybrid and battery electric vehicles each accounted for 1
% of all new cars in 2018. Plug-in hybrid cars were particularly successful in Sweden (6 %) and for the BMW
brand (5 %). Battery electric vehicles reached the highest market share in the Netherlands (5 %) and for the
Renault brand (3 %) (Figure 6.). [7]

Međurečan, L., Sikirić, M. / Public Transport & Smart Mobility 2020, 63-72
70
Figure 4. Market share of hybrid electric vehicles (in %)
Source: [7]
Figure 5. Market share of plug-in hybrid electric vehicles (in %)
Source: [7]
Figure 6. Market share of battery electric vehicles (in %)
Source: [7]

Međurečan, L., Sikirić, M. / Public Transport & Smart Mobility 2020, 63-72
71
Fuel consumption and CO2 emissions
The official level of average carbon dioxide (CO2) emissions from new passenger cars in the EU, as measured
in the laboratory via the New European Driving Cycle (NEDC) type-approval test procedure, increased to 120
grams per kilometer (g/km) in 2018, which is 2 g/km higher than in the previous year (Tietge, 2019). As CO2
emissions and fuel consumption are directly linked, this implies a fleetwide average fuel efficiency of 5
liters/100 km. Before CO2 standards were introduced, emissions of new passenger cars in the EU, on average,
declined by 1.2 % per year from 2000 to 2007. When the first mandatory CO2 standards were agreed upon in
2008, manufacturers significantly outperformed the annual reduction rates required to meet the 2015 target of
130 g/km; instead of the required 2.5 % annual reduction, average CO2 emissions declined by 3.5 % per year.
After 2015 targets were met, and in the absence of targets before 2020, average CO2 emissions increased by
0.3 % per year. As of 2018, fleet-average CO2 emissions will have to decline by 7.6% per year to comply with
the 2021 target. Manufacturers will likely rely to a larger degree on flexible compliance mechanisms such as
super-credits and eco-innovations to comply with 2020/21 targets. [8]
Figure 7. Emissions from new passenger cars in the EU
Source: [8]
Planned national sales or registration bans
National sales or registration bans have been officially announced in a number of Member States in the last
few of years. In 2017, Norway (which as an EEA member takes part in the Single Market) adopted the goal
that all new cars sold by 2025 should be zero-emission vehicles (electric or hydrogen), equating to a sales ban
on all ICE vehicles by that date18. The Netherlands have also set a similar target for 203019, as well as
Ireland20, while Scotland aims to achieve this by 203221, and Britain22 and France23 by 2040. It should be
noted that these targets are mostly only laid out in strategic documents and do not have legal force. The French
target was however formally adopted on 19 November 2019, setting into law the objective of ending sales of
passenger cars and light commercial vehicles using fossil fuels by 2040. No plans have currently been
announced to ban ICEs for heavy-duty vehicles. [4]
Conclusion
Vehicle market, both passenger and commercial, is rapidly and indisputably changing. With the new
innovations and ecological requirements for better and cleaner environment, there is no place for stagnation
on one of the most competitive market in the world.

Međurečan, L., Sikirić, M. / Public Transport & Smart Mobility 2020, 63-72
72
Although increase in sales of “clean” vehicles as hybrids, plug in hybrids and battery electric vehicles are
closely tied to the government incentives, local regulations and fuel prices, constant rise of sales numbers is
observed.
Evan in highly challenging 2020, electric and plug in hybrid vehicles saw increase in sales. Not only in terms
of their market share, but also in absolute terms. In Germany, EV sales from January to June increased from
47,584 in 2019 to 93,848 in 2020, supported by particularly strong PHEV growth.
With the automotive world changing, CAFE regulative are perfectly reflecting current trends. With the next
year determined as the benchmark, CO2 targets are defined as a percentage reduction from the 2021. -
15% reduction for 2025 on and 37.5% reduction for 2030.
Ecology is becoming one of the major factors of automotive industry with lot of manufactures supporting the
trend and trying to become carbon neutral.
References
[1] European Environment Agency. Greenhouse gas emissions from transport in Europe. Available at:
https://www.eea.europa.eu/data-and-maps/indicators/transport-emissions-of-greenhouse-
gases/transport-emissions-of-greenhouse-gases-12 [Accessed: October 15, 2020]
[2] European Environment Agency. Air quality in Europe — 2019 report. EEA. Denmark. 2019.
[3] European Commission. CAFE Reference Documents. Available at:
https://ec.europa.eu/environment/archives/cafe/general/keydocs.htm [Accessed: October 10, 2020]
[4] European Commission. Reducing CO2 emissions from passenger cars - before 2020. Available at:
https://ec.europa.eu/clima/policies/transport/vehicles/cars_en [Accessed: October 10, 2020]
[5] International Council on Clean Transportation. Overview and evaluation of eco-innovations in
European passenger car CO2 standards. Icct. Washington. 2018.
[6] European Commission. CO₂ emission performance standards for cars and vans (2020 onwards).
Available at: https://ec.europa.eu/clima/policies/transport/vehicles/regulation_en [Accessed: October
05, 2020]
[7] International Council on Clean Transportation. European vehicle market statistics: Pocketbook
2019/20. Icct. Berlin. 2019.
[8] International Council on Clean Transportation. CO2 emissions from new passenger cars in Europe:
Car manufacturers’ performance in 2019. Icct. Berlin. 2020.

Toš, I. / Public Transport & Smart Mobility 2020, 73-78
73
Use of technology in improving urban transport
DOI: https://doi.org/10.7307/ptsm.2020.9
Iva Toš1
City of Zagreb, 1
Keywords:
Abstract Smart city
Smart solution
Technology
Urban
development
People must be able to move around to meet their basic needs, but also additional
needs that include rest and recreation. The growing trend of urbanization leads to
population growth in cities, and thus to an increase in demands on the transport
system in cities, with the achievement of sustainable urban mobility as one of the
key challenges. Cities worldwide have started to look for solutions which enable
transportation linkages, mixed land uses and high-quality services with long – term
positive effect on the economy. Today cities are flooded with a range of data, both
useful and useless. In that large database, city administration should recognize the
importance of processing, analyzing and mathematical-statistical processing. Each
city should determine its vision, goals and strategies of transforming itself and
developing smart services at basis of collected data and their processing. Future
initiatives of a smart city and smart transportation should be focused on creating
efficient, environmentally friendly transport, based on interactive solutions for
smartphones. There are a lot of applications and technologies that contribute to
smart cities. Although technology is evolving every day, there is always room for
improvement by using available data, smart management and individual approach
to each city, it is possible to achieve an improvement in public transport services,
which would also improve the quality of life in urban areas.
Introduction
The growing trend of urbanization leads to population growth in cities, and thus to an increase in demands on
the transport system in cities, with the achievement of sustainable urban mobility as one of the key challenges.
Existing mobility systems cannot respond to the increased demand for transport. Cities have so far mostly
addressed these challenges in the traditional way, almost exclusively by increasing capacity, but such an
approach is neither effective nor sustainable in the long run. With growing demand, mobility requirements are
changing and evolving, and users’ needs for unlimited and efficient movement are growing. A holistic
approach to urban mobility is needed so it can optimize supply and demand solutions in order to implement
the most sustainable solutions possible. It also requires a shift from a reactive approach to urban mobility to a
more proactive model that anticipates future changes and trends and takes advantage of new solutions. New
ways of managing urban mobility, innovative financing, regulatory support and citizen involvement must be
drivers of change.
Definition of Smart city
Cities play prime role in social and economic aspect worldwide and have huge impact on the environment. As
a result, nowadays most resources are consumed in cities, contributing to their economic importance, but also
to their poor environmental performance. The current scenario requires finding ways to manage new
challenges. Cities worldwide have started to look for solutions which enable transportation linkages, mixed
land uses and high-quality services with long – term positive effect on the economy. For instance, high –
quality and more efficient public transport that responds to economic needs and connects labor with
employment is considered a key element for city growth. Many of the new approaches related to urban services
have been based on harnessing technologies, helping to create smart cities. [1]

Toš, I. / Public Transport & Smart Mobility 2020, 73-78
74
Mobility is a function of individuals, communities and economic activities. People must be able to move
around to meet their basic needs, but also additional needs that include rest and recreation. In cities, high
quality mobility is necessary for the successful functioning of various sectors and the creation of new jobs,
and it also plays a key role in creating an attractive environment for citizens and the business community. At
the same time, effective mobility is one of the main challenges facing cities in terms of increased demands,
often in the context of existing (inadequate) infrastructure, while increasing citizens' awareness of newly
available technologies that are more environmentally friendly and efficient. [2]
The fact that cities are becoming drivers of development, regional, national and international economic centers
and centers of social development, it is further complicating the mobility context. The combined impact of
population growth, demographic change and urbanization increases the need to travel to urban centers, suburbs
and between them. As the need for mobility grows, so does the awareness and fear of increasing levels of
greenhouse gas emissions and noise, as well as air pollution, to which traffic contributes significantly. [2]
The smart mobility system requires the availability of infrastructure, including physical infrastructure,
communication and information infrastructure, IoT platform, application level etc. Without the proper
representation of all components of this system, smart mobility solutions cannot fulfill their full potential to
manage operational efficiency and user demand. Coordination and integration between the various
components in the structure is extremely important. [2]
Smart cities must offer effective intelligent mobility solutions while supporting innovation, promoting a
cooperative ecosystem and achieving sustainability goals. These challenges are part of the rapidly changing
landscape of urban mobility as seen through the perspective of a smart city planner. Strategies for addressing
the challenges of urban mobility and solving the problems of urban mobility are specific from city to city and
include [7]:
Developing effective, balanced, safe and secure public transport systems, including Mobility-as-a-
Service (MaaS) and other platforms,
Adaptation to the innovation and acceptance of vehicles (autonomous, connected, electric, communal,
station-less),
Develop guidelines and strategies to promote compliance with air quality standards and other
measures to improve the quality of life,
Development of public-private partnerships (PPPs) and cooperation with knowledge institutes to
address issues of air quality, traffic congestion and sustainability,
Building a sustainable infrastructure - physical and digital - to support innovative mobility solutions
from the public and private sectors.
Smart data
Today cities are flooded with a range of data, both useful and useless. In that large database, city administration
should recognize the importance of processing, analysis and mathematical-statistical processing. Growth and
development of smart city is based on smart decisions that come from the collecting and processing of smart
data. Data needs to be collected systematically and connected with certain city services, transport, traffic,
infrastructure, etc. Smart data should enable faster and more rational action in sectors where it is necessary
and will prevent waste of resources in parts where the concept of a smart city would not be successful. Each
city should determine its vision, goals and strategies of transforming itself and developing smart services at
basis of collected data and their processing. What is good and purposeful in one city, is not necessarily good
and profitable in another.
Smart data is not just data needed by city administrations. Their clear and transparent opening to the public
makes it easier and faster for investing, making economic and private decisions, making everyday life easier
to every citizen. Digital availability, special network interfaces, applications, e-government, e-administration
- these are all parts of the collection and presenting smart data in smart city. [3]
In fact, smart data makes up the basic interface and infrastructure for creating a smart city. Today digital data
processing also enables theirs spatial visualization based on real infrastructural and social flows some city.

Toš, I. / Public Transport & Smart Mobility 2020, 73-78
75
GIS database and GIS smart data processing a simple way allows the visualization of city problems as the city
administration so do their inhabitants. The goal of smart data visualization and analysis is facilitate decisions
on the growth and development of a city, its potential, his weaknesses and strengths. [3]
From all the above it is clear that today in the era of modern technologies, smart data, smartphones, mobile
networks and the Internet there is need for rational, statistically correct data collection, their processing by
visualization in order to make decisions based on profession and science, and not based on undefined policy
or instinct. [3]
Smart urban transport
Residents and visitors (guests and tourists) primarily need high and fast mobility. Urban mobility should meet
safety standards and be easy to use. Cars, trains, buses, bicycles and motorcycles are basic concept of
participation in transport within an urban metropolitan area. Systems of public and private transportation are
interconnected and interactive. In that interaction, in the absence of constructive smart solutions, there is an
impression of disorganization, and occasionally in some larger cities and chaos in traffic. However,
transportation solutions within a city mostly depend on the size of that city. Cities with higher population
density traditionally make greater efforts to develop local public transport. On the other hand, the size of the
city and the higher population density lead to inefficiency of certain areas such as transport, security or
consumption of energy, which makes it less smart, but creates more potential for using technologies in solving
problems.
Common public transport problems such as inefficient timetables, wrong stops, dirty vehicles, unforeseen
delays, poor Air conditioning, poor maintenance, are part of everyday life. Future initiatives of a smart city
and smart transportation should be focused on creation efficient, environmentally friendly transport, based on
interactive solutions for smartphones with options such as ticket payment, selecting the fastest line,
notification of delays and technical problems etc. One of the biggest problems cities face in the domain of
transport, and especially tourist cities, is parking. Great efforts and a significant part of smart solutions cities
should focus on controlling and monitoring of parking spaces with effective software and interactive solutions
that direct traffic and parking with a goal of reducing traffic jams.
The concept of smart cities in the domain of public and private transport should rely on software and
technology solutions that improve the existing infrastructure facilitate management and improve
transportation information system and make it interactive. Examples of such solutions can be found in many
cities, such as: mobile parking fees, car rental applications, interactive smartphone applications containing an
integrated public transport and ticket charging system, smart cameras and sensors to identify free parking
spaces, traffic jams, traffic diversions, etc.
Although it can’t be said that some city is smart only because of the level of using technology, the future of
technology development and its integration into all city systems is actually one of the foundations of how a
city becomes smarter. All potentially good, smart and simple solutions start from digital infrastructure and its
availability. What a smart city concept should ensure is stable digital infrastructure and simple, fast and
inexpensive access to it, in a way that is acceptable to all (population, guests and tourists and companies). The
requirement of a smart city concept is that there is a physical networking between all dimensions of the smart
city, ie transport, residents, resources, city administration, city public services and the economy, to make
simple and easier solutions effective.
Example of smart urban mobility solution
In today’s world there are many applications and technologies that contribute to smart cities and there are
some of them [7]:

Toš, I. / Public Transport & Smart Mobility 2020, 73-78
76
Mobility as a Service (MaaS)
Moovel, an innovative MaaS platform, combines and facilitates the use of multimodal transport and shared
mobility services and enables payment via a single interface. This intelligent solution for urban mobility offers
a multimodal function that bundles transport options such as public transport, on-demand services, vehicle
sharing, bicycle sharing and ride hailing. With access to the Moovel app, customers can book and pay for
mobility services via an integrated account.
Sustainable travel behaviour
Innovactory is committed to make the travel behaviour of its users more sustainable through the development
of TimesUpp, an intelligent travel assistant. With more than 150,000 users, TimesUpp transforms a user's
calendar into the perfect travel assistant, advising the best time and mode of transport to get to their destination,
and providing real-time information about traffic jams and other unexpected delays.
In 2017, Innovactory TimesUpp introduced incentive programs with the aim of reducing transport-related
emissions and avoiding more than 250,000 car journeys . This led to a CO2 saving of almost 650 tons. In
2018, TimesUpp launched the Smart Traveling! Campaign - a SmartwayZ.NL initiative with public and
private sector stakeholders - to reward commuters for reducing the use of their car by switching to cycling,
public transport, or working from home.
Intelligent Transportation Systems (ITS)
PSIRoads is an intelligent traffic management solution that offers decision support through artificial
intelligence. This intelligent urban mobility solution offers intelligent traffic management services such as
traffic light phase changes, traffic user information and dynamic changes in traffic capacity. This mobility
solution is designed to help transport authorities achieve strategic goals by minimizing vehicle emissions and
reducing traffic congestion in residential areas.
Traffic congestion reduction services
An estimated 30% of traffic congestion in urban areas is caused by finding a parking space. Parquery - a cloud-
based smart parking solution that has been implemented in more than 15 cities worldwide - provides parking
space managers with precise data on the use of parking spaces and also supports adaptive street light
management, intelligent traffic management and retail services for easy navigation in a smart city.
Micromobility management
Micromobility - including systems and fleets of shared bicycles and electric (pedal) scooters. The
attractiveness of cycling and (pedal) scooters for cities and start-ups is obvious: micro-mobility systems
complement each other while they steal trips from other modes of transport".
eCooltra is a European scooter sharing innovator with a fleet of more than 3,000 electric scooters in use in
five cities. With the eCooltra app, customers can book and activate a freely available scooter and only pay for
the minutes of actual use. This e-mobility solution aims to improve the quality of life for customers, contribute
to sustainability in the city and reduce CO2 emissions.
Innovation in local public transport (ÖPNV)
An innovative passenger information system was designed and implemented in the Polish city of Lublin. This
project included the modernization of the urban transport infrastructure and the city's bus fleet. The project
included the installation of GSM and GPRS equipment in the vehicles, electronic displays at bus stops, control
center / dispatching software and a website with dynamic information for passengers. Lublin was voted "Smart
City of the Year" among cities with a population between 100,000 and 350,000 for its innovations in traffic

Toš, I. / Public Transport & Smart Mobility 2020, 73-78
77
management and transport solutions. By modernizing the transport infrastructure and improving
communication with passengers, Lublin shows that medium-sized cities can achieve a far-reaching upgrade
in user experience and the quality of urban mobility.
Reducing mobility poverty
The HiReach project, a research and innovation measure funded by the EU's Horizon 2020 program, has the
mission of finding solutions to improve the accessibility, inclusion and fair design of mobility:
Research into viable business models for affordable, modular and replicable mobility services (local
public transport, ridesharing, minibuses).
Generation and testing of mobility solutions for start-ups and companies.
Enabling the viability and scaling of new mobility business models.
PassageWay
PassageWay designed Real-time Smart Mobility Information and Digital Wayfinding Signs that can help
connect people with their local mobility options. From helping stadiums with crowd dispersal and encouraging
shoppers to linger longer, to helping patients or student’s access convenient mobility and workplace
sustainable travel plans, PassageWay offers a unique solution. Currently it is used in London, United
Kingdom. [4]
PassageWay digital signs are delivered as web URLs displaying auto-updating (typically every 8 seconds)
fully responsive web pages with the appropriate content. They are suitable for virtually any sized screen, at
any orientation. They are optimised for modern browsers, particularly Chrome. PassageWay signs are
designed for the public realm, because of this they are deliberately not interactive, to enable the maximum
number of people to view the information concurrently. Screens displaying PassageWay signs need to be
connected to the Internet, typically with a 3G or greater connection. If a screen loses Internet connectivity the
sign will display an appropriate customer service message prior to automatic restoration once connectivity is
resumed. [5]
PassageWay digital signs display real-time data around the availability of local public transport options along
with any applicable alerts that may affect the passenger journey. Each PassageWay sign is carefully curated
for a specific location (to within a few meters). Working with Transport Authorities and their agencies, it can
identify the mobility options to highlight and suggest optimum data selections. [5]
As previously mentioned, PassageWay enables stadiums and event venues to leverage existing digital screens
and totems to help visitors exit safely and quickly via public transport. It can also be used in schools, colleges,
healthcare centres, workplace, shopping centres etc. It can tell timetable of all transport modes, availability of
city bicycle, delays etc. using real time database.

Toš, I. / Public Transport & Smart Mobility 2020, 73-78
78
Figure 1. Example of PassageWay sign
Source: [6]
Conclusion
People must be able to move around to meet their basic needs, but also additional needs that include rest and
recreation. The growing trend of urbanization leads to population growth in cities, and thus to an increase in
demands on the transport system in cities, with the achievement of sustainable urban mobility as one of the
key challenges. Existing mobility systems cannot respond to the increased demand for transport. Cities
worldwide have started to look for solutions which enable transportation linkages, mixed land uses and high
quality services with long – term positive effect on the economy. Today cities are flooded with a range of data,
both useful and useless. In that large database, city administration should recognize the importance of
processing, analysis and mathematical-statistical processing. Each city should determine its vision, goals and
strategies of transforming itself and developing smart services at basis of collected data and their processing.
Future initiatives of a smart city and smart transportation should be focused on creation efficient,
environmentally friendly transport, based on interactive solutions for smartphones with options such as ticket
payment, selecting the fastest line, notification of delays and technical problems etc. There are a lot of
applications and technologies that contribute to smart cities such as Moovel, TimesUpp, PSIRoads, Parquery,
PassageWay. Although technology is evolving every day, there is always room for improvement by using
available data, smart management and individual approach to each city, it is possible to achieve an
improvement in public transport services, which would also improve the quality of life in urban areas.
References
[1] Albino, V., Berardi, U., Dangelico, R.M. Smart Cities: Definitions, Dimensions, Performance and
Initiatives in Urban Technology. Journal of Urban Technology 22 (1). pp. 3-21. 2015.
[2] REGEA. Okvirna strategija Grada Zagreba - Zagreb smart city, vizija do 2030. City of Zagreb.
Zagreb. 2018.
[3] Paliaga, M., Oliva, E. Trendovi u primjeni koncepta pametnih gradova. Ekonomska misao i praksa,
No. 2. pp. 565-583. 2018.
[4] Bee smart city. Passage way. Available at: https://www.beesmart.city/solutions/passageway
[Accessed: October 15, 2020]
[5] PassageWay. Public Transport & Wayfinding Digital Signs. Available at: https://passage-
way.com/passenger-information [Accessed: October 01, 2020]
[6] PassageWay. Live Transport Information. Available at: https://signs.passage-
way.com/sign/39/h0FYhc48KE [Accessed: October 05, 2020]

Toš, I. / Public Transport & Smart Mobility 2020, 73-78
79
[7] Bee smart city. Urban Mobility: Challenges and Solutions in Smart Cities. Available at:
https://hub.beesmart.city/de/smart-city-loesungen/urbane-mobilitaet-herausforderungen-und-
loesungen-in-smart-cities [Accessed: October 10, 2020]

1st International Conference Public Transport & Smart Mobility
80
The impact of telematics on traffic safety
DOI: https://doi.org/10.7307/ptsm.2020.10
Igor Jelić1, Maja Balenović2
School for road traffic, Zagreb1; School for road traffic, Zagreb2
Keywords:
Abstract Telematics
Safety
Traffic
Roads
The development of traffic that is conditioned by the high mobility of people,
goods and services must be in line with the principles of sustainable development,
but it is only possible if the consumption of renewable resources is less than natural
renewal opportunities. The future is in implementation of innovative technologies
such as telematics systems that offer not only technical solutions but also a new
way of life, a new business approach and a new cultural aspect of living for all
traffic participants. Advanced telematics solutions such as inflow management and
speed limit management greatly help to solve traffic problems, like incidents,
environmental pollution, traffic congestion, fuel consumption, etc. Impact of
telematics can increase safety but can also introduce new risks for drivers that pose
special challenges to traffic psychology and public health. In order to reduce traffic
congestion, longer waiting times, environmental pollution, reduce fuel
consumption in incident situation various advanced grammatical solutions have
been implemented in order to reduce these problems. Telematics, using techniques
such as informatics, optoelectronics, automatics and telecommunications, helps to
reduce costs of transportation potential management, improves the security and
reliability of the transportation service.
EU road safety
The number of people killed in road crashes around the world continues to increase. According to the World
Health Organisation’s “Global Status Report on Road Safety”, it reached 1.35 million in 2016 alone. This
means that, worldwide, more people die as a result of road traffic injuries than from HIV/AIDS, tuberculosis
or diarrhoeal diseases. And road crashes are now the most common cause of death for children and young
people between 5 and 29 worldwide. Compared to the global situation, Europe is doing relatively well, thanks
to determined action at EU, national, regional and local level. Between 2001 and 2010, the number of road
deaths in the EU decreased by 43%, and between 2010 and 2018 by another 21%. However, 25,100 people
still lost their lives on EU roads in 2018 and about 135,000 were seriously injured. This is an unacceptable
and unnecessary human and social price to pay for mobility. In monetary terms alone, the yearly cost of road
crashes in the EU has been estimated in a new study to be around EUR 280 billion, equivalent to about 2% of
GDP5.[1]
Progress in reducing EU-wide road fatality rates has stagnated in recent years. It appears highly unlikely that
the EU's current medium term target, to halve the number of road deaths between 2010 and 20206, will be
reached. Even less progress has been made in preventing serious injuries[1]. In some well-performing
countries, fatality figures have even risen again in recent years. Whilst certain fluctuations are to be expected
especially if the absolute figures and sample sizes are small, these cases need further analysis at national and
EU level, along with analysis of shifts in the accident types and user groups involved, in order to allow a
timely and effective policy response[1].
The EU has reaffirmed its ambitious long-term goal, to move close to zero deaths by 2050 ("Vision Zero").
To move towards these goals, a new approach is set out in the ”Europe on the Move” Communication. First
of all, the mindset of “Vision Zero” needs to take hold more than it has so far, both among policy makers and
in society at large[1]. Road crashes are “silent killers”, in that they often go virtually unnoticed in the public
sphere, even though, taken together, they kill as many people – around 500 – as fit into a jumbo jet every

Jelić, I., Balenović, M. / Public Transport & Smart Mobility 2020, 79-85
81
week, in Europe alone. We do not accept deaths in the air, and we should no longer accept them on the road –
the premise that no loss of life is acceptable needs to inform all decision making on road safety.
Figure 1. Evolution of EU road fatalities and targets for 2001-2020
Source: [1]
Telematics solution in vehicles
Telematics is a term that has been created to describe technologies and applications which make integrated
use of telecommunications and informatics. More specifically, telematics is the discipline concerned with the
transfer of data and services to mobile locations such as vehicles, containers, or people. The underlying
technologies are often referred to as Information and Communications Technologies or ICT. Telematics has
its origins in military localisation applications, but the term is now mostly used as a synonym for vehicle
telematics (also known as Road Transport and Traffic Telematics or RTTT in Europe, and Intelligent
Transport Systems or ITS in the United Kingdom and United States). Vehicle telematics applications are
delivered through in-vehicle devices that as core technologies typically contain satellite localisation such as
Global Positioning System (GPS) and cellular communications such as General Packet Radio Service (GPRS).
Innovations in vehicle technology can help both mitigate the severity of crashes and reduce the likelihood of
crashes through on one hand passive safety features such as safety belts, airbags, and general crashworthiness
of vehicles that protect occupants when a collision is inevitable, and on the other hand active safety features,
such as Advanced Emergency Braking, Intelligent Speed Assistance, Stability Control and Lane Departure
Warning that may prevent accidents from happening altogether.
eCall
eCall is a system that provides an automated message to the emergency services following a road crash which
includes the precise crash location. The in-vehicle eCall is an emergency call (an E112 wireless call) generated
either manually by the vehicle occupants by pushing a button or automatically via activation of in-vehicle
sensors after a crash. When activated, the in-vehicle eCall device will establish an emergency call carrying
both voice and data directly to the nearest emergency services (normally the nearest 112 Public Safety
Answering Point, PSAP). The voice call enables vehicle occupants to communicate with the trained eCall
operator. At the same time, a minimum set of data will be sent to the eCall operator receiving the voice call.
The minimum set of data contains information about the incident including time, precise location, vehicle
identification, eCall status (as a minimum, indication if eCall has been manually or automatically triggered)
and information about a possible service provider.
A prospective Finnish study has estimated that such a system might reduce between 4-8% of road deaths and
5-10% of motor vehicle occupant deaths in Finland [2]. The study assumed that all vehicles were equipped

Jelić, I., Balenović, M. / Public Transport & Smart Mobility 2020, 79-85
82
with the eCall terminal and that each terminal would function properly. The study was unable to evaluate the
impact of the precise location information given by eCall on the swifter arrival of rescue units at the accident
site in the evaluation of decrease in road traffic deaths. The overall impact of the system, which involves
additional players, has not been evaluated.
The Finnish study noted that through "the comparison of the 4-8% decrease in traffic accident fatalities arrived
at in this study with the figures of other European studies one can see that the results are similar to the German
(5%) and Dutch (7%) estimations. The estimations in Sweden (2-4%) and Great Britain (2%) are smaller and
the estimate for the whole 25 member state EU area (5-15%) greater than the estimate in this study. The
American estimation for the decrease in traffic accident fatalities based on field studies was smaller (2-3%)
than in this study. The estimate made by the doctors was, however, greater (9-11%) [2].
Increase efficiency, job satisfaction and reduce operating costs
Real-time communication coupled with routing apps can divert drivers away from road delays and toward
high-priority loads. Adding even a few minutes of driving time to each driver’s daily hours of service (HOS)
can boost overall fleet utilization.
With electronic logs, drivers have more control over their daily routines, which is one of the top contributors
to job satisfaction. The drivers know how much time they have left to work and can better collaborate with
dispatchers to meet customer demands. With smartphones and tablets with them at all times, they can engage
in training at a time and place that is convenient for them.
Saving even a few minutes of idling time across a fleet leads to huge fuel savings. Better fleet and driver
utilization can lift equipment availability to meet customer demand with existing assets. Connecting with
drivers via cab-mounted tablets, fleet managers can instantaneously update drivers on detours, reroute them
around heavy traffic and direct them to preferred fuel vendors.
Smart road technology
The road is an often-overlooked part of the modern transport infrastructure. We’ve all heard of self-driving
cars, navigation apps, and ride-hailing services. But as it turns out, the road itself can be a platform for an
amazing array of innovations. Roads can be upgraded with communication, lighting and power transmission
technologies that can support sustainability, improve safety, and transform the driving experience. It is
estimated that road infrastructure and road surroundings are a contributing factor in more than 30% of crashes.
In the last few years, technology has changed almost everything around us. For instance, it has completely
changed the way we used to spend money, communicate or even drive. Certain technologies like telematics
have revolutionized both motor insurance and road safety [3].
Smart roads use Internet of Things (IoT) devices to make driving safer, more efficient, and greener. Smart
roads combine physical infrastructures such as sensors and solar panels with software infrastructure like AI
and big data. Smart road technologies are embedded in roads and can improve visibility, generate energy,
communicate with autonomous vehicles, monitor road conditions, and more.
Smart road technologies [3]:
1. Solar powered roadways - Photovoltaic cells are embedded within hexagonal panels made of tempered
glass, which are used to pave roads. These panels contain LEDs, microprocessors, snow-melting heating
devices and inductive charging capability for electric vehicles when driving. Glass is renewable and can be
engineered to be stronger than steel, and to allow cars to stop safely even when traveling at high speeds. While
this idea has gained widespread support, attracting over $2 million in crowdfunding, scalability is a challenge
as it remains expensive.

Jelić, I., Balenović, M. / Public Transport & Smart Mobility 2020, 79-85
83
2. Smart pavement - Specially engineered roadways fitted with smart features, including sensors that monitor
and report changing road conditions, and WiFi transmitters that provide broadband services to vehicles, homes
and businesses. The smart pavement can also charge electric cars as they drive.
3. Glow in the dark roads - Glowing markers painted onto existing roadway surfaces use a photo-luminescent
powder that absorbs and stores daylight. The 500m long strips glow for 8 hours after dark. This technology is
still in the testing phase, and the glow is not yet consistent, but it could be more cost-effective than traditional
road lighting.
4. Interactive lights - Road lights activated by motion sensors to illuminate a particular section of the road as
a car approaches. The lights dim once the car passes. Suited for roads with less traffic, interactive lights provide
night visibility as needed and reduce energy wastage when there are no cars. One design, developed by the
Dutch Studio Roosegaarde, uses wind generated by passing vehicles to power lights.
5. Electric priority lane for charging electric vehicles - Embedded cables generate magnetic fields that charge
electric vehicles while driving. A receiver coil in the vehicle picks up electromagnetic oscillations from a
transmitter coil embedded in the road and converts them to AC, which can then power the car. Inductive
charging technology already exists for static cars, but future wireless technology could charge batteries while
in motion.
6. Weather detection - Networks of AI-integrated sensors detect weather conditions that impact road safety.
Road Weather Information Systems (RWIS) in use today are limited because they only collect data from a
small set of weather stations. A larger future network could use automated weather stations to collect
atmospheric and weather data and instantly upload it to the cloud. Dynamic temperature-sensitive paint could
be used to highlight invisible roadway conditions like black ice.
7. Traffic detection - Data that helps travelers plan their routes. Sensors lining highways monitor traffic flow
and weight load, warn drivers of traffic jams, and automatically alert the authorities about accidents. Fiber-
optic cables embedded in the road detect wear and tear, and communication between vehicles and roads can
improve traffic management. For example, Rapid Flow Technologies uses artificial intelligence (AI) to
manage traffic lights, which respond to each other and to cars.
Many governments and transport authorities understand the value of smart road technologies. However,
developing smart city infrastructure at scale can be costly and complex. Leaders can break down smart road
projects into chunks, starting with low-investment, narrow-scale initiatives that can provide initial value,
setting the stage for high-investment, large-scale efforts. In the early days of motor-powered mobility, cars
were available, but there was no suitable road infrastructure; the first private cars were hardly more effective
than horse-driven wagons. Gradually, authorities recognized that only a major investment in road
infrastructure would help the population reap the benefits of new transport technology. Similarly, today’s
municipal governments and inter-city transport authorities should wake up to the importance of smart roads,
as an essential platform for mobility innovation. Smart roads will power smarter cars, empower drivers, and
provide governments with unprecedented visibility and control over the living fabric of motor-based traffic.
[3]
The key of attributes of smart roads
We must distinguish the attributes with a direct influence on road design, construction and maintenance – we
will name them structural aspects – from those aspects related to the subjective perceptions of users driving
through our roads, to then reconcile those structural aspects with the users´ expectations.
Structural acttributes
Smart Roads are associated with structural aspects such as, although not limited to, the following [4]:

Jelić, I., Balenović, M. / Public Transport & Smart Mobility 2020, 79-85
84
Optimal environmental integration and energy efficiency: This refers to the capacity of our road
systems to respect high environmental protection levels, minimising the associated environmental
impacts whilst also allowing all users to enjoy the surrounding region through careful landscape
integration. At the same time, this approach involves developing optimised models for the lowest
possible energy consumption and emission levels, maximizing the use of recycled and waste materials.
To this end, it is important to take into account the entire life cycle of a road infrastructure.
Optimal service quality: Through advanced traffic management it is possible to optimise the use of
existing road networks, limiting congestion during hours of peak demand, and at the same time
distributing traffic as evenly as possible to maximise the service levels offered at all times. This
approach relies on the streamlined transmission of real-time information to road users and on fostering
the interaction between users and the information presented to them.
Economic sustainability: Highways designed for the mass transport of people and goods are
economically justified in most of the cases. This principle is all the more important when it comes to
evaluating the cost of operating and maintaining this type of infrastructures. It is therefore highly
advised to proceed with detailed cost-benefit analyses with a view to justifying the usefulness of every
road project. Full debate must also be undertaken when seeking public-private partnerships financing
the construction of new infrastructures and the maintenance and upgrading of existing networks.
Improved safety: This means following internationally-recognised best practices in the design of new
road infrastructures and in the implementation of the best possible safety solutions - for all users - in
the maintenance, upgrading and modernisation of existing infrastructures. Collaborative efforts in this
regard should contribute to reducing road mortality and injury rates through more effective design,
construction and maintenance of road infrastructures.
Coverage of externalities: The external costs arising from the movement of people and goods on roads
must be kept to a minimum through the development of technologies to absorb emissions and noise,
minimise the probability of and mitigate the impacts of accidents, and in addition provide maximum
travel time in free-flowing traffic.
Assurance of regional cohesion: Conventional roads are a paradigm for effective regional
development, as they offer all users an ideal door-to-door transport alternative providing access to all
social services (e.g., leisure, culture, health, education and other infrastructures). At the same time, it
is necessary not to overlook the importance of roads in urban and suburban areas, which are
fundamental for those living both in and outside cities.
Focus on co-modality: It is also important to acknowledge the key role roads play in a realistic scenario
for the effective use of different transport modes in combination, with a view to realising a sustainable
utilization of transportation resources. Roads are inevitably an essential link in the modal chain as
they are the sole mode providing access to ports, airports, commuter stations, bus connection points
and so on. This unique attribute of road infrastructures consequently needs to be highlighted as a
complementary factor in relation to other transport modes.
Adaptability of services offered: Over time, all transport modes have successfully adapted their offer
to the expectations of the various types of users (commuter and high-speed trains, rail transport of
goods, light rail and underground transit, international flights, private jets, mid-haul flights, etc.) and,
in so doing, the related infrastructures have been adapted to each type of mobility demand. On the
other hand, roads have provided a solution to all users and for all types of travel around the clock, 365
days a year, based on two main offerings: conventional roads and divided highways. The time has
come for road infrastructures also to modify their type and characteristics through an optimised design
and differentiation amongst uses and users per itinerary (e.g., toll highways reserved for light-duty
vehicles during predetermined time periods).
Social commitment: Given their attributes, roads are the only transport mode that guarantees
practically universal access for the movement of all users under more or less the same conditions,
regardless of their economic or social status. The universal nature of this access, which dramatically
affects the quality of the services offered, is what positions this transport mode as the primary and
conceptual cornerstone of the economic and social development of an advanced country. A fact that
also cannot be overlooked is that roads are used not only by personal vehicles and heavy equipment

Jelić, I., Balenović, M. / Public Transport & Smart Mobility 2020, 79-85
85
but also by mass transit vehicles that provide social service and economic accessibility, not to mention
motorcycles and bicycles, amongst other vehicles.
Economic contribution: This has always been and will always be one of the main advantages of
highway networks and road transport. Roads bring an enormous positive impact to national economies
via their contribution to the gross domestic product, government tax revenues and the creation of
direct and indirect jobs.
User-oriented roads: It is time to move on from the traditional concept that implies that the main
“clients” of road infrastructures are always national or regional governments. The true clients are the
citizens using these roads. With this in mind, Smart Roads are to be defined and re-defined on an on-
going basis taking into account the requirements and expectations of users.
Technology and innovation: All the parameters above require a decided action from those public and
private stakeholders active in the road-related scientific and technological arena. Innovation plays a
key role on all levels, from the provision of more effective services to the development of new
materials, road equipment, sustainable road maintenance methods and much more.
Emotional Attributes
It is also possible to identify a series of emotional attributes associated with the Smart Roads concept, insofar
as they are linked closely to the structural aspects set out above, notably [4]:
Reliability: Roads should provide assurance in terms of predictable travel time and, by extension, free
traffic flow for as much of the day as possible. This calls consequently for the systematic use of
advanced technologies for managing actual demand from one moment to the next.
Safety: Roads should offer the highest safety levels that technical and technological progress to date
allows, with a view to securing mobility with the lowest possible risk and minimising the probability
of and mitigating the potential effects of accidents. These characteristics are to be taken into account
for all users that may happen to use any given route.
Security: Roads should be the most important part of an integrated system managing the risks
associated to natural and man-made disasters, and in addition providing an adequate response and
recovery time to all kinds of incidents.
Comfort: Good driving conditions are an essential parameter for ensuring user satisfaction and must
take into account adequate road visibility and signalling, even pavements and proper services
alongside roads.
Modernity: Insofar as no specific model has been defined for every possible typology for road travel,
users do not generally classify roads as an “advanced” transport mode. Making a distinction between
passenger and goods transport, between short, frequent trips and long-haul travel, etc., are key
challenges to design a system perceived as modern and attractive by the public opinion.
Freedom: Far from an association with fixed departure times or limited service offers that do not
necessarily fulfil the needs of users, roads are synonymous with freedom.

Jelić, I., Balenović, M. / Public Transport & Smart Mobility 2020, 79-85
86
Figure 2. The key attributes of smart roads
Source: Author’s own elaboration
Conclusion
Advanced telematics solutions are now implemented worldwide, with the goal harmonization of traffic flows,
but also modernization of the entire transport system. Every year various projects, the purpose of which is
based on the best possible modernization of highways, but also innovative telematics solutions that need to be
integrated, the results are excellent driver awareness of road conditions.
Most of the experts believe that it is even possible to develop various solutions related to accidents, traffic
congestion and emergency services. All these measures will change the way we currently consider highways
and expressways by making them much safer and faster. Due to all these benefits, the demand for telematics
has been significantly growing in almost every part of the world. In fact, many professional fleets and other
such lines of businesses have already implemented this technology. Some automobile companies even use this
technology in passenger cars. For people seeking more safety and greater efficiency, telematics is the perfect
solution.
References
[1] Commission staff working document. EU Road Safety Policy Framework 2021-2030 – Next steps
towards “Vision Zero”, 1-3.
[2] Virtanen, A., Schirokoff, J., Luoma and R. Kulmala Impacts of an automatic emergency call system
on accident consequences. Ministry of Transport and Communications. Finland 2006.
[3] HERE Mobility. Available at: https://mobility.here.com/learn/smart-transportation/smart-road-
technology-paving-way-future [Accessed: October 09, 2020]
[4] Elena De La Peña, Smart Roads: A Vision, Spanish Road Association Chair, Spain 2015.

Krijan, I. / Public Transport & Smart Mobility 2020, 86-93
87
Car sharing integration in the City of Milan
DOI: https://doi.org/10.7307/ptsm.2020.11
Ivana Krijan
Keywords:
Abstract Car sharing
Milan
Sustainable
Mobility
This paper will present a structural summary of the reasons for implementing
car sharing as a sustainable form of mobility in City of Milan. The paper will
also decribe the growth and development of car sharing services in Milan. It
will provide an overall view of measures that have had an impact on reducing
the number of vehicles, air pollution and improving the quality of life in the
city.
Introduction
Milan is the second largest city in Italy, right after the capital Rome, with 1.35 million inhabitants and 3.2
million inhabitants in the metropolitan area. The population density in the city is about 7,400 inhabitants per
square kilometer, while in the metropolitan area there are about 2,000 inhabitants per square kilometer. There
is a 5.3 million trips every day, made by 850,000 people entering and 270,000 people leaving the town. 57%
of all trips are made by public transport, 30% by car, 7% by motorcycle and 6% by bicycle. [1]
Like all other cities around the world and in Europe, the City of Milan faces the challenges of increasing
mobility, reducing air pollution, reducing number of vehicles on the city streets and consequently increasing
the overall quality of life of its inhabitants. Reducing the number of vehicles and traffic congestion requires a
comprehensive policy that provides sustainable modes of transport. It is also necessary to bring these modes
of transport closer to the inhabitants through education and promotion. Milan is a great example of how all
this can be achieved in just a few years. As one of the measures for sustainable mobility, the city of Milan has
implemented a car sharing system.
Main resons for sunstainable mobility
In order to reduce the number of vehicles in urban area, to reduce pollution and to improve the quality of live,
City of Milan has implemented several measures over the years – from pollution charge (Ecopass), congestion
charge to smart and sustainable mobility such as sharing (car sharing, bike sharing, scooter sharing,
kickscooter sharing).
Ecopass started operating on 2 January 2008. This was a traffic pollution charge, as a part of the overall
sustainable mobility strategy. There was 43 entrance point in 8.2 square kilometer that was controlled by an
electronic system of cameras. Ecopass was active from Monday to Friday, from 07:30 till 19:30. Not all the
vehicles had to pay for Ecopass. The fees was based on the vehicles emission standards, which means that the
most polluting vehicles was paying a pollution charge, while some vehicle did not pay a fee at all. [2]
Unlike this model, the congestion charge, which was introduced in 2012, all vehicles (with some exceptions)
entering the same area pay a fee. Area C is restricted traffic zone of the center of Milan – it has the same
boundaries as Ecopass. Area C is active, as well as the Ecopass was, from Monday to Friday, from 07:30 till
19:30. There is no charge for weekends a public holidays. Vehicles that have free access are: electric vehicles,
hybrid vehicles (some of them), mopeds and motorcycles. Here are also included emergency vehicles, army
vehicles, vehicles used by sector of animal protection, vehicles used for transport people with serious and rare
diseases. Vehicles not allowed to access in Area C are: most polluting vehicles (Euro 0 petrol, Euro diesel 0,
1, 2, 3 vehicles and from February 2017 Euro 4 diesel vehicles too), vehicles over 7.5 meters length. All other
vehicles have to buy a ticket to enter Area C. Residents of Area C have 40 entry free of charge in the calendar
year, after that they also have to pay the entrance. Also, there are ZTL areas (originally Zone a Traffico

Krijan, I. / Public Transport & Smart Mobility 2020, 86-93
88
Limitato) or Limited Traffic Area, in which access and movement for all vehicles is forbidden, with the
exception of residents, specific categories of users and for particular type transport like public transport). [3]
This measures had effects – the car ownership and number of car in generally in urban area has decreased;
road traffic had decreased for 29.2%; road accidents also for 26%; public transport speed had increase for 2%
(for buses between 09:00 – 10:00) and for 4.4% (for buses between 18:00 – 19:00); 12% more users in surface
public transport and 17% more users underground public transport. [4] Pollution was also decreasing, but not
enough. That way City of Milan has introduced Area B.
Area B covers approximately 72% municipal territory and is active from 25 February 2019, from 07:30 until
19:30. Access is forbidden for the most polluting vehicles (Euro 0 petrol vehicles and Euro 0, 1, 2, 3 and 4)
and for vehicle over 12 meters length. There is no fee for vehicles, which has permitted access. [5]
The implementation of car sharing as a sustainable transport mode was intended, as mentioned above, to
reduce the number of car owners and improve the quality of life for all who live, work, study and visit the City
of Milan, by decreasing both traffic and pollution. In this regard, it is important to note that car-sharing users
do not pay access fees for accessing restricted areas.
Car sharing development in City of Milan
Iniziativa Car Sharing (ICS) plays an important role in promotion and implemention of car sharing services
both in Milan and throughout Italy. When it was established on the initiative of Ministry of Enviroment, in
May 2000, to spread the concept of this sustainable form of urban mobility, car sharing was almost unknown
in Italy. Trough ICS, Car sharing services were popularized and incorporated in the whole country and society.
ICS offers: technical and legal consultancy, project support for designing the system and the service,
communication and promotional support on a national level, promotional, communication and marketing
support on a local level, call center services, technologies for the management of the fleet and the service and
assistance during the initial operational period [6]. Today the ICS represents a network of 38 municipalities,
major cities and provinces, coordinated by the City of Milan.
The first car sharing system in Milan, Car Sharing Italia, is in fact a pilot project of car sharing which was
presented in 2001 in cooperation with the environmental association Legambiente. GuidaMi is a second car
sharing service that launched in 2004. It was, as well as Car Sharing Italia, station based car sharing system.
[6]
In 2013, the Municipal of Milan launched a public tender to bring new private operators and spread free-
floating car sharing services – and they succeeded. [7] In just a few years, six new private service providers
were operating on the streets of Milan. All of them brought new operational model of car sharing – free
floating. This model of car sharing has been received by users very well, because it is giving people the
flexibility to collect and return cars where they want.
Figure 1 presents the timeline of car sharing history in Milan. Today, there are five car sharing providers in
Milano – two of them are station based and three are free floating.

Krijan, I. / Public Transport & Smart Mobility 2020, 86-93
89
Figure 4. Timeline of car sharing history in Milan
Source: [Author]
Ubeeqo and E-vai are car sharing providers with a station based system. Ubeeqo was launched in 2017, with
acquisition of GuidaMi, the historical Milan's car sharing service originally founded by the Municipality of
Milan and company for public transport ATM. [8] It has 154 vehicles (7% electric vehicles) and 5,000 users.
[4] E-vai started operating in 2010. It is a first regional car sharing service, which is fully integrated with
Lombardy's railway services. The service isn’t limited only on the city area, but it is also allowed to drive the
vehicles anywhere in Lombardy. E-vai now has 33,000 users [4], who are driving 104 vehicles (92 of them
are electric) [9]. There are over 100 parking spaces located in airports, stations, city squares and universities.
The most significant innovation of car sharing services was introduced in 2013. That was Car2Go - first free
floating car sharing service in Milan which was launched with 829 vehicles (none of them is electric) in a 114
square kilometers area. The same year Enjoy came, service provider which today has 982 vehicles (none of
them is electric) and 392,000 users. In 2015, Share'Ngo arrived – it has 700 electric vehicles and 60,000 users.
In 2016, Drivenow came to market with 473 vehicles, operating in a 126 square kilometers business area. It
has 93,000 users. [4] Finally, last year Car2go and Drivenow have announced that they are united forces under
one name – Share now.
Trends in car sharing
The number that illustrates the positive effects of car sharing in Milan best, is the car motorization index.
According to the Observatory on sustainable mobility in Italy, in 2006 Milan has had 565.3 vehicles per 1,000
inhabitants. In 2018 that number was 502.7 vehicles per 1,000 inhabitants. Decreasing trend of car
motorization index is shown in Figure 2.

Krijan, I. / Public Transport & Smart Mobility 2020, 86-93
90
Figure 2. Decreasing trend of car motorization index in Milan
Source: [10]
The increase in the number of car sharing vehicles had a direct impact on the decline of privately owned
vehicles. Car sharing vehicles number increase is shown in Table 1. The fleet has 3.394 vehicle, with an
electric vehicle share of 28% in 2018 [4].
Table 1. Comparison of vehicle quantity and number of users for the period 2013 – 2017
Year 2013 2014 2015 2016 2017
Number of vehicles 993 2.018 2.562 2.988 3.290
Number of users 40.256 244.387 394.013 522.578 639.000
Source: [11]
According to Third National report on sharing mobility 2018, the number of daily usage of car sharing services
have been progressively growing since 2013, and have reached a daily average of around 15.000 in 2017. This
is a six and a half - fold incrase in five years. In comparison, we see a slower, three – fold increase in number
of shared cars for the same period. Every single car in the fleet was, on average for year 2013, used 2.3 times
per day. For year 2017, the daily number of uses per car rose to 5.1. The overall productivity of the service
doubled within five years, as the average driving time stayed relatively stable - approximately 20 minutes per
use. The number of users has also continued to increase in this period, which is shown in Figure 3. As reported
for the year 2018, fleet growth rate was lower in comparison to the period mentioned, but the average daily
use of a single car doubled. It grew to 5.6 (2018) from 2.3 (2013). [9]
According to Milan´s Sustainable Urban Mobility Plan, the modal split of people movements during the next
10 years is expected to change very significantly; it is expected that public transport will be used for 63% of
domestic trips in Milan and the expected decline in the use of private vehicles is - 24%. The goal is to reduce
car motorization index to 460 vehicles/1000 inhabitants. The estimated daily number of car sharing service
use should climb to 30,000 for the year 2022. To enable this level of service operation, the number of shared
vehicles should increase to 5,000. [11]
Mobility as a Service
Mobility as a Service (MaaS) is the integration of various forms of transport services into a single mobility
service accessible on demand. To meet a customer’s request, a MaaS operator facilitates a diverse menu of
transport options, be they public transport, ride-, car- or bike-sharing, taxi or car rental/lease, or a combination
thereof. For the user, MaaS can offer added value through use of a single application to provide access to

Krijan, I. / Public Transport & Smart Mobility 2020, 86-93
91
mobility, with a single payment channel instead of multiple ticketing and payment operations. For its users,
MaaS should be the best value proposition, by helping them meet their mobility needs and solve the
inconvenient parts of individual journeys as well as the entire system of mobility services. A successful MaaS
service also brings new business models and ways to organize and operate the various transport options, with
advantages for transport operators including access to improved user and demand information and new
opportunities to serve unmet demand. The aim of MaaS is to provide an alternative to the use of the private
car that may be as convenient, more sustainable, help to reduce congestion and constraints in transport
capacity, and can be even cheaper. [12] In other words, Maas is a service that provides customers a unified
offer of all available transport services in a certain area, for their individual travel. City of Milan is constantly
working to implement such a service. There are two application that are a few steps away from that
achievement – ATM application and Urbi.
ATM, fully named Azienda Trasporti Milanesi is a public transport company in Milan. It has a network of
metros, trams, trolleybuses and buses. ATM operates on a territory of 46 municipalities spread on 657 square
kilometers. In 2018, AZM transportation vehicles travelled 157 million kilometers, carrying 776 million
passengers. Milan's metro network with 4 lines, 113 stations and 96.8 km in length, is the longest metro line
in Italy. The tram network consists of 19 lines with length of 180.2 kilometers. There are 4 trolleybus lines,
operated by 137 trolley buses on a 38.8 kilometers network. The bus network is 1,155.60 km long and a total
of 1,399 buses operate on 131 bus lines. [13]
ATM mobile application is diversified with different functions and services:
route calculation which displays the ticket cost for each of the selected travel options;
possibility of finding ATM stops, railway stations, parking, ATM Points, parking meters, ticket resales
and other places of interest such as airports, BikeMi stands and cycling lanes (managed by ATM);
possibility to view the route, stops, schedule and waiting times for one or more lines;
possibility to buy, store and use all tickets (via SMS or via direct debit on mobile phone);
possibility to save the stops, addresses and points of interest;
traffic information;
general information. [14]
A new development project of ATM mobile application is ongoing. The project is focused on the inclusion of
information related to sharing services: location of car sharing vehicles, bike stalls with bike sharing indicator,
the availability of bicycles, cycling path routes, departures and arrivals at railway stations and airports.
Mobility as a service is aim – integration of all available services in the city. Figure 4 shows a summary of
services which should be included with the project.
Figure 4. Towards an integrated mobility – MaaS
Source: [4]

Krijan, I. / Public Transport & Smart Mobility 2020, 86-93
92
Another application that provides similar services is Urbi. Urbi is an application that allows users to access all
sharing mobility services – car, bike, scooter and taxi, as well as public transport. Unlike ATM app, which
provides information about their own services (for example BikeMi, which is ATM's bike sharing system),
Urbi provides all available cars, bikes (also BikeMi) and scooters in the area. But with this application it in
not possible to pay for service. Application shows all available vehicles in the area, but for vehicle reservation
user is being redirected to the application of car sharing provider. Then, in provider’s application. Users
reserves a vehicle and start a trip. Through Urbi application is possible to reserved and pay a taxi service
(Wetaxi). [15]
Figure 5. All types of sharing services in Milan implemented by years
Source: [16]
Impact of Covid-19 pandemic on car sharing
The world was hit by Covid-19 pandemic this year. More precisely, the pandemic continues to spread globally.
There are no areas and sectors that have not been affected and damaged by the pandemic. Italy was the first
country in Europe that imposed a national lockdown. The lockdown has lasted over two months. During these
two months everything has been stopped, including mobility too.
The city of Milan was one of the areas hardest hit by the pandemic. The impact of the pandemic on car sharing
is also huge. In the last week of February, demand for car sharing started to decline 26% per week. in Two
months later, the decrease in demand for the service is 90% [17]. At the end of April, the number of daily
rentals was approximately 1,800, while in the same period of the previous year the number of daily rentals
was 16,000. Before the pandemic, each vehicle was in use ten times a day. At the beginning of May only
twice.
Some car sharing companies have recommended their customers to wear gloves and masks during the drive.
Companies pay special attention vehicles cleaning maintaining high hygiene standards. In some cases,
cleaning is up to four times more frequent than before the pandemic, which is a financial and logistical
challenge for companies.
Although the city of Milan has implemented some measures related to urban mobility, for example suspension
of the Area B to reduce the pressure on public transport, there is no information on how the city will help and
whether the city will help at all car sharing companies and car sharing services.

Krijan, I. / Public Transport & Smart Mobility 2020, 86-93
93
Conclusion
Increasing mobility, reducing the number of vehicles and reducing air pollution are the main challenges for
the City of Milan. To improve the quality of life of its inhabitants, Milan has introduced various measures.
The first measure, which was directly related to the reduction of pollution and at the same time to the reduction
of vehicles in the city and the reduction of car ownership, was the introduction of the Ecopass in 2008. Ecopass
was a traffic pollution charge covering an area of 8.2 square kilometres. It was repleced by the Area C in 2012.
Area C is congetion charge and it covers the same are as Ecopass used to. All vehicle that are enter Area C
have to pay a fee. The city also has the ZLT zone (originally Zone a Traffico Limitato), in which access and
movement of all vehicles is completely forbidden, with a few exceptions (residenst).
The first car sharing service in the city of Milan was launched in 2001. Over the years new car sharing services
have been launched, some existing services have been taken over by other services, while others have joined
forces and operate under one name. Today there are a total of five car sharing service providers in Milan –
two of them are station based and three are free floating. The car motorization index is decreasing over the
years, while the fleet of car sharing and car sharing subscriptions is growing. As the number of vehicles on
the streets of Milan grows, so does the number of car usage.
ATM – public transport company and Urbi – aggregator application provider are constantly developing their
application to provide users a service that integrates different (all available) forms of transport into a single
mobility service, accessible on demand. The mail goal is to provide a service that through the use of a single
application provides access to mobility with a single payment channel instead of multiple ticketing and
payment operations – Mobility as a Service.
This year is challenging for everyone. Covid-19 pandemic has a huge impact on car sharing services in Milan
and on mobility in general. Milan residents, according to the results presented in this paper, have accepted car
sharing as a sustainable mode of transport, not just as an alternative mobility, but as an equal member of public
transport such as tram, metro, etc. Covid-19 will certainly continue to impact the car sharing services, but the
residents of Milan will still know how to appreciate and recognize all the benefits that car sharing services
provide.
References
[1] Eltis. Shared mobility enabling MaaS in Milan’s SUMP. Available at:
https://www.eltis.org/discover/case-studies/shared-mobility-enabling-maas-milans-sump [Accessed:
October 27, 2020]
[2] International Transport Forum. Charging scheme in city centre (AREA C) and other strategies in
Milan. Available at: https://www.itf-oecd.org/sites/default/files/docs/charging-scheme-other-
strategies-milan.pdf
[Accessed: October 28, 2020]
[3] Comune di Milano. Area C. Available at: https://www.comune.milano.it/aree-
tematiche/mobilita/area-c
[Accessed: October 28, 2020]
[4] Bureau of environment – Tokyo Metropolitan Government. City of Milan - improvement of air
quality and the environment. Available at:
https://www.kankyo.metro.tokyo.lg.jp/en/tokyo_forum_report.files/5-5_Milan.pdf [Accessed:
October 28, 2020]
[5] Eltis. Italy´s largest low emission zone “Area B” is launched in Milan. Available at:
https://www.eltis.org/discover/news/italys-largest-low-emission-zone-area-b-launched-milan
[Accessed: October 28, 2020]
[6] Laurino, A., Grimaldi, A. The Italian way to carsharing. TeMA – Journal of Land Use, Mobility and
Environment. Vol.5 (No.3). pp. 77-91. 2012.
Krijan, I. / Public Transport & Smart Mobility 2020, 86-93
94
[7] ICS – Iniziativa Car Sharing. A successful experience: The Car Sharing in the Milan Area. Available
at: https://www.icscarsharing.it/wp-content/uploads/2019/02/2016-Car-Sharing-in-Milan.pdf
[Accessed: October 29, 2020]
[8] Europcar Mobility Group. Europcar Group pursues its expansion in the carsharing market with the
acquisition of GuidaMi by Ubeeqo. Available at: https://www.finance.europcar-group.com/static-
files/026a3013-fd42-4233-8ad4-5b8599cd3785 [Accessed: October 29, 2020]
[9] Oservatorio Nazionale Sharing Mobility. 3^ Raporto nazionale sulla sharing mobility 2018.
Available at: http://osservatoriosharingmobility.it/wp-content/uploads/2019/07/come-sta-la-sharing-
mobility_III-Rapporto-SM_13-e-FRONT.pdf [Accessed: October 29, 2020]
[10] Observatory On Sustainable Mobility in Italy. Car motorization index. Available at:
https://www.xn--osservatorio50citt-wrb.it/searchIndicator_NEW/index.php [Accessed: October 30,
2020]
[11] Oservatorio Nazionale Sharing Mobility. 2^ Raporto nazionale sulla sharing mobility 2017.
Available at: http://osservatoriosharingmobility.it/wp-content/uploads/2018/09/II-Rapporto-
Nazionale_capitolo-dati_DEF_CON-INTESTAZIONE_5.pdf [Accessed: October 30, 2020]
[12] Maas Alliance. What is MaaS?. Available at: https://maas-alliance.eu/homepage/what-is-maas/
[Accessed: November 02, 2020]
[13] Aziendia Transporti Milanesi. ATM in Figures. Available at:
https://www.atm.it/EN/ILGRUPPO/CHISIAMO/Pages/Numeri.aspx [Accessed: November 03,
2020]
[14] Aziendia Transporti Milanesi. ATM Milano Official App. Available at:
https://www.atm.it/en/ViaggiaConNoi/Pages/ATMMobile.aspx [Accessed: November 03, 2020]
[15] Urbi. 17 Servizi di mobilita condivisa. Available at: https://www.urbi.co/cities/milano/ [Accessed:
November 03, 2020]
[16] movmi Shared Transportation Services. As carshare as it gets: the 2020 Carshare City Awards.
Available at: https://movmi.net/winners-2020-carshare-city-awards/ [Accessed: November 04, 2020]
[17] Articonf. How COVID-19 affects carsharing? Available at: https://articonf.eu/how-covid-19-
affects-carsharing/ [Accessed: November 04, 2020]

ISBN: 978-953-243-121-6
https://www.fpz.unizg.hr/ptsm
Recommended