Parallelism for your Development Lifecycle Intel® Parallel Studio brings comprehensive parallelism to C/C++ Microsoft Visual Studio* application development. Intel Parallel Studio was created in direct response to the concerns of software industry leaders and developers. From the way the products work together to support the development lifecycle to their unique feature sets, parallelism is now easier and more viable than ever before. The tools are designed so those new to parallelism can learn as they go, and experienced parallel programmers can work more efficiently and with more confidence. Intel Parallel Studio is interoperable with common parallel programming libraries and API standards, such as Intel® Threading Building Blocks and OpenMP*, and provides an immediate opportunity to realize the benefits of multicore platforms.
Product BriefIntel® Parallel Studio
“The new analysis and profiling tools in Intel® Parallel Studio make the
new Envivio 4Caster* series transcoder’s development faster and
more efficient. In particular, the use of Intel® Parallel Inspector and
Intel® Parallel Amplifier shortens our overall software development time
by increasing the code’s reliability and its performance in a multicore,
multithreaded environment. At the qualification stage, the number of
dysfunctions is reduced due to a safer implementation, and the bug
tracking becomes easier too. Intel Parallel Studio globally speeds up our
software products’ time-to-market”.Eric Rosier V.P. Engineering Envivio
Intel® Parallel Studio
Intel® Parallel Studio Tools
Intel® Parallel Amplifier:Quickly find bottlenecks and tune parallel applications for scalable
multicore performance.
Find application hotspots and drill down to the source code•
Tune parallel applications for scalable performance using •
concurrency analysis
Use locks & waits analysis to find critical waits that limit parallel •
performance
Compare results to quickly see what changed, or find regressions •
Intel® Parallel Composer:Develop effective applications with a C/C++ compiler and advanced
threaded libraries.
Build with Intel® C++ Compilers for 32-bit processors, a cross- •
compiler to create 64-bit applications on 32-bit systems, and a
native 64-bit compiler
Code with Intel® Integrated Performance Primitives (Intel® IPP), a •
foundation-level set of building blocks for threaded applications
in engineering, financial, digital media, data processing, and
mathematics. Intel IPP can also be used with the Microsoft Visual
C++* compiler
Debug with Intel® Parallel Debugger Extension, which integrates with •
the Microsoft Visual Studio debugger
Code with Intel® Threading Building Blocks (Intel® TBB) , an award- •
winning C++ template library that abstracts threads to tasks to
create reliable, portable, and scalable parallel applications. Intel TBB
can also be used with the Microsoft Visual C++ compiler
Intel® Parallel Inspector:Ensure application reliability with proactive parallel memory and
threading error checking.
Find threading-related errors such as deadlocks and data races•
Find memory errors such as memory leaks and corruption•
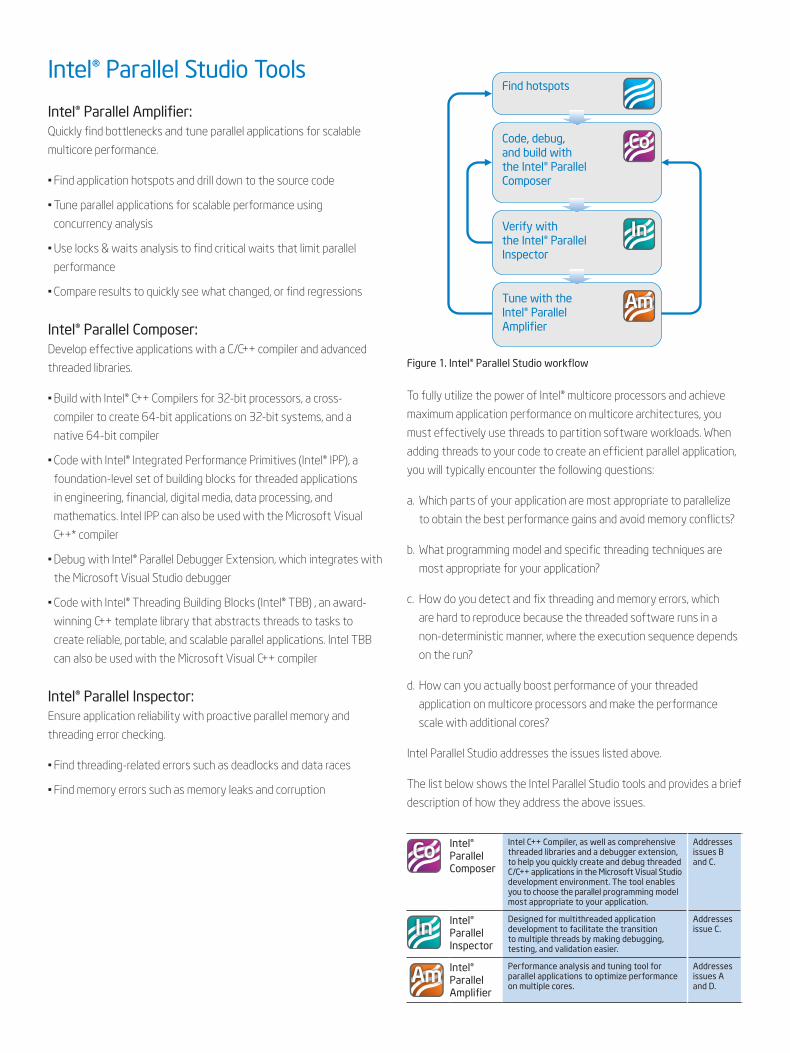
Figure 1. Intel® Parallel Studio workflow
To fully utilize the power of Intel® multicore processors and achieve
maximum application performance on multicore architectures, you
must effectively use threads to partition software workloads. When
adding threads to your code to create an efficient parallel application,
you will typically encounter the following questions:
a. Which parts of your application are most appropriate to parallelize
to obtain the best performance gains and avoid memory conflicts?
b. What programming model and specific threading techniques are
most appropriate for your application?
c. How do you detect and fix threading and memory errors, which
are hard to reproduce because the threaded software runs in a
non-deterministic manner, where the execution sequence depends
on the run?
d. How can you actually boost performance of your threaded
application on multicore processors and make the performance
scale with additional cores?
Intel Parallel Studio addresses the issues listed above.
The list below shows the Intel Parallel Studio tools and provides a brief
description of how they address the above issues.
Intel® Parallel Composer
Intel C++ Compiler, as well as comprehensive threaded libraries and a debugger extension, to help you quickly create and debug threaded C/C++ applications in the Microsoft Visual Studio development environment. The tool enables you to choose the parallel programming model most appropriate to your application.
Addresses issues B and C.
Intel® Parallel Inspector
Designed for multithreaded application development to facilitate the transition to multiple threads by making debugging, testing, and validation easier.
Addresses issue C.
Intel® Parallel Amplifier
Performance analysis and tuning tool for parallel applications to optimize performance on multiple cores.
Addresses issues A and D.
Tune with theIntel® ParallelAmplifier
Verify with the Intel® ParallelInspector
Code, debug, and build with the Intel® ParallelComposer
Find hotspots
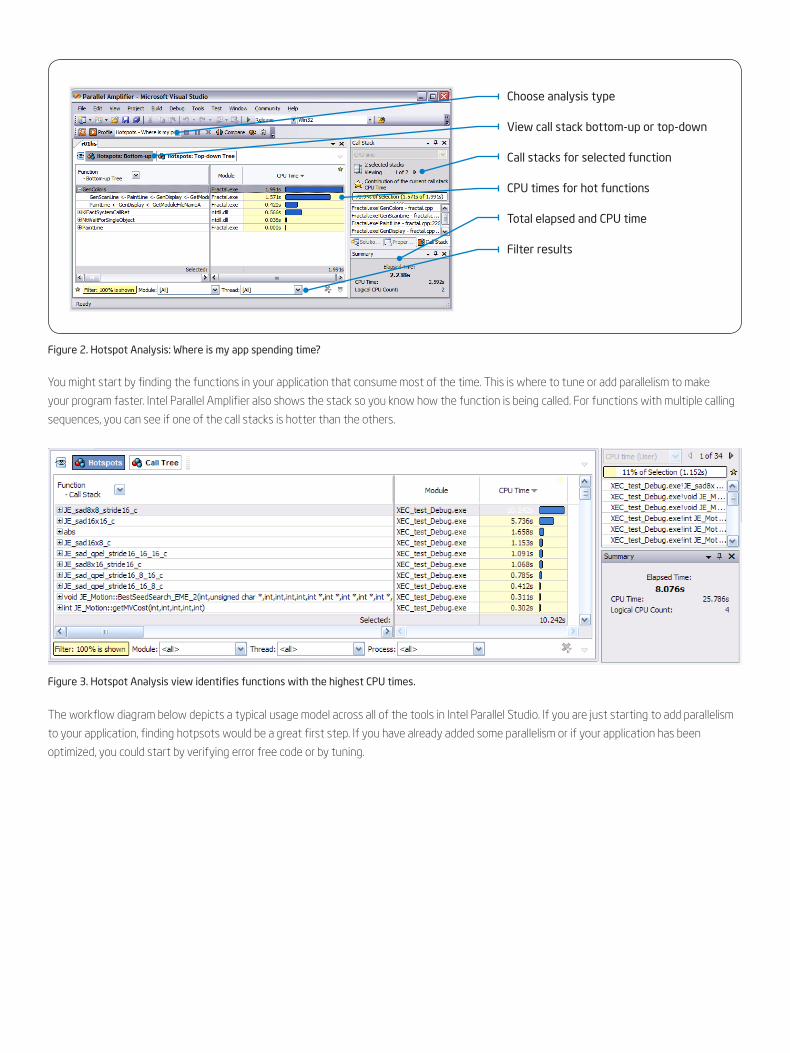
Figure 2. Hotspot Analysis: Where is my app spending time?
Figure 3. Hotspot Analysis view identifies functions with the highest CPU times.
You might start by finding the functions in your application that consume most of the time. This is where to tune or add parallelism to make
your program faster. Intel Parallel Amplifier also shows the stack so you know how the function is being called. For functions with multiple calling
sequences, you can see if one of the call stacks is hotter than the others.
The workflow diagram below depicts a typical usage model across all of the tools in Intel Parallel Studio. If you are just starting to add parallelism
to your application, finding hotpsots would be a great first step. If you have already added some parallelism or if your application has been
optimized, you could start by verifying error free code or by tuning.
Choose analysis type
View call stack bottom-up or top-down
Call stacks for selected function
CPU times for hot functions
Total elapsed and CPU time
Filter results
void SerialApplyFoo( float a[], size_t n ) {
for( size_t i=0; i!=n; ++i )
Foo(a[i]);
}
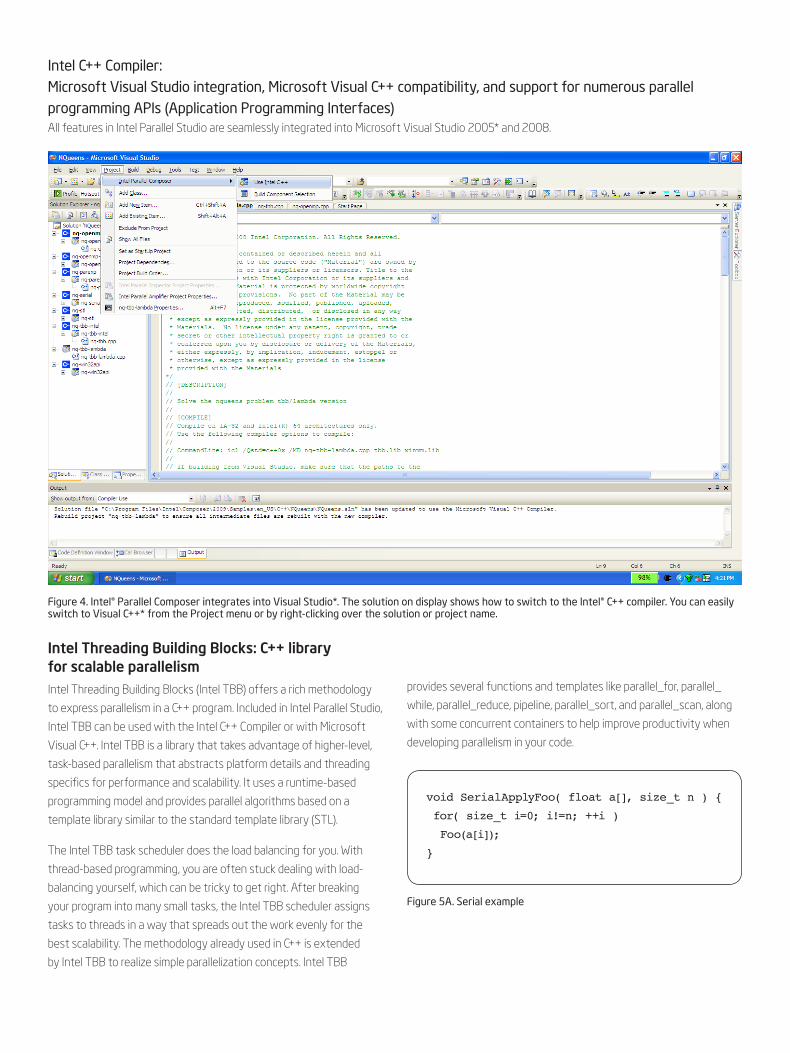
Figure 4. Intel® Parallel Composer integrates into Visual Studio*. The solution on display shows how to switch to the Intel® C++ compiler. You can easily switch to Visual C++* from the Project menu or by right-clicking over the solution or project name.
Figure 5A. Serial example
Intel C++ Compiler: Microsoft Visual Studio integration, Microsoft Visual C++ compatibility, and support for numerous parallel programming APIs (Application Programming Interfaces)All features in Intel Parallel Studio are seamlessly integrated into Microsoft Visual Studio 2005* and 2008.
Intel Threading Building Blocks: C++ library for scalable parallelismIntel Threading Building Blocks (Intel TBB) offers a rich methodology
to express parallelism in a C++ program. Included in Intel Parallel Studio,
Intel TBB can be used with the Intel C++ Compiler or with Microsoft
Visual C++. Intel TBB is a library that takes advantage of higher-level,
task-based parallelism that abstracts platform details and threading
specifics for performance and scalability. It uses a runtime-based
programming model and provides parallel algorithms based on a
template library similar to the standard template library (STL).
The Intel TBB task scheduler does the load balancing for you. With
thread-based programming, you are often stuck dealing with load-
balancing yourself, which can be tricky to get right. After breaking
your program into many small tasks, the Intel TBB scheduler assigns
tasks to threads in a way that spreads out the work evenly for the
best scalability. The methodology already used in C++ is extended
by Intel TBB to realize simple parallelization concepts. Intel TBB
provides several functions and templates like parallel_for, parallel_
while, parallel_reduce, pipeline, parallel_sort, and parallel_scan, along
with some concurrent containers to help improve productivity when
developing parallelism in your code.
class ApplyFoo {
float *const my_a;
public:
ApplyFoo( float *a ) : my_a(a) {}
void operator()( const blocked_range<size_t>& range ) const {
float *a = my_a;
for( size_t i=range.begin(); i!=range.end(); ++i )
Foo(a[i]);
}
};
void ParallelApplyFoo( float a[], size_t n ) {
parallel_for( blocked_range<size_t>( 0, n ),
ApplyFoo(a),
auto_partitioner());
void ParallelApplyFoo(float a[], size_t n ) {
parallel_for( blocked_range<size_t>( 0, n ),
[=](const blocked_range<size_t>& range) {
for( int i= range.begin(); i!=range.end();
++i )
Foo(a[i]);
},
auto_partitioner() );
}
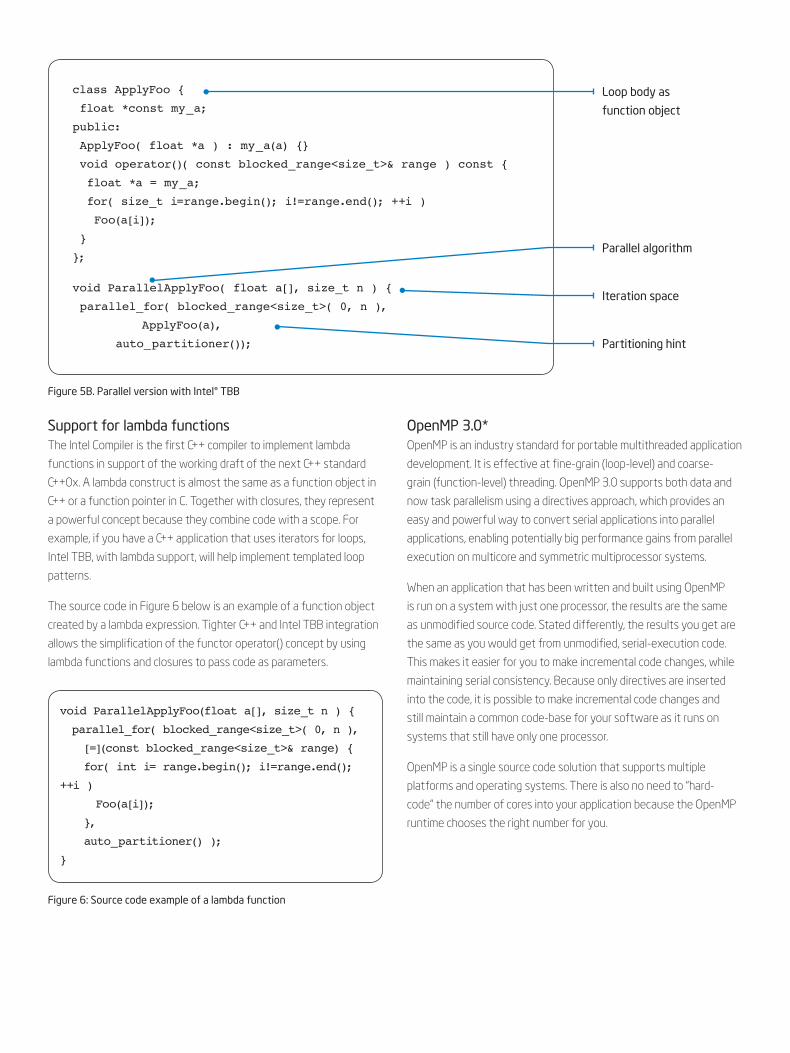
Figure 5B. Parallel version with Intel® TBB
Figure 6: Source code example of a lambda function
Support for lambda functionsThe Intel Compiler is the first C++ compiler to implement lambda
functions in support of the working draft of the next C++ standard
C++0x. A lambda construct is almost the same as a function object in
C++ or a function pointer in C. Together with closures, they represent
a powerful concept because they combine code with a scope. For
example, if you have a C++ application that uses iterators for loops,
Intel TBB, with lambda support, will help implement templated loop
patterns.
The source code in Figure 6 below is an example of a function object
created by a lambda expression. Tighter C++ and Intel TBB integration
allows the simplification of the functor operator() concept by using
lambda functions and closures to pass code as parameters.
OpenMP 3.0*OpenMP is an industry standard for portable multithreaded application
development. It is effective at fine-grain (loop-level) and coarse-
grain (function-level) threading. OpenMP 3.0 supports both data and
now task parallelism using a directives approach, which provides an
easy and powerful way to convert serial applications into parallel
applications, enabling potentially big performance gains from parallel
execution on multicore and symmetric multiprocessor systems.
When an application that has been written and built using OpenMP
is run on a system with just one processor, the results are the same
as unmodified source code. Stated differently, the results you get are
the same as you would get from unmodified, serial-execution code.
This makes it easier for you to make incremental code changes, while
maintaining serial consistency. Because only directives are inserted
into the code, it is possible to make incremental code changes and
still maintain a common code-base for your software as it runs on
systems that still have only one processor.
OpenMP is a single source code solution that supports multiple
platforms and operating systems. There is also no need to “hard-
code” the number of cores into your application because the OpenMP
runtime chooses the right number for you.
Loop body as
function object
Parallel algorithm
Iteration space
Partitioning hint
void solve() {
__par for(int i=0; i<size; i++) {
// try all positions in first row
// create separate array for each
recursion
// started here
setQueen(new int[size], 0, i);
}
}
#pragma omp parallel
#pragma omp single
{
for(int i=0; i<size; i++) {
// try all positions in first row
// create separate array for each recursion
// started here
#pragma omp task
setQueen(new int[size], 0, i);
}
}
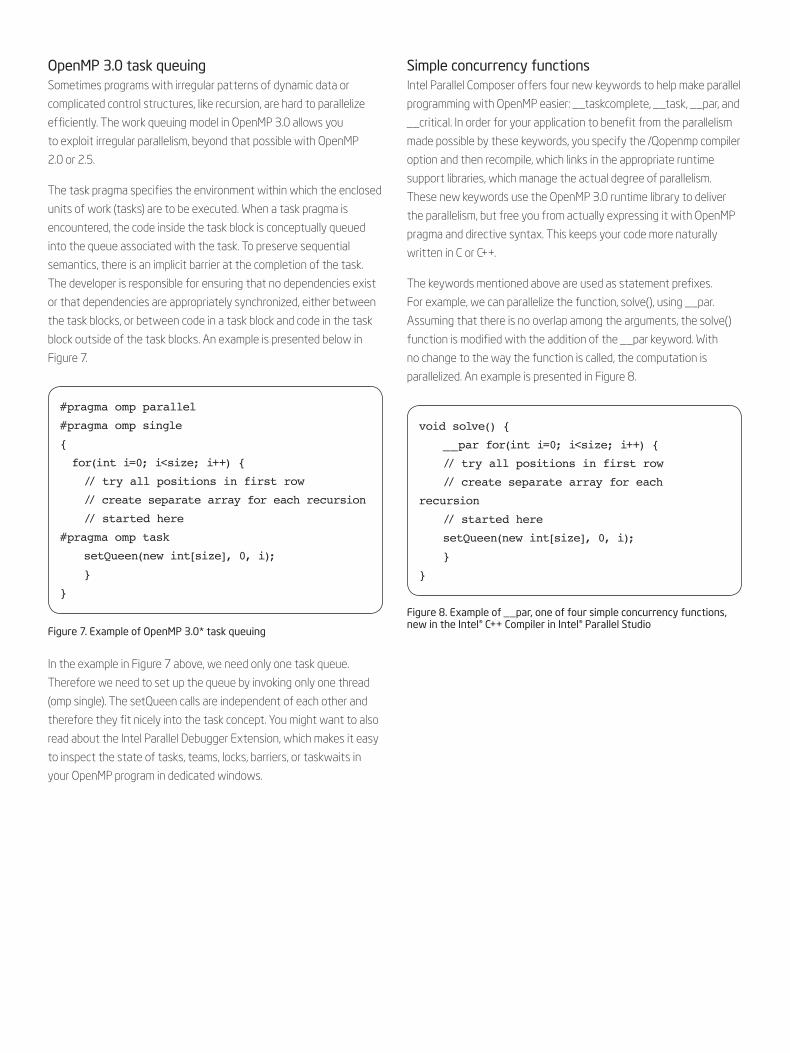
Simple concurrency functionsIntel Parallel Composer offers four new keywords to help make parallel
programming with OpenMP easier: __taskcomplete, __task, __par, and
__critical. In order for your application to benefit from the parallelism
made possible by these keywords, you specify the /Qopenmp compiler
option and then recompile, which links in the appropriate runtime
support libraries, which manage the actual degree of parallelism.
These new keywords use the OpenMP 3.0 runtime library to deliver
the parallelism, but free you from actually expressing it with OpenMP
pragma and directive syntax. This keeps your code more naturally
written in C or C++.
The keywords mentioned above are used as statement prefixes.
For example, we can parallelize the function, solve(), using __par.
Assuming that there is no overlap among the arguments, the solve()
function is modified with the addition of the __par keyword. With
no change to the way the function is called, the computation is
parallelized. An example is presented in Figure 8.
OpenMP 3.0 task queuing Sometimes programs with irregular patterns of dynamic data or
complicated control structures, like recursion, are hard to parallelize
efficiently. The work queuing model in OpenMP 3.0 allows you
to exploit irregular parallelism, beyond that possible with OpenMP
2.0 or 2.5.
The task pragma specifies the environment within which the enclosed
units of work (tasks) are to be executed. When a task pragma is
encountered, the code inside the task block is conceptually queued
into the queue associated with the task. To preserve sequential
semantics, there is an implicit barrier at the completion of the task.
The developer is responsible for ensuring that no dependencies exist
or that dependencies are appropriately synchronized, either between
the task blocks, or between code in a task block and code in the task
block outside of the task blocks. An example is presented below in
Figure 7.
In the example in Figure 7 above, we need only one task queue.
Therefore we need to set up the queue by invoking only one thread
(omp single). The setQueen calls are independent of each other and
therefore they fit nicely into the task concept. You might want to also
read about the Intel Parallel Debugger Extension, which makes it easy
to inspect the state of tasks, teams, locks, barriers, or taskwaits in
your OpenMP program in dedicated windows.
Figure 7. Example of OpenMP 3.0* task queuing
Figure 8. Example of __par, one of four simple concurrency functions, new in the Intel® C++ Compiler in Intel® Parallel Studio
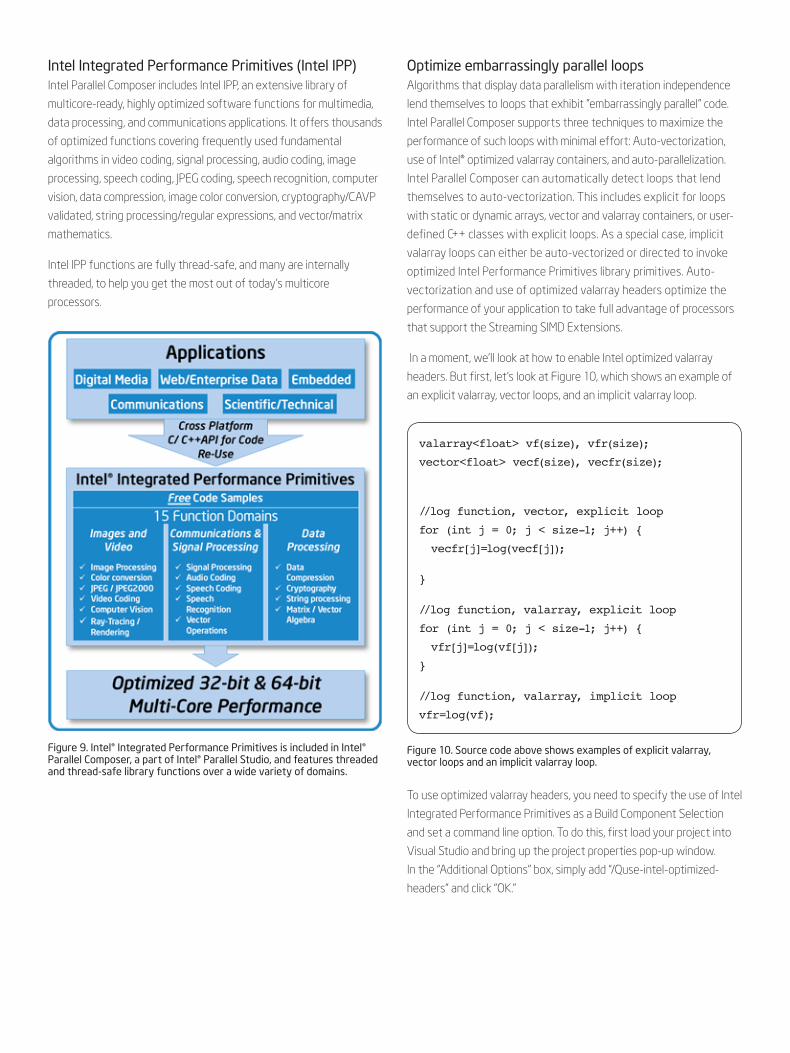
Optimize embarrassingly parallel loopsAlgorithms that display data parallelism with iteration independence
lend themselves to loops that exhibit ”embarrassingly parallel” code.
Intel Parallel Composer supports three techniques to maximize the
performance of such loops with minimal effort: Auto-vectorization,
use of Intel® optimized valarray containers, and auto-parallelization.
Intel Parallel Composer can automatically detect loops that lend
themselves to auto-vectorization. This includes explicit for loops
with static or dynamic arrays, vector and valarray containers, or user-
defined C++ classes with explicit loops. As a special case, implicit
valarray loops can either be auto-vectorized or directed to invoke
optimized Intel Performance Primitives library primitives. Auto-
vectorization and use of optimized valarray headers optimize the
performance of your application to take full advantage of processors
that support the Streaming SIMD Extensions.
In a moment, we’ll look at how to enable Intel optimized valarray
headers. But first, let’s look at Figure 10, which shows an example of
an explicit valarray, vector loops, and an implicit valarray loop.
To use optimized valarray headers, you need to specify the use of Intel
Integrated Performance Primitives as a Build Component Selection
and set a command line option. To do this, first load your project into
Visual Studio and bring up the project properties pop-up window.
In the “Additional Options” box, simply add “/Quse-intel-optimized-
headers” and click “OK.”
Intel Integrated Performance Primitives (Intel IPP)Intel Parallel Composer includes Intel IPP, an extensive library of
multicore-ready, highly optimized software functions for multimedia,
data processing, and communications applications. It offers thousands
of optimized functions covering frequently used fundamental
algorithms in video coding, signal processing, audio coding, image
processing, speech coding, JPEG coding, speech recognition, computer
vision, data compression, image color conversion, cryptography/CAVP
validated, string processing/regular expressions, and vector/matrix
mathematics.
Intel IPP functions are fully thread-safe, and many are internally
threaded, to help you get the most out of today’s multicore
processors.
Figure 9. Intel® Integrated Performance Primitives is included in Intel® Parallel Composer, a part of Intel® Parallel Studio, and features threaded and thread-safe library functions over a wide variety of domains.
Figure 10. Source code above shows examples of explicit valarray, vector loops and an implicit valarray loop.
valarray<float> vf(size), vfr(size);
vector<float> vecf(size), vecfr(size);
//log function, vector, explicit loop
for (int j = 0; j < size-1; j++) {
vecfr[j]=log(vecf[j]);
}
//log function, valarray, explicit loop
for (int j = 0; j < size-1; j++) {
vfr[j]=log(vf[j]);
}
//log function, valarray, implicit loop
vfr=log(vf);
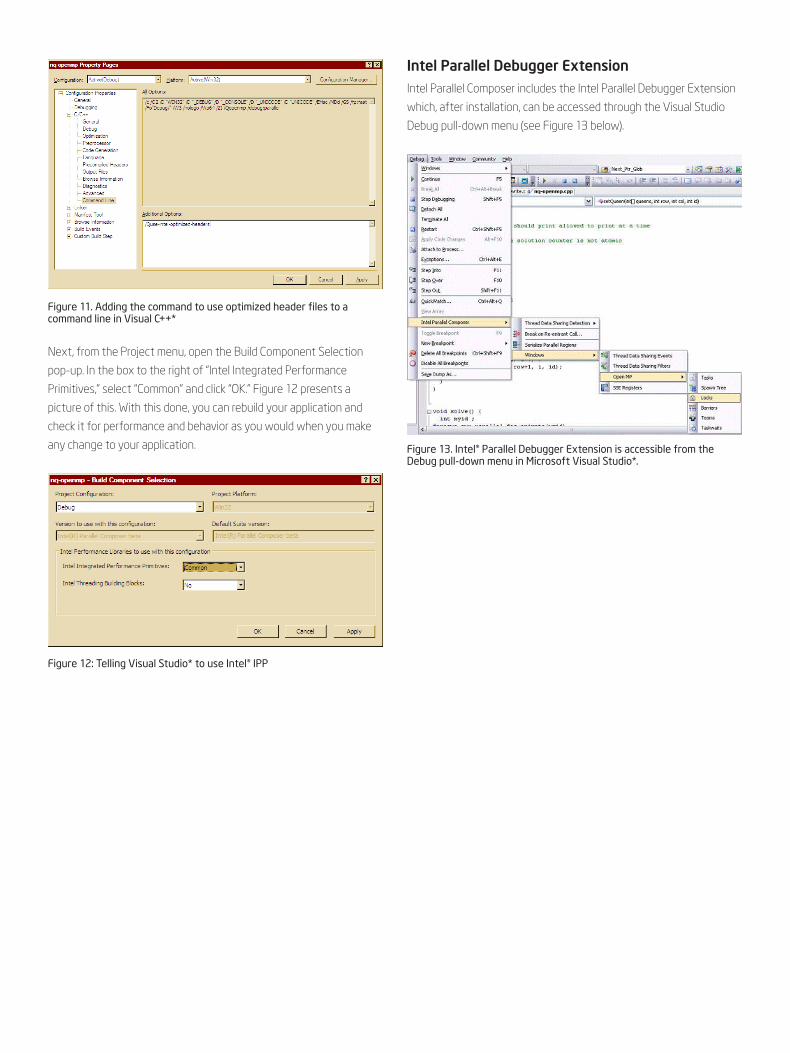
Figure 11. Adding the command to use optimized header files to a command line in Visual C++*
Figure 13. Intel® Parallel Debugger Extension is accessible from the Debug pull-down menu in Microsoft Visual Studio*.
Figure 12: Telling Visual Studio* to use Intel® IPP
Next, from the Project menu, open the Build Component Selection
pop-up. In the box to the right of “Intel Integrated Performance
Primitives,” select “Common” and click “OK.” Figure 12 presents a
picture of this. With this done, you can rebuild your application and
check it for performance and behavior as you would when you make
any change to your application.
Intel Parallel Debugger ExtensionIntel Parallel Composer includes the Intel Parallel Debugger Extension
which, after installation, can be accessed through the Visual Studio
Debug pull-down menu (see Figure 13 below).
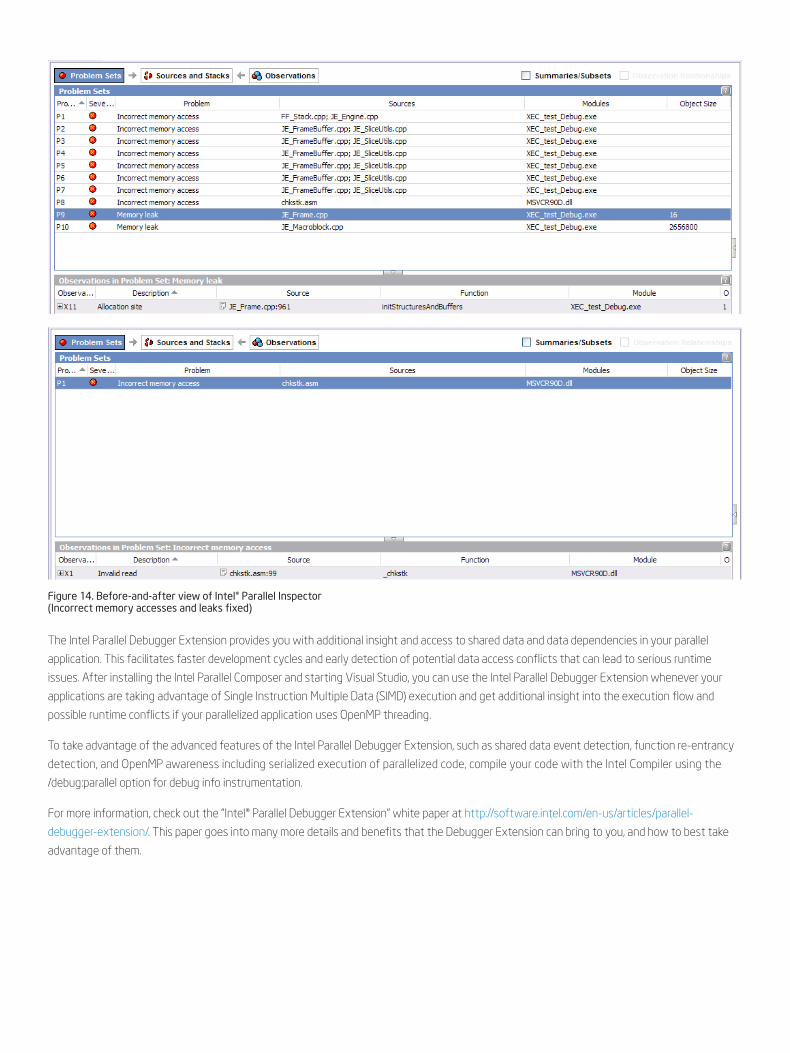
Figure 14. Before-and-after view of Intel® Parallel Inspector (Incorrect memory accesses and leaks fixed)
The Intel Parallel Debugger Extension provides you with additional insight and access to shared data and data dependencies in your parallel
application. This facilitates faster development cycles and early detection of potential data access conflicts that can lead to serious runtime
issues. After installing the Intel Parallel Composer and starting Visual Studio, you can use the Intel Parallel Debugger Extension whenever your
applications are taking advantage of Single Instruction Multiple Data (SIMD) execution and get additional insight into the execution flow and
possible runtime conflicts if your parallelized application uses OpenMP threading.
To take advantage of the advanced features of the Intel Parallel Debugger Extension, such as shared data event detection, function re-entrancy
detection, and OpenMP awareness including serialized execution of parallelized code, compile your code with the Intel Compiler using the
/debug:parallel option for debug info instrumentation.
For more information, check out the “Intel® Parallel Debugger Extension” white paper at http://software.intel.com/en-us/articles/parallel-
debugger-extension/. This paper goes into many more details and benefits that the Debugger Extension can bring to you, and how to best take
advantage of them.
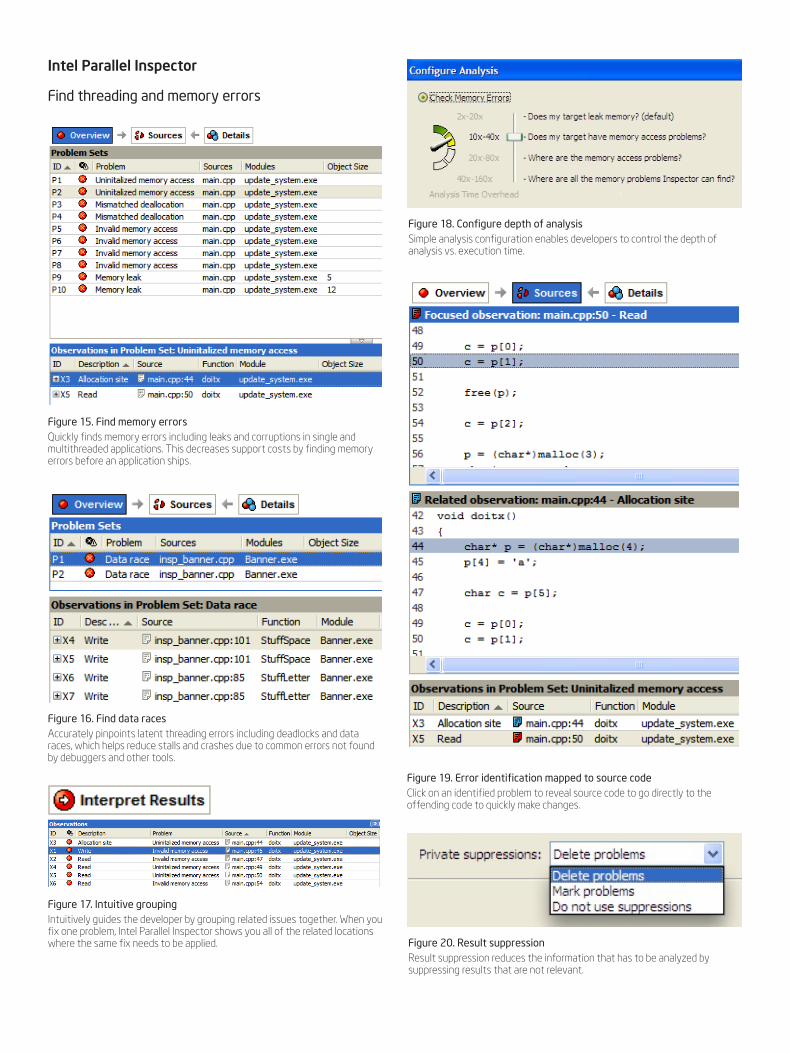
Intel Parallel Inspector
Find threading and memory errors
Figure 15. Find memory errorsQuickly finds memory errors including leaks and corruptions in single and multithreaded applications. This decreases support costs by finding memory errors before an application ships.
Figure 18. Configure depth of analysisSimple analysis configuration enables developers to control the depth of analysis vs. execution time.
Figure 20. Result suppressionResult suppression reduces the information that has to be analyzed by suppressing results that are not relevant.
Figure 16. Find data racesAccurately pinpoints latent threading errors including deadlocks and data races, which helps reduce stalls and crashes due to common errors not found by debuggers and other tools.
Figure 19. Error identification mapped to source codeClick on an identified problem to reveal source code to go directly to the offending code to quickly make changes.
Figure 17. Intuitive groupingIntuitively guides the developer by grouping related issues together. When you fix one problem, Intel Parallel Inspector shows you all of the related locations where the same fix needs to be applied.
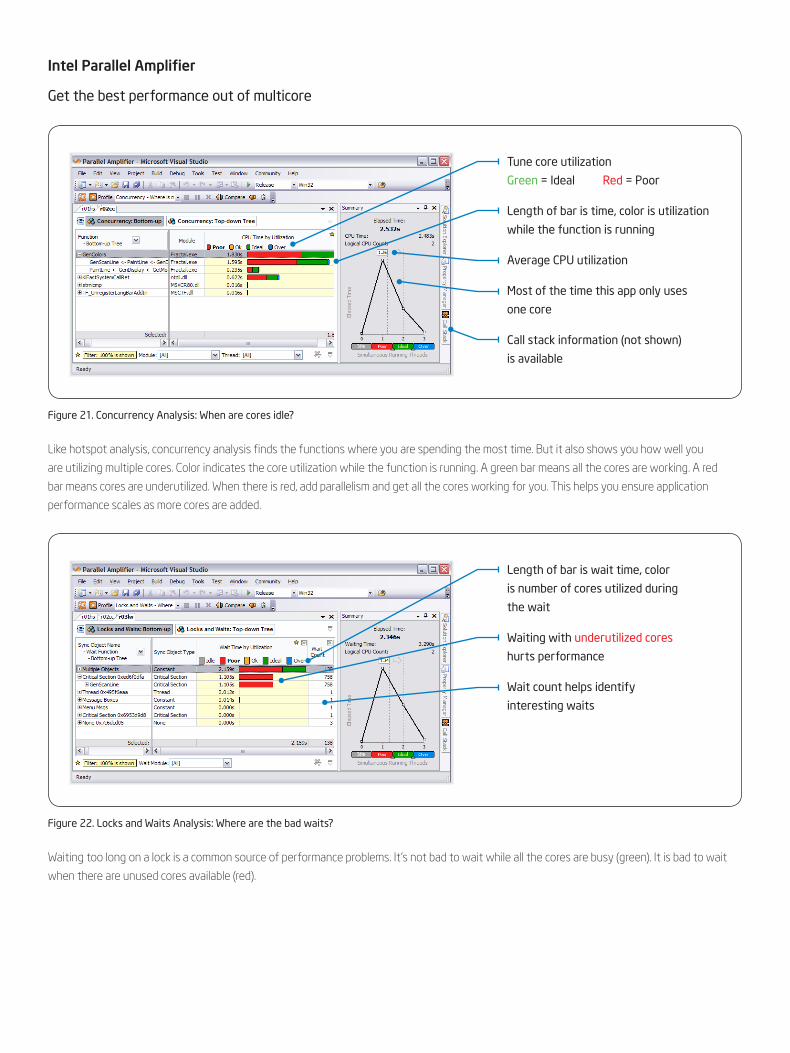
Figure 21. Concurrency Analysis: When are cores idle?
Figure 22. Locks and Waits Analysis: Where are the bad waits?
Intel Parallel Amplifier
Get the best performance out of multicore
Like hotspot analysis, concurrency analysis finds the functions where you are spending the most time. But it also shows you how well you
are utilizing multiple cores. Color indicates the core utilization while the function is running. A green bar means all the cores are working. A red
bar means cores are underutilized. When there is red, add parallelism and get all the cores working for you. This helps you ensure application
performance scales as more cores are added.
Waiting too long on a lock is a common source of performance problems. It’s not bad to wait while all the cores are busy (green). It is bad to wait
when there are unused cores available (red).
Tune core utilization
Green = Ideal Red = Poor
Length of bar is time, color is utilization
while the function is running
Average CPU utilization
Most of the time this app only uses
one core
Call stack information (not shown)
is available
Length of bar is wait time, color
is number of cores utilized during
the wait
Waiting with underutilized cores
hurts performance
Wait count helps identify
interesting waits
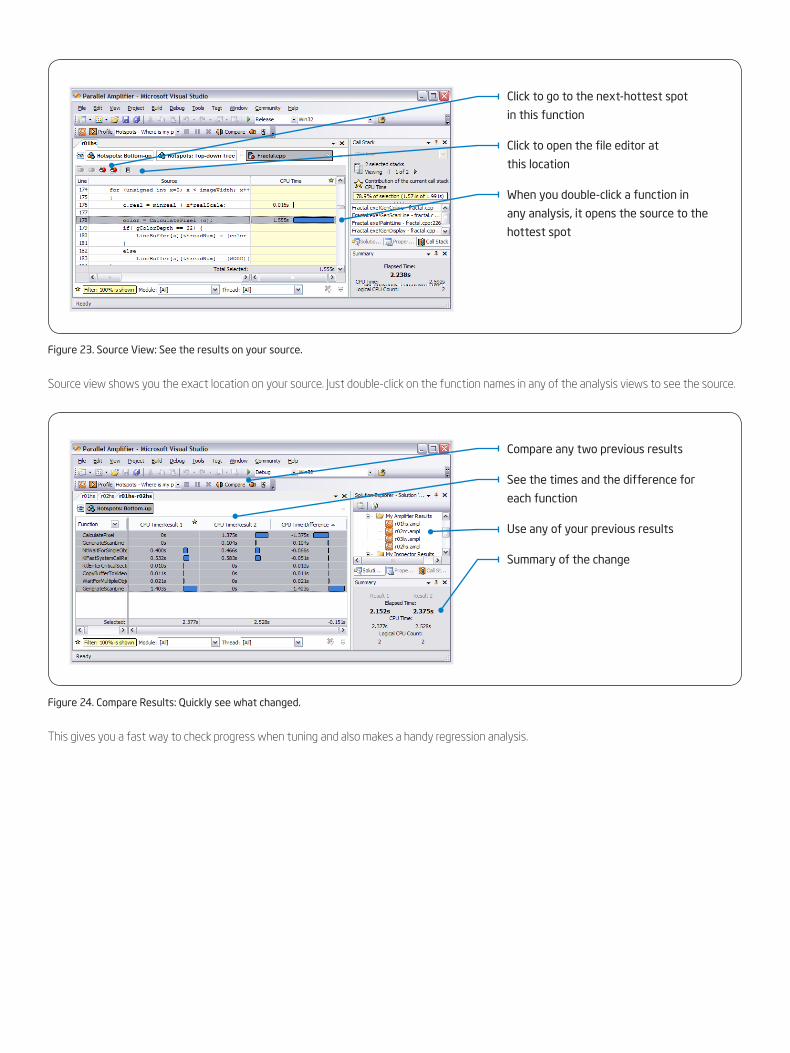
Figure 23. Source View: See the results on your source.
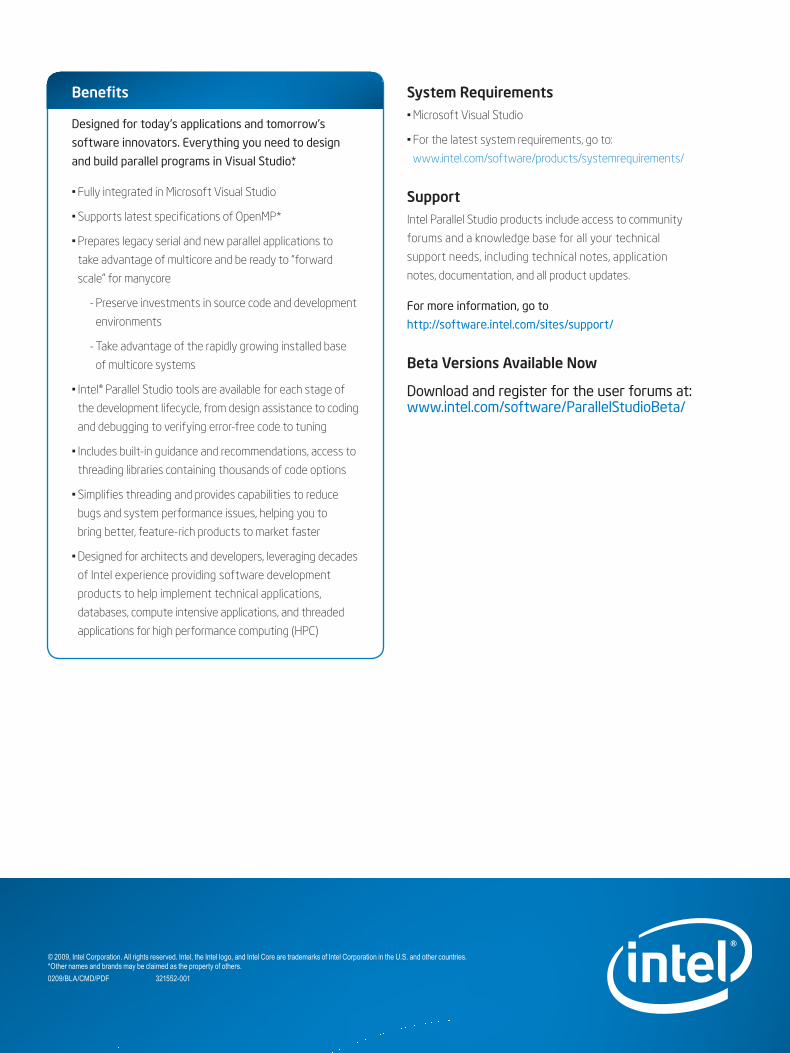
Figure 24. Compare Results: Quickly see what changed.
Source view shows you the exact location on your source. Just double-click on the function names in any of the analysis views to see the source.
This gives you a fast way to check progress when tuning and also makes a handy regression analysis.
Click to go to the next-hottest spot
in this function
Click to open the file editor at
this location
When you double-click a function in
any analysis, it opens the source to the
hottest spot
Compare any two previous results
See the times and the difference for
each function
Use any of your previous results
Summary of the change
© 2009, Intel Corporation. All rights reserved. Intel, the Intel logo, and Intel Core are trademarks of Intel Corporation in the U.S. and other countries. *Other names and brands may be claimed as the property of others.0209/BLA/CMD/PDF 321552-001
Benefits
Designed for today’s applications and tomorrow’s
software innovators. Everything you need to design
and build parallel programs in Visual Studio*.
Fully integrated in Microsoft Visual Studio •
Supports latest specifications of OpenMP*•
Prepares legacy serial and new parallel applications to •
take advantage of multicore and be ready to “forward
scale” for manycore
Preserve investments in source code and development -
environments
Take advantage of the rapidly growing installed base -
of multicore systems
Intel® Parallel Studio tools are available for each stage of •
the development lifecycle, from design assistance to coding
and debugging to verifying error-free code to tuning
Includes built-in guidance and recommendations, access to •
threading libraries containing thousands of code options
Simplifies threading and provides capabilities to reduce •
bugs and system performance issues, helping you to
bring better, feature-rich products to market faster
Designed for architects and developers, leveraging decades •
of Intel experience providing software development
products to help implement technical applications,
databases, compute intensive applications, and threaded
applications for high performance computing (HPC)
System Requirements Microsoft Visual Studio •
For the latest system requirements, go to: •
www.intel.com/software/products/systemrequirements/
Support Intel Parallel Studio products include access to community
forums and a knowledge base for all your technical
support needs, including technical notes, application
notes, documentation, and all product updates.
For more information, go to
http://software.intel.com/sites/support/
Beta Versions Available Now
Download and register for the user forums at: www.intel.com/software/ParallelStudioBeta/
Recommended