Wastewater characteristics
Nidal MahmoudInstitute of Environmental and Water Studies,Institute of Environmental and Water Studies,,,
Birzeit UniversityBirzeit [email protected]
Ecological Sanitation Training CourseSWITCH PROJECT
IEWS, Birzeit University, 25-27 January 2011

OutlineOutline
• Introduction• Introduction• General characteristics• Wastewater parameters• Wastewater parameters• Characteristics of domestic sewage

Introduction
• Why wastewater characterization y• Wastewater characteristics for a certain community
could change with time depending on technologies available.

Introduction
Water quality is described by a series of water quality• Water quality is described by a series of water quality parameters
• A water quality parameter refers to a property of waterA water quality parameter refers to a property of water (such as color, taste, turbidity) or to the composition of water.
• The composition of water can be expressed in the concentration of individual compounds or it can be expressed in the concentration of a group of relatedexpressed in the concentration of a group of related compounds, such as Biochemical Oxygen Demand (BOD), these are called lump parameters.
• Substances present in water are either in solid, liquid, or gas form.

Introduction Water Quality Q y
Parameters Physical parameters Chemical parameters Microbiological
parameters TS COD lifTS COD coliformVS BOD TSS Nkj-N pH NH4-NpH NH4 NTurbidity NO3 conductivity PO4 SO4
Water analysis is essential in:The design and operation of collection, treatment, and reuse facilitiesTo asses reactor performanceTo comply with standardsothers

Main components of wastewater characteristicsMain components of wastewater characteristics
A distinction canalso be madealso be madeaccording toparticle size(important in(important inwatertreatment asthe requiredthe requiredtreatmentprocessd d thdepends on thesize of particlesto b e
d lremoved; alsoin watertreatment).

COD fractions
Raw sewage
Suspended COD (CODss)
4.4 m paper-filtered sewage (CODss)
Colloidal COD (CODcol)
0.45 m membrane filtered sewage
Dissolved COD (CODdis)sewage (CODdis)

Main components of wastewater characteristicsMain components of wastewater characteristics
Physical- Chemical Parameters
ImportanceParameters
________________1 Temperature oC
___________________________________Affects chemical reactions and reaction 1. Temperature C
rates. Low temperature affects bacterial growth.
2. pH Affects chemical biochemical reactions as well as biological activities.
3. Turbidity Due to presence of colloidal matter. When high SS concentration present in WW ithigh SS concentration present in WW, it could be resistant to removal when treating under anaerobic conditions.
Main components of wastewater characteristicsMain components of wastewater characteristicsPhysical- Chemical
ParametersImportance
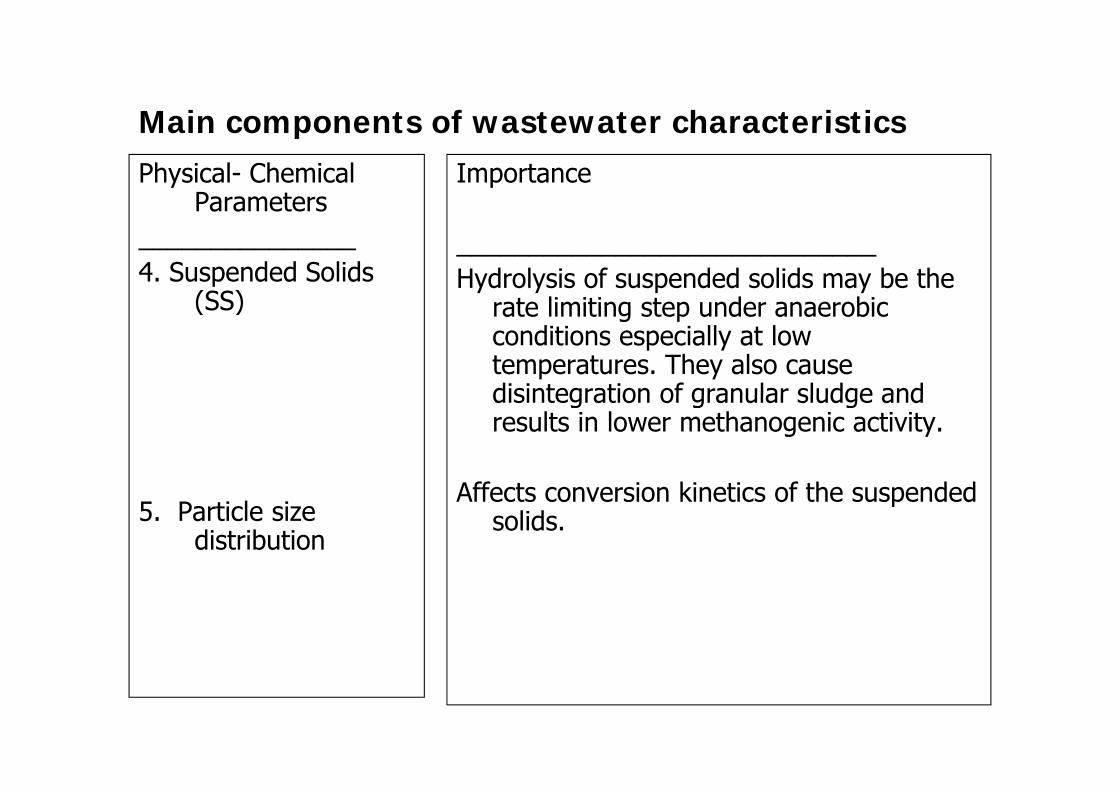
_______________4. Suspended Solids
(SS)
_____________________________Hydrolysis of suspended solids may be the
rate limiting step under anaerobic(SS) rate limiting step under anaerobic conditions especially at low temperatures. They also cause disintegration of granular sludge anddisintegration of granular sludge and results in lower methanogenic activity.
Aff t i ki ti f th d d5. Particle size
distribution
Affects conversion kinetics of the suspended solids.
Main components of wastewater characteristicsp
Physical- Chemical Parameters
Importance
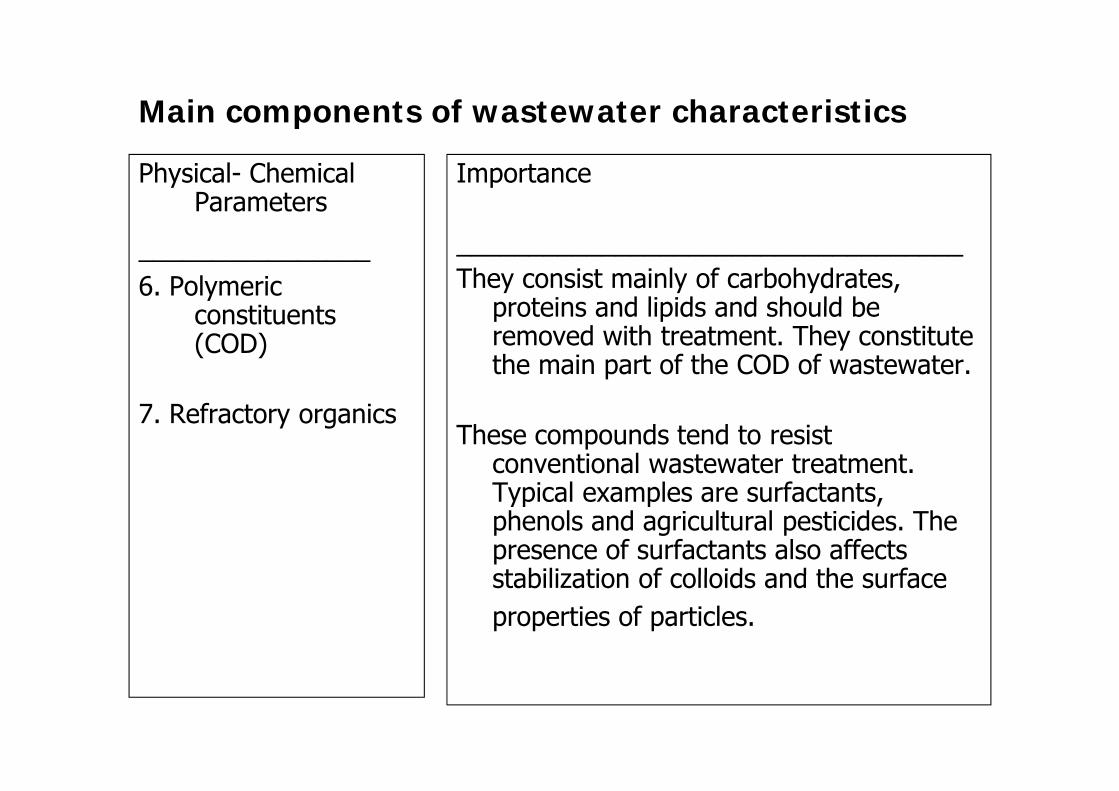
________________6. Polymeric
tit t
___________________________________They consist mainly of carbohydrates,
proteins and lipids and should beconstituents (COD)
proteins and lipids and should be removed with treatment. They constitute the main part of the COD of wastewater.
7. Refractory organics These compounds tend to resist
conventional wastewater treatment. T i l l f t tTypical examples are surfactants, phenols and agricultural pesticides. The presence of surfactants also affects stabilization of colloids and the surfacestabilization of colloids and the surface properties of particles.

Main components of wastewater characteristics
Physical- Chemical ImportanceyParameters
________________
p
___________________________________Organic and inorganic compounds selected
8. Priority pollutantsOrganic and inorganic compounds selected
on the basis of their known or suspected carcinogenic, high acute toxicity. Many of these compounds are found inthese compounds are found in wastewater.
Hi h t ti i hibiti f9. Sulphate High concentration causes inhibition of methanogenesis.
10. Chloride It may have an impact on the final use of treated wastewater

Main components of wastewater characteristicsp
Physical- Chemical Parameters
Importance
________________
11. Heavy metals
___________________________________Toxic to bacteria. I t i t11. Heavy metals
12 N i
Impact on environment.
12. NutrientsMacro (N,P,K) and
micronutrients
Important for biological treatment processes.
13. Biological Parameters Includes pathogenic microorganisms, and all
th i ti i ti iParameters other organisms participating in biological conversions.

Effect of Temperature
• Three ranges of temperature • Effect of low temperature: low methanogenic activity;
low hydrolysis rate.• Temperature has also a direct impact on the physical
chemical characteristics of the solids and solution, including the ability to form a scum layer It also affectsincluding the ability to form a scum layer. It also affects the solubility of gases.

Effect of pHEffect of pH
• Many inhibitory substances for methanogenic bacteria are controlled by pH. For example, organic acids are inhibitory to methanogenic b t i l i th i i d f hi h i i l d t i d bbacteria only in the unionized form which is mainly determined by the pH of the solution.
Optim m pH fo mic oo ganisms g o th• Optimum pH for microorganisms growth
• pH optimum for hydrolysis of organic polymers

Turbidity of wastewater
• Turbidity is an indication of the clarity of a water
• Turbidity is as an optical property
Light sourceLight source
property
• Presence of colloidal particles.SlitSlit
• Determination of colloidal fraction
Sample PhototubeSample Phototube
fraction.
• Colloidal particles in anaerobic Schematic diagram of a nephelometerpreactor.
Schematic diagram of a nephelometer

Turbidity of wastewater
Measurementof gas production
Primary ffl t
From: Mels (2001)
Turbidity measurements are often used to monitor the performance of treatment works processes: on– R t
effluent
Turbidity measurement
( )
TSS mg/l ≈ TSSfx T
of treatment works processes: online measurement
Reactor with filter material
Clarifier
Primary effluent
Polymer dosing pump
TSS, mg/l ≈ TSSfx TWhere,TSS = total suspended solids, mg/l
InfluentCoagulation
mixingFlocculation
mixing
Sludge discharge
Sludge discharge
Relation mg/lTSSf = factor used to convert turbidity readings to total suspended solids, (mg/l 200
250
300
350
D (>
0.4
5 µm
)
between turbidity
and ti l t
suspended solids, (mg/l TSS)/NTUT = turbidity, NTU
y = 2.46xR2 = 0.986
0
50
100
150
Par
ticul
ate
CO
D particulate COD (>
0.45 µm) as found in the0 25 50 75 100 125 150
NTU
found in the jar test
experiments
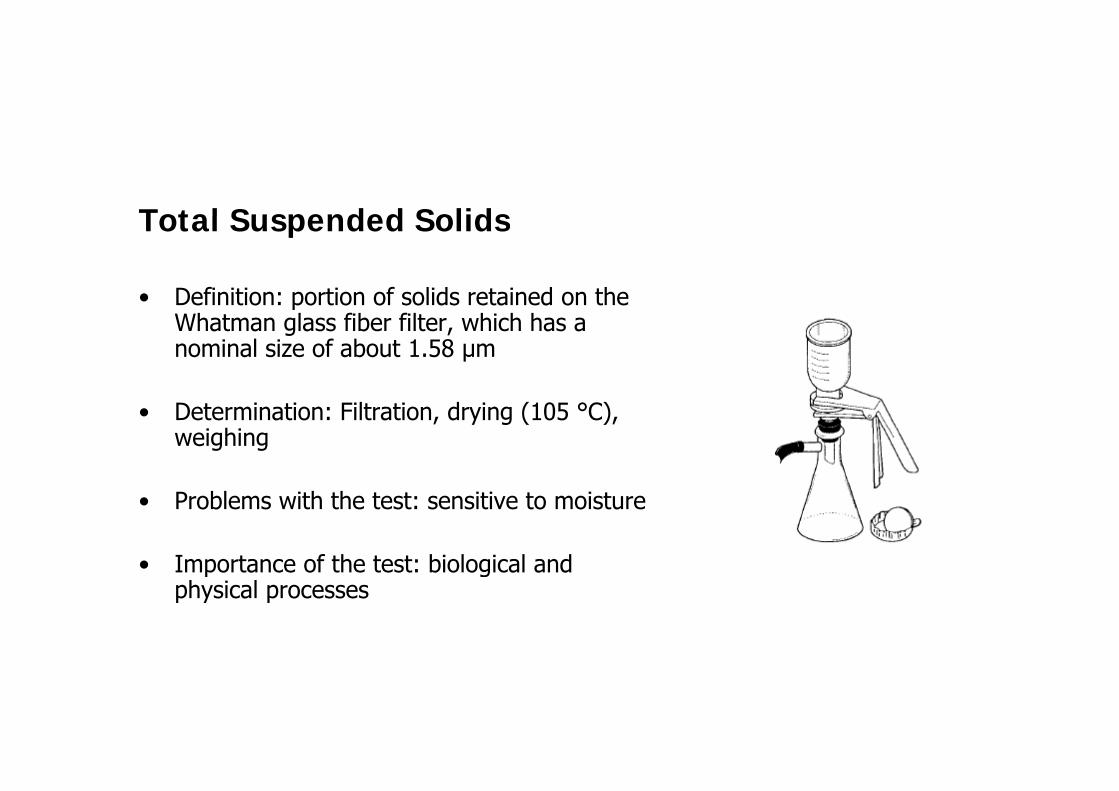
Total Suspended SolidsTotal Suspended Solids
• Definition: portion of solids retained on the pWhatman glass fiber filter, which has a nominal size of about 1.58 µm
• Determination: Filtration, drying (105 °C), weighing
• Problems with the test: sensitive to moisture
• Importance of the test: biological and p gphysical processes

Particle Size DistributionThere is no universal agreement on particle size distribution
Type of matter Particle sizeSuspended matter > 1 µm
There is no universal agreement on particle size distribution
Type of matter Particle sizeSuspended matter > 4.4 µm p µ
Colloidal matter 0.001 – 1 µm Dissolved (or soluble) <0.001 µm
Colloidal matter 0.45 – 4.4 µmDissolved (or soluble) <0.45 µm
ImportanceImportance• First step in biodegradation
process• Treatment methodTreatment method

Sulphate concentration
• Sulphate reducing bacteria are able to oxidize part of the COD present in the wastewater by utilizing sulphate as an electron acceptor.acceptor.
• When sulphate concentration is high, then sulphate reducing bacteria will compete methanogenic bacteria and little CH4 isbacteria will compete methanogenic bacteria and little CH4 is produced.
f• Sulphate reducing bacteria grow at a wide range of pH (5-9). Sulphate reduction can not be controlled in anaerobic reactor except when the SO4- concentration is limited. Fortunately, in domestic
l h t t ti i ll l f l 50sewage, sulphate concentration is generally low, for example, 50-200 mg/l.

Polymeric ConstituentsPolymeric Constituents
• For domestic sewage, the percentage of each polymer may be different from one community to another depending on the lifestyle and standards of living of a society.
• Composition affects the biodegradation process as some polymers, for example, carbohydrates are more readily biodegradable thanfor example, carbohydrates are more readily biodegradable than lipids.
• Organic pollutants in wastewater can be divided into easily• Organic pollutants in wastewater can be divided into easily biodegradable materials and slowly biodegradable materials.

Biochemical oxygen demand (BOD)
Theoretical oxygen demand (ThOD).Theoretical oxygen demand (ThOD).Organic matter: CnHaObNcCnHaObNc+{n + a/4 –b/2 – 3c/4}O2 nCO2 + {a/2 – 3c/2}H2O + cNH3
BOD: defined as the amount of oxygen required to oxidize organic matter by microorganisms under aerobic conditions.g

Priority Pollutants
• The EPA has identified approximately 129 priority pollutants (both organic and inorganic substances), which are suspected to be carcinogenic mutagenic or have high toxicitycarcinogenic, mutagenic or have high toxicity.
• Many of the organic priority pollutants are also classified as volatile i d h d d di h i iorganic compounds. These compounds vary depending on the origin
of wastewater.

Refractory organic compounds
• A typical example on refractory organic compounds is surfactants; or surface active agentsor surface active agents.
• These are large molecules that are slightly soluble in water and g g ycause foaming in wastewater treatment plants. They tend to collect at the air water interface. During aeration of biogas production, these compounds collect at the surface of gas bubbles causing athese compounds collect at the surface of gas bubbles causing a very stable foam which difficult to remove.

Composition of domestic sewage for differentComposition of domestic sewage for different countries (Adopted from Mahmoud et al., 2003)Parameter* Jordan Palestine Egypt The Netherlands Columbia, Cali
CODt 1183 1586 825 528 267
CODss 608 919 225
CODcol 174 274 156CO co 56
CODdis 401 393 270 147 112
VFA-COD 104-177 160 55
NH4-N 80 80 26 48 17NH4-N 80 80 26 48 17
Nkj-N 109 104 34 70 24
Total P 13 9 18 1
PO 3 P 13 4 14PO4-3 -P 13 4 14
Lipids-COD 443 302
Protein-COD 272 224
TSS 420 736 310 215
VSS 330 617 277 108
VSS/TSS 79 84 89 50
Temperature 16-24 8-20 25
* All parameters are in mg/l, except for temperature (o C), VSS/TSS ratio.

Biodegradability and Biodegradation rate of sewageBiodegradability and Biodegradation rate of sewage
• Definition of
O 10%O 10%O %
biodegradabilityNaOH 10%
Septum
NaOH 10%NaOH 5%
Septum
• Procedure used for determination
Serum bottle with ca. 5 g sludge COD
+ 1 ml NaOH solution = 1 ml of CH4 produced = 2 5 mg
Serum bottlewith ca. 5 g sludge COD
+ 1 ml NaOH solution = 1 ml of CH4 produced = 2 5 mg
• Determination of
granular sludge
(1 g VSS)30 degr.
1 ml NaOH solution = 1 ml of CH4 produced = 2.5 mg COD degraded
granular sludge
(1 g VSS)30°C .
1 ml NaOH solution = 1 ml of CH4 produced = 2.5 mgCOD degraded
biodegradation rates of different polymers.
50%
60%70%80%90%
100%
grad
ed p
art
0%
10%20%30%40%50%
0.0 5.0 10.0 15.0 20.0 25.0 30.0 35.0 40.0 45.0 50.0
Biod
eg
time (days)

Composition of wastewater (polymeric constituents)p (p y )
Average percentages of carbohydrates, lipids and proteins for the two influents compared to data presented in literaturetwo influents, compared to data presented in literature.
Values in brackets are percentages of TSS
Khirbit As-Samra
Abu-Nusier McInery,(1988)
Elmitwalli,(2001)( ) ( )
Carbohydrates 5 (21.8) 5 (15) (12.8) 9-17
P i 45 (28) 48 (27 1) 31 58Proteins 45 (28) 48 (27.1) 31-58
Lipids 23 (34) 31 (39) (34.4) ---

Biodegradability of wastewaterBiodegradability of wastewater
Biodegradability of the wastewatersBiodegradability of the wastewaters
Time (day) 130 224
Khi bit A S 56 1 78 4Khirbit As-Samra 56.1 78.4
Abu-Nusier 75.8 (8.6) ---

Wastewater Characteristics of Ramallah City, Al - Bireh City and Al-Jalazoon refugee camp
Parameters # Samples Ramallah Al-Bireh Al-Jalazoon Range AVR STD Range AVR STD Range AVR STD COD Total 8 1518-3812 2180 663 1411-1844 1586 125 1092-1773 1489 251
Suspended 8 545 – 1925 1096 456 720-1209 919 157 518-990 725 153 Colloidal 8 107 525 323 101 171 362 274 52 4 213 440 327 71 3Colloidal 8 107- 525 323 101 171-362 274 52.4 213-440 327 71.3
Dissolved 8 468-1482 761 297 280-464 393 62.3 258-613 438 113 Carboh. Total 5 100-231 178.4 52.6 99-166 131 22.8 59-155 93.5 32.7
Suspended 5 45-90 64.1 20.2 67-132 97.4 25.3 28-88 44.8 21.3 Colloidal 5 10-35 21.6 10 9-14 11.7 1.8 4-14 9.9 3.7
Dissolved 5 37-157 92.6 55.4 17-37 22.2 7.4 15-60 38.8 17.3VFA as COD 2 175-199 187 12 155-162 160 3.1 100-145 123 25.4 Nkj as N 6 54-119 99.4 23.2 85-122 104 14.7 53-83 71 10 NH4
+ as N 8 47-72 58 8.5 72-89 80.1 5 40-77 56.2 9.5 +Proteins 388 224 139Total PO4 as P 3 10-15 12.8 2.2 11-14 13 1.5 11-18 15 2.4 PO4
3- as P 5 6-17 12.4 3.8 8-15 12.9 2.6 8-14 11.9 2.4 SO4
2- as SO42- 4 474-2060 975 742 129-151 138 9.9 143-277 213 57
TSS 5 510-1096 729 197 610-824 736 67 408-1048 630 234 VSS 5 255 892 584 209 492 676 617 66 1 364 733 480 148VSS 5 255-892 584 209 492-676 617 66.1 364-733 480 148Settleable solids 7 4-105 43.5 41.1 8.5-13.5 10.9 2.2 1.2-8 2.9 2.4 pH 4 7.18-8.02 7.45 0.39 7.16-7.44 7.26 0.13 7.11-7.58 7.31 0.2 Tww Summer 8 26-40 30.9 3.19 24-27 25.8 0.67 20-25 23.4 1.52 Winter 4 12-13 13.13 0.63 Tamb. Summer 8 21-33 27.1 3.17Winter 4 11-17 13.8 2.75 Biodegradability 2 46-49 47 1.4 34-40 36 3.2 32-35 33 1.5 Colour 8 Reddish to black Medium brown Light brown
All parameters have been measured in duplicate and their units are in mg/l except settleable solid in ml/l; wastewater temperatures (Tww) and ambient temperature (Tamb) (o C); pH no unit; Biodegradability (%); Proteins mg COD/l+Calculated

Percentages of hydrolysis and acidification of total COD and acidification of dissolved COD and VSS/TSS and CODss/VSS ratios for the sewage of Ramallah and Al Bireh cities and AL Jalazoon
P t R ll h Al Bi h AL J l
for the sewage of Ramallah and Al-Bireh cities and AL-Jalazoon refugee camp-Palestine
Parameter Ramallah Al Bireh AL-JalazoonAcidified fraction VFA/CODt 10 10 9 Acidified of dissolved VFA/CODdis 27 36 35 H d l d f ti CODdi /CODt 39 28 25Hydrolysed fraction CODdis/CODt 39 28 25 VSS/TSS 80 84 76 CODss/VSS 1.88 1.49 1.51

P t f b h d t t i d VFA t f t t l COD fPercentages of carbohydrates, proteins and VFA out of total COD for domestic/municipal wastewater of Ramallah, Al-Bireh cities and AL-Jalazoon refugee camp-Palestine and Bennekom village-The Netherlands
Parameter Ramallah Al-Bireh AL-Jalazoon Bennekom-The Netherland Carb-COD/CODt 8.8 8.9 6.7 12 P otein COD/CODt 18 14 9 44Protein-COD/CODt 18 14 9 44VFA/CODt 10 10 9 9 Sub total COD 36.8 32.9 24.7 65

Gray wastewater characteristics of 25 houses in Biet-Diko
Item BOD5 COD pH EC TDS SVI TS TSS Cl- HCO3- NH4
+ NO3- SO4
2- PO43- Ca2+ Mg2+ Na+ K+ FC
Gray wastewater characteristics of 25 houses in Biet-Diko and Bilien villages/Palestine
Unit mg/l mg/l μs/cm ppm ml/l mg/l mg/l mg/l mg/l mg/l mg/l mg/l mg/l mg/l mg/l mg/l mg/l
CFU/100 ml
value 590 1270 6.6 1585 935 11.4 1780 1396 255 230 3.8 38 74 4.4 75 35 126 16 60
Recommended