INFORMATION ARCHITECTUREGetting Your Blueprints In Order

Defining User Experience
Defining Information Architecture (IA)
Breaking Down the Concepts of Information Architecture
How Does IA Fit into the Project Lifecycle
Strategy and Tactics
Wireframe to Design Examples
Why IA Matters
Agenda

The term used to describe the overall experience and satisfaction a user has when using a product or system.
It most commonly refers to a combination of software and business topics, such as selling over the web, but it applies to any result of interaction design.*
*Wikipedia – http://en.wikipedia.org/wiki/User_experience
What is User Experience?

*Jesse James Garrett http://www.jjg.net/elements/pdf/elements.pdf
Elements of User Experience
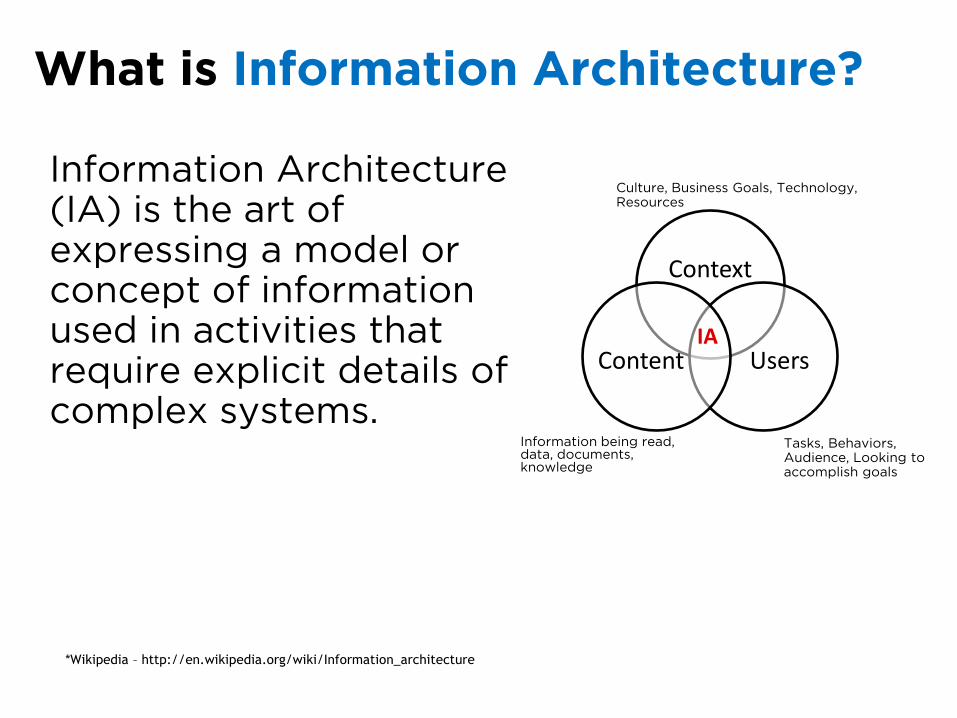
Information Architecture (IA) is the art of expressing a model or concept of information used in activities that require explicit details of complex systems.
What is Information Architecture?
*Wikipedia – http://en.wikipedia.org/wiki/Information_architecture
Context
UsersContentIA
Culture, Business Goals, Technology, Resources
Tasks, Behaviors, Audience, Looking to accomplish goals
Information being read, data, documents, knowledge
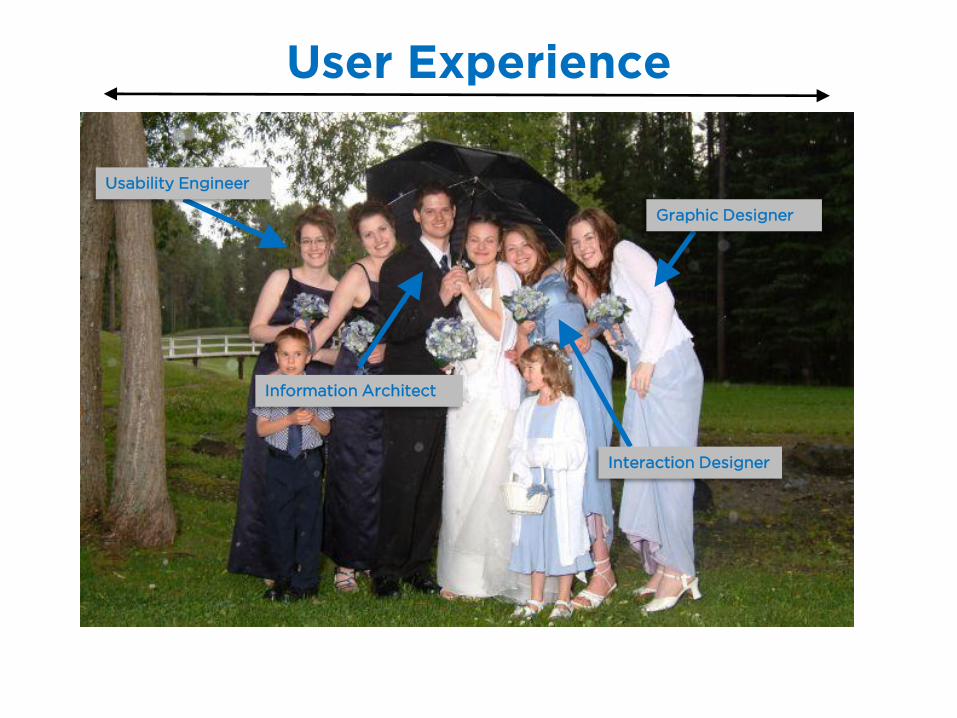
User Experience
Graphic Designer
Interaction Designer
Usability Engineer
Information Architect

Richard Saul Wurman coined the term in
“information architecture” in 1997

Let’s take a Deeper Dive
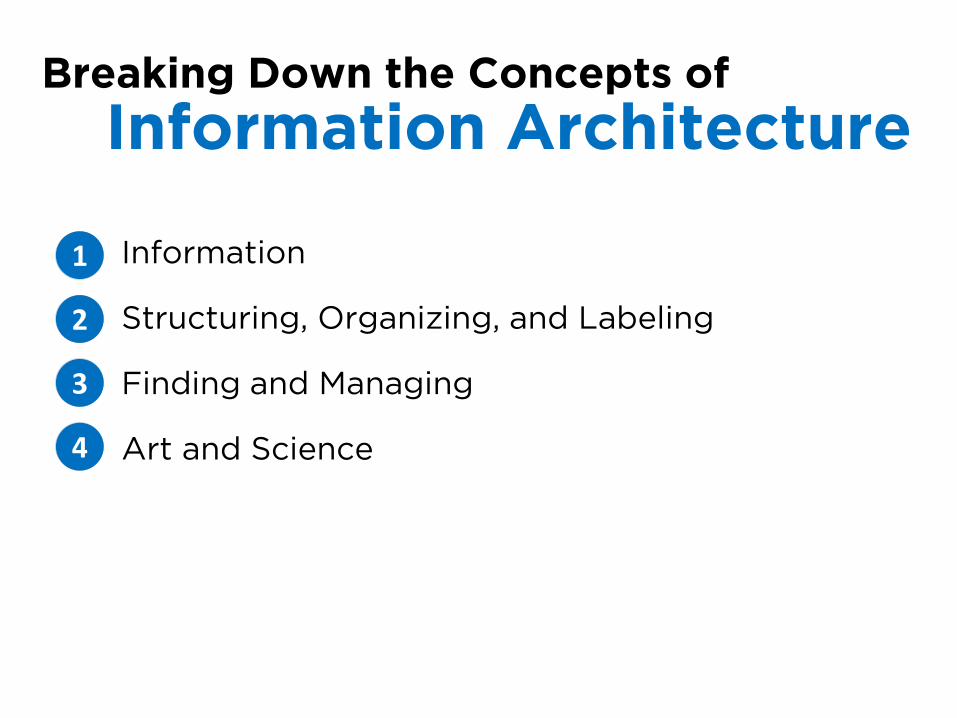
Breaking Down the Concepts of
Information Architecture
1
2
3
4
Information
Structuring, Organizing, and Labeling
Finding and Managing
Art and Science

Informationis Data andKnowledge

Howwould you
Structure,
Organize and
Label all of these
products from scratch?

Your Users Are….
browse.
search.
askquestions.
Can they find your data?

Managing these solutions entails finding a balance between the user and the businessneeds

Experience
Intuition
Creativity
Little Bit of Art Little Bit of Science User Needs
Patterns of Behavior
Scientific Analysis

Succinctly…
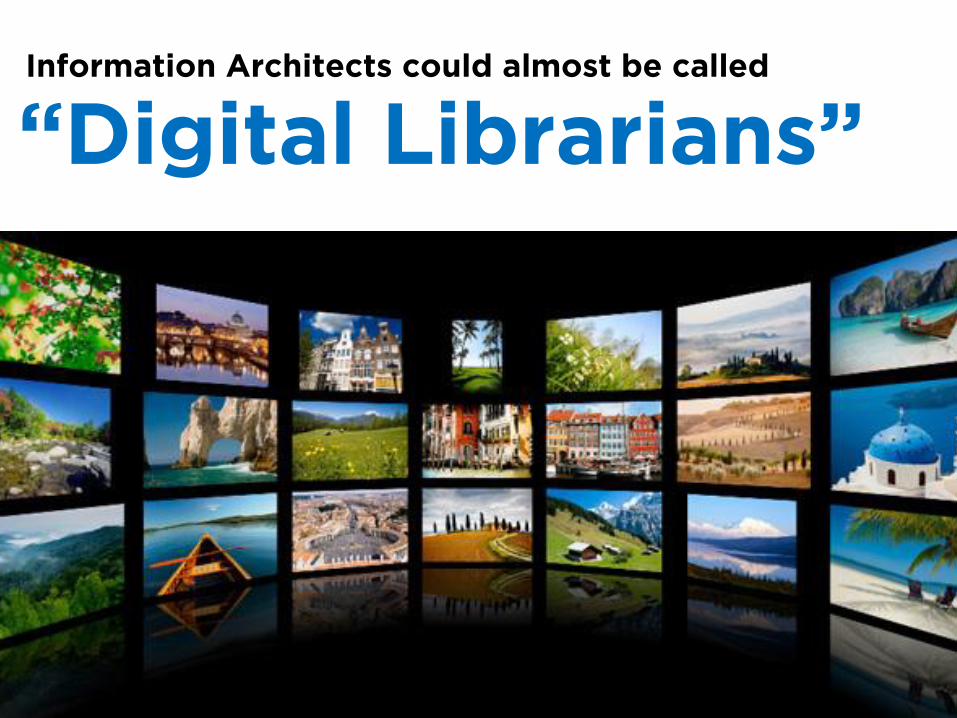
Information Architects could almost be called
“Digital Librarians”

Where Does IA Fit into
the Project Lifecycle?

Discovery Design Build Test Launch
Typical Project Process

Optimized Project Lifecycle

Optimized Project Lifecycle
Strategy and Tactics

Audience Research
Audience Personas
Content Audit / Analysis
Classification Schemes
Labeling
Card sorting
Affinity Diagrams
Data Flow Diagrams
Beta Sitemap
Content Maps
Low-Fi Wireframes Hi-Fi Wireframes
Navigation Optimization
Wireframe Testing
Users
Business
Technical
Requirements
Str
ate
gy
Tacti
cs

Audience Research and Personas
Conduct interviews
with your users
Online user testing
Audience surveys
Record each session
with audio and or
video.
Watch, list, and
interact
Formulate personas
based off of your
research

Content Audit and Analysis
Is there an existing website? Is there a current sitemap
that illustrates the number of pages per domain?
Need to understand the existing content and data
types in order to optimize the hierarchy
Target the content types instead of generalities
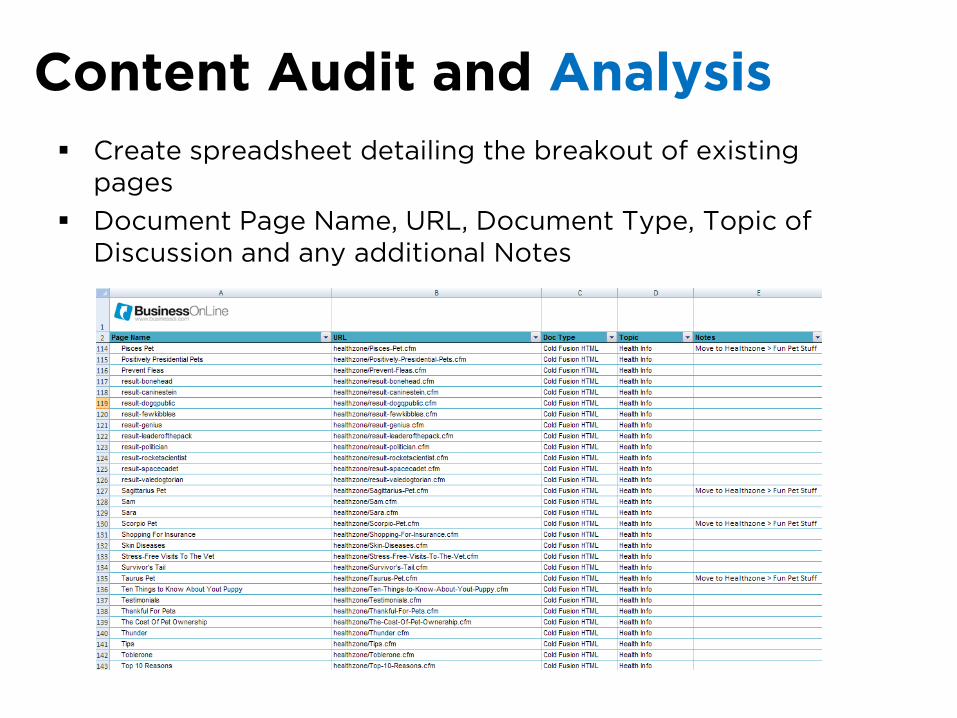
Content Audit and Analysis
Create spreadsheet detailing the breakout of existing
pages
Document Page Name, URL, Document Type, Topic of
Discussion and any additional Notes

Classification Schemes
How Will the Content Be
Organized?
Alphabetical
Audience
Color
Date
Geographic
Popularity
Tag-Based
Task
Topic

Labeling
Need clear and concise
words that differentiate
grouping from grouping
Where to look for input on
justified labeling conventions
Ask individuals during user
research
Information gathered from
card sorting exercises
Review internal search
words
Review referring keywords

Card sorting
Task users with
grouping
information in a
fashion that makes
the most sense to
them
2 different types of
card sorts: Open and
Closed
Results are analyzed
and used as a guide
when creating the
website’s hierarchy

Affinity Diagrams
Describes the system
from the users point of
view
Captures the behavioral
requirements by detailing
the scenario driven
requests by each persona
Useful for illustrating the
interaction between the
audience and the system
and/or website

Data Flow Diagrams
Graphical representation of
the “flow of data” through an
information system.
Data Flow diagrams can also
be used for the visualization
of data processing.*
*Wikipedia http://en.wikipedia.org/wiki/Data_flow_diagram
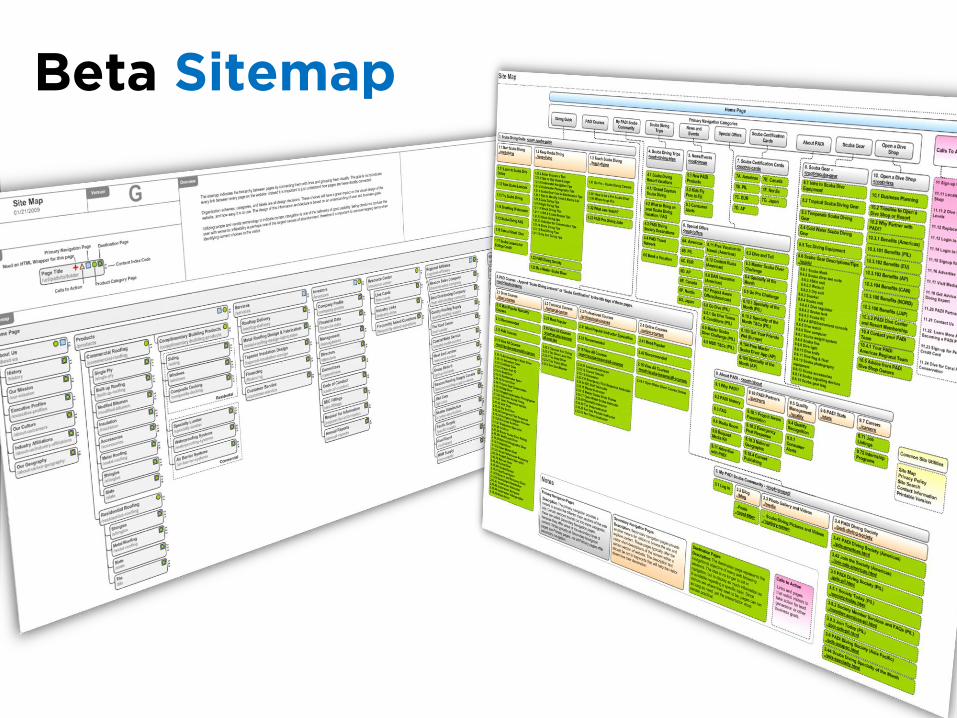
Beta Sitemap

Content Map
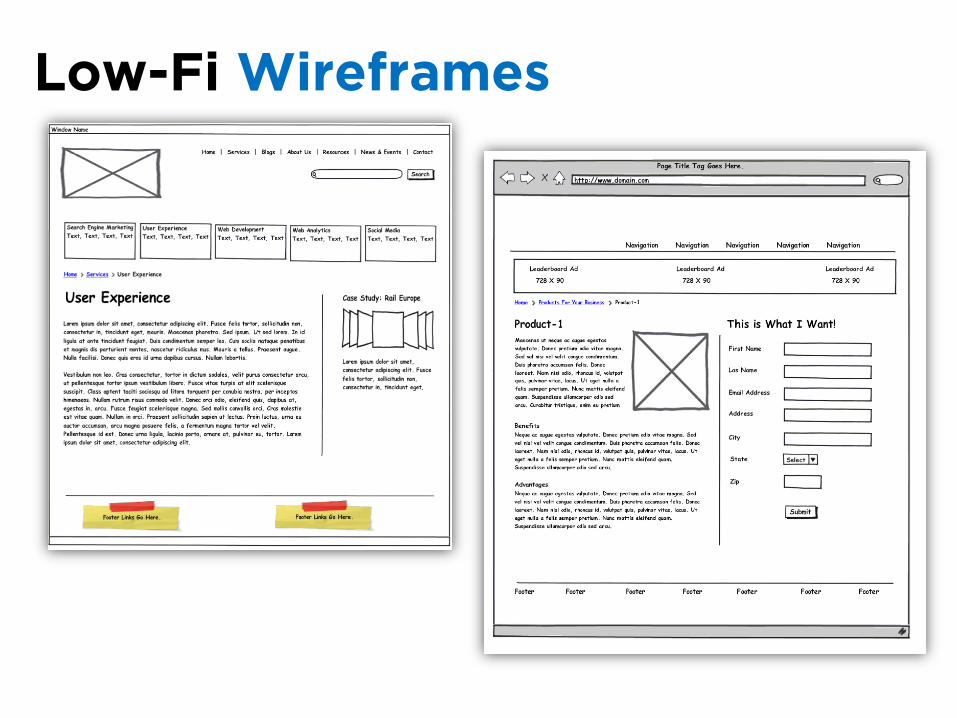
Low-Fi Wireframes

High-Fi Wireframes

Navigation Optimization
Are your targeted keywords
present within the
architecture?
Are there any words that
can be changed which will
not change the context of
the label?
Must strike the balance
between optimizing for
search engines and
changing the meaning for
the user
Example: Instead of just “Articles”
what type of articles are they? Could
they be labeled “Cooking Articles.”

Wireframe Testing
Moderated and
Unmoderated testing
Users are assigned
tasks to complete
“Blocks of content” are
clickable to other
wireframes
Testing is recorded to
capture the subtleties
All qualitative data

Wireframe to Design Examples
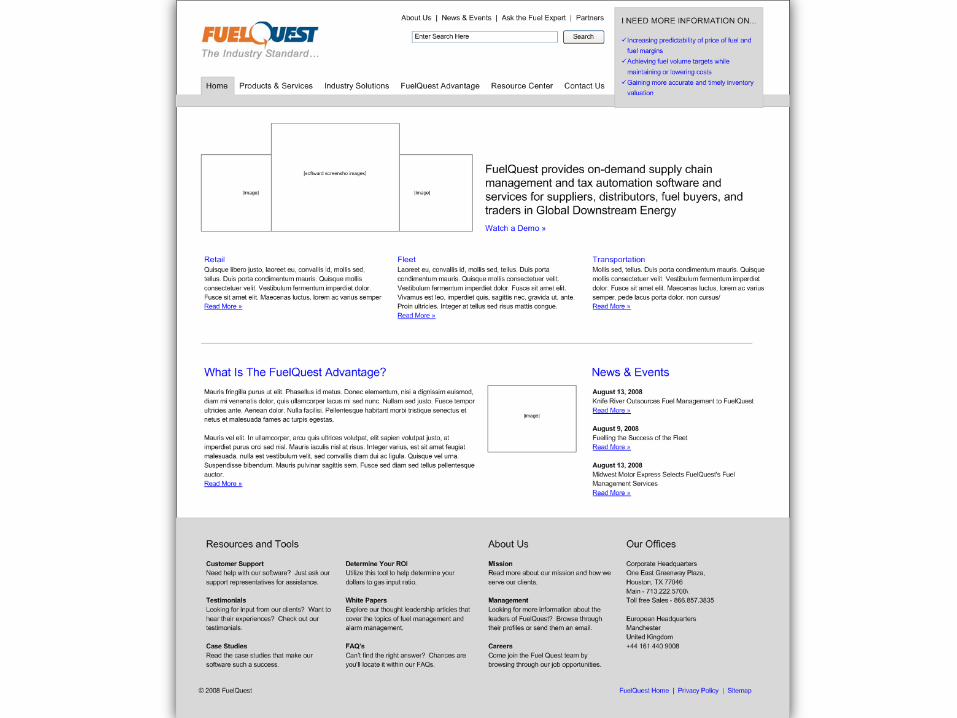


Why Does Information Architecture Matter?

Why Does Information Architecture Matter?
consider this…

Do you know how many potential customers
leave your site due to frustration?

How much extra
time and money is
spent on customer
support because
your customers
can’t find the
information they
seek?

If customers can’t find what they’re
looking for, what does that say about
your brand?

Jakob Nielson states:
The cost of poor navigation and lack of
design standards is….at least ten million
dollars per year in lost employee
productivity for a company with 10,000
employees.
“
”
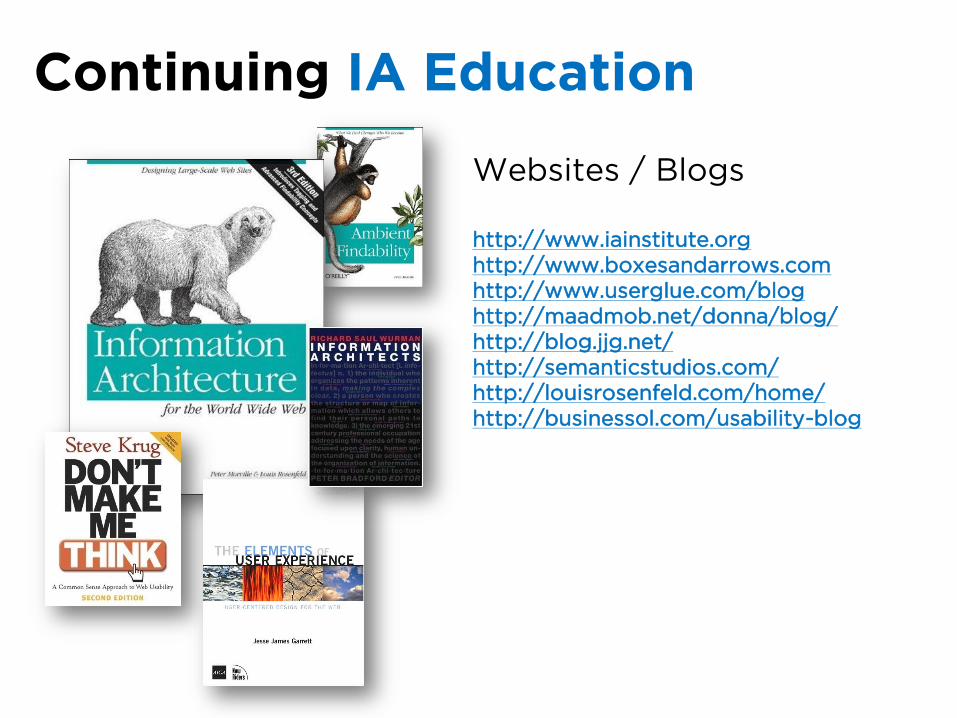
Continuing IA Education
Websites / Blogs
http://www.iainstitute.org
http://www.boxesandarrows.com
http://www.userglue.com/blog
http://maadmob.net/donna/blog/
http://blog.jjg.net/
http://semanticstudios.com/
http://louisrosenfeld.com/home/
http://businessol.com/usability-blog


Thank you.
Questions.
Wrap Up.
Recommended