Independent Component Analysis & Blind Source Separation
Bob DurrantSchool of Computer Science
University of Birmingham
(Slides: Dr Ata Kabán)
Overview
• Today we learn about – The cocktail party problem - called also ‘blind
source separation’ (BSS)– Independent Component Analysis (ICA) for solving
BSS– Other applications of ICA / BSS
• At an intuitive & introductory & practical level

A bit like…
...in the sense of having to find quantities that are not observable directly.

Signals, joint density
time
Am
plitu
de
S1(t
)
Am
plitu
de
S2(t
)
Signals Joint density
s
marginal densities

Original signals (hidden sources) s1(t), s2(t), s3(t), s4(t), t=1:T

The ICA model
s1 s2s3 s4
x1 x2 x3 x4
a11
a12a13
a14
xi(t) = ai1*s1(t) + ai2*s2(t) + ai3*s3(t) + ai4*s4(t)
Here, i=1:4.
In vector-matrix notation, and dropping index t, this is x = A * s

This is recorded by the microphones: a linear mixture of the sources
xi(t) = ai1*s1(t) + ai2*s2(t) + ai3*s3(t) + ai4*s4(t)

The Cocktail Party Problem
Also known as the Blind Source Separation (BSS) problem.
Ill-posed problem, unless assumptions are made!
The most common assumption is that source signals are statistically independent. This means that knowing the value of one of them does not give any information about the others.
The methods based on this assumption are called Independent Component Analysis methods. These are statistical techniques of decomposing a complex data set into independent parts.
It can be shown that under some reasonable conditions, if the ICA assumption holds, then the source signals can be recovered up to permutation and scaling.
Determine the source signals, given only the mixtures

Recovered signals

Some further considerations
• If we knew the mixing parameters aij then we would just need to solve a linear system of equations.
• We know neither aij nor si. • ICA was initially developed to deal with problems
closely related to the cocktail party problem • Later it became evident that ICA has many other
applications too (e.g. recovering underlying components of brain activity from electrical recordings at different locations of the scalp (EEG signals)).
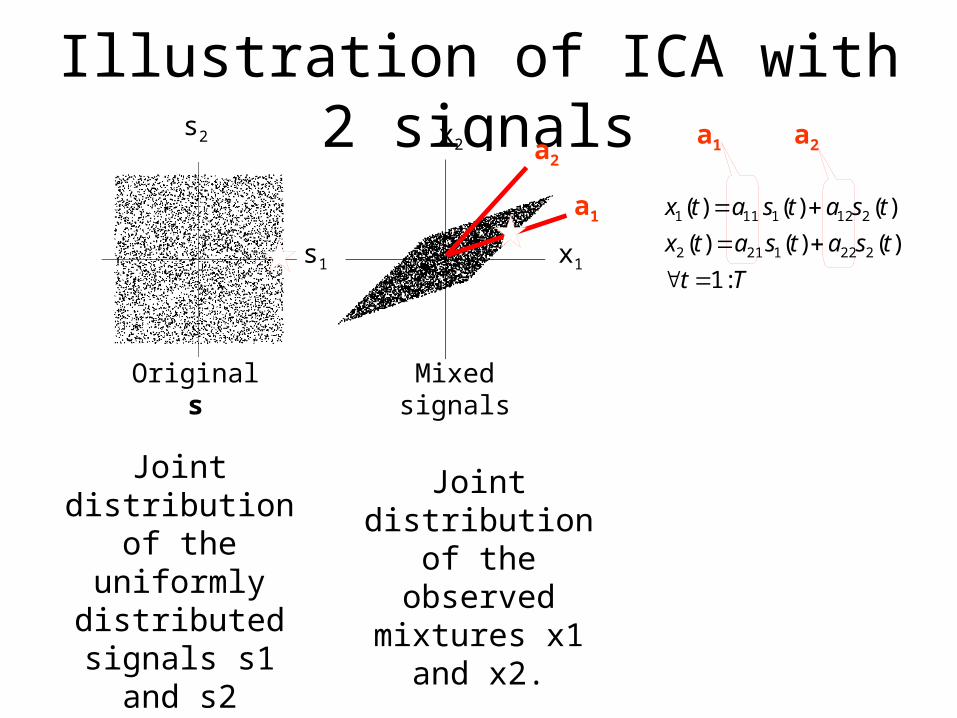
Illustration of ICA with 2 signals
s1
s2
x1
x2
Tt
tsatsatx
tsatsatx
:1
)()()(
)()()(
2221212
2121111
Original s Mixed signals
a2
a1
a1
Joint distribution of the uniformly
distributed signals s1 and s2
Joint distribution of the observed
mixtures x1 and x2.
a2
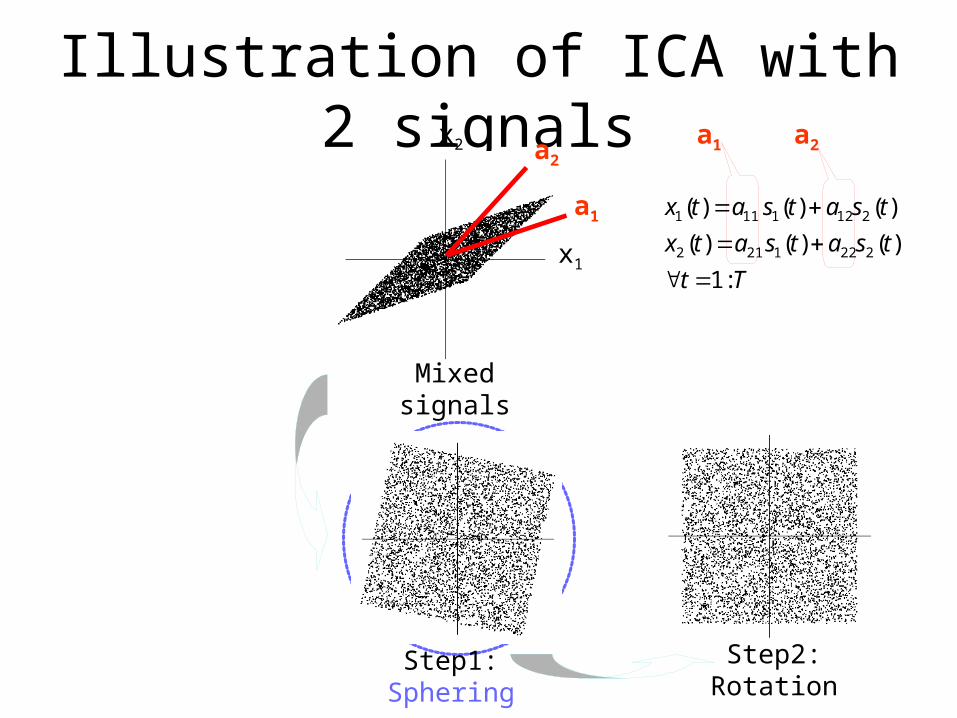
Illustration of ICA with 2 signals
x1
x2
Step1: Sphering
Step2: Rotation
Mixed signals
a2
a1
Tt
tsatsatx
tsatsatx
:1
)()()(
)()()(
2221212
2121111
a1 a2

Illustration of ICA with 2 signals
s1
s2
x1
x2
Step1: Sphering
Step2: Rotatation
Original s Mixed signals
a2
a1
Tt
tsatsatx
tsatsatx
:1
)()()(
)()()(
2221212
2121111
a1 a2

Excluded case
There is one case when rotation doesn’t matter. This case cannot be solved by basic ICA.
…when both densities are Gaussian
Example of non-Gaussian density (-) vs.Gaussian (-.)
Seek non-Gaussian sources for two reasons:* identifiability* interestingness: Gaussians are not interesting since the superposition of independent sources tends to be Gaussian

Computing the pre-processing steps for ICA
0) Centring = make the signals centred in zeroxi xi - E[xi] for each i
1) Sphering = make the signals uncorrelated. i.e. apply a transform V to x such that Cov(Vx)=I // where Cov(y)=E[yyT] denotes covariance matrix
V=E[xxT]-1/2 // can be done using ‘sqrtm’ function in MatLab xVx // for all t (indexes t dropped here) // bold lowercase refers to column vector; bold upper to matrix
Scope: to make the remaining computations simpler. It is known that independent variables must be uncorrelated – so this can be fulfilled before proceeding to the full ICA.

Computing the rotation step
• Fixed Point Algorithm• Input: X• Random init of W• Iterate until convergence:
• Output: W, S
• where g(.) is derivative of G(.), W is the rotation transform sought Λ is Lagrange multiplier to enforce that W is an orthogonal transform i.e. a rotation
• Solve by fixed point iterations
• The effect of Λ is an orthogonal de-correlation
1)(
)(
WWWW
SXW
XWS
T
T
T
g
Aapo Hyvarinen (97)
This is based on an the maximisation of an objective function G(.) which contains an approximate non-Gaussianity measure.
The overall transform then to take X back to S is (WTV)
There are several g(.) options, each will work best in special cases. See FastICA sw / tut for details.
0ΛWXWXW
TTgObj
)(
T
t
Tt
TGObj1
)()()( IWWΛxWW

Application domains of ICA
• Blind source separation (Bell&Sejnowski, Te won Lee, Girolami, Hyvarinen, etc.)
• Image denoising (Hyvarinen)• Medical signal processing – fMRI, ECG, EEG (Mackeig)• Modelling of the hippocampus and visual cortex (Lorincz,
Hyvarinen)• Feature extraction, face recognition (Marni Bartlett)• Compression, redundancy reduction• Watermarking (D Lowe)• Clustering (Girolami, Kolenda)• Time series analysis (Back, Valpola)• Topic extraction (Kolenda, Bingham, Kaban)• Scientific Data Mining (Kaban, etc)

Image denoising
Wiener filtering
ICA filtering
Noisy image
Original image

Clustering
In multi-variate data search for the direction along which the projection of the data is maximally non-Gaussian = has the most ‘structure’

Blind Separation of Information from Galaxy Spectra
0 50 100 150 200 250 300 350-0.2
0
0.2
0.4
0.6
0.8
1
1.2
1.4

Decomposition using Physical Models
Decomposition using ICA

Summing Up
• Assumption that the data consists of unknown components– Individual signals in a mix– topics in a text corpus– basis-galaxies
• Trying to solve the inverse problem:– Observing the superposition only– Recover components– Components often give simpler, clearer view of the
data

Related resources
• http://www.cis.hut.fi/projects/ica/cocktail/cocktail_en.cgi– Demo and links to further info on ICA.
• http://www.cis.hut.fi/projects/ica/fastica/code/dlcode.shtml– ICA software in MatLab.
• http://www.cs.helsinki.fi/u/ahyvarin/papers/NN00new.pdf– Comprehensive tutorial paper, slightly more technical.
Recommended