Importance-Driven Time-Varying Data Visualization
Chaoli Wang, Hongfeng Yu, Kwan-Liu MaUniversity of California, Davis
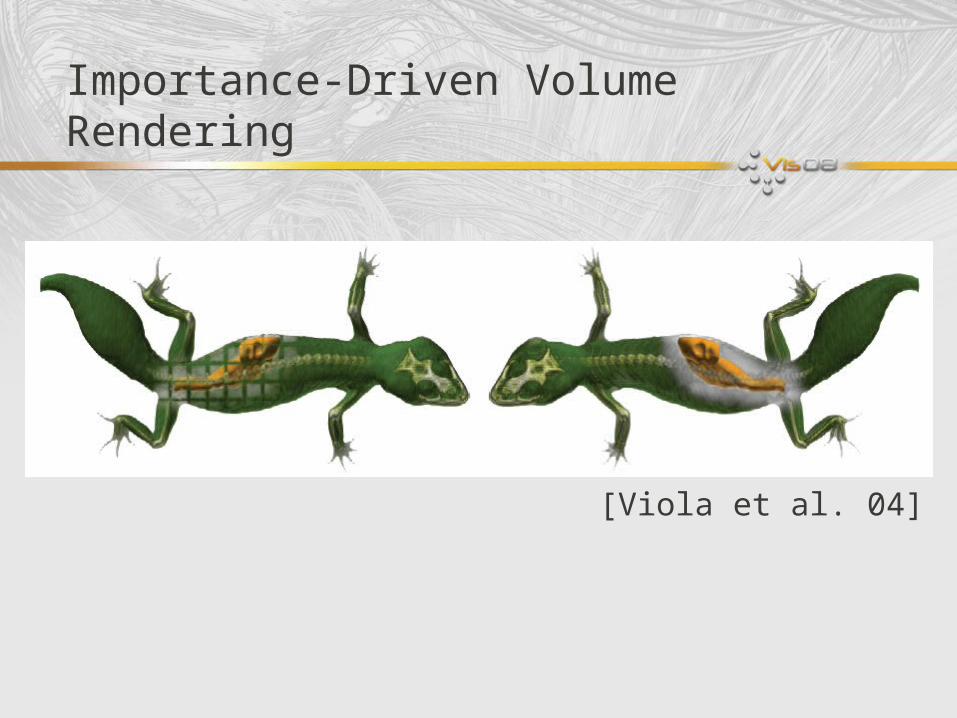
Importance-Driven Volume Rendering
[Viola et al. 04]
Differences
• Medical or anatomical data sets• Pre-segmented objects• Importance assignment• Focus on rendering
• Time-varying scientific data sets• No segmentation or objects are given• Importance measurement• Focus on data analysis
Questions
• How to capture the important aspect of data?• Importance – amount of change, or “unusualness”
• How to utilize the importance measure?• Data classification• Abnormality detection• Time budget allocation• Time step selection
Related Work
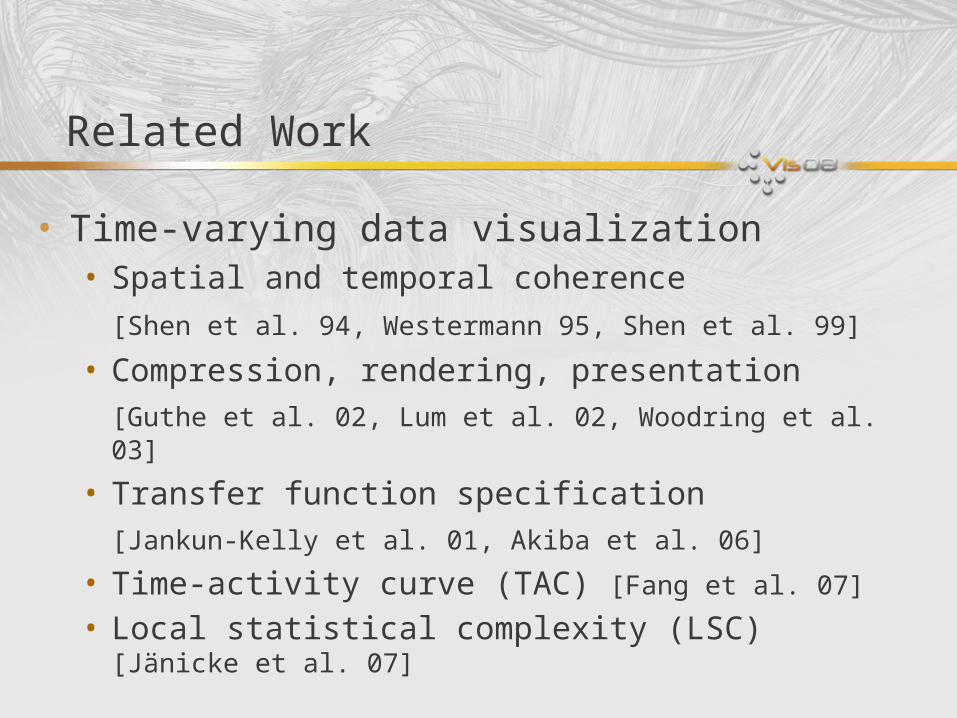
• Time-varying data visualization• Spatial and temporal coherence
[Shen et al. 94, Westermann 95, Shen et al. 99] • Compression, rendering, presentation
[Guthe et al. 02, Lum et al. 02, Woodring et al. 03]
• Transfer function specification
[Jankun-Kelly et al. 01, Akiba et al. 06]
• Time-activity curve (TAC) [Fang et al. 07]
• Local statistical complexity (LSC) [Jänicke et al. 07]
Importance Analysis
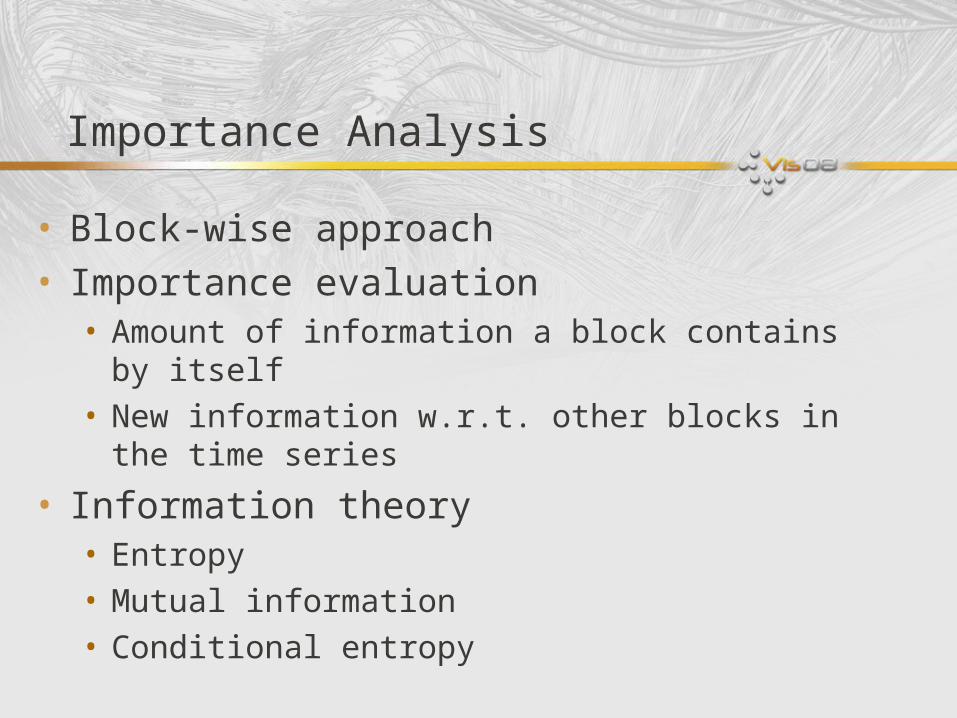
• Block-wise approach• Importance evaluation
• Amount of information a block contains by itself• New information w.r.t. other blocks in the time series
• Information theory• Entropy• Mutual information• Conditional entropy
Information Theory
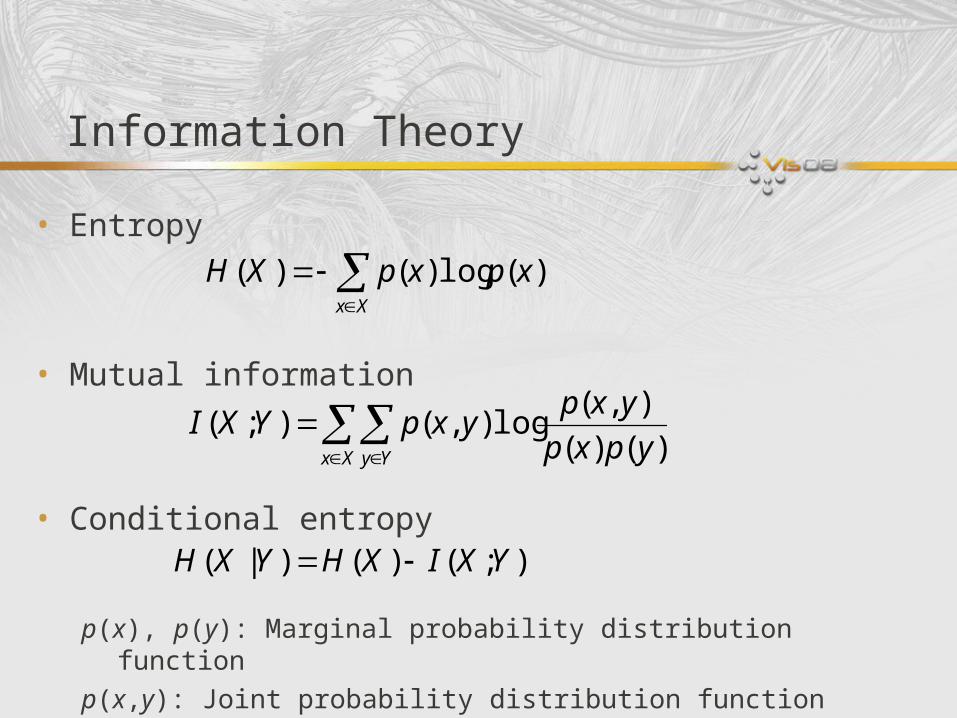
• Entropy
• Mutual information
• Conditional entropy
Xx
xpxpXH )(log)()(
);()()|( YXIXHYXH
Xx Yy ypxp
yxpyxpYXI
)()(
),(log),();(
p(x), p(y): Marginal probability distribution function
p(x,y): Joint probability distribution function
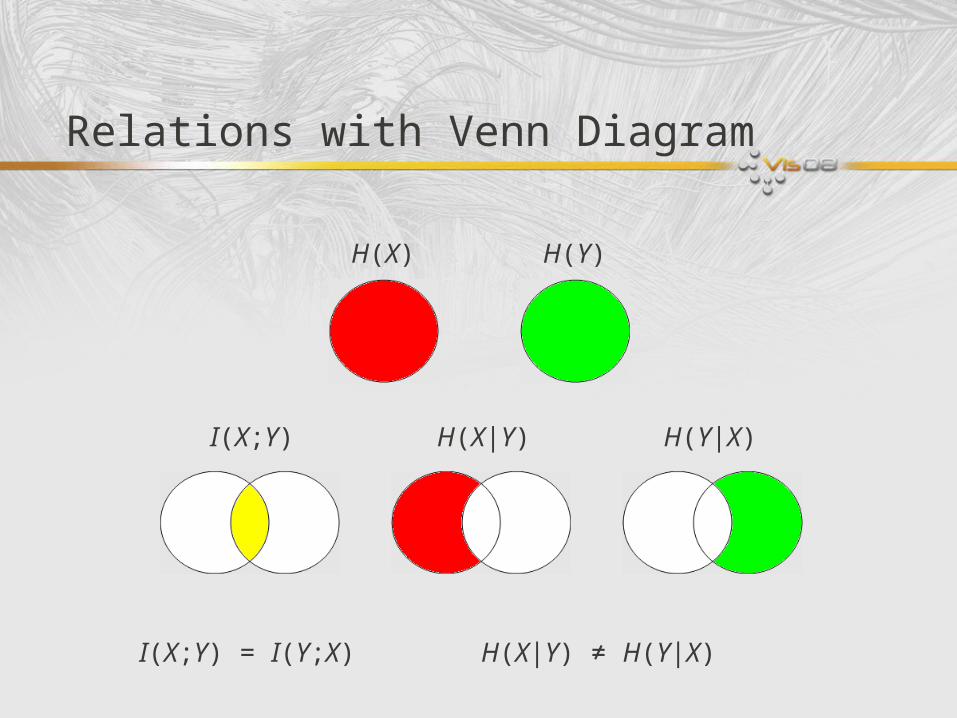
Relations with Venn Diagram
H(X) H(Y)
I(X;Y) H(X|Y) H(Y|X)
I(X;Y) = I(Y;X) H(X|Y) ≠ H(Y|X)
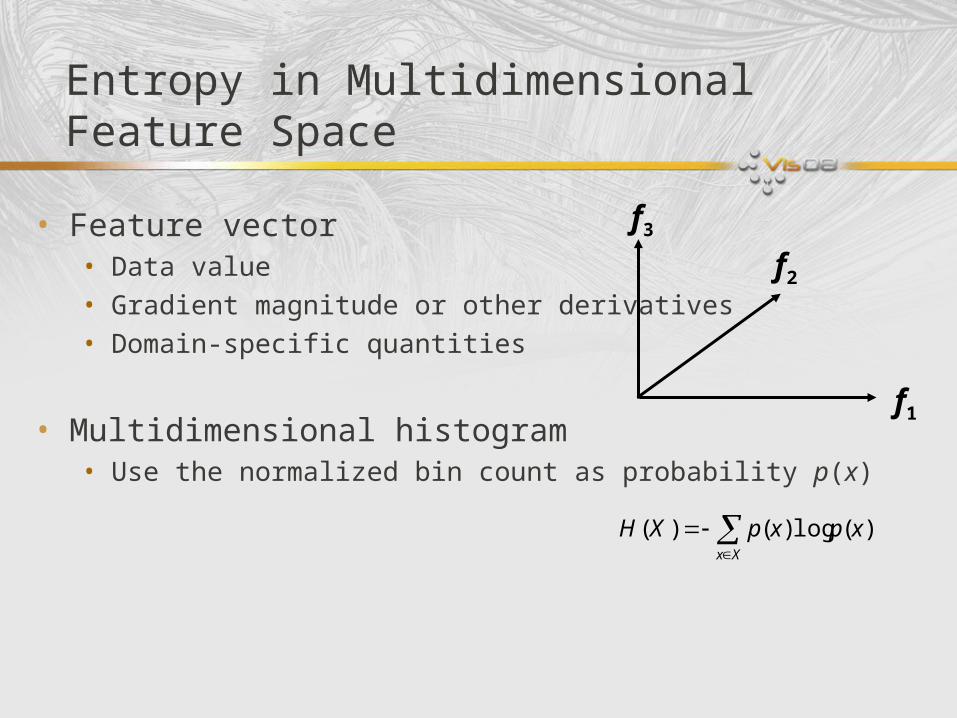
Entropy in Multidimensional Feature Space
• Feature vector• Data value• Gradient magnitude or other derivatives• Domain-specific quantities
• Multidimensional histogram• Use the normalized bin count as probability p(x)
Xx
xpxpXH )(log)()(
f1
f3
f2
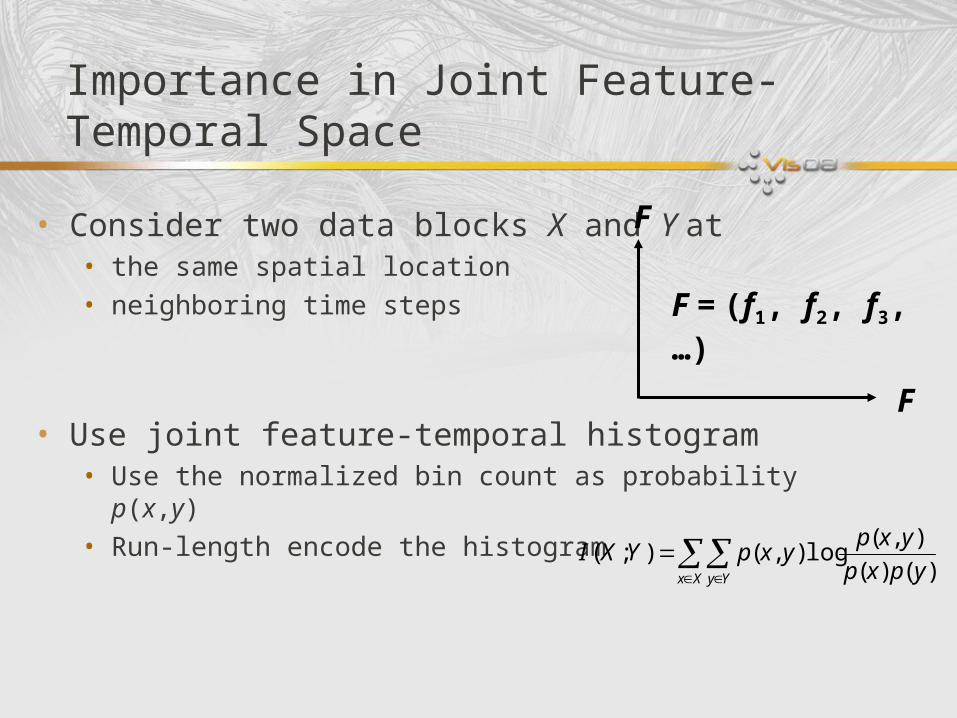
Importance in Joint Feature-Temporal Space
• Consider two data blocks X and Y at• the same spatial location• neighboring time steps
• Use joint feature-temporal histogram• Use the normalized bin count as probability p(x,y) • Run-length encode the histogram
Xx Yy ypxp
yxpyxpYXI
)()(
),(log),();(
F
F
F = (f1, f2, f3, …)
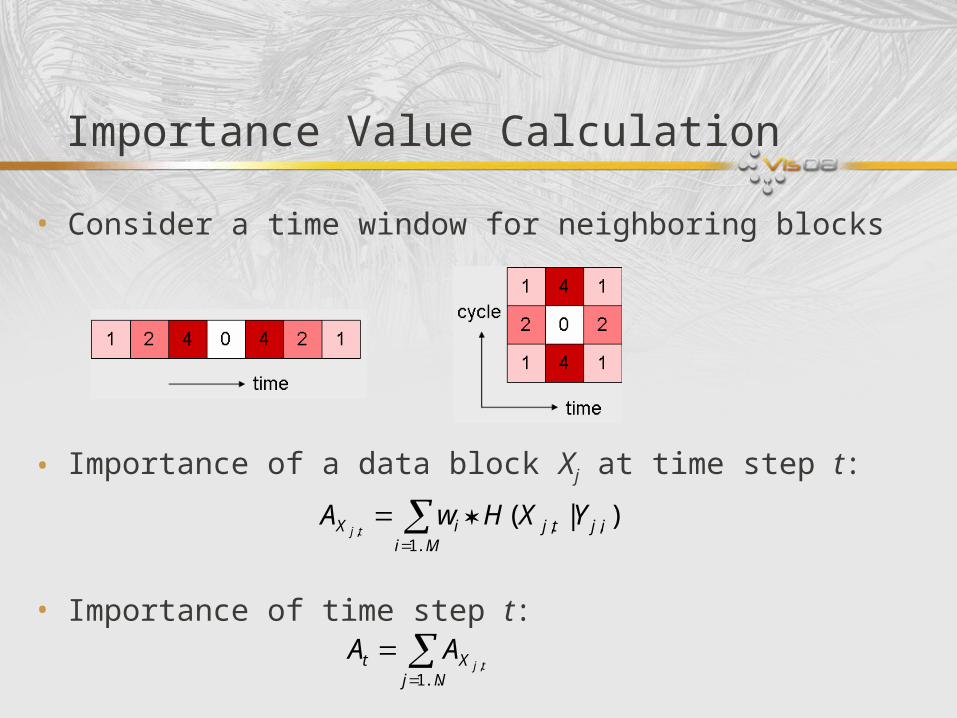
Importance Value Calculation
• Consider a time window for neighboring blocks
• Importance of a data block Xj at time step t:
• Importance of time step t:
Mi
ijtjiX YXHwAtj
..1,, )|(
,
Nj
Xt tjAA
..1,
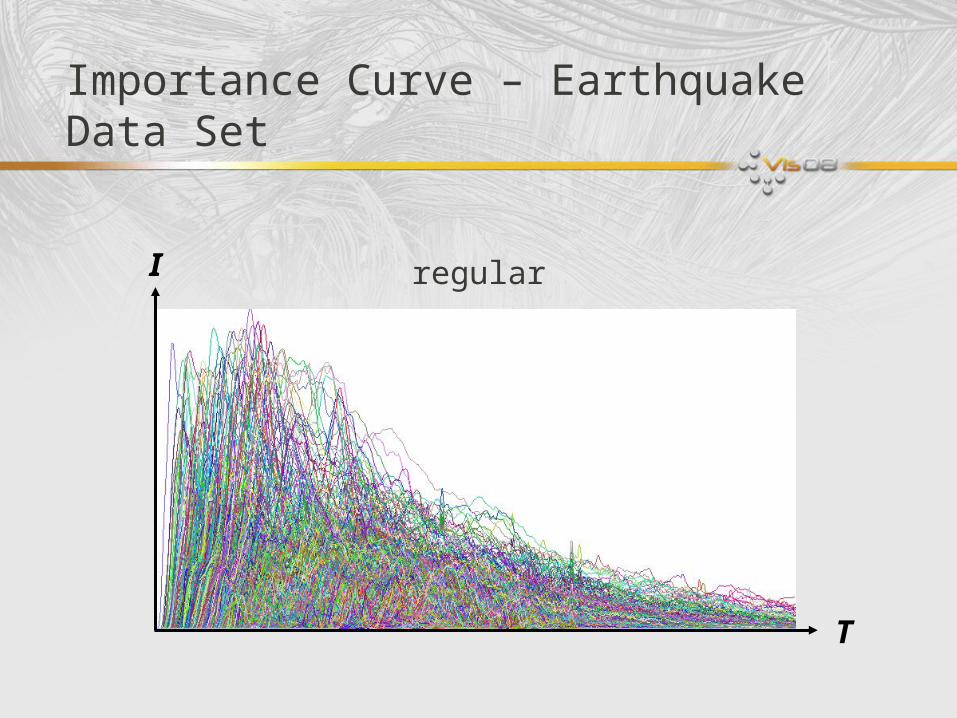
Importance Curve – Earthquake Data Set
T
I regular
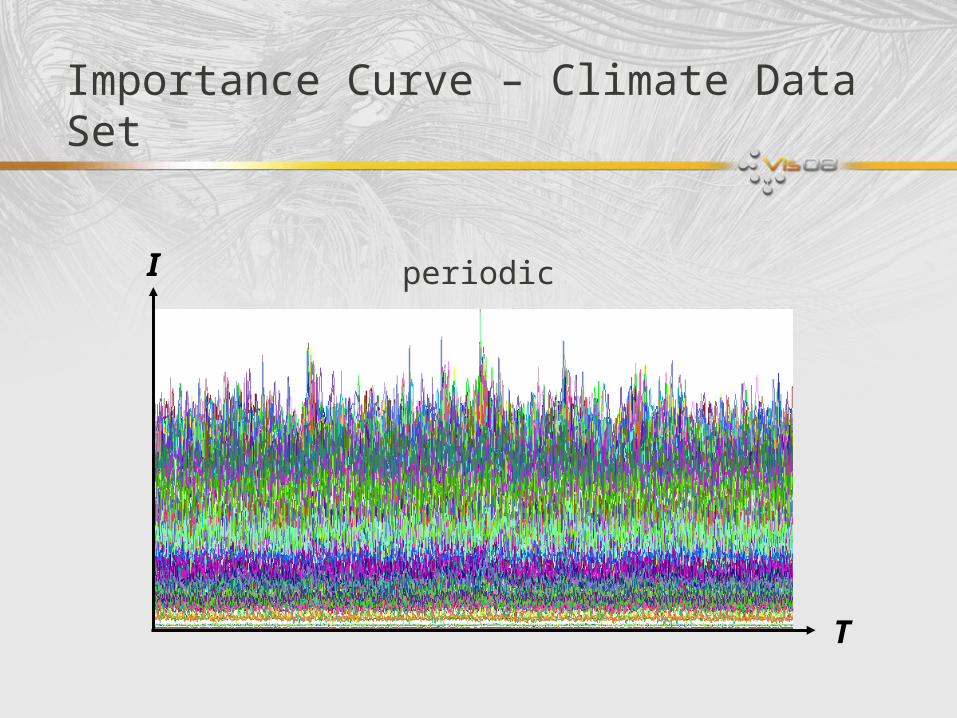
Importance Curve – Climate Data Set
T
I periodic
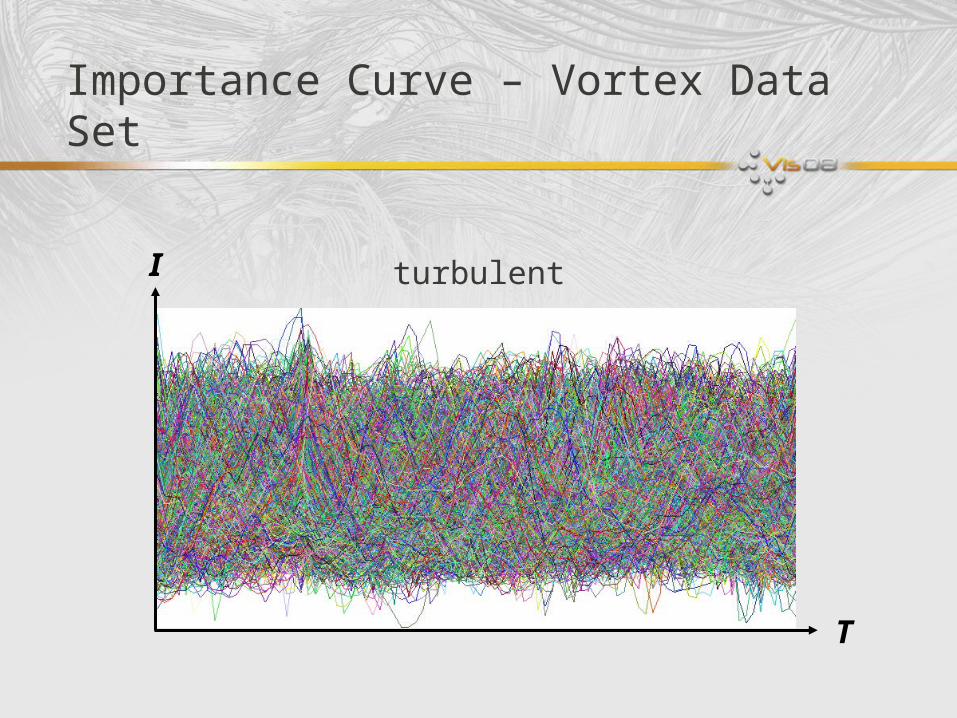
Importance Curve – Vortex Data Set
T
I turbulent
Clustering Importance Curves
• Hybrid k-means clustering [Kanungo et al. 02]
• Lloyd’s algorithm• Local search by swapping centroids• Avoid getting trapped in local minima
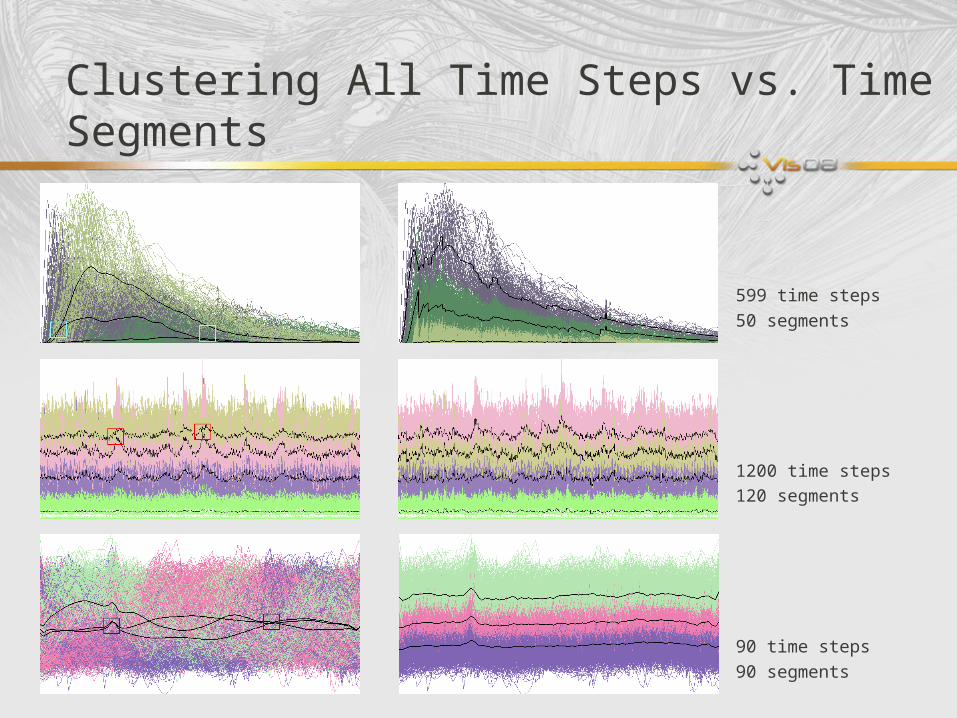
Clustering All Time Steps vs. Time Segments
599 time steps
50 segments
1200 time steps
120 segments
90 time steps
90 segments
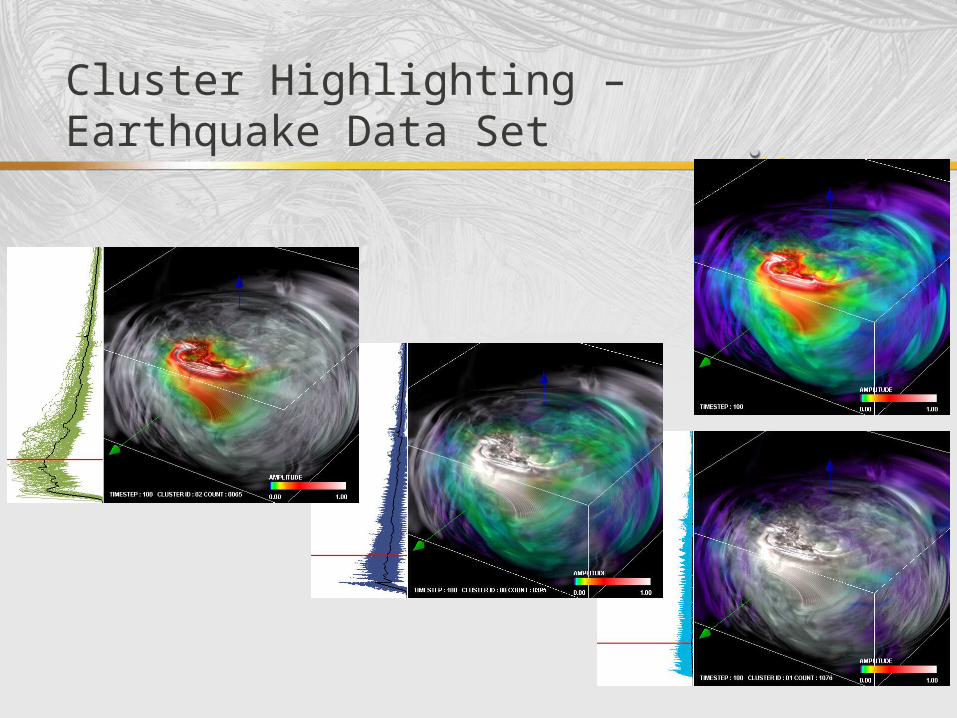
Cluster Highlighting – Earthquake Data Set
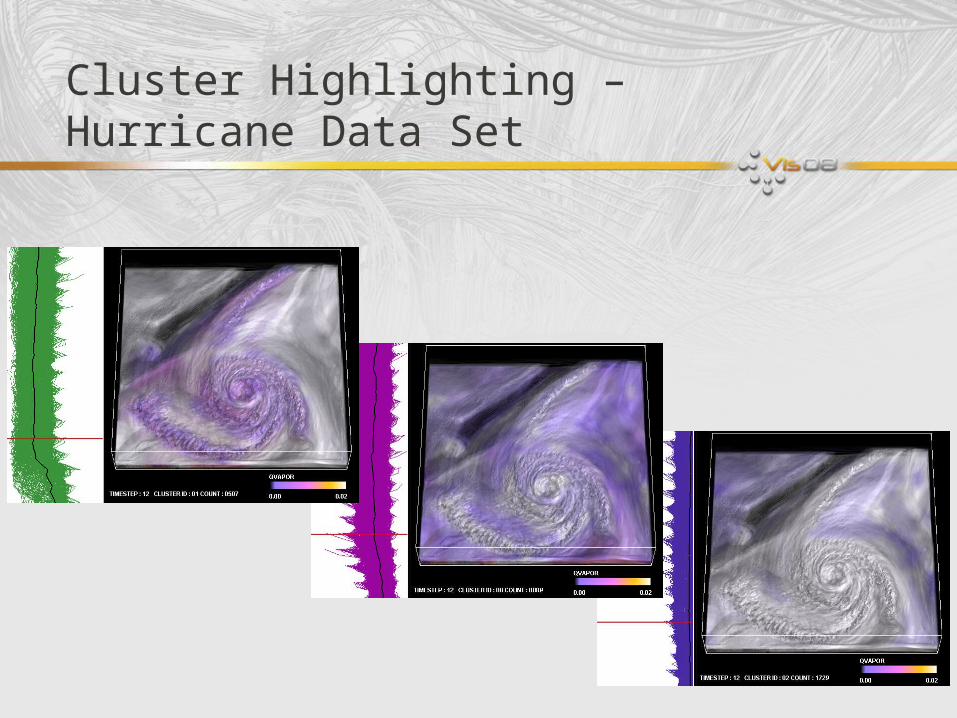
Cluster Highlighting – Hurricane Data Set
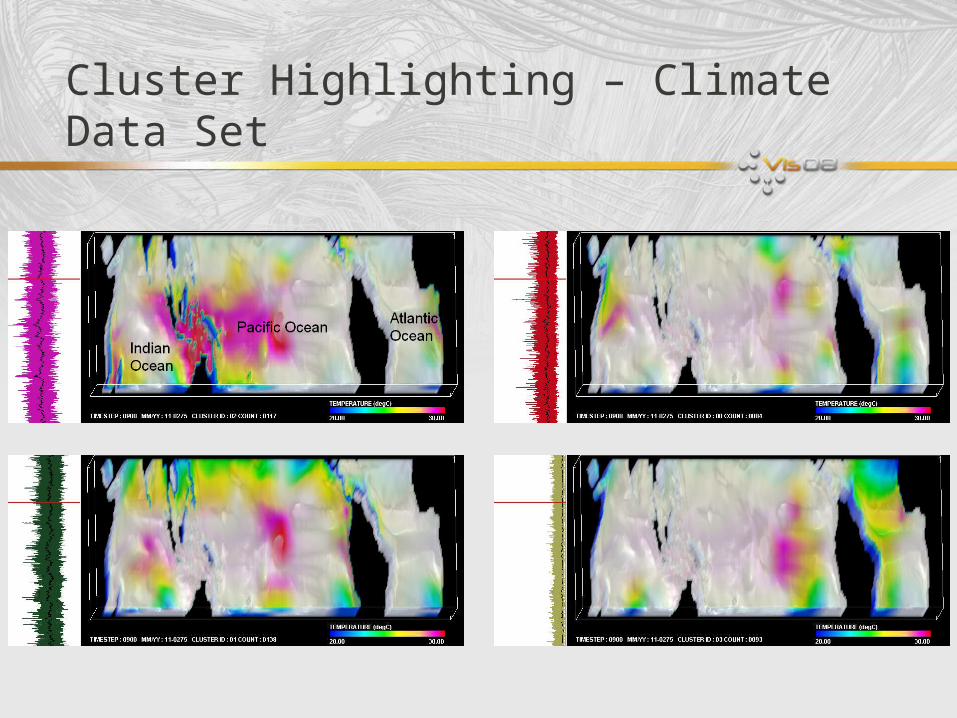
Cluster Highlighting – Climate Data Set
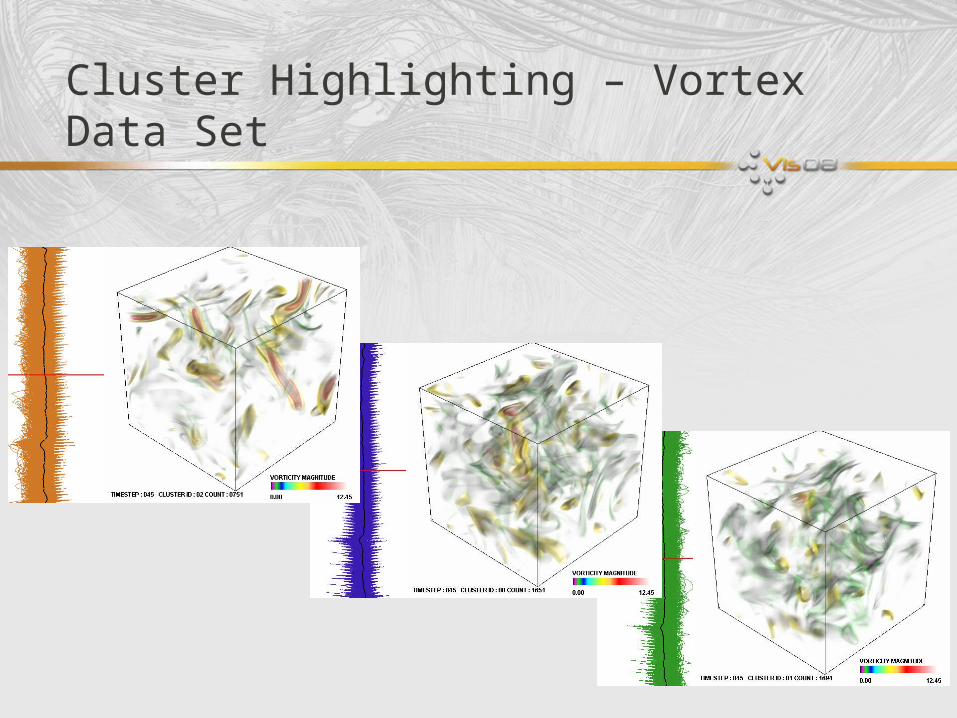
Cluster Highlighting – Vortex Data Set
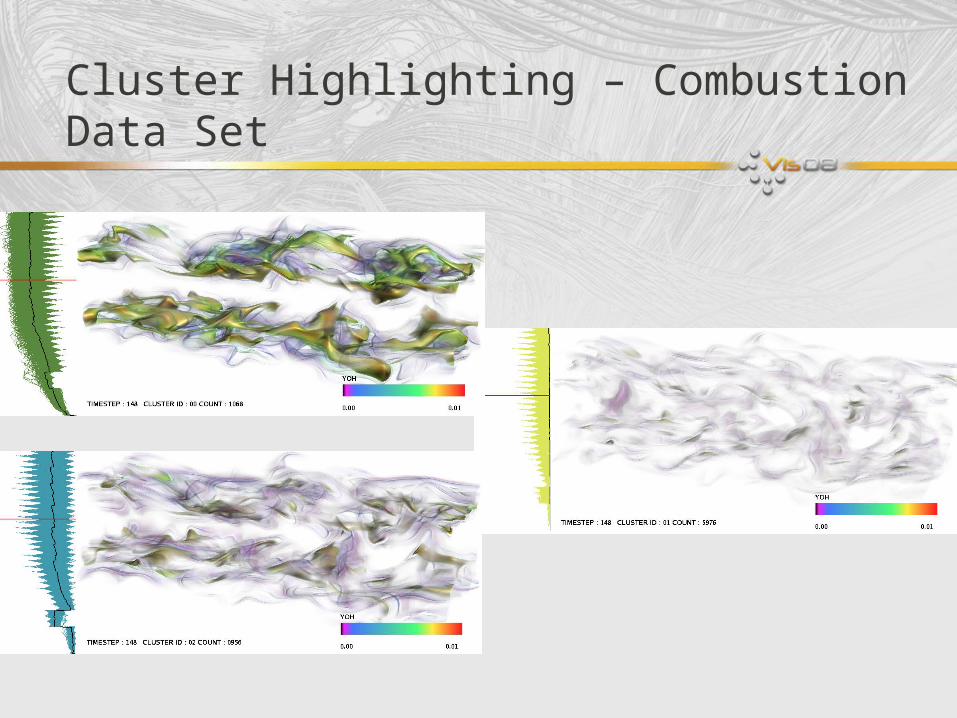
Cluster Highlighting – Combustion Data Set
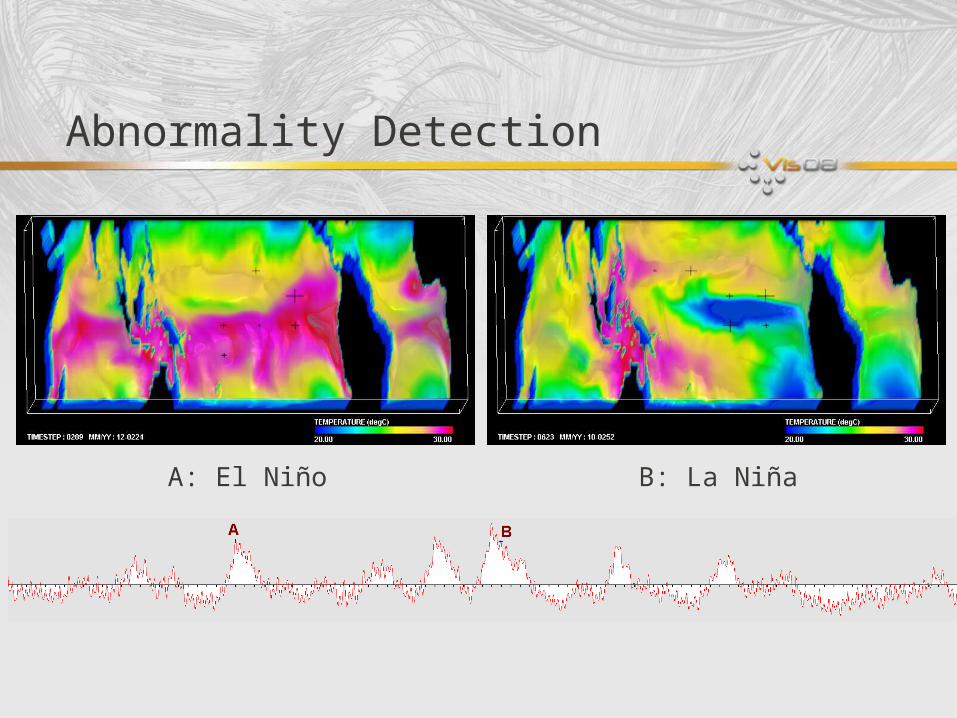
Abnormality Detection
A: El Niño B: La Niña
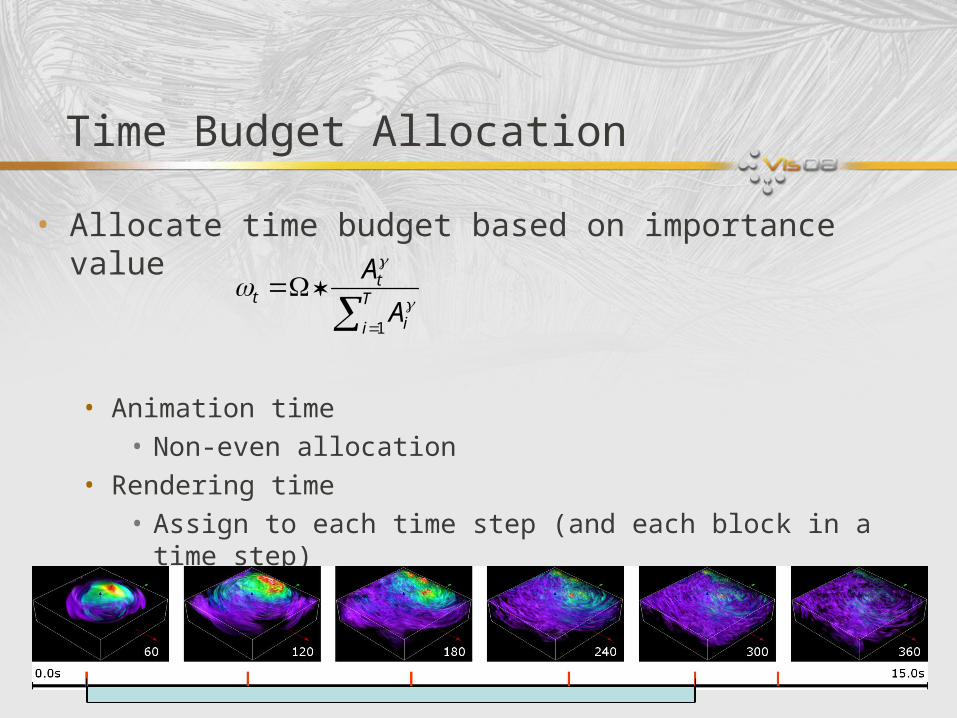
Time Budget Allocation
• Allocate time budget based on importance value
• Animation time• Non-even allocation
• Rendering time• Assign to each time step (and each block in a time step)• Adjust the sampling spacing accordingly
T
i i
tt
A
A
1
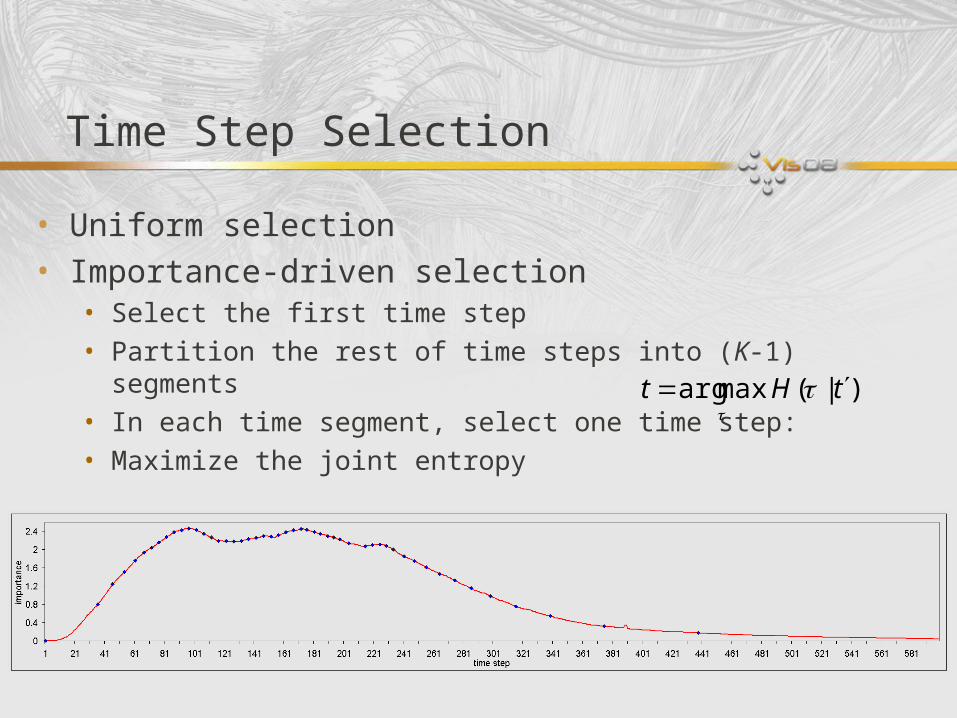
Time Step Selection
• Uniform selection• Importance-driven selection
• Select the first time step• Partition the rest of time steps into (K-1) segments• In each time segment, select one time step:• Maximize the joint entropy
)|(maxarg tHt
Precomputation and Clustering Performance
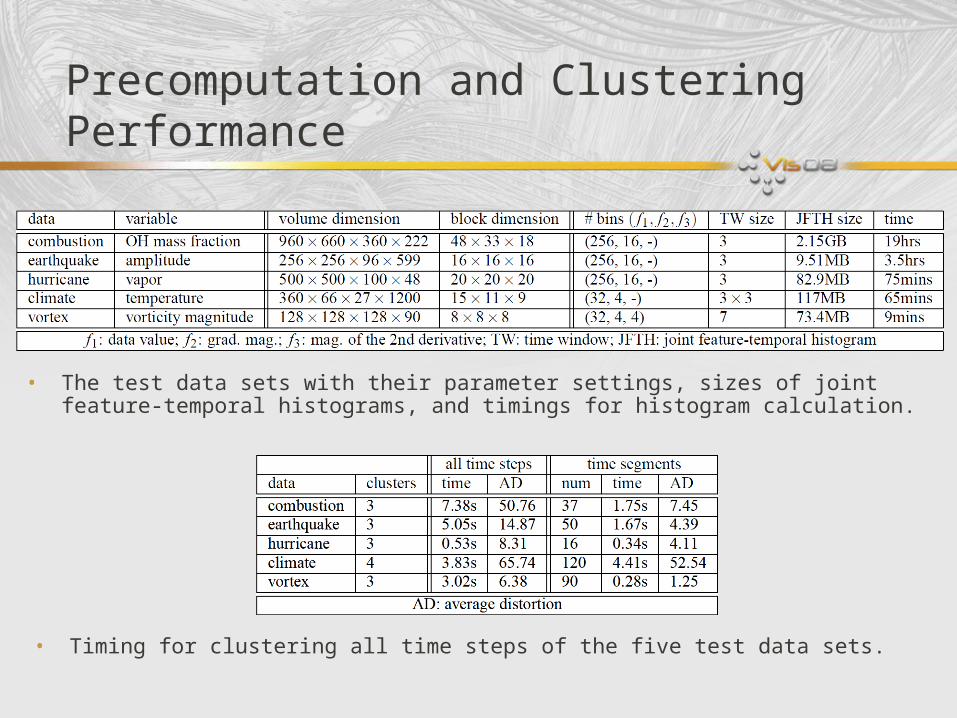
• The test data sets with their parameter settings, sizes of joint feature-temporal histograms, and timings for histogram calculation.
• Timing for clustering all time steps of the five test data sets.
Choices of Window and Bin Sizes
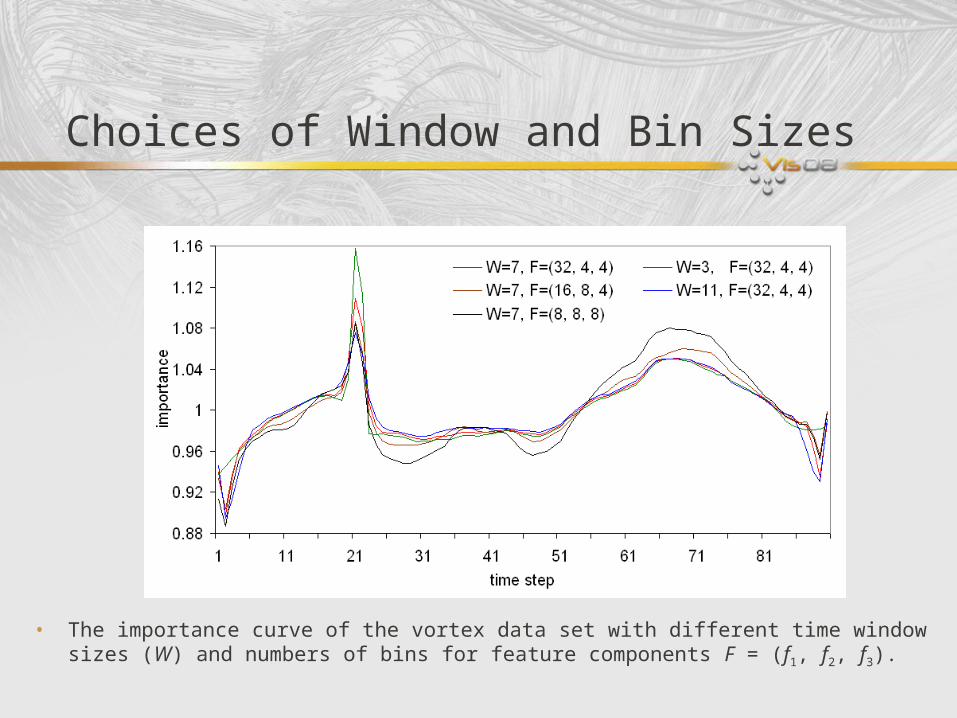
• The importance curve of the vortex data set with different time window sizes (W) and numbers of bins for feature components F = (f1, f2, f3).
Choices of # of Clusters and Block Size
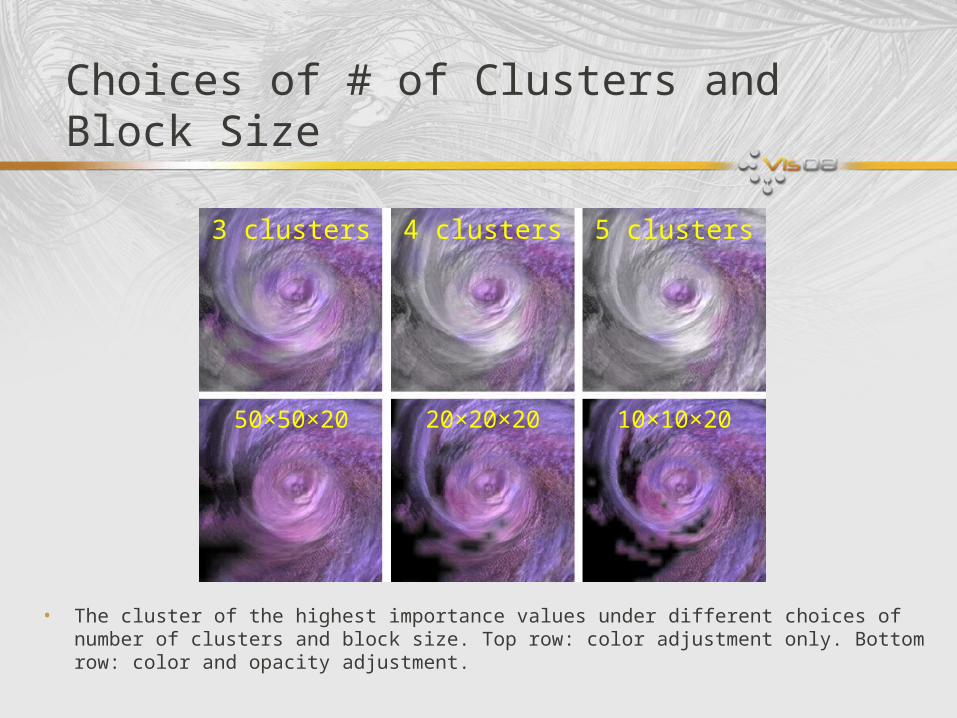
• The cluster of the highest importance values under different choices of number of clusters and block size. Top row: color adjustment only. Bottom row: color and opacity adjustment.
3 clusters 4 clusters 5 clusters
50×50×20 20×20×20 10×10×20
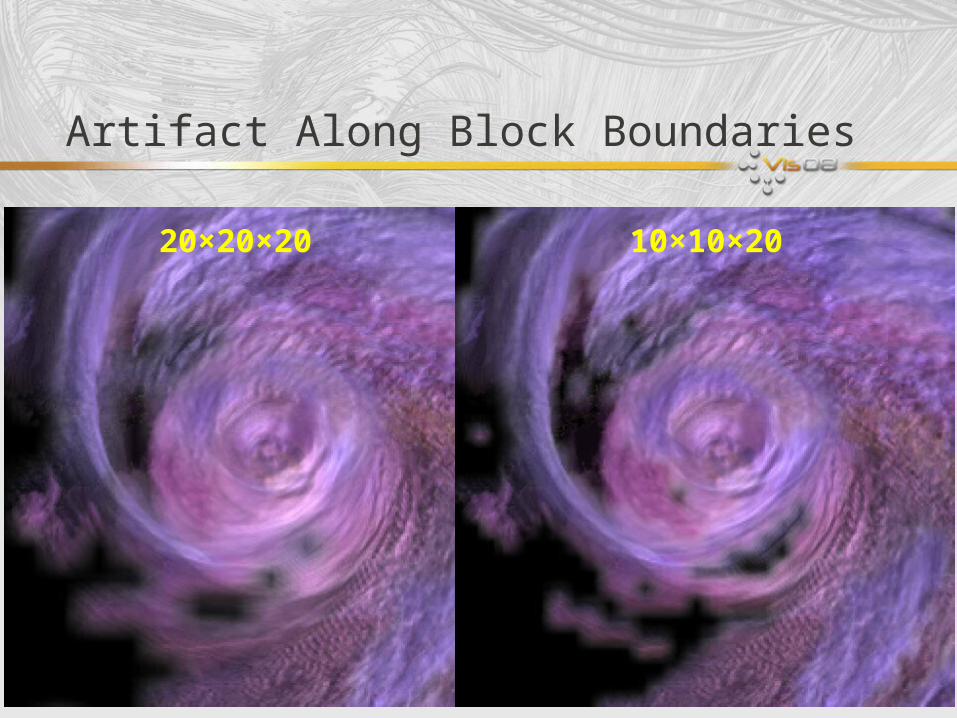
Artifact Along Block Boundaries
20×20×20 10×10×20
Summary
• Importance-driven data analysis and visualization• Quantify data importance using conditional entropy• Cluster the importance curves• Leverage the importance in visualization
• Limitations• Block-based classification• Size of joint feature-temporal histogram
• Extensions• Non-uniform data partition• Incorporate domain knowledge• Dimension reduction
Acknowledgements
• NSF• CCF-0634913, CNS- 0551727, OCI-0325934, OCI-0749227, and
OCI-0749217
• DOE SciDAC Program• DE-FC02-06ER25777, DE-FG02-08ER54956, and DE-FG02-
05ER54817
• Data sets• Combustion: Jacqueline H. Chen, SNL• Climate: Andrew T. Wittenberg, NOAA• Earthquake: CMU quake group• Hurricane: NSF, IEEE Visualization 2004 Contest
Recommended


![[a1] Kwan Joseph](https://img.dokumen.tips/doc/110x75/577ce4791a28abf1038e6ef5/a1-kwan-joseph.jpg)