
Impact Study of
Paramparagath Krishi Vikas Yoyana
Submitted to
Department of Agriculture Cooperation and Farmer’s Welfare
Ministry of Agriculture and Farmer’s Welfare
National Institute of Agricultural Extension Management
(MANAGE)
Hyderabad
0
2
4
6
8
10
12
14
16
Organic Agriculture Area (lakh ha)

Citation: Reddy A Amarender (2017) Impact Study of Paramparagat Krishi Vikas
Yojana, National Institute of Agricultural Extension Management
(MANAGE), Hyderabad-500030, Pp.210.

i

ii

iii
Acknowledgement
The study on “Impact of Paramparagath Krishi Vikas Yojana” has been carried out at the National
Institute of Agricultural Extension Management (MANAGE), Rajendranagar, Hyderabad, as suggested
and sponsored by the Ministry of Agriculture and Farmers Welfare, Government of India.
We have benefited immensely from various scholars and officials from different government departments
while carrying out this study. At the outset, we would like to thank Smt. V Usha Rani, IAS, Director
General of our institute as well as Smt. Rani Kumudhini, IAS then Joint Secretary, INM, Ministry of
Agriculture and Farmers Welfare, Government of India for their constant encouragement and support
for undertaking this impact study. We are grateful to Smt. Neerja, IAS, Joint Secretary, INM, Ministry of
Agriculture and Farmers Welfare, Government of India and Dr. Chaudhary, Additional Commissioner,
INM, Department of Agriculture and Cooperation and Farmers Welfare for continuous support and
guidance.
We are grateful to directors and joint directors and other officials from different state department of
agriculture for their cooperation during the field survey and later interactions in focus group interactions
for sharing their valuable suggestions. We thank Dr. Ratna Reddy, Dr. Padma Raju, ex Vice Chancellor,
PJTSAU, Rajendranagar, Dr. CP Chandrashekar, former dean, PJTSAU for their guidance and active
involvement.
We thank our colleagues in MANAGE for their support and encouragement while carrying out the study.
Especially we thank Dr.V P Sharma, Dr.Renuka Rani and Waheeda for their continuous support. We are
thankful to Dr. Ashwini S Darekar, M. Preethi, Ch. Lavanya and Ch. Bala Swamy for their continuous
hard work in finishing the report. We are thankful to Miss. Vaisnavi, Mr.Aditya, Mr.Vijay and Miss.
Trupti from Ghokale Institute of Politics and Economics, Pune who worked on the project as interns.
We also thankful to the field supervisors and surveyors for carrying out the field surveys and focus group
interactions in different sample states and districts across India. The study would not have reached to this
stage without the active co-operation of the cluster group leads, who provided all the required data for
the study without any hesitation and expectation. We thank each one of them for their invaluable
support.
Dr. A. Amarender Reddy

iv
Content
Particulars Page no.
Chapter- I : Introduction 1
1.1 Principles of organic agriculture 3
1.2 Components of Organic Farming 4
1.3 About the PKVY Programme 7
Chapter – II: Study Methodology 8
2.1 Objectives and Scope of the Evaluation Study 8
2.2 Evaluation Study and Results Framework 8
2.3 Evaluation Study Approach: 9
Chapter – III: Review of different components of PKVY 12
3.1 Objectives of PKVY scheme 12
3.2 Components and pattern of assistance 12
3.3 Implementation arrangements: 14
3.4 Expected outcomes 15
3.5 Review of progress of PKVY scheme 15
3.6 Status of Organic Farming 17
3.7 Potential for growth of organic farming: 25
Chapter – IV: Design of PKVY 27
4.1 Design of the Schemes 27
4.2 Benchmarking and Comparison for design of Schemes: 27
4.3 Organic Village concept 38
4.4 PGS certification in India and abroad 39
4.5 State wise comparison in design and Modalities 39
4.6 Governance issues of Organic Farming across different countries 48
Chapter – V: Implementation and Modalities of Delivery 54
5.1 Programme implementation 54
5.2 Important Features of PKVY scheme 55
5.3 Budget Allocation of PKVY 58

v
5.4 Budget allocation for across components within PKVY scheme 60
Chapter-VI: Impact of PKVY Scheme 64
6.1 Farmers perceptions 64
6.2 Barriers to the Growth of Organic Farming 82
Chapter –VII: Summary & Conclusion 87
Annexures 1: PKVY guidelines 97
Annexures 2: Cluster Questionnaire (PKVY) 99
Annexures 3: Budget Allocation of PKVY 102
Annexures 4: Suggestions 103
References 109

vi
List of tables
S. No Particulars Pg. No
Executive Summary IX
Table 1 Principles of Organic Agriculture 4
Table 2 Sampling Framework 10
Table 3 Global Status of Organic Farming 17
Table 4 Organic Farming details in India 22
Table 5 State wise status of organic agriculture in India(2016-2017) 24
Table 6 Scheme Comparison of PKVY with International and National
programs
28
Table 7 Design of the Projects relevant to Organic Agriculture 34
Table 8 Comparison of design and modalities of delivery of organic
agriculture in different states
41
Table 9 Review of similar Case Studies in organic agriculture (India and
abroad):
45
Table 10 Issues related to food markets 48
Table 11 Benefits of Organic Agriculture and Food 49
Table 12 Coverage of Organic Agriculture Regulations 49
Table 13 No. of Control Bodies for Organic Agricultural Regulations 50
Table 14 Policy measure supporting organic farmers 51
Table 15 Policy measures supporting Organic Food Marketing Channels 52
Table 16 Other measures supporting the growth of the organic sector 52
Table 17 Important features of the PKVY scheme 55
Table 18 Details of the State-wise fund allocated, Release and Expenditure
under PKVY during 2015-16 to2017-18
58
Table 19 Budget allocations for different Components of PKVY clusters 60
Table 20 State-wise Funds Released for Promotion of Organic Farming under
Rashtriya Krishi Rashtriya Krishi Vikas Yojana (RKVY) in crores
61
Table 21 National Mission for Sustainable Agriculture 62

vii
Table 22 Mission for Integrated Development of Horticulture 63
Table 23 Details of Sampling 64
Table 24 Basic characteristics of clusters 65
Table 25 Basic characteristics of clusters by different categories 66
Table 26 Procedure under PKVY 67
Table 27 Pattern of production of inputs by cluster categories (in %) 68
Table: 28 Pattern of use of inputs by different cluster categories (in %) 69
Table 29: Using of Technologies at Cluster Level (in %) 70
Table 30 % of clusters benefited from using Cluster Level Technologies
(response from lead resource person)
71
Table 31: Mobilization of farmers 72
Table 32: Meeting conducted 73
Table 33: Exposure visits 74
Table 34: Trainings conducted 75
Table 35: Peer inspections conducted and usefulness 76
Table 36: Impact of PKVY for crops – Wheat 77
Table 37: Impact of PKVY for crops – Paddy 78
Table 38: Impact of PKVY for crops - Soybean 79
Table 39: Areas Needing Government Support 80
Table 40: Perceptions of the farmers 81

viii
List of Figures
S. No Particulars Pg. No
Fig. 1 Concept of Organic Farming 1
Fig. 2 Trends in global organic market (2000-2015) in Rs. Crore 2
Fig. 3 The world Organic Agriculture, 2015 3
Fig. 4 Components of Organic Farming 5
Fig. 5 Top ten countries with the largest areas of organic agricultural land, 2015 6
Fig. 6 Evaluation Study and Results Framework 9
Fig. 7 Theory of change (results framework) 11
Fig. 8 The World of Organic Farmland 2015 18
Fig. 9 The World of Organic Producers 2015 19
Fig. 10 The World of Organic Retail Sale 2015 20
Fig. 11 The World of Organic Agriculture 2015 21
Fig. 12 Organic agricultural area and Production 23
Fig. 13 State Wise Grower Groups and Area 25
Fig. 14 Various government schemes to promote organic agriculture 33
Fig. 15 Framework of organic village 38
Fig: 16 Programme implementation (Pictorial Representation) 54
Fig. 17 Budget allocation, release and expenditure (Rs. lakh) (PKVY) 57
Fig. 18 Budget Estimates and Revised Estimates 57
Fig. 19 Motivation for adoption of organic agriculture 80
Fig. 20 Constraints in adoption of organic agriculture 82

ix
Executive Summary
Indian agricultural sector is in distress with reducing profitability due to rising cost of
inputs and stagnant output prices. These twin problems of agricultural can be effectively
tackled by the wider adoption of organic agriculture (Seufert et al., 2012). Given this,
Indian government is encouraging organic agriculture under centrally sponsored scheme
of Paramparagath Krishi Vikas Yojana (PKKVY). There are about two million farmers
across the globe who practice certified organic farming methods and roughly 80 per cent
of these farms are in India (IFOAM, 2013). It wouldn’t be wrong to assume that our
country is at the centre of an organic revolution that is set to take the world by storm.
Organic farming has become increasingly important in India given the rising costs and
increased losses due to climate change and aberrations in rainfall and extreme climatic
events like floods and droughts. Consumers are also able to and willing to purchase
organic agricultural products at higher premium prices as they are free from chemical
fertilizers and pesticides. There is also uncertainty of benefits and costs of using GMOs
(genetically modified) crops on a wider scale. This resulted in a larger scope for increased
demand for organic agriculture. Apart from this, there has been a significant rise in the
demand for organic food across the world due to increased consciousness related to
health problems arising with the chemical pesticides and fertilizers contaminated food.
Keeping these in focus, there is higher thrust on PKVY to promote organic agriculture. It
is basically a scheme of supporting organic farming via cluster approach with
Participatory Guarantee System (PGS).
Terms of Reference of the study:
This nationwide impact study of PKVY entrusted to MANAGE by the Ministry of
Agriculture and Farmers Welfare with the following objectives.
To examine the design of PKVY and MOVCDNER scheme in terms of planning,
stakeholder capacity, implementation challenges, input procurement and
distribution activities (clusters formed, trainings, labs established, inspection of
clusters and certification, input supplied) and output (area under organic
expanded, organic production and market linkages)
To assess the modalities of delivery of the scheme in terms of clusters selection,
farmers training, cluster formation, inspection of field, certification, input supply,
value chain development, producer companies, market infrastructure and market
support linkage like organic commodity boards.
x
To assess the level of utilization of outcomes of PKVY and MOVCDNER by the
farmers across farm size classes, irrigated and rain fed situations especially in NE
and hilly states.
To assess the impact of PKVY and MOVCDNER scheme on area expansion under
organic agriculture, reduction in input cost and cost of cultivation, use of bio
fertilisers, farm productivity, value chain development, price premium due to
labelling, profitability and sustainability.
To recommend for improvement of overall design of the programme for improving
the effectiveness of the scheme.
Methodology
This study used structured questionnaires to collect data from different stakeholders
mainly farmers who practiced organic agriculture and cluster representatives. The study
also included a control group of farmers who are practising conventional agriculture to
compare the costs and benefits of organic agriculture with the conventional agriculture.
The study team also conducted focus group interactions with agricultural officers, KVKs,
Regional Councils and other resource NGOs and implementing agencies who are directly
involved in implementation of PKVY. The secondary data on fund flow and deliverables
were collected from all states.
A cluster level questionnaire was designed for the cluster groups to know the progress
of implementation of the PKVY Scheme. We have send the questionnaire to 40% of the
total 6211 clusters, but the study got responses from only 690 PKVY clusters. Due care
was taken to cover all agro-climatic zones and also regions of the country. The
questionnaire was shared with Lead Resource Person (LRP) of each cluster group and
also members to fill up. Few field investigators were directed to collect the information
in person with the implementing agencies and cluster groups and leads. The collected
data was analysed using simple tabular analysis by using with and without and also
before and after method.
Analysis is based on the limited samples of 690 clusters, it is more likely that the best
functioning clusters were filled up the questionnaires, whereas non-functional clusters
were not filled up. This limitation of the study needs to be kept in mind while concluding
and interpreting the results. As the PKVY scheme is implemented since last 2 years, while
PGS certified production requires minimum of three years, the results are the study are
only indicative in nature and the ultimate final impacts will be visible only after three
years. The Present Analysis provides the insights about how the scheme is being

xi
implemented, what are the bottlenecks in implementing the scheme and outputs and
outcomes are in line with the objectives of the scheme. The PKVY scheme is found to
well-planned and very useful for promoting sustainable agriculture and also branding
and marketing farmer produce. There are some components of PKVY need to be also
redefined for the benefit of farmers.
Results of design, delivery and level of utilization of PKVY
This study shows the PKVY scheme is picking up in in states like Sikkim (complete
organic state), Tamil Nadu, Chhattisgarh, Karnataka, Kerala and Maharashtra. But
in other states the scheme is lagging behind. Within states also progress is good in
rainfed areas, hilly and remote areas compared to irrigate and plains. Hence there
was need to focus on expansion of PKVY scheme vertically in the rainfed, hilly
and remote areas/districts where there was a lot of potential.
As on 7th November 2017, 6211 clusters were formed, of which Maharashtra (1043),
Madhya Pradesh (992), Uttar Pradesh (806), Karnataka (538), Uttarakhand (491),
Rajasthan (410), and Chhattisgarh (338) together contribute to about 75% of the
total clusters.
Training programmes conducted on organic production practices and exposure
visits are effective in states like Kerala, Tamil Nadu, Maharashtra and
Chhattisgarh where ATMAs are involved in the PKVY implementation. Training
programmes needs to be comprehensive. The training of farmers under PKVY may
be converted to training cum field demonstration (Various organic input
production and practices may be demonstrated to make more understanding of
organic input technologies).
Farmers are the best educators of other farmers and so farmer to farmer extension
will be given importance that can greatly help in information exchange and
dissemination. Most common are farmer exchange visits, in which farmers are
brought to the site of successful innovation or useful practice, where they discuss
and observe benefits and costs with adopting farmers.
Release of funds in some of the states is delayed which impacted the
implementation of the PKVY at block level. In some states 1st year there was a
release of funds, but second year there was no release of funds, but again in third
year there was a release of funds. This created some sort of uncertainty about the
PKVY programme among farmers as well as local agricultural officers. This needs
to be corrected and funds should be released in advance before the sowing season,

xii
so that the local agricultural officers and cluster LRPs can implement the scheme
with proper planning.
About 19.6 % of the clusters are producing compost followed by green manure
(15.4%) and organic seed (13.1%) which is a good sign in success of this scheme.
About 7.7% of clusters produced traditional inputs like Panchamruth, 13.8%
produced Panchagavya and 14.3% produced Beejamruth.
Majority of farmers involved were large and medium farmers and they
simultaneously practice conventional and organic agriculture in different plots, as
they were having more number of plots. Mostly commercial crops (like chillies
and cotton) were grown in conventional way, whereas pulses and oilseeds are
grown in organic way. There was a need to encourage small and marginal farmers
to take up organic agriculture.
About 96 % of the clusters prepared annual action plan and started organic
production (95 %). About 83% clusters were PGS certified and 78 % clusters were
having packaging and labelling facilities. About 80 % of clusters have marketing
facilities. And about 28 % of the clusters were having certification process and 76%
farmers expressed willingness to move towards organic methods.
Use of green leaf manure, compost and organic seeds was increased in the clusters,
especially in less developed states compared to developed states.
About 93 % of the sample clusters using biological nitrogen harvesting planting,
but only 87% are getting benefit out of it. About 65 %of clusters are using botanical
extract production units out of which 60 % are were benefitted. Average
percentage of clusters producing Bio-Fertilizers is 11% out of this 82% of clusters
are using it. About 12% of the clusters are producing Bio-pesticides, 24% clusters
are using it in farming.
Clusters are producing neem oil or neem cake as natural pest control mechanism.
About 5.4% of the clusters are producing, and about 11.2% of the clusters are using
it by collecting or purchased from markets.
More than 95 per cent of the clusters were using Organic input production unit
and more than 92 per cent were using Biological nitrogen harvest planting
(Gliricidia, Sesbania).About 65 per cent were using Botanical extract production
unit and 18.1 per cent Phosphate rich organic manure. Only about 5.7% of the

xiii
clusters are using this custom hiring centre services and only 4.1% are getting
benefit out of it.
Average percentage of cluster using walk in tunnels for horticulture crops is only
1.3% and all of them are using, but only 0.1% are benefited.
Only 0.3% clusters are availing subsidy under Gokul Scheme, but no one is
benefited. Under cattle shed scheme, about 6.8% clusters are taken financial
support, but only 4.8% clusters were benefited.
Farmer’s perception
Reasons for adoption of organic agriculture: majority (46%) of the farmers
mentioned that they adopted organic agriculture to reduce costs and to get health
benefits (43%) and about 32% mentioned that because of promotion by agricultural
officers.
Problems in converting to organic farming: majority mentioned that due to lack of
certification (no premium price) (57%) they are not converting to organic farming.
Area needing government support: Majority of farmers mentioned that
government should support in “Supply of organic inputs at subsidised rates (85%),
followed by market identification/creation (74%) and certification (71%).
Reasons for expanding organic area: Major reasons are less cost (56%), improving
soil fertility (56%).
Reasons for not expanding organic area: No subsidy (56%), no premium price
(47%) and limited area (47%).
Impact of PKVY
The results show that the average cost per ha in wheat was lower in organic agriculture
11.3%, while gross returns decreased by 5.6%. The combined net effect of higher
reduction in costs with slightly reduced gross returns was an increase in net return by
15.8%. The yields of organic agriculture was less than conventional by 5.6%. The use of
green manure increased by 50%. The cost of cultivation per ha for paddy for the year
2016-17. It shows that the average cost per ha in paddy was lower in organic agriculture
by 15.1%, while gross returns decreased by 7.3%. The combined net effect of higher
reduction in costs with slightly reduced gross returns was an increase in net return by
36.7%. The yields of organic agriculture was less than conventional by 7.3%. The use of
green manure increased by 25%. The cost of cultivation per ha for soybean for the year

xiv
2016-17. It shows that the average cost per ha in paddy was lower in organic agriculture
by 17.2%, while gross returns decreased by 9%. The combined net effect of higher
reduction in costs with slightly reduced gross returns was an increase in net return by
50.6%. The yields of organic agriculture was less than conventional by 9.1%. The use of
green manure increased by 9.5%.
Overall impact
1. Cost reduction (cost saving): There is an immediate reduction in the cost of
cultivation (cost saving) up to 10 to 20% as the beneficiaries are not using
purchased fertilizers and pesticides.
2. Due to reduction in costs, there was increase in net returns ranging from 20 to 50%.
3. Savings in purchased inputs (cash expenses): The benefits are significant in crops
like paddy and cotton, for which farmers spend huge amount of money on
purchase of fertilizers and pesticides before PKVY.
4. Price premium was observed in some clusters, which are nearer to large cities and
have good linkages with large markets (the price premium was ranged from 10%
to 30% based on the type of market linkage, commodity and market linkage. In
general price premium is not widely observed.
5. Yield improvement observed only in a few farmers who do all PKVY practices
since last few years, but in general there was no significant yield increase in first
year.
6. There was huge scope of area increase of organic area in tribal, rainfed, hilly and
remote areas.
Constraints of PKVY Programme:
1. Insufficient and delay in fund release from state governments and spread across
much larger areas. There was a need for identification of potential crops and
locations for vertical promotion with all-out efforts.
2. Preparation of organic-inputs is labour intensive due to this many farmers are
reluctant to convert to organic farming, there is a need to train farmers on
producing some of the organic inputs at their level itself, this will ensure the
quality. The scheme is only encouraging input companies manufacturing
biopesticides/the agencies rather than the farmers. ------- manufacturing at their
level needs to be incentivized.
3. Price premium is not realized by most of the farmers, due to lack of awareness
about PGS certification among consumers, retailers and wholesalers. Credibility
and awareness needs to be increased among different stakeholders by introducing

xv
mobile-PGS certified produce shops, separate sale counters of PGS certified
produce in APMC markets.
4. Facilitating role of regional centres are not up to the mark. There is a need for
increasing efficiency and effectiveness of regional centres in facilitating
handholding PKVY clusters. There is a need for encouraging multiple agencies
(technical NGOs, private agencies who are involved in organic agriculture, state
department of agriculture, Farmer Producer Companies, ATMA and KVKs) to
compete to bid for regional centres.
5. Establishing separate Regional Centres for market promotion of PGS certified
commodities with PPP mode. (As private companies are comparative advantage
in marketing and brand development).
6. Farmers groups needs to be strengthened and federated at higher level as FPO’s
to increase bargaining power and brand building with the help of good NGOs
(after screening). LRPs and progressive farmers needs to be trained by
NGOs/KVKs.
7. Transition period of first and second years increase in yields are not significant
and needs support/incentives from department of agriculture.
8. Lack of integration of livestock (which provides alternate incomes and resources
as bio-inputs), farm machinery and horticulture departments.
9. PKVY guidelines are not flexible enough, they need to be more flexible to adopt
depending upon the local situations (state requirements).
10. Duplication of beneficiaries in many areas – Existing organic farmers were selected
who were already part of other schemes. (Convergence and cooperation between
schemes which has common components of organic farming).
Recommendations (design, delivery and utilisation)
Timely action: Plan preparation, release of fund and implementation needs to be
streamlined. Release of fund was delayed and diverted in many states, hence the
continuity of the second year activities suffered, which needs to be streamlined.
District level action plans should be ready at least one month before sowing period.
Identification of potential zones (Organic Special economic Zones): There was a
need for identification of potential zones like rainfed areas, tribal areas, where
traditionally farmers use less fertilizers for intensive efforts for promoting organic
clusters. Creation of organic special Economic zones ( OSEZ ) where the tribal
population is more such as Chhattisgarh, Jharkhand, Srikakulam in Andhra Pradesh,

xvi
Bhadrachalam in Telangana where there is huge potential for reaping forest based
produce like honey, soapnut, tamarind, vippa flowers.
Contiguous areas: identification of complete village/block/mandal as organic cluster
will help in building brand and providing other logistic services at less cost and also
help in marketing. Selection of area should be contiguous. Whole area approach
(saturation) may be followed at least a few cluster of villages or blocks should be
completely covered to build organic brands. There is a success story of AP wherein
they encouraged SHG’s to setup village level organic shops as a part of ------ in ZBNF.
This kind of initiative is encouraging to faster spread of PKVY scheme.
Focused approach: Focused approach based on the experience in the initial years of
the PKVY programme to identify potential areas of expansion. Identify and map the
default organic growing areas and declared as organic and efforts would be made to
get them a recognition and marketing.
Incentives: Announcing incentives to the farmers (master farmers) who adopt organic
farming for the first 3 – 5 years to compensate low yields.
Training Modules: Need to develop a training module on organic crop production
practices in local languages in more farmer friendly language with diagrams, figures
and illustrations. These standard package of practices should be developed block wise
and crop wise. Educating the farmers about important indigenous breeds in their
farming systems and integrated farming system should be intensified.
Scientific backing: Research & Development should be encouraged is required to
be established to validate and produce bio-inputs at low cost. Scientific backing of the
practices followed in organic agriculture needs to be proved for wider acceptability
of organic produce both by SAU’’s and ------. The Biological control labs which are
entrusted with production of biopesticides like T.Viridae and Pseudomonas
florescence are focused only bio pesticides but not bio fertilizers like Azolla,
Azatobactor, Phosphate solubilising bacteria, potassium mobilizing bacteria. All BC
labs should be equipped with man power and modernized / revamped to cater to the
growing organic needs.
Provide village-level support systems (like organic input shops) and build capacity
of farmers on technical front to establish homemade bio-fertilizers like BGA, Azolla
and bio pesticides, Composting (Vermicomposting, NADEP, BD compost, Coir pith
composting methods) at local level.
xvii
Appointing district level PKVY officers: The in-charge-agricultural officers of PKVY
are engaged in multiple activities, which is hindering the progress of implementation.
Hence there is a need for appointing special officers at least at district level. In those
states where ATMA is working, training components under PKVY should be handed
over to ATMA for effective dissemination of technology.
A multi-agency approach involving public, private and NGOs may be encouraged.
Currently there was little involvement of institutions like KVKs, ATMAs and SAUs
to promote organic agriculture. A strong monitoring for quality and production and
transfer technology should be given more emphasis by involving all Departments
(NCOF/RCOFs/ICAR institutes/APEDA)
Regional centres for Market Promotion: Specialised separate regional centres should
be established for marketing in each zone in community-PPP mode. As most of the
existing regional centres don’t have the marketing skills to build brands and
expansion of market for organic agriculture.
Farmer producer organizations (FPOs) and linking to corporates: The Government
should encourage formation of FPOs including Co-operatives and Producer
companies - exclusively for promotion of organic farming in all the districts and states
and FPOs to be empowered to handle all activities related to organic farming viz.,
capacity building, production of organic inputs, processing, certification, marketing
etc. The group should be preferably homogeneous, compact, and manageable and
based on area approach/crop approach. All the clusters identified under PKVY
should be formed as Farmer Interest Groups (FIG’s) / Commodity Interest Groups
(CIGs) and trained in Management of groups with respect to finance, finally linked
with private sector for marketing..
Promotion of FPOs will enable to increase access to bio-inputs, seeds and other critical
inputs..
Separate stalls for organic produce in APMC markets: APMC markets are already
existing in every block/mandal level. In these APMC markets (mandis) separate
organic certified stalls may be established, which will be maintained by PGS certified
clusters to fetch premium prices.
xviii
Promoting local processing and value addition of organics through establishing
mini-processing plants at cluster level or federation level before entering to wholesale
supply chain to get maximum share of consumer rupee by cluster farmers.
Market survey and demand estimation and product development may be done in
collaboration with specialized Regional Councils (marketing) in partnership with
private firms who are already involved in marketing of organic produce.
Simplification of procedure to get PGS certification has to be ……..
Market and Brand development: To access better prices branding need to be
developed by farmers.. Convergence with marketing and cooperative department
and explore a new supply chain on Farmer to Consumer models which helps
increasing farmers share. Similarly, consumers must also be made aware about the
health benefits of organic produce and necessity for premium price.
Popularizing PGS certification to get premium prices among the wholesalers,
retailers and consumers for creating demand for produce of PKVY clusters. The
details on the labels of PGS certified product should be on par with private labelling
to increase authenticity and transparency. Processed food shall be labelled as per food
safety and standards (FSSASI) regulations. Use of E-platform and mobile Apps for
direct marketing of organic produce. In addition to PGS-certification, third party
certification may be encouraged if clusters (farmer producer companies) are willing
to take with subsidised cost. Certification procedures may be simplified with online
filling of the data twice in a year for both kharif and rabi seasons. Common packing,
branding and labelling unit can be established at state level to promote a common
brand for each state organic produce like (Himachal organic apples). Each state
headquarters should have organic market places established where farmers can
directly sell to consumers/retailers.
Start-ups and agri-entrepreneurs: There is a growing market for the organic
agriculture, some of the private companies (even farmer producer companies) are
making huge profits by marketing the organic produce. Imparting skills in
identification of market opportunities for organic agriculture and development and
capturing of these markets can be done by encouraging agripreneurs..
Mass production of bio-inputs: Encouraging and incentivising establishment of
large input-suppliers of bio-inputs like Panchamruth, Panchagavya and Beejamruth.
Leveraging ICT: Information and Communication technologies for digitization of
organic farmers, crops produced, prices, development of virtual market place or

xix
linking to eNAM would help farmers to realize better prices for their produce. PGS -
INDIA web-portal should be linked to national and international markets and
ultimately tracing back the product.
Revolving fund to farmers federations/FPOs/ farmers associations, etc. to meet their
working capital needs and to facilitate purchase of organic inputs. This will help in
avoiding distress sale. The existing unit ---- can be converted as revolving fund and
given to FPO’s who take up organic farming.
Eco Agri-Tourism: Encouraging Eco Agri-Tourism in fully organic clusters as
supplementary income to organic farmers can be explored in the suburban areas of
metro-cities.

1
Chapter – I
Introduction
Indian agricultural sector is in distress with reducing profitability due to rising cost of
inputs and stagnant output prices. These twin problems of agricultural can be effectively
tackled by the wider adoption of organic agriculture (Seufert et al., 2012). Given this,
Indian government is encouraging organic agriculture under centrally sponsored
scheme of Paramparagath Krishi Vikas Yojana (PKKVY). There are about two million
farmers across the globe who practice certified organic farming methods and roughly 80
per cent of these farms are in India (IFOAM, 2013). Organic farming is gaining
momentum recognizing the problems associated with chemical agriculture, increasing
costs of cultivation and its impact on environment and health. It is now accepted
globally that Organic farming methods can bring in ecological and economic
sustainability in farming. Organic farming is a production system which avoids, or
largely excludes, the use of synthetic fertilizers, pesticides, growth regulators, and
livestock feed additives. In the past decade there was growing demand for organic
agricultural products from Rs. One lakh crore to six lakh crore.
Fig. 1: Concept of Organic Farming
Globally and nationally, various agencies have sought to define Organic farming. The
united Nation’s Food and Agriculture Organization (FAO) states that “Organic
Agriculture is a unique production management system that promotes and enhances
agro ecosystem, health, biodiversity, biological cycles and biological activity and this is
accomplished by single or combination of on-farm agronomic, biological and
mechanical methods in inclusion of all synthetic off farm inputs.
2
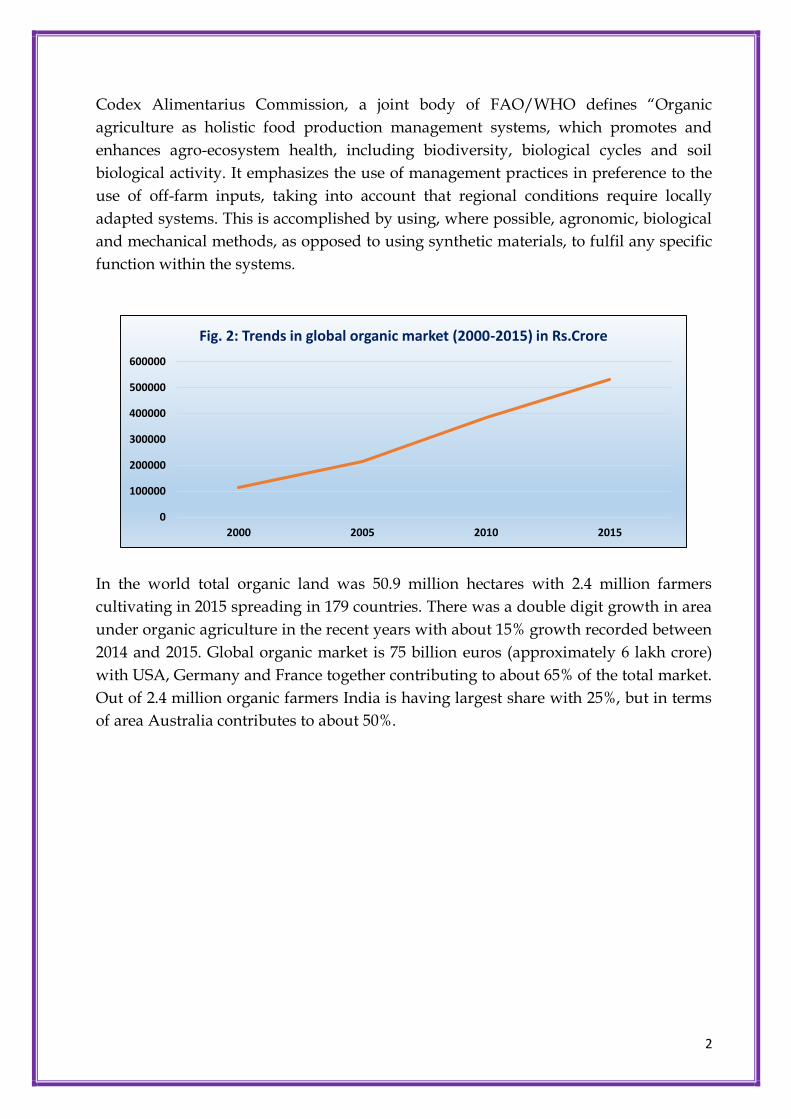
Codex Alimentarius Commission, a joint body of FAO/WHO defines “Organic
agriculture as holistic food production management systems, which promotes and
enhances agro-ecosystem health, including biodiversity, biological cycles and soil
biological activity. It emphasizes the use of management practices in preference to the
use of off-farm inputs, taking into account that regional conditions require locally
adapted systems. This is accomplished by using, where possible, agronomic, biological
and mechanical methods, as opposed to using synthetic materials, to fulfil any specific
function within the systems.
In the world total organic land was 50.9 million hectares with 2.4 million farmers
cultivating in 2015 spreading in 179 countries. There was a double digit growth in area
under organic agriculture in the recent years with about 15% growth recorded between
2014 and 2015. Global organic market is 75 billion euros (approximately 6 lakh crore)
with USA, Germany and France together contributing to about 65% of the total market.
Out of 2.4 million organic farmers India is having largest share with 25%, but in terms
of area Australia contributes to about 50%.
0
100000
200000
300000
400000
500000
600000
2000 2005 2010 2015
Fig. 2: Trends in global organic market (2000-2015) in Rs.Crore

3
Fig. 3: The world Organic Agriculture, 2015
1.1 Principles of organic agriculture:
Organic farming methods offer the best currently available practical model for
addressing climate-friendly food production, in addition to sustaining soil productivity
and health while taking care of profitability of farmers. The basic principles of organic
agriculture is given in Table 1.
4
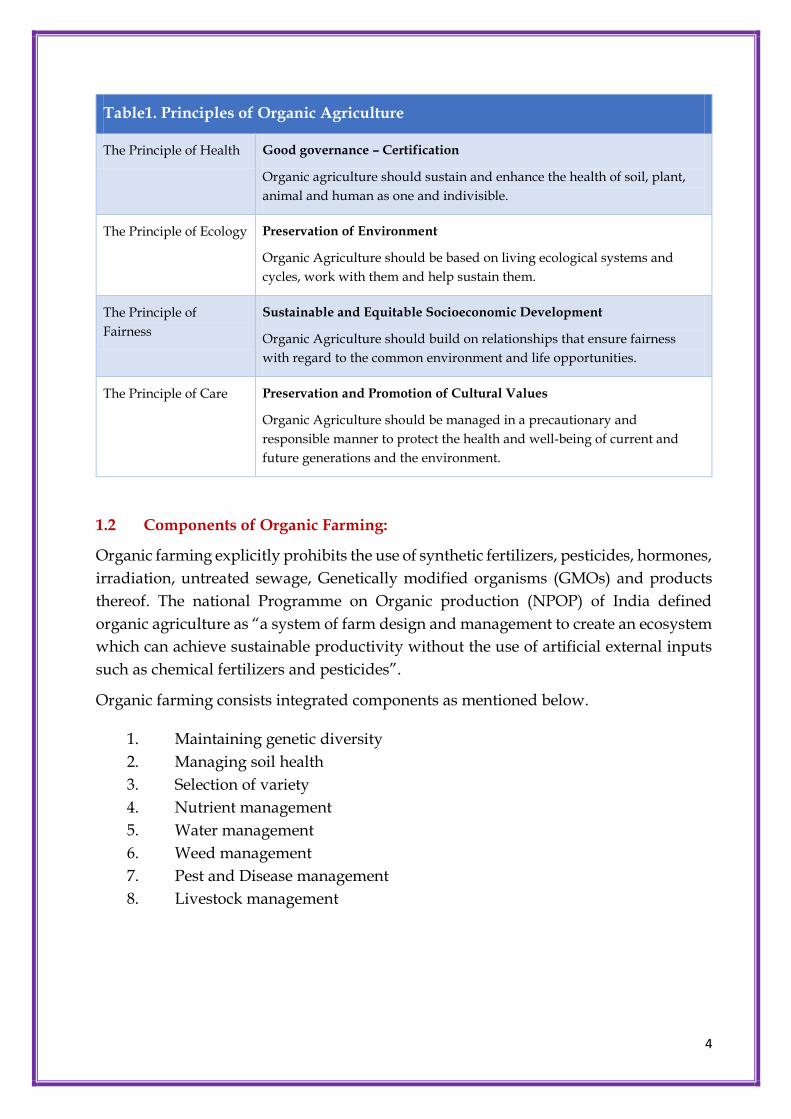
Table1. Principles of Organic Agriculture
The Principle of Health Good governance – Certification
Organic agriculture should sustain and enhance the health of soil, plant,
animal and human as one and indivisible.
The Principle of Ecology Preservation of Environment
Organic Agriculture should be based on living ecological systems and
cycles, work with them and help sustain them.
The Principle of
Fairness
Sustainable and Equitable Socioeconomic Development
Organic Agriculture should build on relationships that ensure fairness
with regard to the common environment and life opportunities.
The Principle of Care Preservation and Promotion of Cultural Values
Organic Agriculture should be managed in a precautionary and
responsible manner to protect the health and well-being of current and
future generations and the environment.
1.2 Components of Organic Farming:
Organic farming explicitly prohibits the use of synthetic fertilizers, pesticides, hormones,
irradiation, untreated sewage, Genetically modified organisms (GMOs) and products
thereof. The national Programme on Organic production (NPOP) of India defined
organic agriculture as “a system of farm design and management to create an ecosystem
which can achieve sustainable productivity without the use of artificial external inputs
such as chemical fertilizers and pesticides”.
Organic farming consists integrated components as mentioned below.
1. Maintaining genetic diversity
2. Managing soil health
3. Selection of variety
4. Nutrient management
5. Water management
6. Weed management
7. Pest and Disease management
8. Livestock management
5
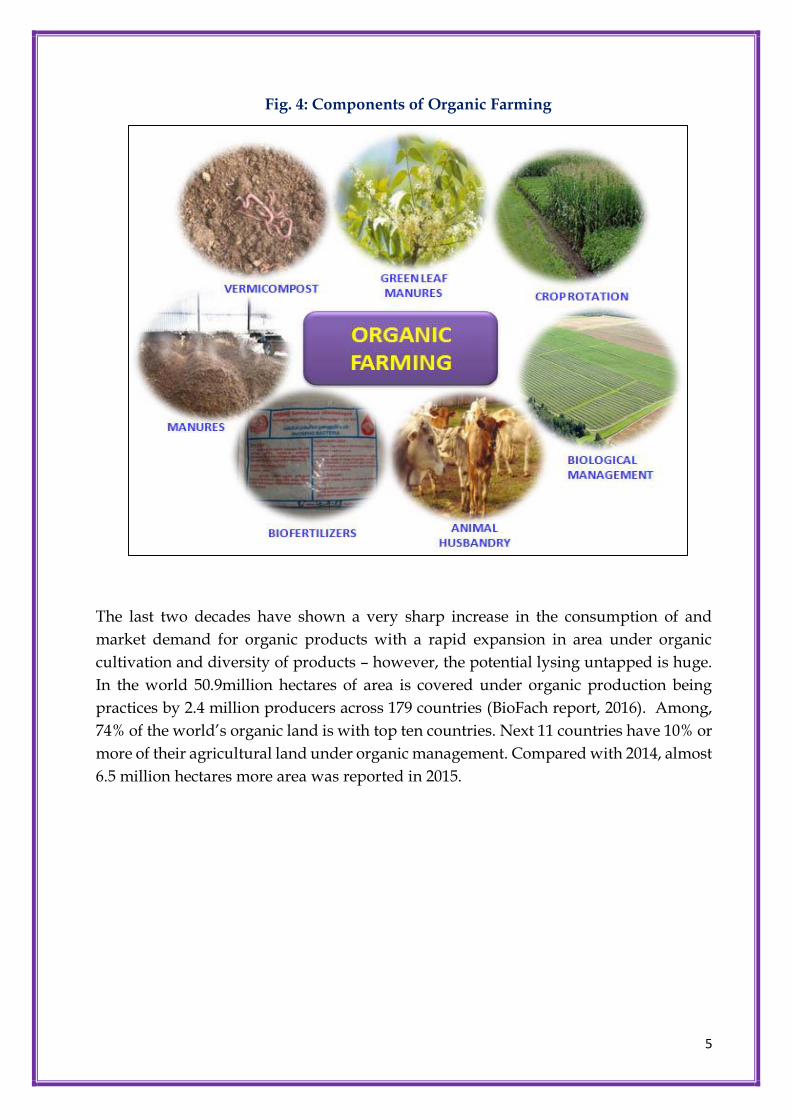
Fig. 4: Components of Organic Farming
The last two decades have shown a very sharp increase in the consumption of and
market demand for organic products with a rapid expansion in area under organic
cultivation and diversity of products – however, the potential lysing untapped is huge.
In the world 50.9million hectares of area is covered under organic production being
practices by 2.4 million producers across 179 countries (BioFach report, 2016). Among,
74% of the world’s organic land is with top ten countries. Next 11 countries have 10% or
more of their agricultural land under organic management. Compared with 2014, almost
6.5 million hectares more area was reported in 2015.

6
Compared with 2014. However, with regard to area, Asia occupies 8 percent of total
global organic land.
Fig. 5: Top ten countries with the largest areas of organic agricultural land, 2015
India has shown rapid progress in organic sector since 2003. From just 73,000 ha of
organically certified land in 2003, the figure has reached to 14.18 lakh ha under organic
crop management by 2016 (8.9 lakh ha land is fully certified another 6.2lakh ha is under
conversion). In 2016 the global trade of organic touched USD 38.6 bn and India’s Organic
exports is around Rs.1900 Crores. The area currently farmed by organic methods is about
1.2 million hectares, plus several hundred thousand hectares in the conversion phase.
Currently, India ranks 33 in terms of total land under organic cultivation and 70 for
agricultural land devoted to organic crops compared to total farming. The organic
farming area has to increase to five million hectares in the coming years according to the
ambitious plans under various development programmes including Paramparagath
Krishi Vikas Yojana (PKVY) and MOVCDNER.

7
1.3 About the PKVY Programme
In India, 54.6% of the population is engaged in Agriculture and allied activities (census
2011) which contributes 17% to the country’s Gross Value Added. Given the importance
for Agriculture sector, Government of India has been implementing several flag ship
schemes for its sustainable development. The prominent schemes are Prime Minister
Krishi Sinchai Yojana (PMKSY), Prime Minister Fasal Bima Yojana (PMFBY), Soil Health
Card (SHC) scheme, RKVY (Rashtriya Krishi Vikas Yojana, PKVY and MOVCDNER.
Among these programmes PKVY and MOVCDNER are particularly addressed to
promote organic agriculture. However, the organic sector presently is very small when
compared to the total cropping area of our country. Development in agriculture are in
favour of sustainable farming practices and in several for a, Organic farming is singled
out as a sector that should be promoted in a big way. It is acknowledged that there are
opportunities for organic farming that need to be identified and effective strategies used
to be bridge the significant gap between supply and demand. During 12th Five-year plan
to making agriculture more productive, sustainable, and remunerative and climate
resilient by promoting location specific integrated farming systems, soil and moisture
conservation measures, comprehensive soil health management, efficient water
management practices and mainstreaming rainfed technologies National Mission for
Sustainable Agriculture (NMSA) made operational from the year 2014-15. In particular,
steps have been taken to improve soil fertility on a sustainable basis through the soil
health card scheme, to provide improved access to irrigation and enhanced water
efficiency through Pradhan Mantri Krishi Sinchai Yojana (PMKSY), to boost the net
incomes of farmers. Further, to mitigate risk in agriculture sector “Pradhan Mantri Fasal
Bima Yojana (PMFBY) has been launched for implementation from Kharif 2016. Soil
Health Management (SHM) is one of the most important interventions under NMSA
along with soil health card scheme and INM. In addition, given the rising number of
concerns that use of chemical fertilizers and pesticides and rise in the demand for organic
food both PKVY and MOVCDNER were introduced.
Considering the potential that exists and the future demand of organically produced
food products, now a sunrise sector, this study was undertaken to assess the impact of
PKVY which was sponsored by the Ministry of Agriculture and Farmers Welfare,
Government of India. The study aimed at examining all aspects pertaining to organic
farming and recommend an action plan for implementation.

8
Chapter – II
Study Methodology
Paramparagat Krishi Vikas Yojana (Traditional Farming Improvement Programme) has
been launched by Government of India to support and promote organic farming and
thereby improving soil health. This will encourage farmers to adopt eco-friendly concept
of cultivation and reduce their dependence on fertilizers and agricultural chemicals to
improve yields.
2.1 Objectives and Scope of the Evaluation Study:
The PKVY scheme was launched in the year 2015 and has now completed more than 2
years of implementation across states.
The objectives of the study are as follows:
I. The basic objective of the impact study is to review different components of
PKVY and the spread of area under organic agriculture.
II. To examine the design of PKVY scheme in terms of planning, stakeholder
capacity, implementation challenges, input procurement and distribution
activities (clusters formed, trainings, labs established, inspection of clusters and
certification, input supplied) and output (area under organic expanded, organic
production and market linkages)
III. To assess the modalities of delivery of the scheme in terms of clusters selection,
farmers training, cluster formation, inspection of field, certification, input supply,
value chain development, producer companies, market infrastructure and market
support linkage like organic commodity boards.
IV. To assess the impact of PKVY scheme on area expansion under organic
agriculture, reduction in cost, use of bio fertilisers, farm productivity, value chain
development, price premium due to labelling, profitability and sustainability.
V. To suggest recommendations for improvement of overall design of the
programme and state specific measures for improving the effectiveness of the
scheme.
2.2 Evaluation Study and Results Framework
The aim of the Study is to assess the PKVY Programme’s in terms of 1. Relevance 2.
Scheme Design 3. Governance 4. Delivery and to evaluate the results in terms of 1.
Fulfilment of Objectives 2. Operational Efficiency 3. Impact and Sustainability.

9
Fig. 6: Evaluation Study and Results Framework
2.3 Evaluation Study Approach:
The study assessed different components of PKVY and their impact on the spread of
organic agriculture and effectiveness of Organic Farming Certification System in
increasing area under organic agriculture by organic clusters and can suggest policy
recommendations.
The study was based on collection of both secondary and primary level data. The
secondary data on fund allocation, release and expenditure and other information was
taken from website and other reports of Ministry of Agriculture, Govt of India. PKVY is
being implementing in 29 states. However, for the purpose of study, fifteen major states
were selected for primary data collection. Due care was taken to represent all the zones
in India. All the clusters names and contact details were taken from the groups registered
in the PGS in India. Then clusters were listed in descending order of area under cluster
in each state. Then we have selected the clusters by random to get representative sample
of clusters from each selected state. We have also identified a few best clusters in each
state and examined in detail through case study approach.
The study was based on both quantitative and qualitative approaches to achieve the
objectives of the study. Qualitative information in the form of stakeholder interviews
across the states under the study, expert opinion gathering information from Regional
Council, Lead Resource Person (LRPs), progressive farmers and agricultural officers
• Operational Efficiency• Sustainability
• Fulfillment of Objectives
• Impact
Implementation Relevance
DesignGovernance

10
were carried out. At the quantitative level, both secondary and primary data was
collected at the national, state and farmer levels.
All the indicators collected from field survey were classified as inputs (financial and
physical inputs under the scheme), activities (different activities organized under the
scheme), outputs (actual outputs of the scheme), outcomes (whether generated outputs
were utilized by the clusters) and impacts (what are the ultimate benefits of organic
farming to the farmers). The analyses were carried based on the clusters groups formed
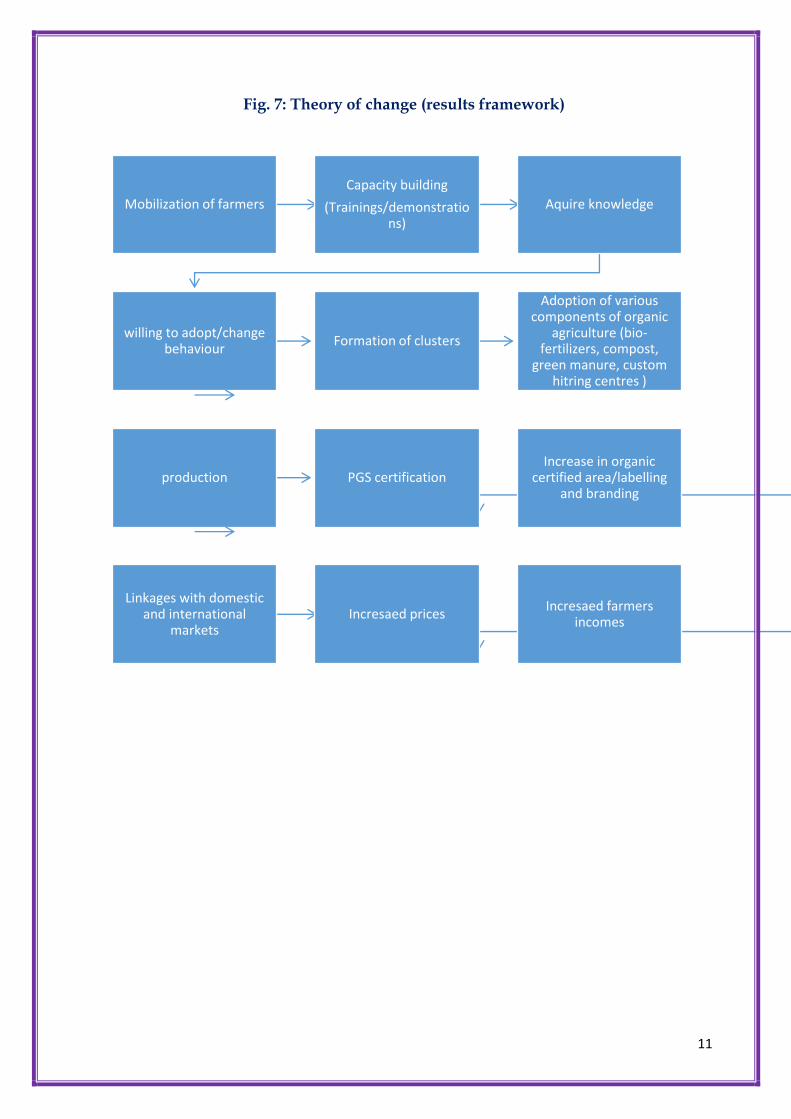
in the year 2015-16 & 2016-17. The theory of change behind the PKVY scheme was given
in figure 7. This framework was developed after interaction with all the stakeholders in
focus group interactions.
Table 2: Sampling Framework
Zone No. of State No. of
Districts
No. of
Blocks
No. of
Villages
No. clusters
Central 2 4 17 45 88
East 3 8 14 77 149
North 4 10 30 110 202
south 3 16 38 54 70
West 3 16 56 120 181
All 15 54 155 406 690
11
Fig. 7: Theory of change (results framework)
Mobilization of farmers
Capacity building
(Trainings/demonstrations)
Aquire knowledge
willing to adopt/change behaviour
Formation of clusters
Adoption of various components of organic
agriculture (bio-fertilizers, compost,
green manure, custom hitring centres )
production PGS certification Increase in organic
certified area/labelling and branding
Linkages with domestic and international
markets Incresaed prices
Incresaed farmers incomes

12
Chapter – III
Review of different components of PKVY
Review of different components of PKVY and spread of area under organic
agriculture
Government has launched Cluster based programme to encourage the farmer for
promoting organic farming and certification called Paramparagat Krishi Vikas Yojana
(PKVY). “Paramparagat Krishi Vikas Yojana” is an elaborated component of Soil Health
Management (SHM) of major project National Mission of Sustainable Agriculture
(NMSA).
3.1 Objectives of PKVY scheme
a. To reduce the use of chemical fertilizers for growing crops.
b. To encourage farmers for adopting eco-friendly, technically-endowed and
economical way for farming.
c. To make use of natural resources for agriculture.
d. To maintain the fertility of the soil.
e. To check dependency on fertilizers and chemicals to improve agricultural yields
3.2 Components and pattern of assistance
Adoption of Participatory Guarantee System (PGS) certification through cluster
approach:
I. Mobilization of farmers / local people to form cluster in 50 acres for PGS
certification
Conducting of meetings and discussions of farmers in targeted areas to form
organic farming cluster @ Rs. 200 / farmer
Exposure visit to member of cluster to organic farming fields @ Rs. 200 / farmer
Formation of cluster, farmer pledge to PGS and Identification of Lead Resourceful
Person (LRP) from cluster
Training of cluster members on organic farming (3 trainings @ Rs. 20000 per
training).
13
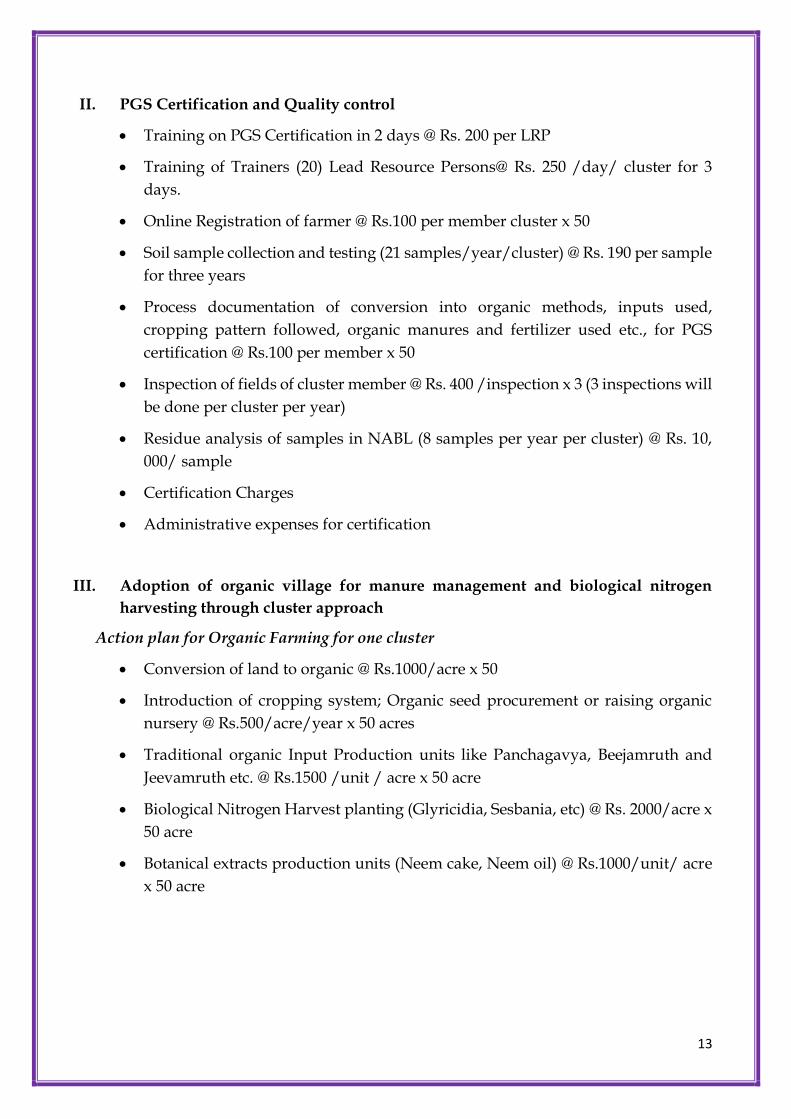
II. PGS Certification and Quality control
Training on PGS Certification in 2 days @ Rs. 200 per LRP
Training of Trainers (20) Lead Resource Persons@ Rs. 250 /day/ cluster for 3
days.
Online Registration of farmer @ Rs.100 per member cluster x 50
Soil sample collection and testing (21 samples/year/cluster) @ Rs. 190 per sample
for three years
Process documentation of conversion into organic methods, inputs used,
cropping pattern followed, organic manures and fertilizer used etc., for PGS
certification @ Rs.100 per member x 50
Inspection of fields of cluster member @ Rs. 400 /inspection x 3 (3 inspections will
be done per cluster per year)
Residue analysis of samples in NABL (8 samples per year per cluster) @ Rs. 10,
000/ sample
Certification Charges
Administrative expenses for certification
III. Adoption of organic village for manure management and biological nitrogen
harvesting through cluster approach
Action plan for Organic Farming for one cluster
Conversion of land to organic @ Rs.1000/acre x 50
Introduction of cropping system; Organic seed procurement or raising organic
nursery @ Rs.500/acre/year x 50 acres
Traditional organic Input Production units like Panchagavya, Beejamruth and
Jeevamruth etc. @ Rs.1500 /unit / acre x 50 acre
Biological Nitrogen Harvest planting (Glyricidia, Sesbania, etc) @ Rs. 2000/acre x
50 acre
Botanical extracts production units (Neem cake, Neem oil) @ Rs.1000/unit/ acre
x 50 acre
14
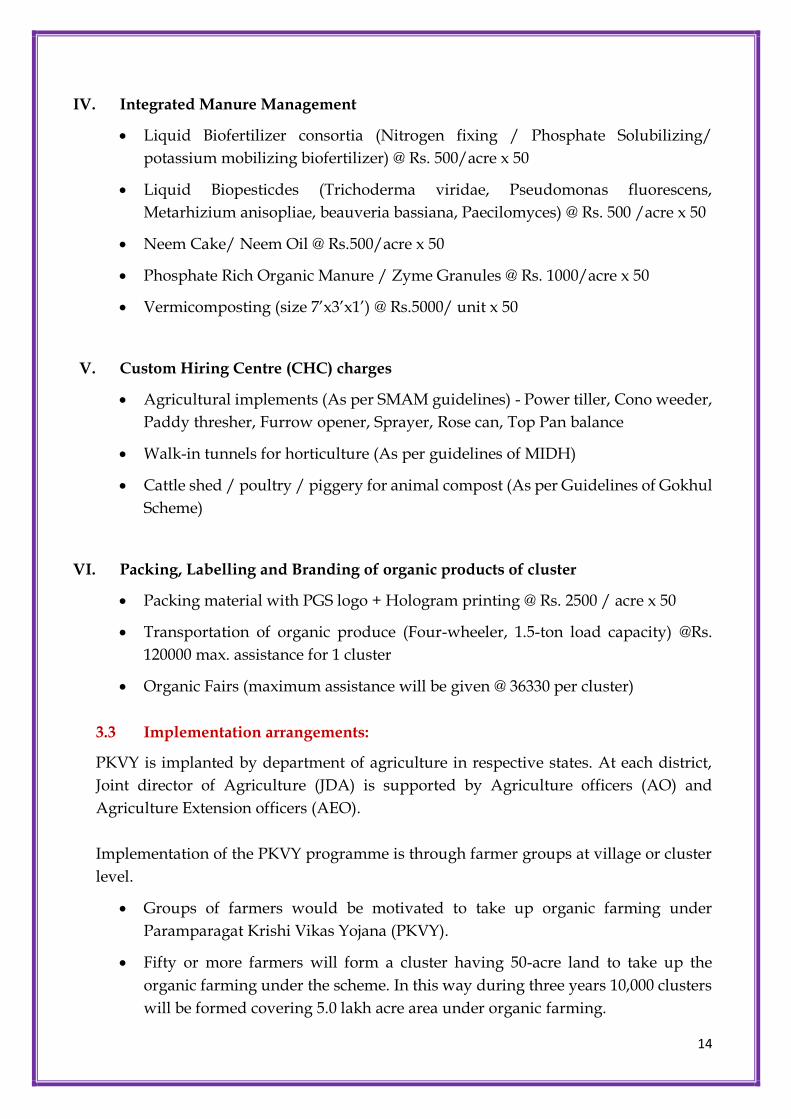
IV. Integrated Manure Management
Liquid Biofertilizer consortia (Nitrogen fixing / Phosphate Solubilizing/
potassium mobilizing biofertilizer) @ Rs. 500/acre x 50
Liquid Biopesticdes (Trichoderma viridae, Pseudomonas fluorescens,
Metarhizium anisopliae, beauveria bassiana, Paecilomyces) @ Rs. 500 /acre x 50
Neem Cake/ Neem Oil @ Rs.500/acre x 50
Phosphate Rich Organic Manure / Zyme Granules @ Rs. 1000/acre x 50
Vermicomposting (size 7’x3’x1’) @ Rs.5000/ unit x 50
V. Custom Hiring Centre (CHC) charges
Agricultural implements (As per SMAM guidelines) - Power tiller, Cono weeder,
Paddy thresher, Furrow opener, Sprayer, Rose can, Top Pan balance
Walk-in tunnels for horticulture (As per guidelines of MIDH)
Cattle shed / poultry / piggery for animal compost (As per Guidelines of Gokhul
Scheme)
VI. Packing, Labelling and Branding of organic products of cluster
Packing material with PGS logo + Hologram printing @ Rs. 2500 / acre x 50
Transportation of organic produce (Four-wheeler, 1.5-ton load capacity) @Rs.
120000 max. assistance for 1 cluster
Organic Fairs (maximum assistance will be given @ 36330 per cluster)
3.3 Implementation arrangements:
PKVY is implanted by department of agriculture in respective states. At each district,
Joint director of Agriculture (JDA) is supported by Agriculture officers (AO) and
Agriculture Extension officers (AEO).
Implementation of the PKVY programme is through farmer groups at village or cluster
level.
Groups of farmers would be motivated to take up organic farming under
Paramparagat Krishi Vikas Yojana (PKVY).
Fifty or more farmers will form a cluster having 50-acre land to take up the
organic farming under the scheme. In this way during three years 10,000 clusters
will be formed covering 5.0 lakh acre area under organic farming.
15
There will be no liability on the farmers for expenditure on certification.
Every farmer will be provided Rs. 20,000 per acre in three years for seed to
harvesting of crops and to transport produce to the market.
Organic farming will be promoted by using traditional resources and the organic
products will be linked with the market.
It will increase domestic production and certification of organic produce by
involving farmers.
3.4 Expected outcomes
The Scheme envisages:
a) Promotion of commercial organic production through certified organic farming.
b) The produce will be pesticide residue free and will contribute to improve the
health of consumer.
c) It will raise farmer's income and create potential market for traders.
d) It will motivate the farmers for natural resource mobilization for input production
3.5 Review of progress of PKVY scheme
Importance of PKVY scheme
Desktop study was done to understand the relevance and importance for promotion of
traditional agriculture in India under the PKVY schemes and the results are as follows:
The green revolution gave boost to the agriculture production in India with the
introduction of High yielding varieties, extension of irrigated areas, use of fertilizers and
pesticides and increase in cropping intensity. These modern farming practices of total
external dependence input agriculture had started contributing to concerns of soil
health, environmental pollution, pesticide toxicity, and sustainability of agricultural
production.
Against the background Scientists and policy planners are, therefore, reassessing
agricultural practices based on internalizing the inputs which relied more on biological
inputs rather than heavy usage of chemical. In India, certified organic food products
including basmati rice, pulses, honey, tea, spices, coffee, oilseeds, fruits, cereals, herbal
medicines, and their value-added products and Non-edible organic products include
cotton, garments, cosmetics, functional food products, body care products are produced.
Many studies reported that, the organic farming has comparable yields with
conventional farming systems in major crops and the yields will be higher in organic
farming in long run with the increase in soil microorganisms and reduced pathogen
population with integration of organic amendments. Also, that the organic matter
16
incorporation increases soil water retention in soil which enhances the yields. Practices
like application of biogas slurry, Panchagavya has reported increasing yields in maize
and beans.
Also, Organic farming provides quality food without adversely affecting the soil’s health
and the environment. This also provides ample opportunity for employment and bring
prosperity in the region. In addition, there is huge international demand for organic
products. Table below indicates the growth of Organic Agriculture globally.
Similarly, many other research reports say that studies proves that the Organic farming
a means to address food self-reliance, natural conservation and rural development. The
common thread in this approach is the sustainable use of bio-diversity.
According to a 2013 study conducted by the International Federation of Organic
Agricultural Movements (IFOAM), there are about two million farmers across the globe
who practice organic farming methods and roughly 80 percent of these farms are in
India. It wouldn’t be wrong to assume that our country is at the centre of an organic
revolution that is set to take the world by storm. Certified or not, the abundance of
organic farms in India is certainly not surprising since it is only a continuation of the
age-old farming practices followed by our ancestors.
Organic farming has become increasingly important in India given the rising number of
concerns that use of chemical fertilizers and pesticides are throwing up. GMO
(genetically modified) crops may provide an excellent yield but their long-term effects
are as yet untested and people are not quite ready to trust these foods. Apart from this,
there has been a significant rise in the demand for organic food across the world.
Promoting these organic-farming techniques only leaves India best poised to cash in on
the immense export potential of these foods. Keeping these in focus, the government of
India has decided to launch the Paramparagat Krishi Vikas Yojana.
3.6 Status of Organic Farming:
Global status
Considering all the aforesaid aspects, Organic agriculture is now being practiced in more
than 179 countries with a total area of 50.9 million hectare of agricultural land under
organic (including conversion areas) with 2.4 million producers globally.

17
Table 3: Global status of organic farming
Indicators World Top countries
Countries with organic
activities
2015: 179 countries Brunei Darussalam, Cap Verde,
Hong Kong, Kuwait, Monaco,
Sierra Leone and Somalia
Organic Agricultural land 2015: 50.9 million
hectares
Australia (22.7 million ha)
Argentina (3.1 million ha)
U.S. (2 million ha)
Organic share of total
agricultural land
2015: 1.1% Liechtenstein (30.2%)
Austria (21.3%)
Sweden (16.9%)
Wild collection and further
non-agricultural area
2015: 39.7 million
hectare
Finland (12.2)
Zambia (6.6)
India(3.7)
Producers 2015: 2.4 million
producers
India(585200)
Ethiopia (203602)
Mexico(200039)
Organic market 2015: 81.6 billion US
dollars
US (39.7 Billion USD)
Germany (9.5 billion USD)
France (6.1 billion USD)
No. of countries with
organic regulations
2016: 87 countries
No. of affiliates of IFOAM 2016: 833 from 121
countries
Germany (91)
India (73)
China (55)
US(49)
Source: The World of Organic Agriculture 2017 (www.organic-world.net)
18
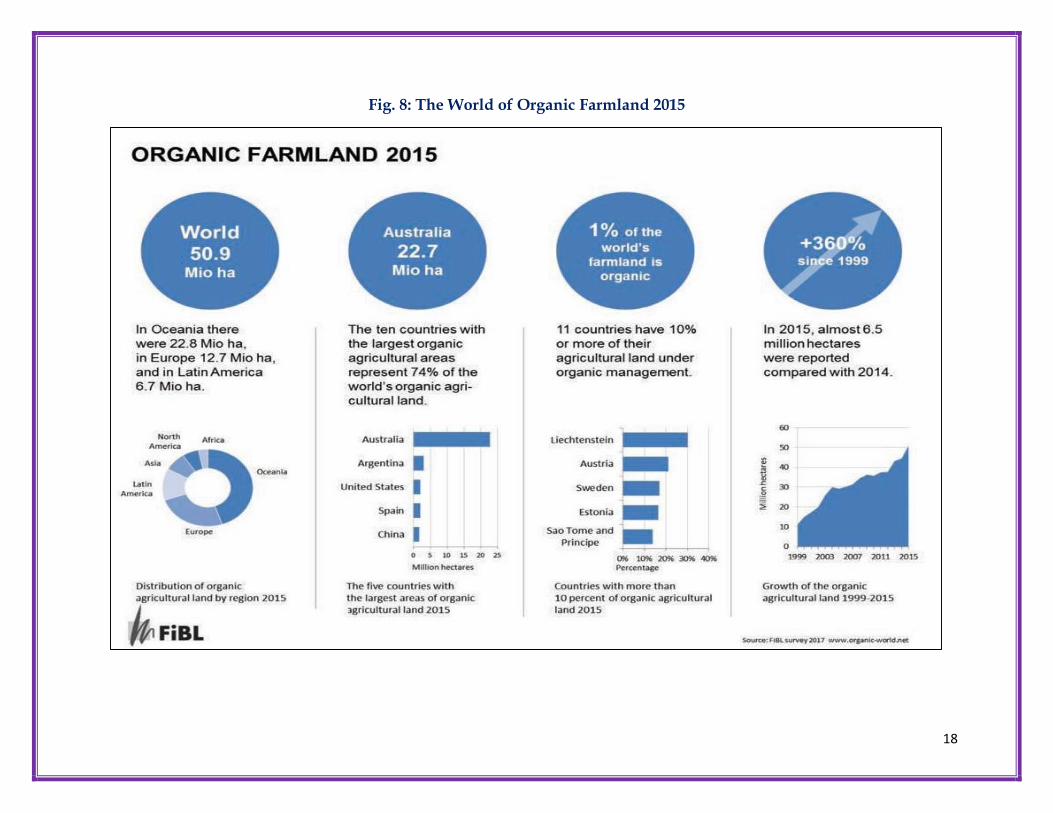
Fig. 8: The World of Organic Farmland 2015
19
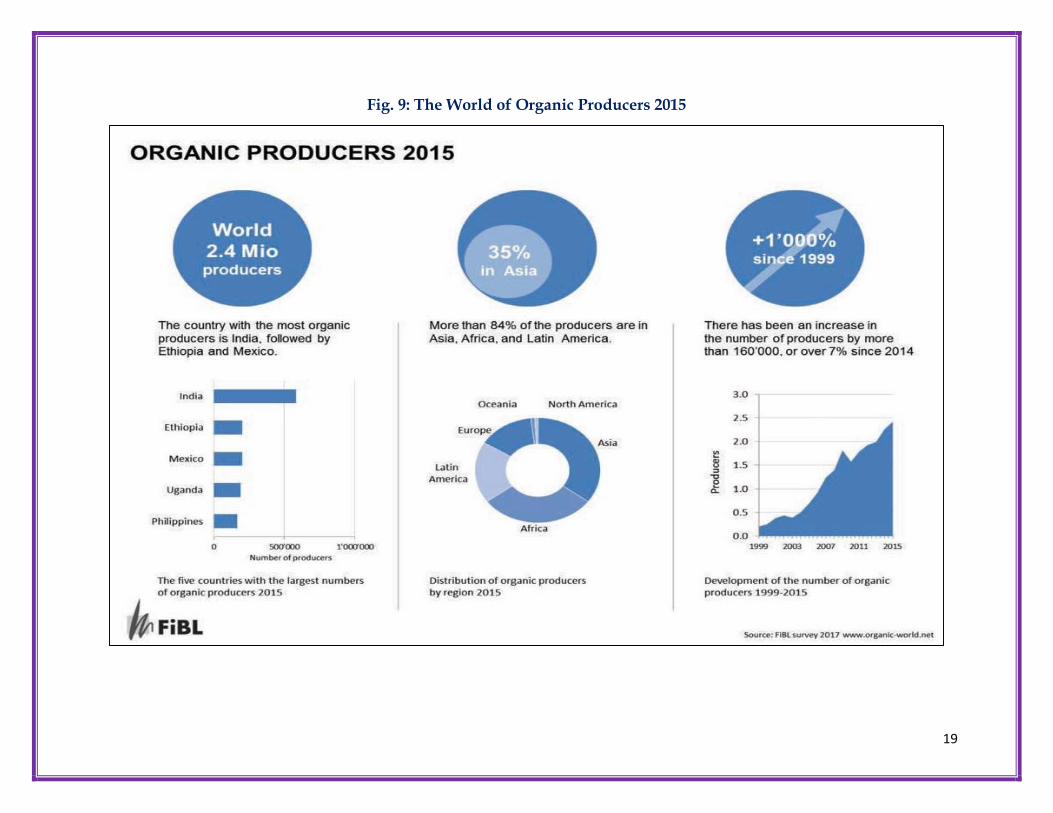
Fig. 9: The World of Organic Producers 2015
20
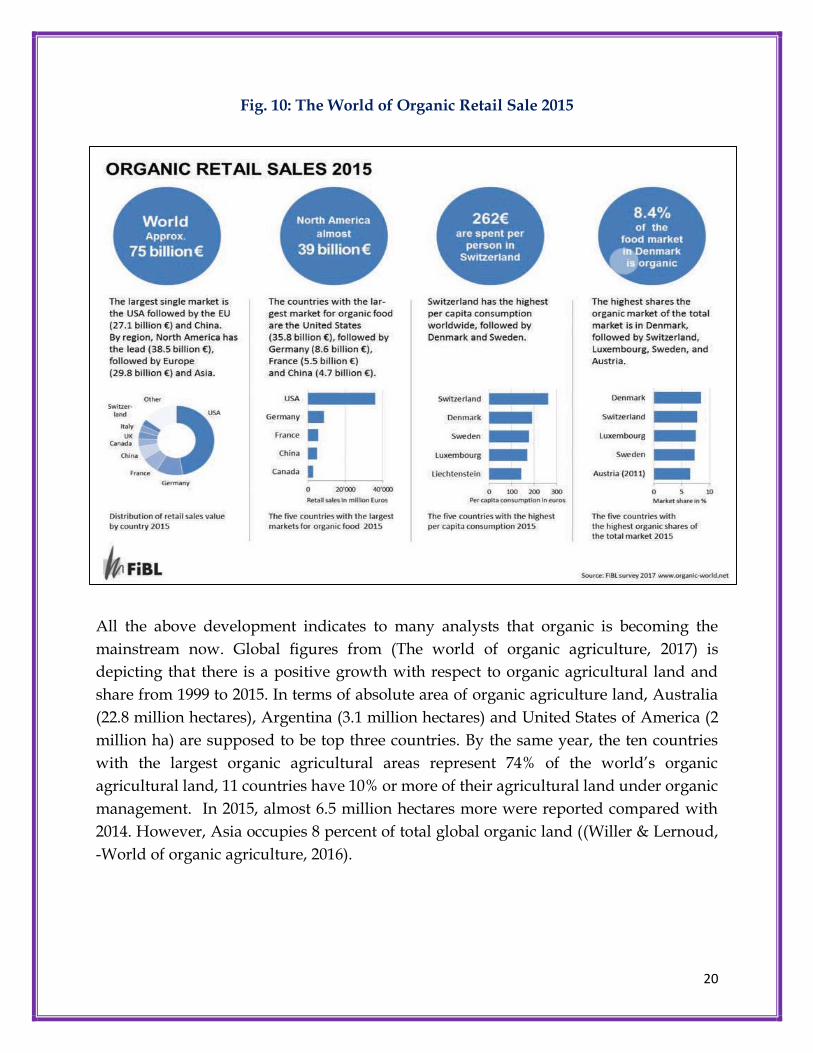
Fig. 10: The World of Organic Retail Sale 2015
All the above development indicates to many analysts that organic is becoming the
mainstream now. Global figures from (The world of organic agriculture, 2017) is
depicting that there is a positive growth with respect to organic agricultural land and
share from 1999 to 2015. In terms of absolute area of organic agriculture land, Australia
(22.8 million hectares), Argentina (3.1 million hectares) and United States of America (2
million ha) are supposed to be top three countries. By the same year, the ten countries
with the largest organic agricultural areas represent 74% of the world’s organic
agricultural land, 11 countries have 10% or more of their agricultural land under organic
management. In 2015, almost 6.5 million hectares more were reported compared with
2014. However, Asia occupies 8 percent of total global organic land ((Willer & Lernoud,
-World of organic agriculture, 2016).

21
Non – Agricultural organic areas which are classified and certified as such mainly for
wild collection constitutes another 39.7 million hectares globally. Here Finland (12.2
million ha), Zambia (6.6 million ha) and India (3.7 million ha) are the top three countries.
The organic market size was estimated to be 81.6 billion US dollars in 2015, up from 72
billion US dollars in 2013, which is more much more impressive growth. Here USA,
Germany and France are the largest organic markets, with the United States of America
constituting a significantly large share (about 49% of the global market).
By 2015, 87 countries has regulatory systems for organic, while 179 countries had data on
certified organic agriculture. In these countries, as alternative to third party certification,
community supported Agriculture and PGS approaches grew rapidly in the recent past.
Participatory guarantee system (PGS) can be defined locally –focused quality assurance
system, where producers are certified based on active participation of stakeholders and
are built on a foundation of trust, social networks, peer regulation and knowledge
exchange. This is seen to be particularly suitable for poor small holders.
Fig. 11: The World of Organic Agriculture 2015
Source: IFOAM- FiBl survey, 2016
Further, with regard to Organic producers, a total of 2.4 million organic producers was
reported. However, more than three quarters of the producers are located in Asia, Africa
and Latin America. Surprisingly India has largest share of organic producers (585’200),
followed by Ethiopia (203’602) and Mexico (200’039). This is an increase of more than
162’000 producers compared with 2014.
22
National status
While discussing all the above data, it has to be noted that there are serious and large
data gaps present in India with regard to organic farming. No systematic documentation
mandate exists right now with any agency with regard to data related to organic farming,
and most data cited from India about organic farm
ing is put out by Agricultural and Processed Food Products Export Development
Authority (APEDA, in the ministry of Commerce, Government of India) which is only
limited to certified area that the agency tracks through its traceability platform called
Trace net. However, there is much organic farming that happens outside this purview
and not necessarily for organized trade as is on the radar of APEDA.
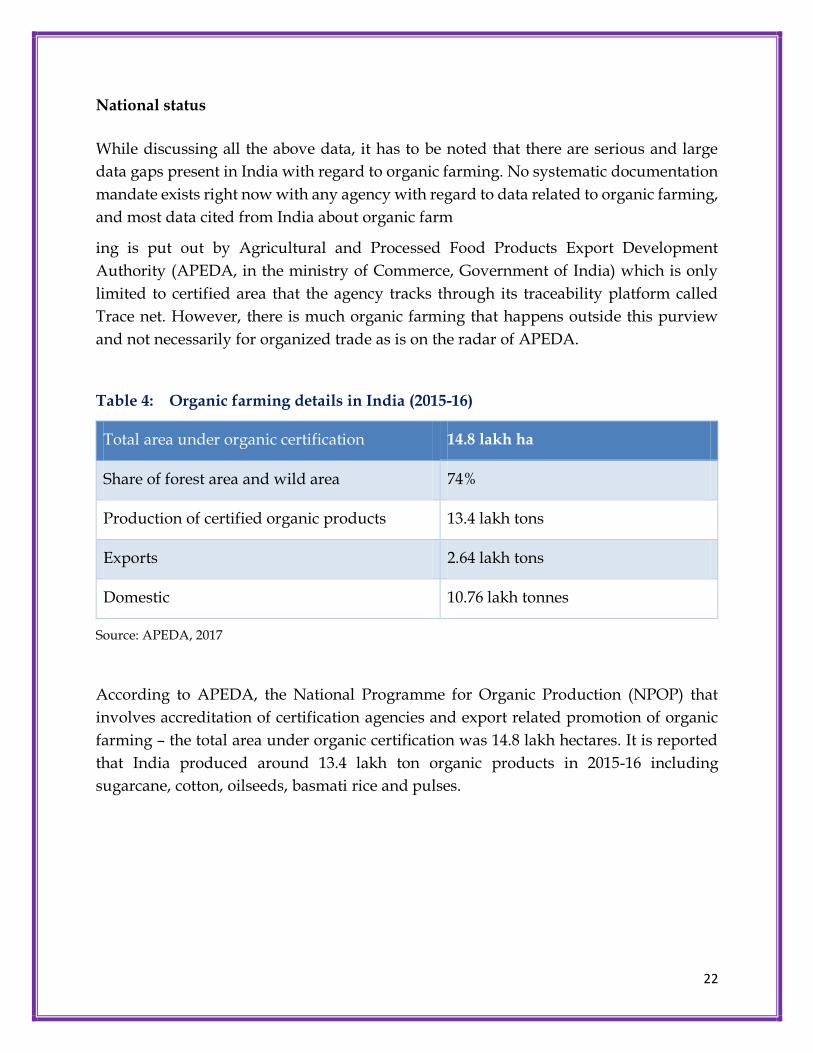
Table 4: Organic farming details in India (2015-16)
Total area under organic certification 14.8 lakh ha
Share of forest area and wild area 74%
Production of certified organic products 13.4 lakh tons
Exports 2.64 lakh tons
Domestic 10.76 lakh tonnes
Source: APEDA, 2017
According to APEDA, the National Programme for Organic Production (NPOP) that
involves accreditation of certification agencies and export related promotion of organic
farming – the total area under organic certification was 14.8 lakh hectares. It is reported
that India produced around 13.4 lakh ton organic products in 2015-16 including
sugarcane, cotton, oilseeds, basmati rice and pulses.

23
Fig. 12: Organic agricultural area and Production
Source: APEDA report, 2016
Further, Data from APEDA report reveals that there is constant increase in organic area
from 2003-04 except during 2009 to 2012 where there is slight decline in area due to loss
in cotton area due to introduction of Bt-cotton. Globally India, ranks 15 place in terms of
total land under organic cultivation with an area of 5.71 million ha (2015-16) with 1.34
million tonnes including cultivable area of 1.49 m ha (26 %) and rest 4.22 m ha (74%)
under forest and wild area harvest India Madhya Pradesh has highest area under organic
farming followed by Maharashtra and Rajasthan. Besides these states Meghalaya has
committed to have 2 lakh ha of certified organic land by 2020 and Sikkim aiming to
become 100 per cent organic which was an official announcement during 2016.
As per APEDA discussions no correct data on Organic farming area is recorded, since
57% of the organic produce sold as conventional. Whereas recorded data by APEDA-
Trace net and PGS India shows only registered farms under organic certification.
State-wise trends in organic agriculture
The data shows that there were 6211 farmer groups registered under PGS certification
which is one of the milestone of PKVY scheme. About 2,25,635 farmers were registered
across 25 states and 1.66 lakh ha covered under certification. With regard to number of
farmer group’s registration Maharashtra leads among states with followed by Madhya
Pradesh. Average area per cluster is 27 hectares with highest reported in Arunachal
Pradesh, Punjab and J & K. The average number of farmers per cluster were 36, with
highest reported in J&K, Uttarakhand and Jharkhand.
0
0.2
0.4
0.6
0.8
1
1.2
1.4
1.6
2012-13 2013-14 2014-15 2015-16
Organic production (Million Tonnes)

24
Table 5: State wise status of organic agriculture in India (2016-17)
S. No
State Name Total Groups
Total Group
Members (Farmers)
Total Area(Ha)
Area per
group (ha)
Members per group
% to total area
1 Madhya Pradesh 992 40200 46413 47 41 28
2 Maharashtra 1043 37317 20012 19 36 12
3 Uttarakhand 491 26560 19572 40 54 12
4 Uttar Pradesh 806 36429 15154 19 45 9
5 Karnataka 538 18238 15130 28 34 9
6 Rajasthan 410 17029 8162 20 42 5
7 Chhattisgarh 338 7538 6004 18 22 4
8 Himachal Pradesh 142 5413 4971 35 38 3
9 Gujarat 173 6073 4412 26 35 3
10 Arunachal Pradesh 1 6 4000 4000 6 2
11 Jharkhand 180 8828 3571 20 49 2
12 Kerala 247 3510 3196 13 14 2
13 Tamil Nadu 210 3466 2824 13 17 2
14 Punjab 1 18 2643 2643 18 2
15 Assam 119 3044 2526 21 26 2
16 West Bengal 105 4879 2013 19 46 1
17 Nagaland 34 1247 1265 37 37 1
18 Andhra Pradesh 79 707 1215 15 9 1
19 Tripura 61 2267 1000 16 37 1
20 Odisha 21 643 770 37 31 0.5
21 Jammu And Kashmir 14 914 692 49 65 0.4
22 Telangana 138 871 600 4 6 0.4
23 Manipur 57 358 282 5 6 0.2
24 Haryana 11 80 106 10 7 0.1
25 Total 6211 225635 166534 27 36 100
Source: PGS India website (9th sept. 2017)
25
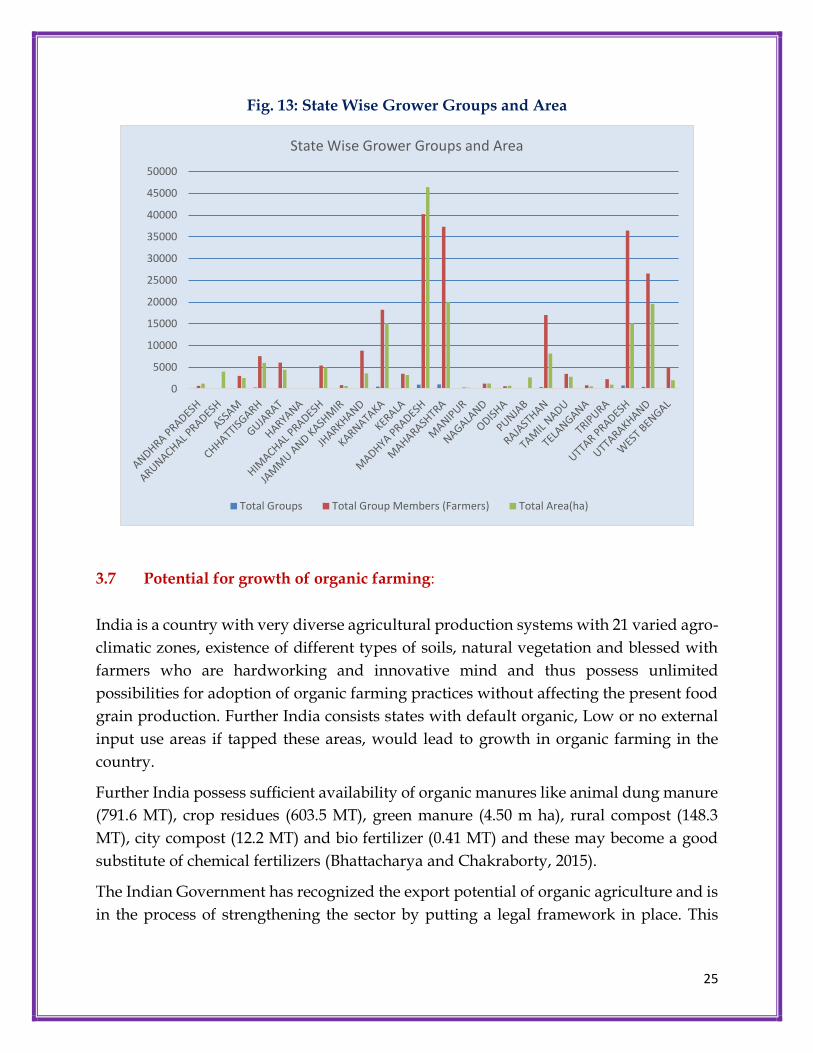
Fig. 13: State Wise Grower Groups and Area
3.7 Potential for growth of organic farming:
India is a country with very diverse agricultural production systems with 21 varied agro-
climatic zones, existence of different types of soils, natural vegetation and blessed with
farmers who are hardworking and innovative mind and thus possess unlimited
possibilities for adoption of organic farming practices without affecting the present food
grain production. Further India consists states with default organic, Low or no external
input use areas if tapped these areas, would lead to growth in organic farming in the
country.
Further India possess sufficient availability of organic manures like animal dung manure
(791.6 MT), crop residues (603.5 MT), green manure (4.50 m ha), rural compost (148.3
MT), city compost (12.2 MT) and bio fertilizer (0.41 MT) and these may become a good
substitute of chemical fertilizers (Bhattacharya and Chakraborty, 2015).
The Indian Government has recognized the export potential of organic agriculture and is
in the process of strengthening the sector by putting a legal framework in place. This
0
5000
10000
15000
20000
25000
30000
35000
40000
45000
50000
State Wise Grower Groups and Area
Total Groups Total Group Members (Farmers) Total Area(ha)

26
includes creating national organic standards (NPOP and NOP standards) and the
possibility of accrediting in-country inspection and certification bodies.
Consumer Demand: It is said that by 2020, India’s organic food market value is estimated
at USD 1.4 billion. According to some market research firm between 2010 and 2014, it is
noted that organic food market has grown at a CAGR of 17.45% and is forecast to grow
more than 25%. The rising effect is not only because of exports but also growing Domestic
market. Increased consumer awareness about conventionally-grown food. Currently
India exports 2.64lakh tons worth of Rs.1900 crores (2015-16) out of total production of
13.4 lakh tons. However only 3lakh tons can able to find domestic market worth of
Rs.1000 crores. This data show Europe, USA and Canada are the best export destinations
for Indian organic produce. (APEDA Data analysis, 2016). Export products Oil seeds
(50%), processed food products (25%), Cereals & Millets (17%), Tea (2%), Pulses (2%),
Spices (1%), Dry fruits (1%), and others.
In view of huge potential for organic production in India, recent past many states have
created projects from RKVY funds, state governments have also set aside their own funds
to back up organic farming policies. Since 2015 one of its kind schemes is initiated by the
government of India called Paramparagat Krishi Vikas yojana which is expected to
provide great move to organic farming in India.

27
Chapter – IV
Design of PKVY
4.1 Design of the Schemes
Overall, the gradually growing health and environmental consciousness, on various
continents, in supporting organic agriculture, whether from a production or from
consumption point of view is a noticeable trend. However, outcomes will be influenced
by the competition for public funds between various agricultural systems (mostly organic
and conventional) and the entrenchment of various supports for conventional systems.
4.2 Benchmarking and Comparison for design of Schemes:
Comparison India is ranked number one in the highest number of organic producers
worldwide and emerging as a good competitor in the field of organic market due to some
of its exclusive products like spices. But area under organic agriculture is still growing at
very slow pace. The table below is a comparative analysis of the India and the other
leading countries like Europe and USA depicts that the countries have more strategic
vision, they are more stable, and government is more involved with new initiatives to
encourage farmers to go organic due to reliable and feasible policies.

28
Table 6: Scheme Comparison of PKVY with International and National programs
Components India China USA Australia France Germany
Organic action
plan
Need location
specific focused
action plans
Need
strong
support
Present Absent Present Absent
Government Aid Subsidies or
incentives are
provided to
organic farmers
Support is
mainly
towards
covering
the cost of
certificati
on and
support is
low
Subsidies
during
conversion
period is given
provided by
govt and state
support is also
there in some
through EQIP
Provides grants
and financial
assistance
programmes to
Australian
businesses and
individuals to help
boost productivity
and exports
Governmenta
l support for
organic
farming is the
Organic
Ambition
2017 program
More support
and motivation
for young
farmers
Inspection cost
support
Partially under
PGS
Present Present Absent Present Absent
Vocational/
training program
Active Less
active
Highly Active /
Frequent
Less active Active Less active
global awareness
among farmers
Low High High High High High
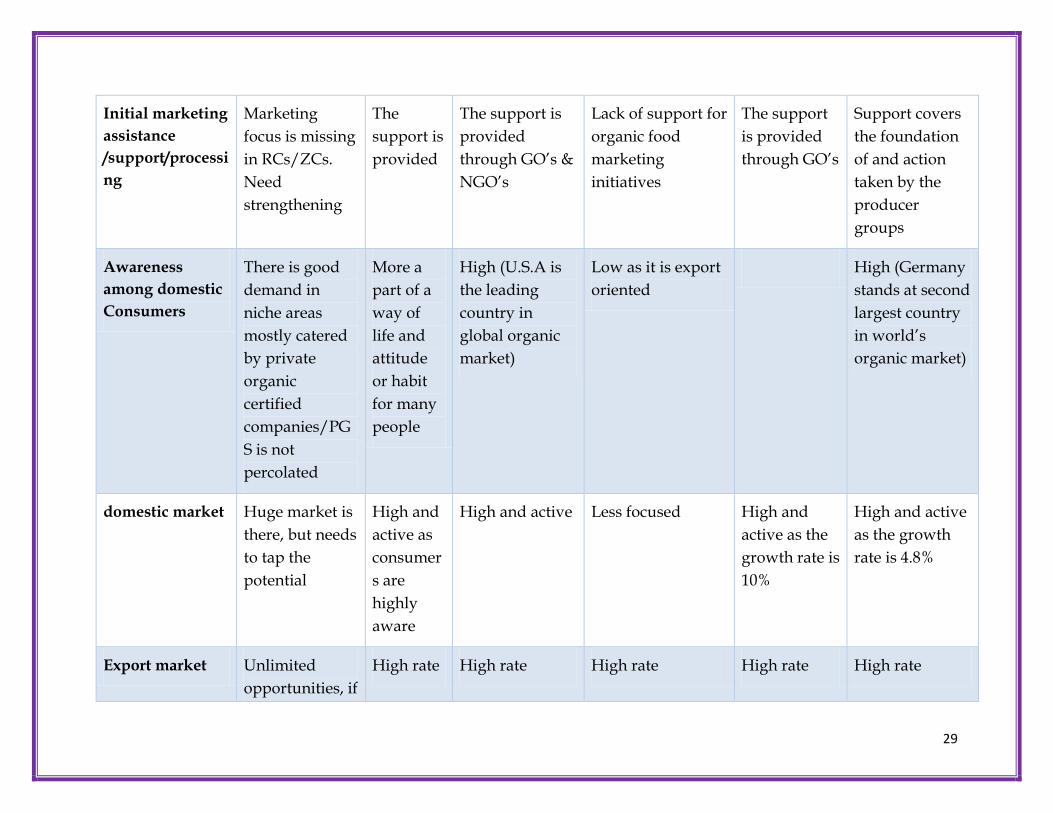
29
Initial marketing
assistance
/support/processi
ng
Marketing
focus is missing
in RCs/ZCs.
Need
strengthening
The
support is
provided
The support is
provided
through GO’s &
NGO’s
Lack of support for
organic food
marketing
initiatives
The support
is provided
through GO’s
Support covers
the foundation
of and action
taken by the
producer
groups
Awareness
among domestic
Consumers
There is good
demand in
niche areas
mostly catered
by private
organic
certified
companies/PG
S is not
percolated
More a
part of a
way of
life and
attitude
or habit
for many
people
High (U.S.A is
the leading
country in
global organic
market)
Low as it is export
oriented
High (Germany
stands at second
largest country
in world’s
organic market)
domestic market Huge market is
there, but needs
to tap the
potential
High and
active as
consumer
s are
highly
aware
High and active Less focused High and
active as the
growth rate is
10%
High and active
as the growth
rate is 4.8%
Export market Unlimited
opportunities, if
High rate High rate High rate High rate High rate

30
tapped with
plan
Government
involvement
PKVY/MOVC
DNER, but
focused efforts
needed
High High High High High
national
administrative
body
National
Programme on
Organic
Production
(NPOP)
Certificati
on and
Accredita
tion
Administ
ration of
the
People’s
Republic
of China
(CNCA)
USDA NASAA
PGS Present Not so
prevalent
Present with
third-party
certification
Not so prevalent Present Present

31
India is ranked number one in the highest number of organic producers worldwide and
emerging as a good competitor in the field of organic market due to some of its exclusive
products like spices. But area under organic agriculture is still growing at very slow pace.
The above table comparative analysis of the India and the other leading countries like
Europe and USA depicts that the countries have more strategic vision, they are more
stable, and government is more involved with new initiatives to encourage farmers to go
organic due to reliable and feasible policies.
Europe has been the front runner in terms of public support to organic Agriculture both
in the EU and other European states. The first scheme specifically targeted at organic
farming was introduced in Denmark in 1987, followed by other countries such as Austria
and Switzerland. As part of the reform of the EU Common Agricultural Policy (CAP) in
1992, the introduction of agri‐environment programs provided a unified framework for
supporting conversion to and maintenance of organic production across EU. In the new
EU CAP for 2014 2020, the role of organic farming is recognized as a way of farming that
responds to consumer demand for more environmentally friendly farming practices. In
line with the motto “Public money for public goods”, the new CAP 2014 2020 makes
organic farming more visible and confirms its role as a measure for providing public
goods. As a result, the expansion of organic farming has itself become policy goal in EU
countries.
Similarly, Public policies towards the organic sector in Canada and the USA have focused
mainly on fostering orderly markets and public confidence in the organic label through
regulation and enforcement. On the other hand, these governments have implemented
measures to ensure that the organic sector has equal importance with other govt
programmes. In a span of several years the USDA has: increased budgets for organic
agriculture research, adjusted its risk management (crop insurance) program to reduce
barriers to access by organic farmers, and introduced more organic data collection and
dissemination. Canada supports organic market promotion through an organic
roundtable, which is one of 15 such working groups on specific agricultural sub sectors.
However, In India we lack such comprehensive strategies, absence of financial support
from the governments. Indian organic agriculture is suffering from poor linkage between
farmers and markets. Majority of the countries are providing incentives to support
organic farmers in transition period and focusing on next generation which is a most
important for sustainability of farming in long run. However, in India because of small
holdings Supplies do not match the demand which is another problem caused by lack of
direct linkage between producer and customer either caused by the manipulation of the

32
traders or confusion in consumer demand. More over processing industry in India is
badly fragmented, not organized.
Government should play important role by giving various supports to the producer and
consumer associations to market the products. To increase the market value of organic
products in domestic and export markets some new improved refined processing
technologies are introduced.
Governments should take an enabling and facilitating role for improving the overall
policy covering a wide range of area from production, marketing, supply chain, training
and research and training of the both civil servant and private e sector should be the main
area of concern. In addition, fair, quick and efficient delivery system for such assistance
should be made.
Comparison of design of various government schemes related to organic agriculture
The figure 14 all the central and state government schemes which have organic
agriculture component are given. The detailed comparison of these schemes is presented
in table 6. Most of these schemes also have in built element of subsidy for various
components which enhances production capacity of farmers. Implementation of the
programmes through farmer groups’ rather individual farmers is an added advantage to
the schemes. The schemes were designed such way few households may benefit from
that more than one scheme.
The National programme on Organic Production was initiated (NPOP) in 2001. In 2002,
the India organic logo was released under NPOP. In the tenth plan, ministry of
agriculture launched the National Project on Organic Farming. After running it through
the eleventh plan period, during the middle of the twelfth plan period, this was combined
with NMSA and made into a sub component of soil health mission, which itself is a
component of NMSA.
Further, all schemes were meant to promote some of the organic production activities. To
mention specifically Under National Project on Organic Farming (NPOF) scheme,
assistance up to 25% and 33% of financial outlay up to a ceiling of Rs. 40 lakhs and Rs. 60
lakhs respectively is provided as back ended subsidy through NABARD for
establishment of bio- pesticides/bio fertilizers production units and agro waste compost
production units respectively.
Besides, under National Horticulture Mission (NHM) and Horticulture Mission for North
East & Himalayan States (HMNEH), financial assistance is provided for setting up vermi-
compost production units @ 50% of the cost subject to a maximum of Rs. 30,000/- per
beneficiary, for adoption of organic farming @ Rs. 10,000/- per hectare for maximum area

33
of 4 hectare per beneficiary and for organic farming certification @ Rs.5.00 lakh for a
group of farmers covering an area of 50 hectares.
Similarly, under RKVY assistance for promotion of organic farming on different
components are also available with the approval of State Level Sanctioning Committee.
Other schemes like NMSA and NPMSH has also various components which helps to
intensive promotion of organic farming in the country. Under RKVY state government
have flexibility and autonomy in planning, approval and execution of approved projects,
including for organic farming.
The operation of the schemes was in isolation. Integration of all agriculture schemes
rather than component based approach and converging with other departments helps in
better results. With the current approach, few households are benefiting with more than
one scheme for the same component leaving others aside (RKVY evaluation study in
Rajasthan, 2015).
Along with existing schemes a newly initiated first of its kind exclusive organic farming
scheme in India is Paramparagat Krishi Vikas Yojana. PKVY scheme has a financial
outlay of Rs.300 crore during 12th five-year plan for promoting organic farming in a
cluster approach with an aim to form 10000 clusters (with each covering 50 acres) across
the country, to bring 2 lakh hectares under organic farming through PGS – organic
certification.
Fig. 14. Various government schemes to promote organic agriculture

34
Table 7: Design of the Projects relevant to Organic Agriculture
Title Objective Beneficiaries
Pattern of Assistances
PKVY Organic agriculture is a production of agricultural products free from chemicals and pesticides residues by adopting eco-friendly low cost technologies.
“Paramparagath Krishi Vikas Yojana” is an elaborated component of Soil Health Management (SHM) of Major project National Mission of Sustainable Agriculture (NMSA).
Under PKVY Organic farming is promoted through adoption of organic village by cluster approach and PGs certification.
Farmers Groups
Agril. Entrepreneur
Service Provider
Consumers
In case of demonstration by institutions/agencies the funding pattern is 100% grant from Central Government which required necessary approval of the competent authority. NGOs registered with NITI Aayog/Regional Councils with NCOF shall also be eligible to be the implementing agencies with the condition that at least 10% of the total project cost is contributed by them.
The financial assistance is provided to clusters on different sub components for mobilization of farmers, organic seeds, to harvest biological nitrogen etc.
NHM To provide holistic growth through an area based regionally differentiated strategies.
To establish confluence and alliance among on-going and planned programme.
To boost, develop and propagate technologies through modern scientific with traditional knowledge
To create employment opportunities.
Farmer’s association
Farmers’ companies
Registered Farmers’ Societies
Farmers cooperative
Extension workers
Centrally sponsored scheme in which GOI provide 100% assistance to state mission
To provide backing to help the comprehensive development of Horticulture in state through Area expansion, marketing and processing, HRD etc.

35
HMNEHR
To augment economic, ecological and social benefits from current infrastructure and investment conceive for Horticulture development
To boost ecologically sustainable aggregation and economically enticing diversification of horticulture.
To establish confluence and alliance among on-going governmental programmes. To achieve horizontal and vertical integration of these programmes
Farmer’s association
Farmers’ companies
Registered Farmers’ Societies
Farmers’ cooperative
Extension workers
MINI MISSION-1, based 100% for public sector include seed and planting material – production and supply of parental lines, quality seeds, rootstocks, motherstocks and maximum permissible cost per project is Rs. 15 lakh.
Technology standardisation/refinement and dissemination permissible cost per project is Rs. 20 lakh.
Acquisition of technologies including import of planting material from other countries permissible cost per project is Rs. 10 lakh.
Imparting training through on farm trials/ demonstration cost Rs. 5 lakh per project.
NPMSHF
To aid and promote Integrated Nutrient Management (INM) through considerate use of chemical fertilisers, including secondary and micro nutrient, in conjunction with organic manure and bio-fertilisers, for improving soil health and its productivity.
To strengthen soil testing facilities and provide soil test based recommendations to farmers for improving soil fertility and economic return to farmers
To promote use of micro nutrients
Conducting training and demonstration to upgrade
Farmers group
Extension staff
Agril. Entrepreneur
Individual farmer
Area
Arrange new soil testing laboratories and Mobile Soil Testing Laboratories (MSTLs)
Strengthening of existing static STLs for micronutrient analysis.
Capacity building through training and demonstration.
Creation of data bank for balanced use of fertilisers
Adoption of village by STLs through frontline field demonstration.
Preparation of digital district soil matter, a soil fertility monitoring system by ICAR SAUs.
Setting up of fertilisers testing laboratories for advisory purpose, under the private/cooperative sector.

36
the skill and knowledge of staff and farmers
Strengthening of fertiliser’s quality control facility.
NPOF To popularize organic farming for enhancing farm income
Individual farmer
Famers group
Agri-entrepreneur
Service provider
Human Resource Development by providing training state government officers, Fertilisers Inspector, organic Fertilizers Analysts.
Statutory Quality Analysis of Bio fertilizers and Organic Fertilizers under Fertilizer Control Order (FCO) and Testing of other organic inputs for study purpose.
Capacity building for low cost alternative, farmers group centric certification system- PGS
Support for organic input production units under Capital Investment back ended subsidy scheme through NABARD
Awareness creation through publicity, publication and other print and electronic media.
RKVY To impetus the States to increase public investment in agriculture and allied sectors.
To provide flexibility and autonomy to the States in planning and executing agriculture and allied sectors schemes.
To ensure the preparation of plants for the districts and the States based on agro-climatic conditions, availability of technology and natural resources.
To ensure that the local
Farmers association
Unemployed youth
Researchers
Extension workers
Processors
Registered Farmers Societies
RKVY funds would be provided to the state as 100% grant by the central government in production growth ( 35% of annual outlay), infrastructure and assets (35% of annual outlay), special scheme (20% of annual outlay), flexi fund (10% of annual outlay)
Activities/component proposed under RKVY are generally covered under various on-going schemes/programmes of central government and the technical support or financial norms will be according to the scheme/programme.
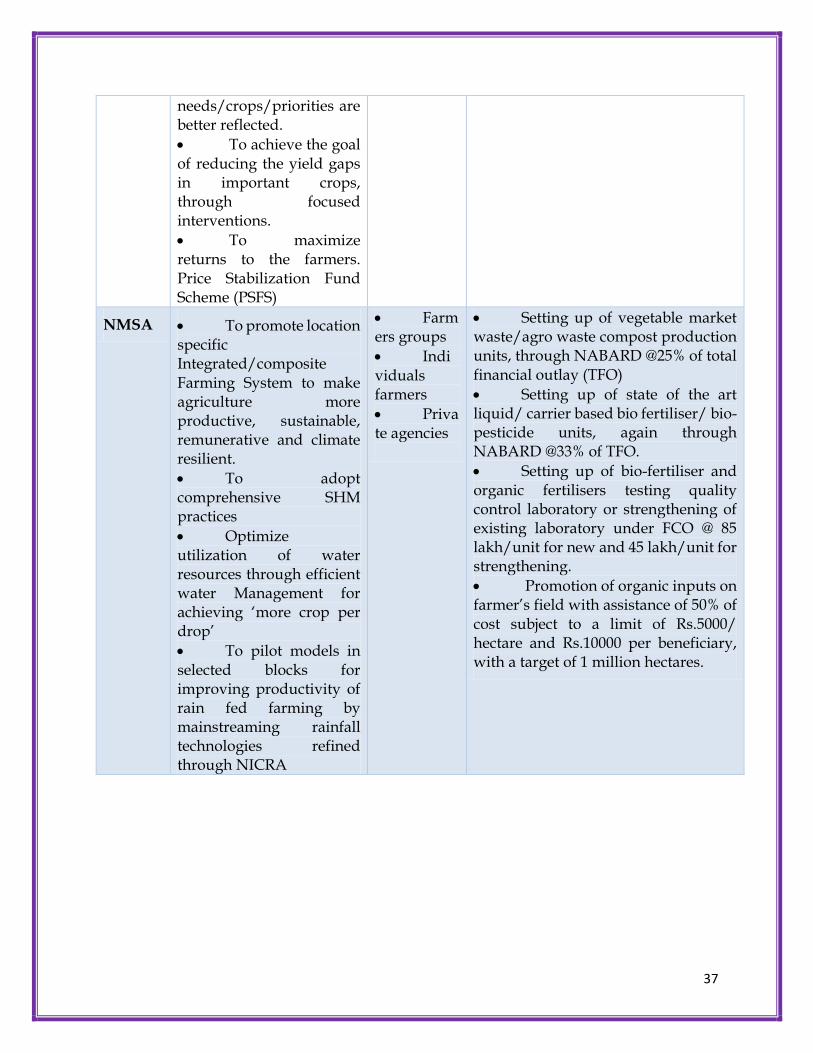
37
needs/crops/priorities are better reflected.
To achieve the goal of reducing the yield gaps in important crops, through focused interventions.
To maximize returns to the farmers. Price Stabilization Fund Scheme (PSFS)
NMSA To promote location specific Integrated/composite Farming System to make agriculture more productive, sustainable, remunerative and climate resilient.
To adopt comprehensive SHM practices
Optimize utilization of water resources through efficient water Management for achieving ‘more crop per drop’
To pilot models in selected blocks for improving productivity of rain fed farming by mainstreaming rainfall technologies refined through NICRA
Farmers groups
Individuals farmers
Private agencies
Setting up of vegetable market waste/agro waste compost production units, through NABARD @25% of total financial outlay (TFO)
Setting up of state of the art liquid/ carrier based bio fertiliser/ bio-pesticide units, again through NABARD @33% of TFO.
Setting up of bio-fertiliser and organic fertilisers testing quality control laboratory or strengthening of existing laboratory under FCO @ 85 lakh/unit for new and 45 lakh/unit for strengthening.
Promotion of organic inputs on farmer’s field with assistance of 50% of cost subject to a limit of Rs.5000/ hectare and Rs.10000 per beneficiary, with a target of 1 million hectares.
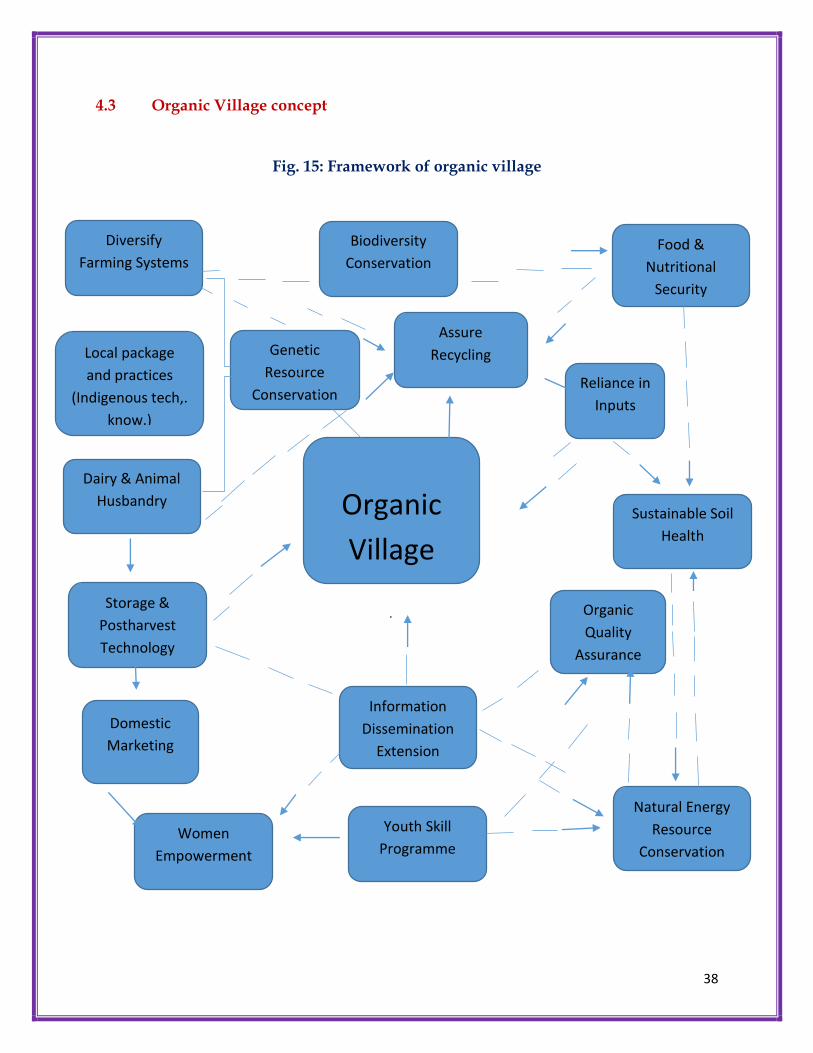
38
4.3 Organic Village concept
Fig. 15: Framework of organic village
.
Local package
and practices
(Indigenous tech,.
know.)
Genetic
Resource
Conservation
Assure
Recycling
Reliance in
Inputs
Dairy & Animal
Husbandry
Organic
Village
Sustainable Soil
Health
Storage &
Postharvest
Technology
Information
Dissemination
Extension
Service
Organic
Quality
Assurance
Youth Skill
Programme
Natural Energy
Resource
Conservation Women
Empowerment
Diversify
Farming Systems
Biodiversity
Conservation Food &
Nutritional
Security
Domestic
Marketing

39
4.4 PGS certification in India and abroad
As per IFOAM (2008), Participatory Guarantee Systems in are locally focused quality
assurance systems which certify producers based on active participation of stakeholders
and are built on a foundation of trust, social networks and knowledge exchange. They
can also complement third party certification with a private label that brings additional
guarantees and transparency. PGS also enables the direct participation of producers,
consumers and other stakeholders with their choice and definition of the standards and
implementation of certification procedures. Large number of organic producers are
certified through Participatory Guarantee Systems (PGS) across the world. It is estimated
that around 1,09317 small operators are involved in PGS certification. The leading
countries with regards to PGS are located in the global south. The PGS Organic India
Council was set up after a consultation process in 2006. In April 2011, it is registered as a
society Participatory Guarantee Systems Organic Council (PGSOC). PGS in India is
managed by Department of Agriculture and cooperation Ministry of Agriculture and
Farmer welfare, Government of India.
4.5 State wise comparison in design and Modalities
Many of sates have announced organic farming policies. Started with Sikkim in 2003, and
Karnataka in 2004, Kerala 2008, Gujarat becomes the 9th state to announce state organic
farming policy. The state wise detailed comparison of design and modalities in
certification, farm inputs, awareness and training, marketing, financial incentives,
campaign, SAU having separate department of organic farming and fully certified
organic state were given in table**.
In order to improve the sustainability of farm livelihoods, many states in India has
introduced state organic policies to support a set of policy instruments that will put the
organic sector on a higher growth path. The common aim of the all-state polices is
strengthen the production systems, supply chain and marketing systems by creating an
enabling environment, required infrastructure, regulations and providing necessary
incentives and support.
Political commitment to organic agriculture in Sikkim started in 2003 and was
accompanied by “Sikkim State Organic Board” creation which supported the production
and use of organic fertilizers and organic seeds, and capacity building for extension
officers, farmers and young people. Followed by a number of pilot projects on organic
group certification were implemented in cooperation with NGOs, service providers from
40
2006 onwards. In 2010, the Chamling government launched the Sikkim Organic Mission
with a clear road map and target of converting 50,000 hectares of land, thereby bringing
the entire state to organic status by 2015.
Followed by Sikkim’s incredible achievement many states has declared state organic
policies, emphasizing on capacity building of staff and farmers, Subsidies and other
incentives for inputs to support small and marginal farmers during conversion period.
Special consideration was given for development and support of alternative quality
control systems like group and PGS certification systems. Also farmers were encouraged
to register their farms under organic certification for free of cost. Further, policy has
included support for small entrepreneurs for bio fertilizers, biopesticdes preparations, so
that all the inputs can be accessed by the organic farmers for affordable prices. There are
innovative schemes initiated by state governments like the organic village scheme of
Karnataka government. They have supported adequate number of certification agencies
and financial support to carry out the free certification for the farmers for intended export
of organic produce. A step ahead Sikkim state has announced brand name for their
organic products and all the organic products are marketing under brand name and given
‘Sikkim organic logo”. Similar concept is following in Kerala under “Jaiva Keralam”. In
addition, Kerala organic policy also focusing on promotion of farmer producer
organizations (FPOs) with organic farmers and moving to further step of organic food
processing with the FPOs.
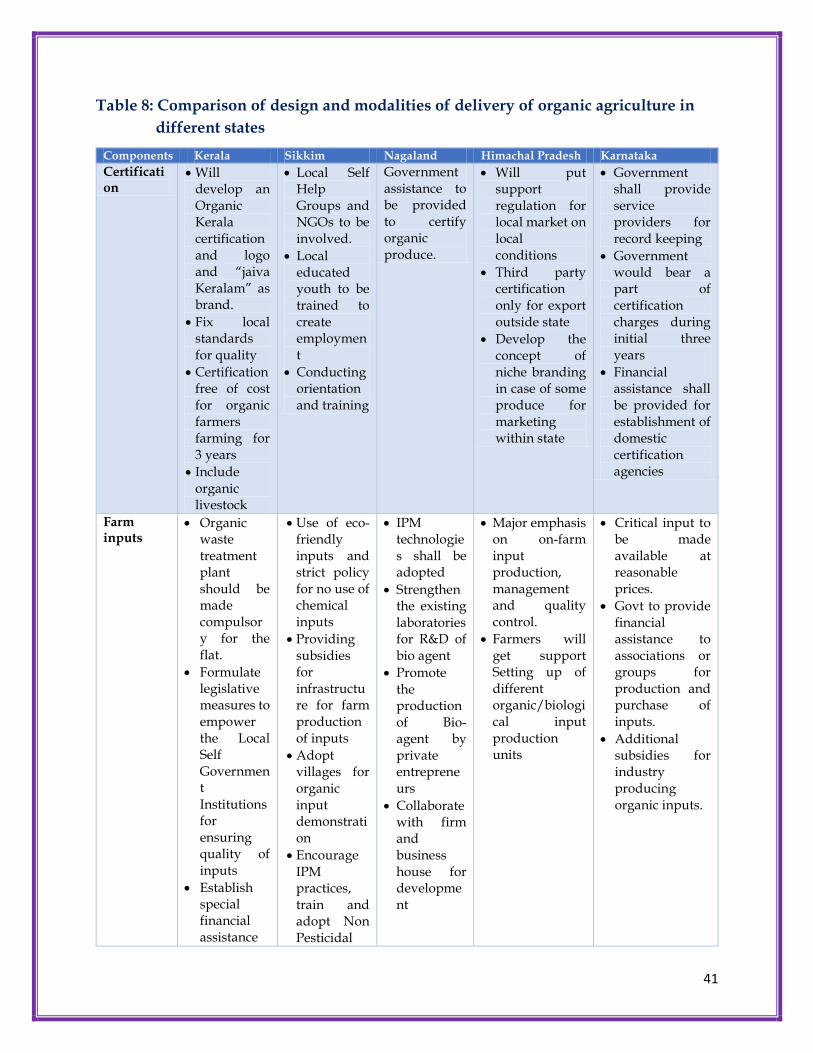
41
Table 8: Comparison of design and modalities of delivery of organic agriculture in
different states
Components Kerala Sikkim Nagaland Himachal Pradesh Karnataka
Certification
Will develop an Organic Kerala certification and logo and “jaiva Keralam” as brand.
Fix local standards for quality
Certification free of cost for organic farmers farming for 3 years
Include organic livestock
Local Self Help Groups and NGOs to be involved.
Local educated youth to be trained to create employment
Conducting orientation and training
Government assistance to be provided to certify organic produce.
Will put support regulation for local market on local conditions
Third party certification only for export outside state
Develop the concept of niche branding in case of some produce for marketing within state
Government shall provide service providers for record keeping
Government would bear a part of certification charges during initial three years
Financial assistance shall be provided for establishment of domestic certification agencies
Farm inputs
Organic waste treatment plant should be made compulsory for the flat.
Formulate legislative measures to empower the Local Self Government Institutions for ensuring quality of inputs
Establish special financial assistance
Use of eco-friendly inputs and strict policy for no use of chemical inputs
Providing subsidies for infrastructure for farm production of inputs
Adopt villages for organic input demonstration
Encourage IPM practices, train and adopt Non Pesticidal
IPM technologies shall be adopted
Strengthen the existing laboratories for R&D of bio agent
Promote the production of Bio-agent by private entrepreneurs
Collaborate with firm and business house for development
Major emphasis on on-farm input production, management and quality control.
Farmers will get support Setting up of different organic/biological input production units
Critical input to be made available at reasonable prices.
Govt to provide financial assistance to associations or groups for production and purchase of inputs.
Additional subsidies for industry producing organic inputs.

42
schemes and/or link existing scheme.
Pest Management
Awareness and training
The model of kudumbasree would be designated as “Karshaka Sevakar”
Develop the existing Agro-clinics of the department into organic farming resource centres
Educating school children on basic concept of organic farming by including in the course curriculum
Integrate the various government departments, institutions, civil societies, and their schemes in a harmonious manner duly considering organic farming principles and local situation
Extensive programme to educate and create awareness campaigns.
Organic farming system to be incorporated into the syllabi of the school education.
Awareness through print and electronic media.
Model organic farms of the farmers as training centres
Creating cadre of farmers trainers
Extension training programmes
Separate training shall be arranged especially for women.
Educational tour would be arranged for both departmental officers and farmers.
Farmers who excel in organic farming would be identified and awarded
Marketing Set up separate markets for organic produce certified by PGS process.
Disallow large private retail corporations through suitable legislation
Encourage existing
The entire organic product should be given brand name with “Sikkim Organic” logo.
Cold storages and refrigerated van facilities should be created.
Separate cell for
State government shall facilitates Marketing Process of the surplus organic products through the APMC
Involvement of private enterprises will be accorded the highest priority.
Set up retail organic stores in the market centres across the state
Encouraging private parties to set up private markets.
Setting up of the COMMON FACILITY CENTRES at focal points would be considered to facilitate
Separate space with requisite storage facilities would be created exclusively.
Transport of produce from point of production to customers will be subsidised.
Organise periodic organic produce melas/exhibition at cities/towns.
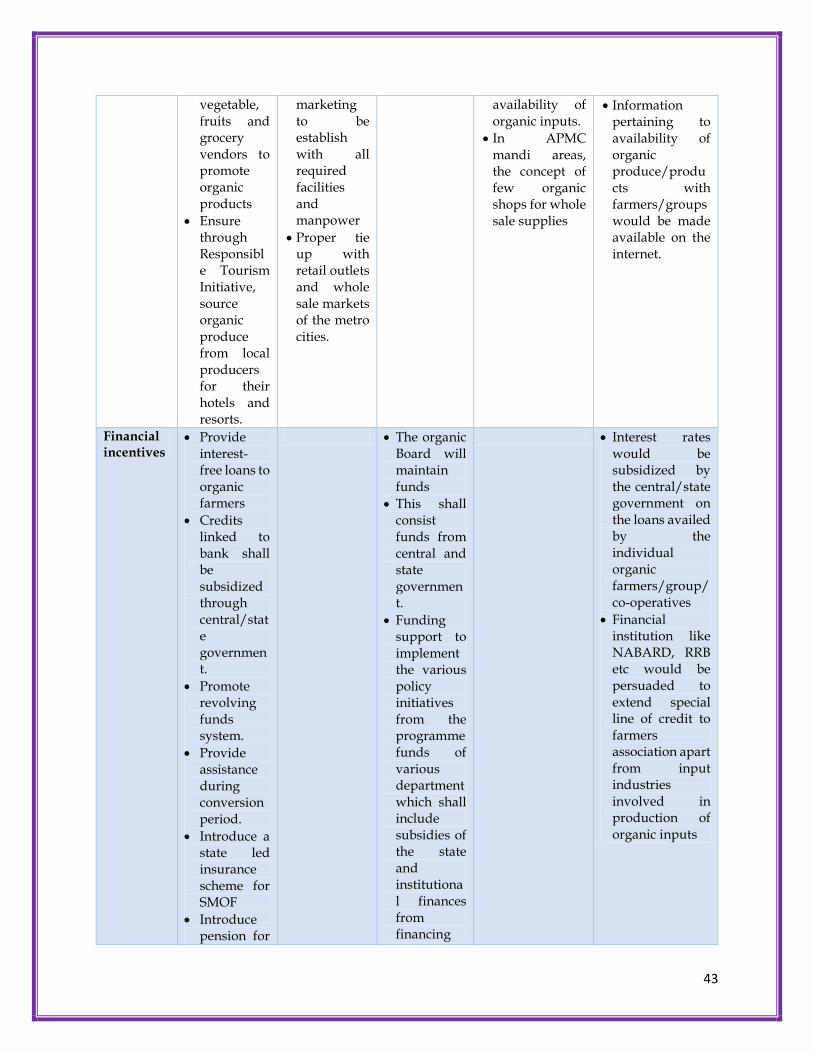
43
vegetable, fruits and grocery vendors to promote organic products
Ensure through Responsible Tourism Initiative, source organic produce from local producers for their hotels and resorts.
marketing to be establish with all required facilities and manpower
Proper tie up with retail outlets and whole sale markets of the metro cities.
availability of organic inputs.
In APMC mandi areas, the concept of few organic shops for whole sale supplies
Information pertaining to availability of organic produce/products with farmers/groups would be made available on the internet.
Financial incentives
Provide interest-free loans to organic farmers
Credits linked to bank shall be subsidized through central/state government.
Promote revolving funds system.
Provide assistance during conversion period.
Introduce a state led insurance scheme for SMOF
Introduce pension for
The organic Board will maintain funds
This shall consist funds from central and state government.
Funding support to implement the various policy initiatives from the programme funds of various department which shall include subsidies of the state and institutional finances from financing
Interest rates would be subsidized by the central/state government on the loans availed by the individual organic farmers/group/co-operatives
Financial institution like NABARD, RRB etc would be persuaded to extend special line of credit to farmers association apart from input industries involved in production of organic inputs
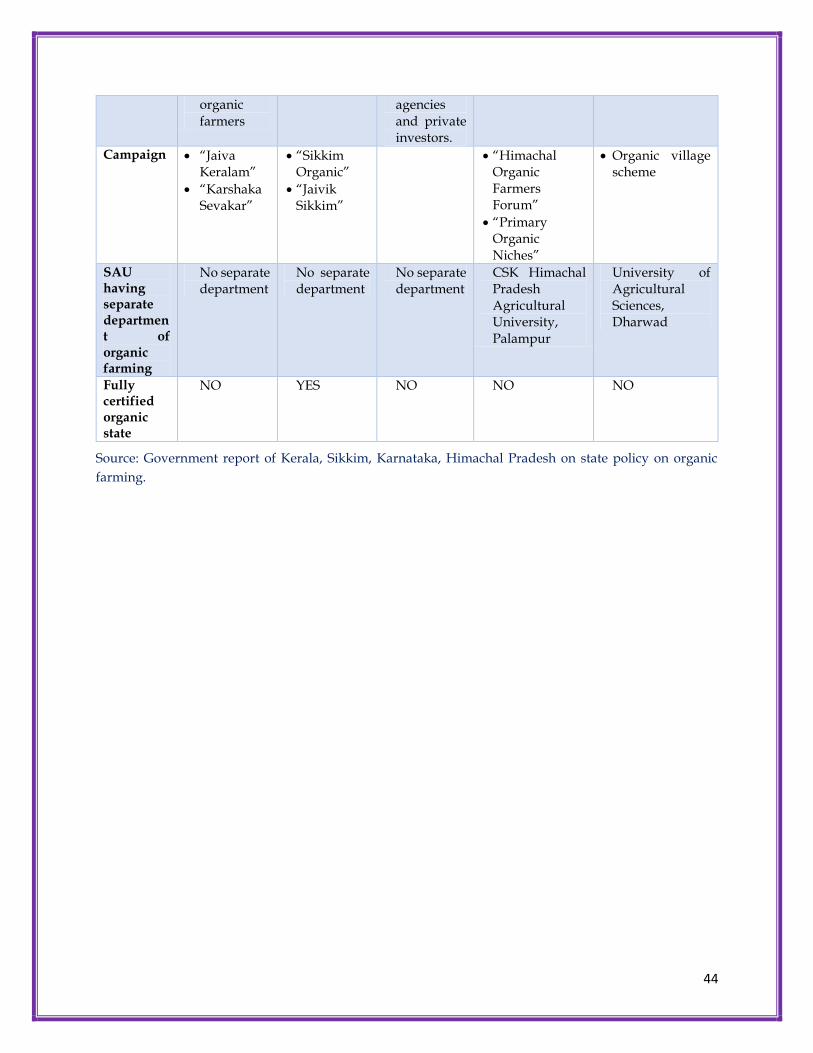
44
organic farmers
agencies and private investors.
Campaign “Jaiva Keralam”
“Karshaka Sevakar”
“Sikkim Organic”
“Jaivik Sikkim”
“Himachal Organic Farmers Forum”
“Primary Organic Niches”
Organic village scheme
SAU having separate department of organic farming
No separate department
No separate department
No separate department
CSK Himachal Pradesh Agricultural University, Palampur
University of Agricultural Sciences, Dharwad
Fully certified organic state
NO YES NO NO NO
Source: Government report of Kerala, Sikkim, Karnataka, Himachal Pradesh on state policy on organic
farming.

45
Table 9: Review of similar Case Studies in organic agriculture (India and abroad):
Reference Context Methodology Analysis
Organic Agriculture In India And Participatory Guarantee Systems (Pgs): A Case Study From West Bengal
Joe K. W. Hill West Bengal ,India
This study is based on the qualitative research strategy. It was conducted independently and in a limited time period. SEVA’s projects were selected from IFOAM database through PGS groups registered with PGSOC. . It is based on the case study from West Bengal, where the NGO SEVA has worked in organic agriculture since 1991, supporting PGS group since 2005.
Semi-structured interview were conducted with current and former farmers staff at Vikas Kendra, SEVA’s project and with various organic farmers. Sellers and several consumers were also interviewed. Data collected from NGO’s were analyzed
In this study, they have given an overview of organic agriculture, its marketing and certification with a focus on Participatory Guarantee System (PGS). It is based on the case study from West Bengal, where the NGO SEVA has worked in organic agriculture since 1991, supporting PGS group since 2005.
The results were divided into four sections. First, SEVA’s organic experience, they set up 53 PGS group and then further each was divided into 2 peer groups to check organic cultivation and certification. After this no. of farmers supported by SEVA were increased making SEVA’s initiative a success. Second, farmer’s view on PGS, for them it is a success, as it helps them to sell their produce beyond local markets. Also the farmers related to this have developed various skills. Third, the NGO’s experience with PGS, earlier there was no support from the state government, only in 2015 the central govt. launched PKVY under which new PGS groups of JVES and SEVA each has 50 farmers, as they are too big and facing problems they are unable to maintain PGS system properly. Fourth, urban consumer’s views of the organic produce, they found organic produce tastier and easier to cook, also they don’t want to eat chemicals.
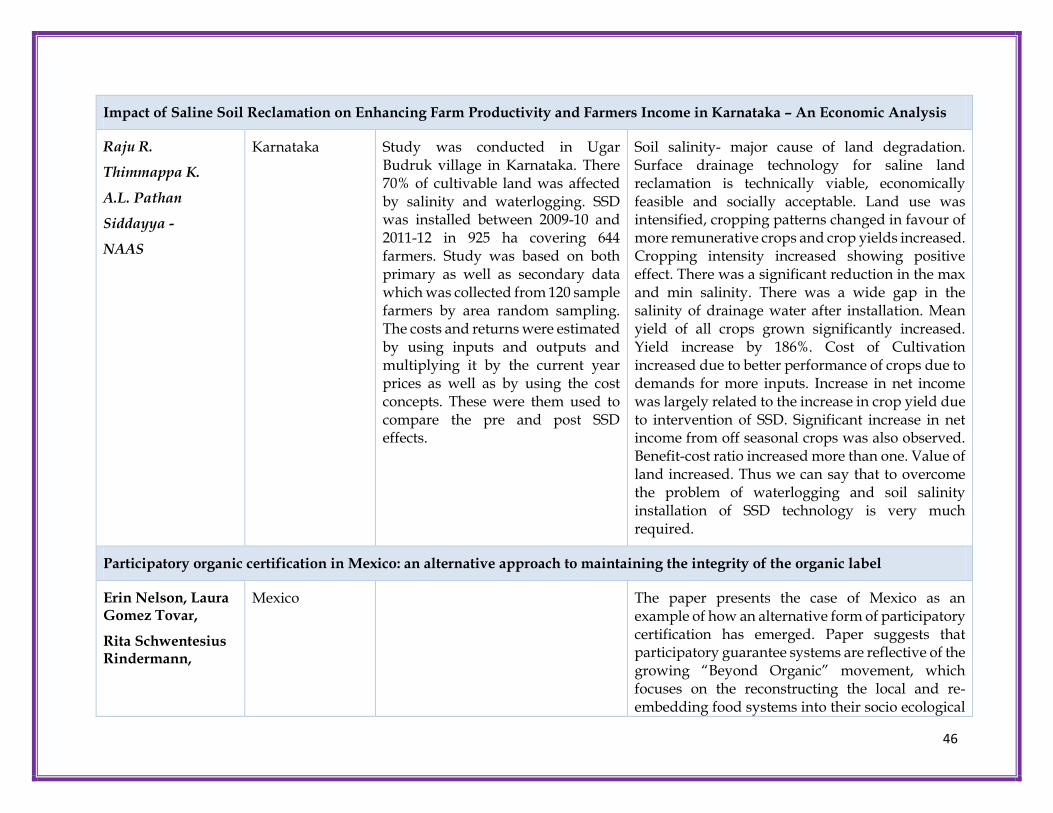
46
Impact of Saline Soil Reclamation on Enhancing Farm Productivity and Farmers Income in Karnataka – An Economic Analysis
Raju R.
Thimmappa K.
A.L. Pathan
Siddayya -
NAAS
Karnataka Study was conducted in Ugar Budruk village in Karnataka. There 70% of cultivable land was affected by salinity and waterlogging. SSD was installed between 2009-10 and 2011-12 in 925 ha covering 644 farmers. Study was based on both primary as well as secondary data which was collected from 120 sample farmers by area random sampling. The costs and returns were estimated by using inputs and outputs and multiplying it by the current year prices as well as by using the cost concepts. These were them used to compare the pre and post SSD effects.
Soil salinity- major cause of land degradation. Surface drainage technology for saline land reclamation is technically viable, economically feasible and socially acceptable. Land use was intensified, cropping patterns changed in favour of more remunerative crops and crop yields increased. Cropping intensity increased showing positive effect. There was a significant reduction in the max and min salinity. There was a wide gap in the salinity of drainage water after installation. Mean yield of all crops grown significantly increased. Yield increase by 186%. Cost of Cultivation increased due to better performance of crops due to demands for more inputs. Increase in net income was largely related to the increase in crop yield due to intervention of SSD. Significant increase in net income from off seasonal crops was also observed. Benefit-cost ratio increased more than one. Value of land increased. Thus we can say that to overcome the problem of waterlogging and soil salinity installation of SSD technology is very much required.
Participatory organic certification in Mexico: an alternative approach to maintaining the integrity of the organic label
Erin Nelson, Laura Gomez Tovar,
Rita Schwentesius Rindermann,
Mexico The paper presents the case of Mexico as an example of how an alternative form of participatory certification has emerged. Paper suggests that participatory guarantee systems are reflective of the growing “Beyond Organic” movement, which focuses on the reconstructing the local and re-embedding food systems into their socio ecological

47
Manuel Angel Gomez Cruz
Springer Science+Business Media B.V. 2009
contexts. PGS offers a no. of benefits for producers and consumers, but it faces challenges as well such as a lack of formal recognition, social and personal conflicts and dependence on donated resources. PGS encourages and relies on the active participation of stakeholders and are built on a foundation of trust, social networks and knowledge exchange. But PGS is not currently viable for the certified organic exports industry because this peer review of organic certification is not consistent with ISO standards. PGs seeks to bring an element of social justice into creation of sustainable food systems, for e.g., by seeking to increase local food security and by attempting to price local organic goods in manner that is fair to producers but nor entirely inaccessible to the consumers.

48
According to Joe K. will in his study about PGS certification he found that PGS has
provided an assurance system that helps small and marginal farmers for marketing their
organic produce with premium price. The study also highlights the PGS creates a link
between rural farmers and urban consumers.
Other paper from Nelson depicts that PGS emerged as alternative to third party
certification is working as participatory guarantee systems (PGS) are reflective of the
growing “beyond organic” movement, which focuses on reconstructing the local and re-
embedding food systems into their socio-ecological contexts. It argues that PGS offers a
number of benefits for producers and consumers, particularly in the South, but that it
faces a number of challenges as well, such as a lack of formal recognition, social conflicts
and dependence on donated resource.
4.6 Governance issues of Organic Farming across different countries
Currently there are 73 countries with organic standards and 16 countries in the progress
of drafting legislations. There are 488 certification bodies existing across the globe and
most of the certification bodies are in European Union, United States, Japan, South Korea,
China, Canada, and Brazil. With regard to standards and regulations there were major
developments with new EU regulation, Canadian organic standard and implementation
of Australian domestic organic standards. In 2009, FAO, IFOAM and UNCTAD started
the Global Organic Market Access.
Table 10: Issues related to food markets
India China USA Australia France Germany
Consumer protection P P P A P P
Consumer demand P P P P P
Domestic Market P P P P P
Foreign Market Access P P P P P
Note: P = Present, A= Absent
The coverage of regulations on organic agriculture and food are quite similar among all
countries. Above table shows except Australia all others countries have focus on
consumer protection policies. Also all countries have organic domestic and foreign
market regulations in place. The protection of consumers from false claims is the most
frequently quoted motivation for organic regulations. In Australia except for exported

49
production government doesn’t have any dedicated framework. Domestic markets here
are regulated through Consumer law.
Table 11: Benefits of Organic Agriculture and Food
India China USA Australia France Germany
Environmental benefits
P P P P P
Animal welfare P P P P P
Consumer health P P P P
Employment P P P
Note: P = Present, A= Absent
All the countries have proven studies showing organic food have benefits with regard to
environmental benefits, consumer health and employment. In case of Canada whose
government is neutral regarding the benefits of organic farming.
Table 12: Coverage of Organic Agriculture Regulations
Production rules for organic agriculture
India China USA Australia France Germany
Domestic market R R NR R R
Exported production HR R R R R R
Crops and livestock R R R R R
Aqua-culture NR R R R
Processing of organic food
R R R R R
Processing of organic feed
R R R R
Packaging, Storing, transport
R HR R R R
Labelling of organic products
R R HR R HR HR
Control, inspection, certification
R R HR R HR HR
Imported feed and foodstuff
R R R HR HR HR
Export compliance HR R HR R R
Note: HR= Highly Regulated, R= Regulated, NR= Not regulated
The above data shows USA and Germany had highly regulated to regulated markets for
domestic, export markets and for processed foods. Europe and USA have well developed
domestic regulations in place and they have compressive organic legislations, and the
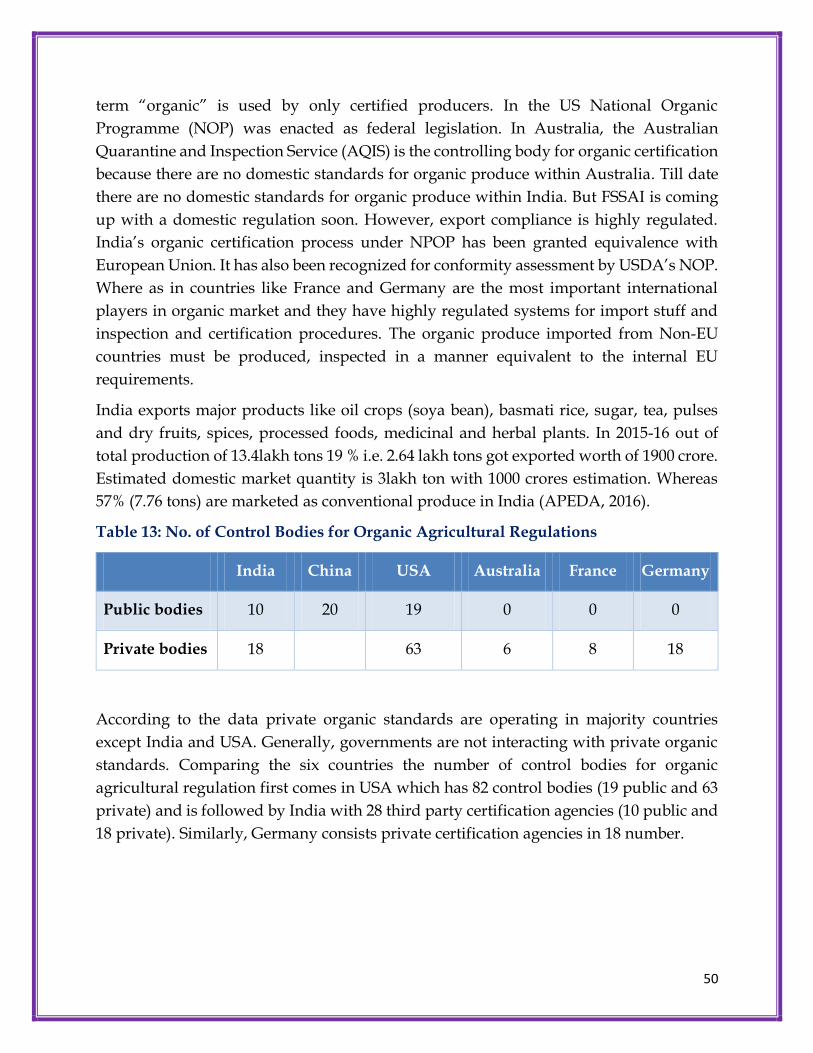
50
term “organic” is used by only certified producers. In the US National Organic
Programme (NOP) was enacted as federal legislation. In Australia, the Australian
Quarantine and Inspection Service (AQIS) is the controlling body for organic certification
because there are no domestic standards for organic produce within Australia. Till date
there are no domestic standards for organic produce within India. But FSSAI is coming
up with a domestic regulation soon. However, export compliance is highly regulated.
India’s organic certification process under NPOP has been granted equivalence with
European Union. It has also been recognized for conformity assessment by USDA’s NOP.
Where as in countries like France and Germany are the most important international
players in organic market and they have highly regulated systems for import stuff and
inspection and certification procedures. The organic produce imported from Non-EU
countries must be produced, inspected in a manner equivalent to the internal EU
requirements.
India exports major products like oil crops (soya bean), basmati rice, sugar, tea, pulses
and dry fruits, spices, processed foods, medicinal and herbal plants. In 2015-16 out of
total production of 13.4lakh tons 19 % i.e. 2.64 lakh tons got exported worth of 1900 crore.
Estimated domestic market quantity is 3lakh ton with 1000 crores estimation. Whereas
57% (7.76 tons) are marketed as conventional produce in India (APEDA, 2016).
Table 13: No. of Control Bodies for Organic Agricultural Regulations
India China USA Australia France Germany
Public bodies 10 20 19 0 0 0
Private bodies 18 63 6 8 18
According to the data private organic standards are operating in majority countries
except India and USA. Generally, governments are not interacting with private organic
standards. Comparing the six countries the number of control bodies for organic
agricultural regulation first comes in USA which has 82 control bodies (19 public and 63
private) and is followed by India with 28 third party certification agencies (10 public and
18 private). Similarly, Germany consists private certification agencies in 18 number.
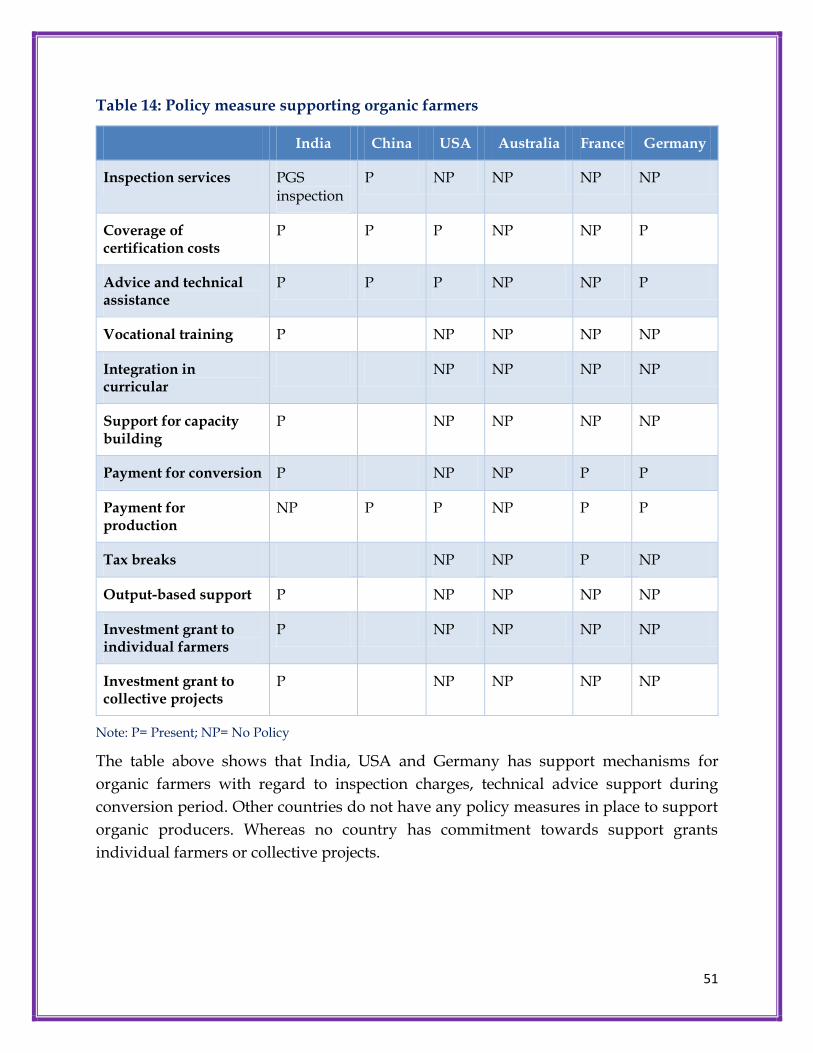
51
Table 14: Policy measure supporting organic farmers
India China USA Australia France Germany
Inspection services PGS inspection
P NP NP NP NP
Coverage of certification costs
P P P NP NP P
Advice and technical assistance
P P P NP NP P
Vocational training P NP NP NP NP
Integration in curricular
NP NP NP NP
Support for capacity building
P NP NP NP NP
Payment for conversion P NP NP P P
Payment for production
NP P P NP P P
Tax breaks NP NP P NP
Output-based support P NP NP NP NP
Investment grant to individual farmers
P NP NP NP NP
Investment grant to collective projects
P NP NP NP NP
Note: P= Present; NP= No Policy
The table above shows that India, USA and Germany has support mechanisms for
organic farmers with regard to inspection charges, technical advice support during
conversion period. Other countries do not have any policy measures in place to support
organic producers. Whereas no country has commitment towards support grants
individual farmers or collective projects.

52
Table 15: Policy measures supporting Organic Food Marketing Channels
India China USA Australia France Germany
Public procurement NP NP NP P NP
Investments grants P P NP NP NP NP
Support for new sales structure
NP NP NP NP NP
Support for organic food marketing initiatives
PKVY NP NP NP NP
Support for organic fairs
P NP NP NP NP
Note: P = Present; NP = Not Present
With regard to food marketing channels except France no other country has a strategy
for public procurement process and support of organic sales. Organic food market
initiatives has seen only in India through PKVY and promotion of organic fairs in India
to some extent. All other countries governments have no role in organic market channels
and organic fairs promotion.
Table 16. Other measures supporting the growth of the organic sector
India China USA Australia France Germany
Information and promotion campaign
P P NP P NP
Public education P P NP NP P
Support to research projects
NP P (Extensive research)
NP NP NP P
Provision of sector information
NP WP P NP P P
Note: P=Present, NP=Not Present, WP=Weakly Present
Source*:compiled by the studies of various authors: Sylvian Rousset, Koen Deconinck, Hyunchul Jeong,
and Martin von Lampe., EU china Trade reports, Willer, H. and Kilcher, L. (Eds.), APEDA
53
One of the major bottlenecks highlighted by various studies was a lack of large scale
systematic research on organic farming due to absence of dedicated institutions and
shortage of adequately trained human institutions. Above table depicts that only USA
and Germany governments are promoting organic research project
India as an emerging country has started awareness campaigns on organic farming to
farmers and other stakeholders through different policy instruments like organic policies
and establishing certification standards. But there is lack of focus on research projects.

54
Chapter – V
Implementation and Modalities of Delivery
5.1 Programme implementation
A. Groups of farmers would be motivated to take up organic farming under
Paramparagat Krishi Vikas Yojana (PKVY).
B. Fifty or more farmers will form a cluster having 50 acre land to take up the organic
farming under the scheme. In this way during three years 10,000 clusters will be
formed covering 5.0 lakh acre area under organic farming.
C. There will be no liability on the farmers for expenditure on certification.
D. Every farmer will be provided Rs. 20,000 per acre in three years for seed to
harvesting of crops and to transport produce to the market.
E. Organic farming will be promoted by using traditional resources and the organic
products will be linked with the market.
F. It will increase domestic production and certification of organic produce by
involving farmers.
Fig: 16 Programme implementation (Pictorial Representation)
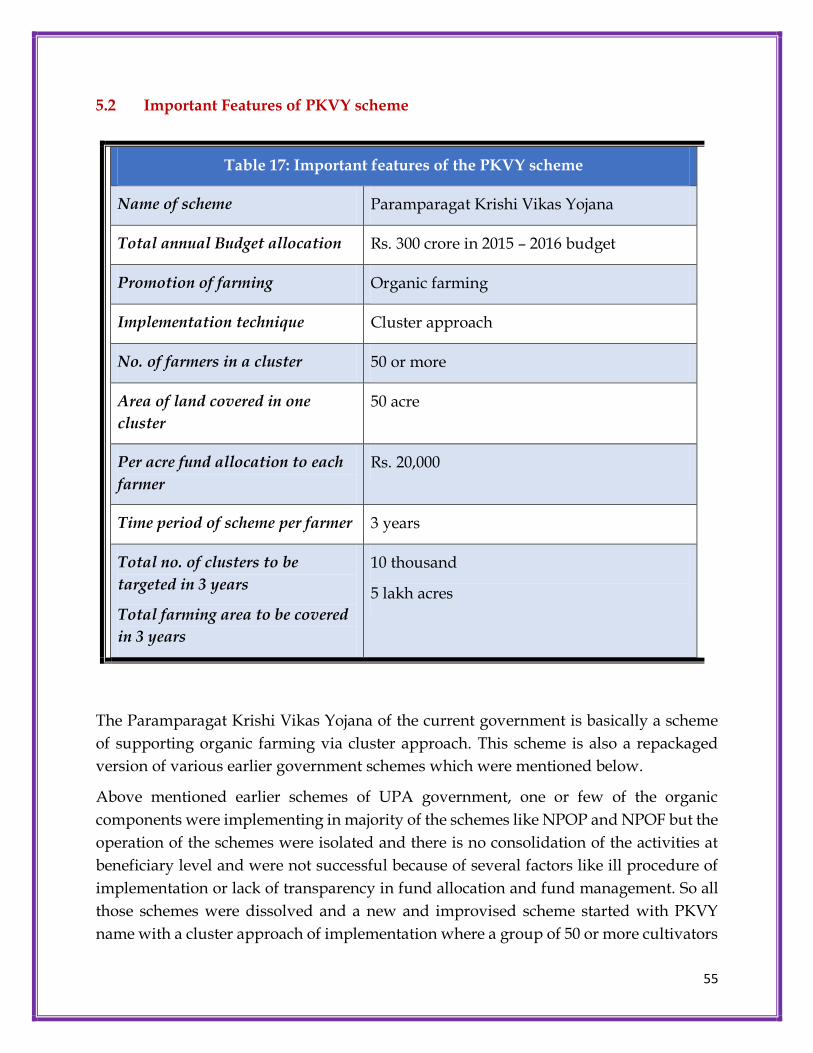
55
5.2 Important Features of PKVY scheme
Table 17: Important features of the PKVY scheme
Name of scheme Paramparagat Krishi Vikas Yojana
Total annual Budget allocation Rs. 300 crore in 2015 – 2016 budget
Promotion of farming Organic farming
Implementation technique Cluster approach
No. of farmers in a cluster 50 or more
Area of land covered in one
cluster
50 acre
Per acre fund allocation to each
farmer
Rs. 20,000
Time period of scheme per farmer 3 years
Total no. of clusters to be
targeted in 3 years
Total farming area to be covered
in 3 years
10 thousand
5 lakh acres
The Paramparagat Krishi Vikas Yojana of the current government is basically a scheme
of supporting organic farming via cluster approach. This scheme is also a repackaged
version of various earlier government schemes which were mentioned below.
Above mentioned earlier schemes of UPA government, one or few of the organic
components were implementing in majority of the schemes like NPOP and NPOF but the
operation of the schemes were isolated and there is no consolidation of the activities at
beneficiary level and were not successful because of several factors like ill procedure of
implementation or lack of transparency in fund allocation and fund management. So all
those schemes were dissolved and a new and improvised scheme started with PKVY
name with a cluster approach of implementation where a group of 50 or more cultivators

56
will work together in a specified piece of land, for a period of three years. PKVY is
exclusively framed for holistic promotion of Organic farming from seed to certification
and marketing.
Several organic techniques will be implemented in the PKVY farming scheme. These
methods of farming will not include the use of harmful pesticides or fertilizers at all.
Cropping techniques like promoting an organic nursery to develop organic seeds will be
implemented. Apart from this, development and production of bio – fertilizers, bio –
pesticides and other organic manures will be done. These will add to the production yield
as they are rich in manures and they are also good for health. Organic manure
management will be performed in the clusters of the PKVY.
Under the scheme, the farmers will also be assisted how to market the organic products
from their cluster farms. Branding and labelling of the organic products will be done
which will prove the authenticity of the organic materials. Proper certification of the
organic products will be done. Transportation assistance to the farmers will be given
under this scheme.
Budget allocation, release and expenditure
The funding pattern for PKVY is given in the table below. Centre share is 90% for union
territories and North-East, but only 60% for the plains states.
States: Central : State
All Plain states 60 :40
NE and Hill states 90:10
Union territories 90:10
Allocations to PKVY over the last three years were decreased. It is also to be noted that
in most of the states and all-India also only 50 to 60% of the allocated funds were released.
Out of the released amount about 60 to 70% is utilized by the states. It indicates that there
was a need to reduce gap between allocation, release and expenditure across states.
Among states Nagaland, Karnataka and Tamil Nadu are better in fund utilization.

57
Given that the 1st year expenses under PGS certification are Rs.7, 06,950 per each cluster,
to cover expenses for 5859 clusters, the total expenses should be near about Rs.410 crore.
Even though budget estimate for 2017-18 is in line with the requirements, 2016-17 (RE)
are just Rs.120 crore, indicating under spending on the programme.
33763
22620
18690
23823
15219
6421
13835
5553
0
5000
10000
15000
20000
25000
30000
35000
40000
Allocation Release Expenditure
Fig. 17: Budget allocation, release and expenditure (Rs.lakh) (PKVY)
2015-16 2016-17 2017-18
219
297
120
350
0
50
100
150
200
250
300
350
400
2015-16(AE) 2016-17(BE) 2016-17(RE) 2017-18(BE)
Fig. 18: Budget Estimates and Revised Estimates

58
5.3 Budget Allocation of PKVY Table: 18 Details of the State-wise fund allocated, Release and Expenditure under PKVY during 2015-16 to 2017-18
2015-16 (Rs in lakh) 1 st year 2016-17 (Rs in lakh) 2nd year 2017-18 (Rs in lakh) 3rd year S. No
Name of the State No of Cluster
Allocation Release as % of allocation
Expenditure as % of release
Allocation Release as % of allocation
Expenditure as % of release
Allocation Release as % of allocation
Expenditure
1 Andhra Pradesh 433 1854 59 100 1309 61 100 760 0 0
2 Bihar 327 1400 75 0 988 67 0 574 0 0
3 Chhattisgarh 188 805 75 41 568 55 100 330 0 0
4 Gujarat 100 428 42 0 302 79 7 175 0 0
5 Goa 4 17 41 0 12 0 0 7 0 0
6 Haryana 20 86 63 0 60 77 0 35 0 0
7 Jharkhand 100 428 75 55 302 67 0 175 0 0
8 Karnataka 545 2334 83 100 1647 49 96 956 114 0
9 Kerala 119 510 75 93 360 0 0 209 0 0
10 Madhya Pradesh 880 3769 75 100 2659 67 29 1544 0 0
11 Maharashtra 932 3992 65 100 2816 105 0 1636 0 0
12 Odisha 320 1371 75 100 967 67 100 562 109 0
13 Punjab 50 214 75 100 151 0 0 88 0 0
14 Rajasthan 755 3234 73 88 2282 65 40 1325 0 0
15 Tamil Nadu 112 480 83 74 338 61 0 197 0 0
16 Telangana 300 1285 83 0 907 50 0 526 0 0
17 Uttar Pradesh 575 2463 83 98 1738 73 32 1009 0 0
18 West Bengal 120 514 42 100 363 109 69 211 0 0
19 Assam 220 1413 41 97 997 0 0 579 0 0
20 Arunachal Pradesh 19 122 42 100 86 94 100 50 190 0
21 Mizoram 34 218 41 100 154 90 0 90 0 0
22 Manipur 30 193 55 0 136 0 0 79 0 0
23 Nagaland 24 154 100 100 109 0 0 63 205 0
24 Sikkim 150 964 42 49 680 0 0 395 0 0
25 Tripura 50 321 42 100 227 136 100 132 125 0
26 Meghalaya 45 289 50 100 204 145 0 118 0 0
27 Himachal Pradesh 110 707 56 87 499 0 0 290 275 0
28 Jammu and Kashmir 28 180 42 100 127 69 31 74 0 0
29 Uttarakhand 550 3533 56 97 2493 81 81 1448 184 0
30 Andaman & Nicobar 68 485 27 0 342 0 0 199 0 0
31 Other admin. charges 0 0 0 0 0 0 0 0
Total 7208 33763 67 83 23823 64 42 13835 40 0
Source : Compiled from different reports sent by states

59
Budget allocations was made based on the proposals made for number of clusters in
concerned states. An amount of Rs.33763 lakhs were allocated for 29 states. Releases were
invariably made to the (nearly 70- 85%) allocations in majority states. Nagaland has
received 100 percent allocated budget to implement the project in 24 clusters.
Surprisingly except Nagaland for all other north-eastern states only half of the allocated
budget was released for 2015-16. Overall utilization was good. However, in some states
(Bihar, Goa, Gujarat, Haryana, Telangana, Manipur, Andaman and Nicobar) utilization
was zero despite having its entitlements of funds under the scheme.
During the year 2016-17, in some states like Goa, Kerala, Punjab, Assam, Manipur,
Nagaland and Sikkim were no releases were made and utilization in 2016-17 seems very
poor in majority of the states compared to 2015-16. However, states like Bihar, goa,
Haryana, Telangana and Manipur irrespective of allocations and releases the expenditure
is nil in both the years. Contrary to this states like Andhra Pradesh, Chhattisgarh, Odisha,
Arunachal Pradesh, Tripura has utilized 100 percent of allocated funds. The interaction
with some of the officials say that the delay is one of the reasons for underutilization of
funds. Both years together Tripura, Odisha, Karnataka utilized the amount reasonably
and rest of the states were not even utilizing 50% of released funds. Similarly, for 2018-
19, total amount of 13834.6 lakhs were allotted for the year and 5553.1 Lakhs across 6
states were released till date.
Total of Rs. 71420.65 lakhs were allocated for the 3 years period. Maharashtra being the
first with highest budget allocation of Rs.8443 lakhs for 932 clusters and followed by
Madhya Pradesh Rs.7972 lakhs for implementing in 880 clusters followed by
Uttarakhand and Rajasthan.
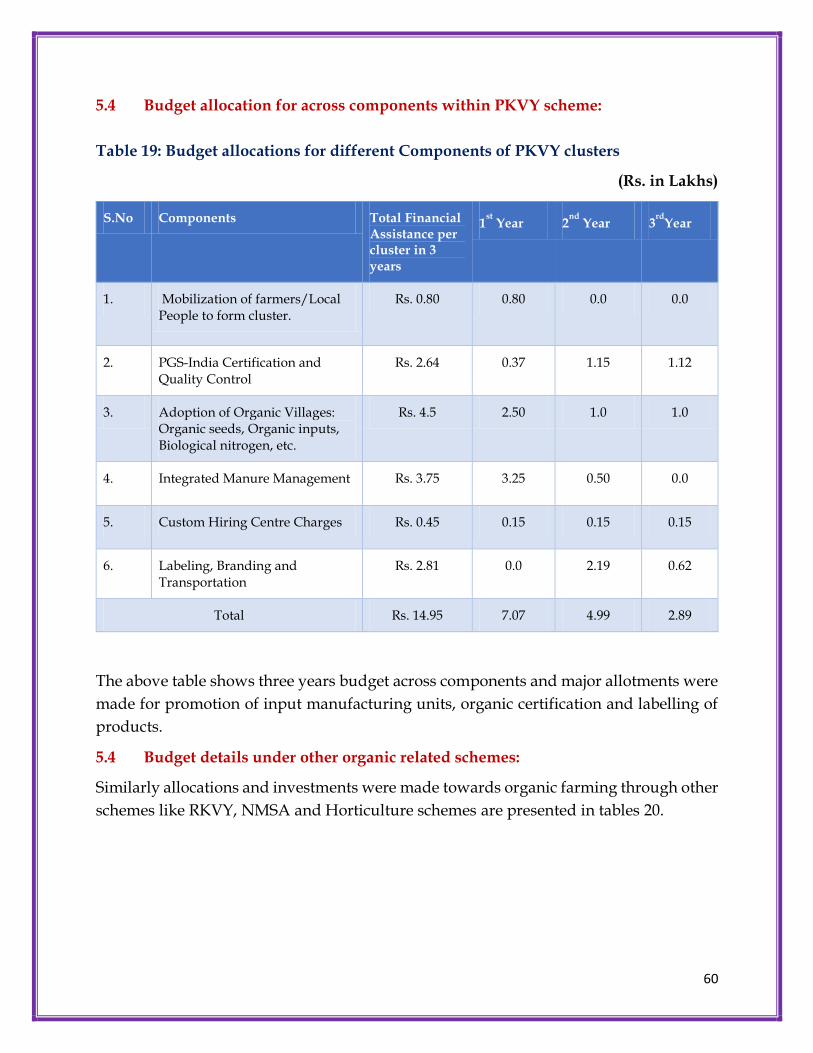
60
5.4 Budget allocation for across components within PKVY scheme:
Table 19: Budget allocations for different Components of PKVY clusters
(Rs. in Lakhs)
S.No Components Total Financial Assistance per cluster in 3 years
1st
Year 2nd
Year 3rd
Year
1. Mobilization of farmers/Local People to form cluster.
Rs. 0.80 0.80 0.0 0.0
2. PGS-India Certification and Quality Control
Rs. 2.64 0.37 1.15 1.12
3. Adoption of Organic Villages: Organic seeds, Organic inputs, Biological nitrogen, etc.
Rs. 4.5 2.50 1.0 1.0
4. Integrated Manure Management Rs. 3.75 3.25 0.50 0.0
5. Custom Hiring Centre Charges Rs. 0.45 0.15 0.15 0.15
6. Labeling, Branding and Transportation
Rs. 2.81 0.0 2.19 0.62
Total Rs. 14.95 7.07 4.99 2.89
The above table shows three years budget across components and major allotments were
made for promotion of input manufacturing units, organic certification and labelling of
products.
5.4 Budget details under other organic related schemes:
Similarly allocations and investments were made towards organic farming through other
schemes like RKVY, NMSA and Horticulture schemes are presented in tables 20.

61
Table 20: State-wise Funds Released for Promotion of Organic Farming under Rashtriya
Krishi Rashtriya Krishi Vikas Yojana (RKVY) in crores
State 2011-12 2012-13 2013-14 2014-15 Total 2012-15
Gujarat 108.2 11.6 22.6 142.3
Uttar Pradesh 16.6 28.2 95 139.8
Bihar 101.1 101.1
Karnataka 33 21 14.4 12.5 80.9
Uttarakhand 13.3 9.4 19.4 13.9 56.1
Assam 9 11.6 11.7 11 43.3
Andhra Pradesh 15 16 9.5 40.5
Himachal Pradesh 10.1 10.5 7.5 8 36.1
Madhya Pradesh 4.4 5.7 3 13.1
Rajasthan 3.7 0.7 4.8 9.1
Maharashtra 4.9 3.1 8
Jammu and Kashmir 0.8 2.4 1.6 3 7.8
Manipur 2.8 0.8 0.3 3.7 7.5
Haryana 1.5 3.4 2 6.9
Tamil Nadu 6.6 6.6
Nagaland 1.5 3 0.6 1 6.1
West Bengal 6.1 6.1
Jharkhand 1.6 4 5.6
Telangana 5 5
Kerala 1.2 1.4 1.4 4.1
Sikkim 2.5 1.2 3.7
Arunachal Pradesh 3 3
Chhattisgarh 1.3 1.3
Goa 0.2 0.2
Mizoram 0.1 0.1
Meghalaya 0
Odisha 0
Punjab 0
Tripura 0
India 311.3 145.6 200.5 76.8 734.2

62
Table 21: National Mission for Sustainable Agriculture
States/UTs NMSA (CISS)* (Rs. in Lakh)
2011-12 2012-13 2013-14 2014-15
Andaman and Nicobar Islands
Andhra Pradesh 20 20 14
Telangana
Arunachal Pradesh
Assam 22 1 35
Bihar 5
Chhattisgarh
Goa
Gujarat 2 40 37
Haryana
Himachal Pradesh 12
Jammu and Kashmir 77
Jharkhand
Karnataka 124
Kerala 7
Madhya Pradesh 0 2
Maharashtra 43 23 11
Manipur
Meghalaya
Mizoram
Nagaland
Odisha
Punjab 14 19 105
Rajasthan 21 471
Sikkim
Tamil Nadu 98
Tripura 20
Uttar Pradesh 3
Uttarakhand
West Bengal 79
India 156 48 341 780

63
Table 22: Mission for Integrated Development of Horticulture
States/UTs MIDH (NHM and HMNEH) (Rs. in Lakh)
2011-12 2012-13 2013-14 2014-15
Andaman and Nicobar Islands 5
Andhra Pradesh 417 13 47
Telangana 6
Arunachal Pradesh 123 170 132 50
Assam 36 74 200 80
Bihar 6 85 43
Chhattisgarh 1463 150 128
Goa 3 3 5
Gujarat 64 28 21
Haryana 37 31 45
Himachal Pradesh 398 79 157 42
Jammu and Kashmir 117 145 0 138
Jharkhand 64 228 158
Karnataka 237 544 459
Kerala 217 89 51
Madhya Pradesh 29 132
Maharashtra
Manipur 110 260 70 33
Meghalaya 0 0 52 13
Mizoram 17 20 30
Nagaland 123 102 90 36
Odisha 77 425 760
Punjab 67 23 28
Rajasthan 49 102 98
Sikkim 493 266 166 50
Tamil Nadu 21 30 133
Tripura 79 52 73 67
Uttar Pradesh 73 39 23
Uttarakhand 54 40 55
West Bengal 98
India 4343 3123 3153 520
Abbr.: NMSA: National Mission for Sustainable Agriculture. MIDH: Mission for Integrated Development of Horticulture. RKVY: Rashtriya Krishi Vikas Yojana.
Note: *: Capital Investment Subsidy Scheme (CISS) through NABARD.
**: Cost of project approved by state Level Sanctioning Committee (SLSC).
#: Punjab & Haryana MIDH includes (NHM & HMNEH).
Source: Lok Sabha Unstarred Question No. 72, dated on 21.07.2015.

64
Chapter-VI
Impact of PKVY Scheme
Primary survey was conducted by selecting a representative sample of clusters from
fifteen states. The results were presented in this section. As mentioned in methodology
few states were selected among PKVY implementing states and data was collected at
state, district and cluster level.
Table 23: Details of Sampling
Zone No. of State No. of Districts
No. of Blocks
No. of Villages
No. clusters
Central 2 4 17 45 88
East 3 8 14 77 149
North 4 10 30 110 202
south 3 16 38 54 70
West 3 16 56 120 181
All 15 54 155 406 690
Since two years the project has been under implementation in all zones, sample data has
been taken up from clusters of all zones (Bihar, Chhattisgarh, Goa, Gujarat, Haryana,
Himachal Pradesh, Jharkhand, Karnataka, Kerala, Madhya Pradesh, Maharashtra,
Orissa, Punjab, Rajasthan and Tamil Nadu). Along with this Mizoram and Sikkim has
also chosen for survey in north eastern states (analysis report made separately for north
eastern states). According to the samples drawn from different zones data in above table
shows the implementation of PKVY is high in North zone with 202 clusters out of 690
clusters considered for study. Followed by West and East.
6.1 Farmers perceptions
Basic characteristics
Table 11 provides the details of the state zone wise area and farmers covered under PKVY
schemes. The data shows that the average area under cluster in East and North zone
followed by Central and West zone. Average number of farmers in each cluster were
more than above 50 in all zones. Percentage of registered members was high in south
zone and remaining zones also more than 80 per cent except in Central zone. With regard
to small farmers bringing into the scheme south zone covered 89 per cent Gujarat has
covered majority of small and marginal farmers within the scheme followed by Kerala.
Whereas in Rajasthan central zone though the number of farmers registration is quite
good, but the small farmers are were in negligible less number (12.628.7%).
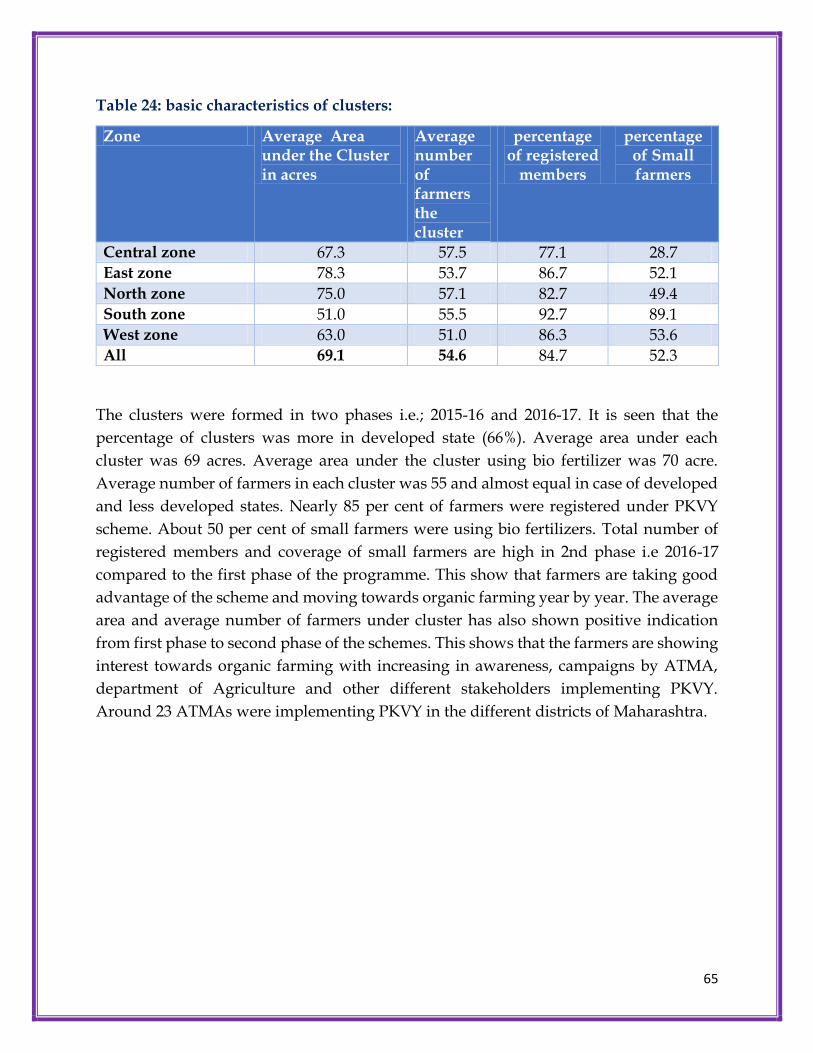
65
Table 24: basic characteristics of clusters:
Zone Average Area under the Cluster in acres
Average number of farmers the cluster
percentage of registered
members
percentage of Small farmers
Central zone 67.3 57.5 77.1 28.7
East zone 78.3 53.7 86.7 52.1
North zone 75.0 57.1 82.7 49.4
South zone 51.0 55.5 92.7 89.1
West zone 63.0 51.0 86.3 53.6
All 69.1 54.6 84.7 52.3
The clusters were formed in two phases i.e.; 2015-16 and 2016-17. It is seen that the
percentage of clusters was more in developed state (66%). Average area under each
cluster was 69 acres. Average area under the cluster using bio fertilizer was 70 acre.
Average number of farmers in each cluster was 55 and almost equal in case of developed
and less developed states. Nearly 85 per cent of farmers were registered under PKVY
scheme. About 50 per cent of small farmers were using bio fertilizers. Total number of
registered members and coverage of small farmers are high in 2nd phase i.e 2016-17
compared to the first phase of the programme. This show that farmers are taking good
advantage of the scheme and moving towards organic farming year by year. The average
area and average number of farmers under cluster has also shown positive indication
from first phase to second phase of the schemes. This shows that the farmers are showing
interest towards organic farming with increasing in awareness, campaigns by ATMA,
department of Agriculture and other different stakeholders implementing PKVY.
Around 23 ATMAs were implementing PKVY in the different districts of Maharashtra.

66
Table 25: Basic characteristics of clusters by different categories
Procedures followed for certification
Data from above table depicts that except few, majority of the clusters have prepared the
annual action plan and they even succeeded in execution of organic production in nearly
95 96 percent of clusters. With regard to appointment of technical staff and data entry
operators’ second new phase (2016-17) clusters are were achieved far progress than in
first phase. In all clusters wherever production has started in 95 per cent, but only 83 per
cent tried to bring under PGS certification process., and About 78 per cent clusters have
made efforts were made to establish packaging and labelling facilities. Totally 83 percent
clusters could achieve to bring the organic farms under PGS certification and about 80
percent of clusters could achieve in establishing marketing facilities. The responses
regarding continuing of organic farming in the future by farmers from clusters shows
encouraging results from second phase clusters i.e 97 whereas from first year data only
about half of the clusters has showed positive impressions.
Criteria Cluster Group
Percentage of clusters
Average Area under the Cluster in acres
Average number of farmers the cluster
percentage of
registered
members
percentage of
Small farmers
Year of Establishment
Old 41 66 57 81 41
New 59 71 53 87 61
Share of small farmers
Less 20 63 57 79 9
Medium 41 77 56 83 48
More 39 64 52 90 81
State category Developed 66 66 54 86 57
less developed
34 74 55 83 43
Number of farmers less 28 59 44 96 72
More 72 73 59 81 47
Bio-fertilizer Not used 18 67 55 88 65
Used 82 70 55 84 50
Regional Council Govt. 66 65 54 85 51
Non-Govt. 34 77 56 84 55
All 100 69 55 85 52

67
Table 26: Procedure under PKVY
% of clusters are saying yes
Criteria Cluster Group
annual action plan prepared
production under cluster started
PGS certified
Packaging and labelling facilities exist
Marketing facilities exists
Appointed consultant
Appointed data entry operator
Does the cluster has a certification process
Do you think more farmers will move towards organic methods
Year of Establishment
Old 94 94 85 76 81 74 74 13 49
New 98 95 82 79 81 86 92 39 98
Share of small farmers
Less 99 99 90 84 84 82 76 9 14
Medium 99 98 95 94 94 94 94 21 96
More 92 89 68 58 66 66 80 47 90
State category
Developed
95 93 77 70 75 77 85 33 83
less developed
100 100 95 94 92 89 85 21 68
Number of farmers
less 89 88 55 37 46 55 73 47 94
More 99 98 94 94 94 90 89 21 71
Bio-fertilizer Not used
94 90 87 80 84 83 85 79 87
Used 97 96 83 78 80 80 85 17 75
Regional Council
Govt. 95 93 77 69 73 74 81 31 68
Non-Govt
99 98 96 96 96 94 93 23 97
All 96 95 83 78 81 81 85 28 78
The data from the table shows that the number of clusters involved in production of the
bio inputs were very few when compared to execution of the PKVY scheme in total
number of clusters. Within this more clusters were into bio input production in the new
phase clusters. The percentage of bio input production were high in case of farmers using
bio fertilizers. Practices like use of organic seed, green manure and compost making were
high in number when compared to other products. Whereas practices like drip irrigation
is seen with very few clusters i. e 1.7 percent because of technology and financial
components involved in it.

68
Table 27: Pattern of production of inputs by cluster categories (in %)
Criteria Cluster Group 1 2 3 4 5 6 7 8 9 10 11 12
Year of Establishment Old 13.7 16.2 19.7 7.0 4.9 15.5 2.1 8.5 13.7 9.9 2.8 4.9
New 13.8 14.8 19.5 13.3 10.1 9.6 6.4 13.1 15.0 8.4 1.0 5.7
Share of small farmers Less 12.5 9.6 12.5 10.3 10.3 2.2 5.1 9.6 9.6 1.5 0.7 2.2
Medium 3.2 4.9 4.9 3.2 2.5 3.5 1.4 2.8 2.5 3.2 0.7 1.4
More 25.5 29.2 38.4 18.8 12.5 25.8 7.7 20.7 29.5 18.8 2.2 11.1
State category Developed 18.1 21.0 27.4 14.1 11.5 16.1 6.6 15.2 20.5 12.1 2.2 7.7
less developed 5.5 4.6 4.6 4.2 1.3 4.2 0.8 3.4 3.0 3.0 0.8 0.8
Number of farmers less 42.6 47.4 61.1 33.7 26.3 37.4 16.3 36.8 46.8 28.9 5.3 17.9
More 2.8 3.2 3.8 2.0 1.0 2.4 0.2 1.4 2.2 1.4 0.2 0.6
Bio-fertilizer Not used 10.5 5.6 12.9 1.6 2.4 8.1 1.6 2.4 12.1 4.0 0.0 4.0
Used 14.5 17.5 21.0 12.7 9.2 12.9 5.3 13.1 15.0 10.1 2.1 5.7
Regional Council Govt. 19.8 22.0 28.4 15.4 11.2 17.1 6.2 15.6 20.7 12.3 2.7 7.9
Non-Govt. 2.1 2.6 2.6 1.7 1.7 2.1 1.7 2.6 2.6 2.6 0.0 0.4
All 13.8 15.4 19.6 10.7 8.0 12.0 4.6 11.2 14.5 9.0 1.7 5.4
1= Organic seed, 2=Green manure, 3= Compost, 4= Bio fertilizer, 5= Fertilizers, 6= Bio pesticide, 7=
Pesticides, 8= Panchamruth, 9= Panchagavya, 10= Beejamruth, 11= Drip Irrigation, 12= Neem oil or neem
cake
The PKVY scheme is visioning to improve yields in sustainable way by integrating varied
practices which will help in conversion to organic farming from intensive chemical
farming which is in high demand in today’s society. The data from the table ** shows the
regular traditional practices like organic seed, green manure and compost making, were
easily accepted by the farmers and adoption is higher since from old phase. However, the
consumption of Fertilizers, Bio pesticide, Pesticides, Panchamruth, Panchagavya,
Beejamruth, Drip Irrigation and Neem oil or neem cake were reduced significantly.
About 99 per cent of organic seed, green manure and compost were used by clusters
managed by non-governmental agencies, whereas around 93 per cent of it were used by
clusters managed by government departments.

69
Table: 28 Pattern of use of inputs by different cluster categories (in %)
Criteria Cluster Group 1 2 3 4 5 6 7 8 9 10 11 12
Year of Establishment Old 93 95 98 92 65 32 10 11 15 11 9 16
New 94 97 98 75 30 18 1 5 13 17 11 8
Share of small farmers
Less 99 99 99 95 57 31 7 4 7 10 9 3
Medium 86 92 99 81 50 6 1 2 3 5 4 3
More 98 99 95 76 32 40 6 16 28 27 17 24
State category Developed 90 94 97 82 30 28 4 8 19 20 15 17
less developed 99 99 99 83 71 17 5 6 5 3 1 1
Number of farmers less 79 89 95 88 36 54 6 21 42 48 32 34
More 99 99 99 80 47 13 4 3 3 1 2 3
Bio-fertilizer Not used 86 84 99 0 1 7 0 2 9 3 4 8
Used 95 99 99 99 54 28 5 9 15 17 11 12
Regional Council Govt 90 95 97 82 43 35 5 10 19 20 14 15
Non-Govt 99 99 99 83 47 3 3 3 3 3 3 3
All 93 96 98 82 44 24 4 8 14 14 10 11
1= Organic seed, 2=Green manure, 3= Compost, 4= Bio fertilizer, 5= Fertilizers, 6= Bio pesticide, 7=
Pesticides, 8= Panchamruth, 9= Panchagavya, 10= Beejamruth, 11= Drip Irrigation, 12= Neem oil or neem
cake
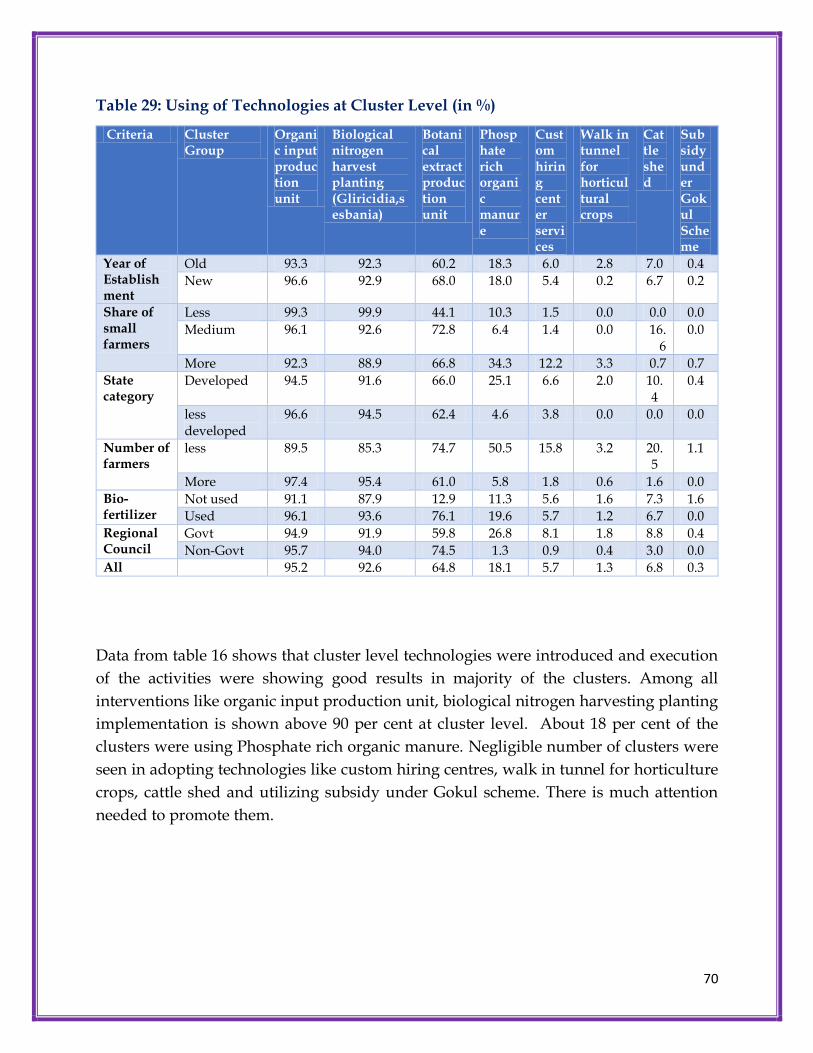
70
Table 29: Using of Technologies at Cluster Level (in %)
Criteria Cluster Group
Organic input production unit
Biological nitrogen harvest planting (Gliricidia,sesbania)
Botanical extract production unit
Phosphate rich organic manure
Custom hiring center services
Walk in tunnel for horticultural crops
Cattle shed
Subsidy under Gokul Scheme
Year of Establishment
Old 93.3 92.3 60.2 18.3 6.0 2.8 7.0 0.4
New 96.6 92.9 68.0 18.0 5.4 0.2 6.7 0.2
Share of small farmers
Less 99.3 99.9 44.1 10.3 1.5 0.0 0.0 0.0
Medium 96.1 92.6 72.8 6.4 1.4 0.0 16.6
0.0
More 92.3 88.9 66.8 34.3 12.2 3.3 0.7 0.7
State category
Developed 94.5 91.6 66.0 25.1 6.6 2.0 10.4
0.4
less developed
96.6 94.5 62.4 4.6 3.8 0.0 0.0 0.0
Number of farmers
less 89.5 85.3 74.7 50.5 15.8 3.2 20.5
1.1
More 97.4 95.4 61.0 5.8 1.8 0.6 1.6 0.0
Bio-fertilizer
Not used 91.1 87.9 12.9 11.3 5.6 1.6 7.3 1.6
Used 96.1 93.6 76.1 19.6 5.7 1.2 6.7 0.0
Regional Council
Govt 94.9 91.9 59.8 26.8 8.1 1.8 8.8 0.4
Non-Govt 95.7 94.0 74.5 1.3 0.9 0.4 3.0 0.0
All 95.2 92.6 64.8 18.1 5.7 1.3 6.8 0.3
Data from table 16 shows that cluster level technologies were introduced and execution
of the activities were showing good results in majority of the clusters. Among all
interventions like organic input production unit, biological nitrogen harvesting planting
implementation is shown above 90 per cent at cluster level. About 18 per cent of the
clusters were using Phosphate rich organic manure. Negligible number of clusters were
seen in adopting technologies like custom hiring centres, walk in tunnel for horticulture
crops, cattle shed and utilizing subsidy under Gokul scheme. There is much attention
needed to promote them.

71
Table 30: % of clusters benefited from using Cluster Level Technologies (response
from lead resource person)
Criteria Cluster Group Organic input production unit
Biological nitrogen harvest planting (Gliricidia, sesbania)
Botanical extract production unit
Phosphate rich organic manure
Custom hiring center services
Walk in tunnel for horticultural crops
Cattle shed
Subsidy under GokulScheme
Year of Establishment
Old 86.6 83.1 52.5 14.1 2.5 0.4 3.9 0.0
New 94.8 90.4 65.3 17.2 5.2 0.0 5.4 0.0
Share of small farmers
Less 98.5 98.5 43.4 10.3 1.5 0.0 0.0 0.0
Medium 93.3 88.7 67.1 6.4 1.1 0.0 0.7 0.0
More 86.0 80.4 60.9 28.8 8.5 0.4 11.4 0.0
State category
Developed 90.1 85.7 60.3 21.6 4.4 0.2 7.3 0.0
less developed
94.1 90.7 59.5 5.1 3.4 0.0 0.0 0.0
Number of farmers
less 82.6 74.7 67.9 46.3 12.6 0.0 14.7 0.0
More 94.8 92.2 57.0 4.4 0.8 0.2 1.0 0.0
Bio-fertilizer
Not used 84.7 80.6 6.5 5.6 0.8 0.0 2.4 0.0
Used 92.9 88.9 71.7 18.2 4.8 0.2 5.3 0.0
Regional Council
Govt 90.5 85.9 54.5 23.5 5.9 0.2 5.9 0.0
Non-Govt 93.2 90.2 70.6 1.3 0.4 0.0 2.6 0.0
All 91.4 87.4 60.0 15.9 4.1 0.1 4.8 0.0
From the table 30cluster level survey shows that the farmers have shown
interest/acceptance for all most all technologies because of their role in replacing
chemical inputs. Among mentioned technologies farmers have benefited more from
organic input production unit and biological nitrogen planting followed by botanical
extract production unit. Benefits from custom hiring centres, walk in tunnel for
horticulture crops, and cattle shed and utilizing subsidy under Gokul scheme were found
less by the clusters.

72
Table 31: Mobilization of farmers
Criteria Cluster Group Average number of farmers in the cluster
Average number of Farmers Mobilized
Average Number of days Mobilization camp
Usefulness (Rank: scaling 1 to5)*
Year of Establishment Old 57 36 5 4.09
New 53 35 8 4.15
Share of small farmers Less 57 36 4 4.10
Medium 52 35 6 4.11
More 56 36 8 4.15
State category Developed 54 36 6 4.12
less developed 55 35 7 4.14
Number of farmers less 44 36 6 4.08
More 59 36 7 4.14
Bio-fertilizer Not used 55 29 5 3.95
Used 55 37 7 4.16
Regional Council Govt 54 36 6 4.08
Non-Govt 56 36 8 4.21
All 55 36 7 4.13
Note: 5 is best; 1 is least
Data from above table shows that the average number of mobilization of farmers is high
in old year of establishment as the farmers showed much interest in organic farming in
the first year. The study shows that the ranking given for usefulness of mobilization is
impressive. There is still potential for getting more farmers into the scheme by
mobilization process by using different mobilization techniques.

73
Table 32: Meeting conducted
Criteria Cluster Group Average number of Meetings Conducted
Average Number of members attended
Average Number of hours of Meetings Conducted
Usefulness(Rank: scaling 1 to5)
Year of Establishment Old 6 43 5 4.12
New 7 42 7 3.94
Share of small farmers
Less 6 46 4 4.06
Medium 6 43 6 3.96
More 8 41 8 4.04
State category Developed 6 43 7 4.06
less developed 8 42 6 3.94
Number of farmers less 8 40 7 4.14
More 7 44 6 3.97
Bio-fertilizer Not used 4 43 5 3.31
Used 7 43 7 4.16
Regional Council Govt 6 43 6 4.03
Non-Govt 8 43 8 3.99
All 7 43 6 4.01
As per the scheme guidelines meetings should be conducted for the cluster groups. Table
above shows that the average number of farmers were 50 in a cluster group. The average
number of meetings conducted and average numbers of members attended were more
merely same in old and new phase. Capacity building trainings are on of different topics
like technology dissemination, Certification procedure, Soil health benefits, Input
preparation, and Record maintenance. Based on the sample data shows that there is
active participation of farmers in the meetings conducted and also the farmers say that
meetings are very useful and they ranked the indicator as 4 out of 5.
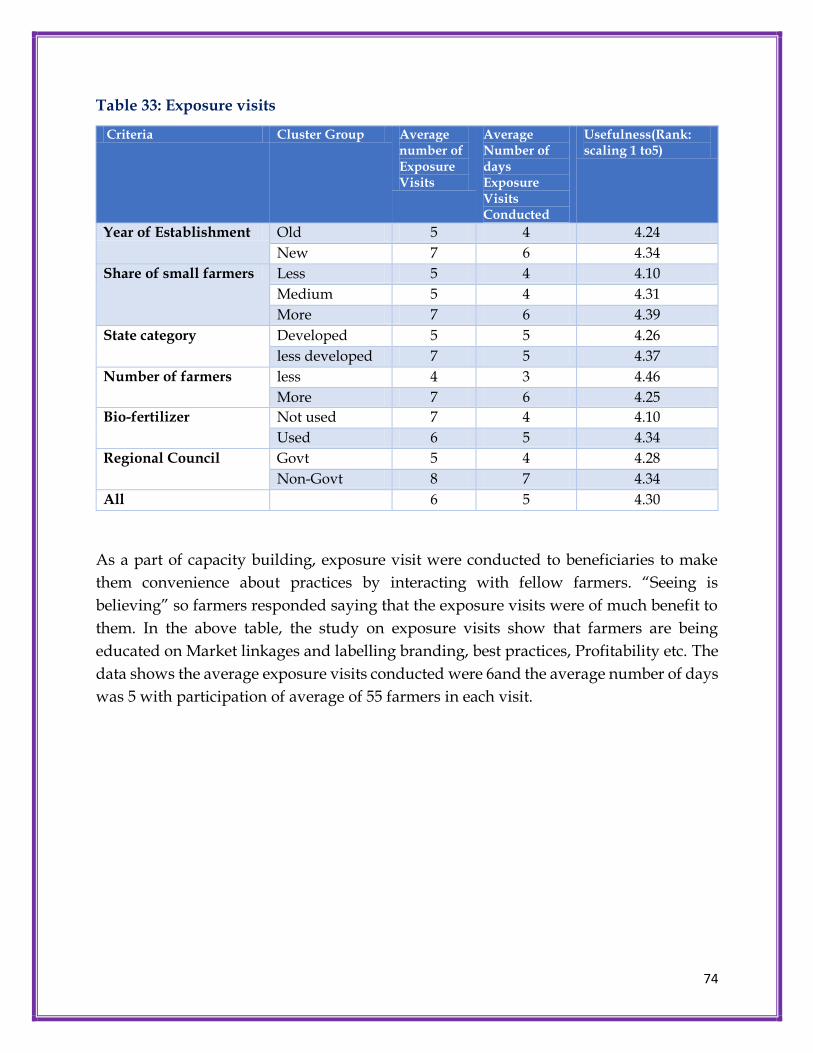
74
Table 33: Exposure visits
Criteria Cluster Group Average number of Exposure Visits
Average Number of days Exposure Visits Conducted
Usefulness(Rank: scaling 1 to5)
Year of Establishment Old 5 4 4.24
New 7 6 4.34
Share of small farmers Less 5 4 4.10
Medium 5 4 4.31
More 7 6 4.39
State category Developed 5 5 4.26
less developed 7 5 4.37
Number of farmers less 4 3 4.46
More 7 6 4.25
Bio-fertilizer Not used 7 4 4.10
Used 6 5 4.34
Regional Council Govt 5 4 4.28
Non-Govt 8 7 4.34
All 6 5 4.30
As a part of capacity building, exposure visit were conducted to beneficiaries to make
them convenience about practices by interacting with fellow farmers. “Seeing is
believing” so farmers responded saying that the exposure visits were of much benefit to
them. In the above table, the study on exposure visits show that farmers are being
educated on Market linkages and labelling branding, best practices, Profitability etc. The
data shows the average exposure visits conducted were 6and the average number of days
was 5 with participation of average of 55 farmers in each visit.
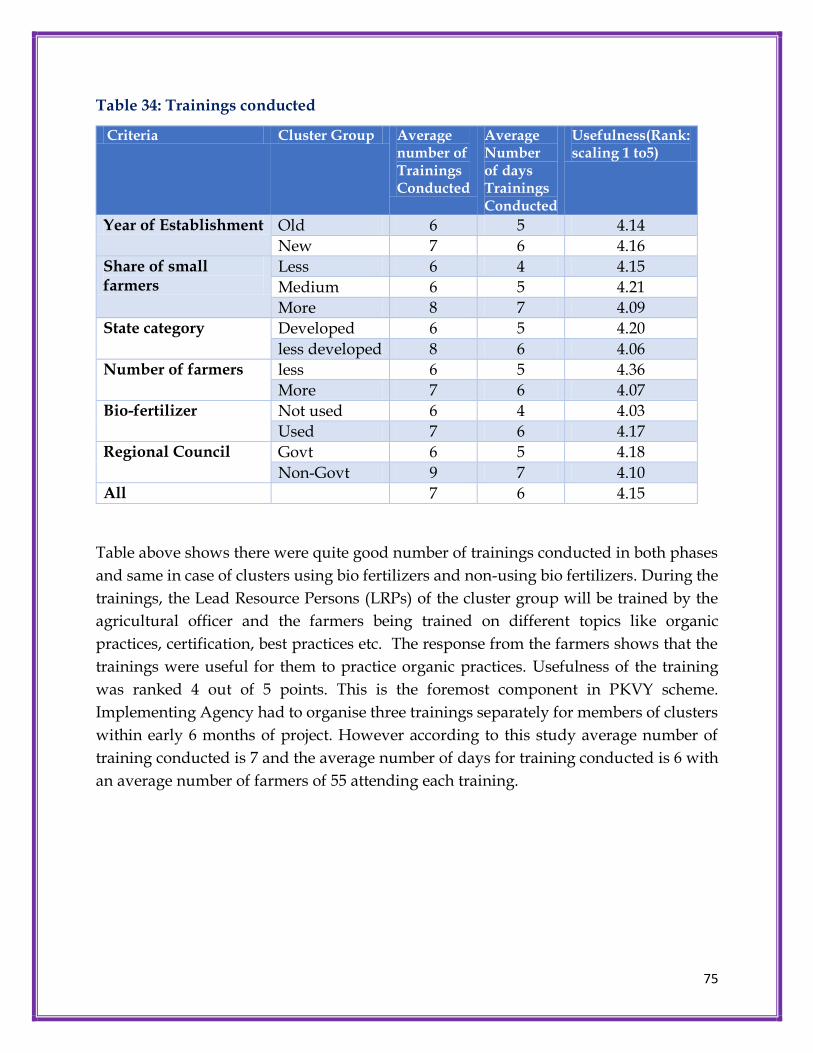
75
Table 34: Trainings conducted
Criteria Cluster Group Average number of Trainings Conducted
Average Number of days Trainings Conducted
Usefulness(Rank: scaling 1 to5)
Year of Establishment Old 6 5 4.14
New 7 6 4.16
Share of small farmers
Less 6 4 4.15
Medium 6 5 4.21
More 8 7 4.09
State category Developed 6 5 4.20
less developed 8 6 4.06
Number of farmers less 6 5 4.36
More 7 6 4.07
Bio-fertilizer Not used 6 4 4.03
Used 7 6 4.17
Regional Council Govt 6 5 4.18
Non-Govt 9 7 4.10
All 7 6 4.15
Table above shows there were quite good number of trainings conducted in both phases
and same in case of clusters using bio fertilizers and non-using bio fertilizers. During the
trainings, the Lead Resource Persons (LRPs) of the cluster group will be trained by the
agricultural officer and the farmers being trained on different topics like organic
practices, certification, best practices etc. The response from the farmers shows that the
trainings were useful for them to practice organic practices. Usefulness of the training
was ranked 4 out of 5 points. This is the foremost component in PKVY scheme.
Implementing Agency had to organise three trainings separately for members of clusters
within early 6 months of project. However according to this study average number of
training conducted is 7 and the average number of days for training conducted is 6 with
an average number of farmers of 55 attending each training.

76
Table 35: Peer inspections conducted and usefulness
Criteria Cluster Group
Average of Peer Inspection Number
Number of clusters full certification
Number of clusters conversion certification
Number of rejections
Average of Peer Inspection Usefulness(Rank 1 to 5)
Year of Establishment
Old 6 6 20 5 3.80
New 10 5 61 2 3.83
Share of small farmers
Less 13 2 14 0 3.92
Medium 8 2 56 6 3.71
More 9 7 11 1 4.14
State category Developed 9 10 72 6 3.84
less developed
3 1 9 1 3.50
Number of farmers
less 9 9 77 6 3.95
More 4 2 4 1 3.00
Bio-fertilizer Not used 8 1 3 0 2.50
Used 9 10 78 7 3.88
Regional Council Govt 8 10 78 6 3.72
Non-Govt 19 1 3 1 5.00
All 8.6 11 81 7 3.82
Based on the study data shows that farmers are under process of organic certification as
part of PKVY scheme. To get the products certified as “Organic” it takes minimum of
three years period if all the quality aspects were as per standard. The data shows that
maximum numbers of beneficiaries, covering under certification process and average of
54.6 percent of farmers, registered under organic certification and together 70 clusters
achieved completely organic certification and 81 more clusters are under conversion
period.
Research findings of All India Network Project on Organic Farming (NePOF) are very
encouraging pointers towards the performance of organic farming and its potentials in
future. NePOF after 8 cycles of research work found that in crops like Basmati rice, Non-
Basmati Rice, Maize , Sorghum, Green gram, Chickpea, Soybeans, Groundnut, Peas, Okra
Chilli, Onion, Garlic, Cauliflower, Cabbage, Tomato, Ginger and Turmeric(covering
cereals, pulses, oilseeds, vegetables and spices) average yield of organic crops is higher
by 100 to 146 kilos per hectare across crops over the conventional crops. Further net
returns under organic production systems were 17% higher compared to conventional

77
cultivation system. Soil Organic Carbon increased by 22% over a period of 6 years. (IIFSR
presentation at NASC complex, Delhi, on July 30th 2015).
Impact of PKVY on yields, costs and returns to farmers
Table 36 show that the average cost per ha in wheat was lower in organic agriculture
11.3%, while gross returns decreased by 5.6%. The combined net effect of higher
reduction in costs with slightly reduced gross returns was an increase in net return by
15.8%. The yields of organic agriculture was less than conventional by 5.6%. The use of
green manure increased by 50%(in line with Ramesh et al, 2010; 4. Tuomistoa, et al.,
2012).
Table 36: Impact of PKVY for crops – Wheat (per ha)
Criteria Cluster Group cost of cultivation
Gross return
Net Return
Yield (qtl)
Manure (qtl)
Manure (Rs)
Year of Estabt.
Old 40712 59958 19246 35 7 441
New 42820 58018 15198 33 5 315
Share of small farmers
Less 43271 55690 12419 32 7 441
Medium 42080 62132 20052 37 4 252
More 46408 72783 26375 45 5 315
State category
Developed 46728 57936 11208 35 10 630
less developed 40598 57705 17107 33 4 252
Number of farmers
less 44458 55690 11232 32 7 441
More 44855 62067 17212 36 4 252
Bio-fertilizer Not used 41870 56646 14776 31 8 504
Used 45187 60871 15684 33 5 315
Regional Council
ATMA 47600 70834 23234 45 7 441
Non-ATMA Govt 43754 54715 10961 30 7 441
Non-Govt 44451 57615 13164 32 5 315
All organic 42752 57800 15048 34 6 378
Conventional 48202 61200 12998 36 4 253
Change in organic compared to conventional
-11.3 -5.6 15.8 -5.6 50.0 49.4
*only cash expenses were included

78
Table 37: Impact of PKVY for crops – Paddy (per ha)
Criteria Cluster Group
cost of cultivation
Gross return
Net Return
Yield (qtl)
Manure (qtl)
Manure (Rs)
Year of Estabt Old 60583 79012 18429 42 20 1421
New 45241 57542 12302 35 9 712
Share of small farmers
Less 52836 62814 9978 36 16 1184
Medium 50598 77332 26734 44 11 814
More 61281 91234 29954 55 13 776
State category Developed 62823 83508 20685 46 17 1265
less developed 46296 56500 10204 35 9 792
Number of farmers
less 49445 62814 13369 36 16 1181
More 53370 78799 25429 55 13 830
Bio-fertilizer Not used 43226 56412 13186 32 12 813
Used 50423 68444 18021 41 18 1109
Regional Council
ATMA 61281 88261 26980 47 13 778
Non-ATMA Govt
52839 69369 16530 35 15 1237
Non-Govt 51734 77332 25598 42 11 716
All organic 51598 66183 14584 38 15 1091
Convention 60742 71408 10665 41 12 876
Change in organic compared to conventional
-15.1 -7.3 36.7 -7.3 25.0 24.6
Table 37 presented cost of cultivation per ha for paddy for the year 2016-17. It shows that
the average cost per ha in paddy was lower in organic agriculture by 15.1%, while gross
returns decreased by 7.3%. The combined net effect of higher reduction in costs with
slightly reduced gross returns was an increase in net return by 36.7%. The yields of
organic agriculture was less than conventional by 7.3%. The use of green manure
increased by 25%.
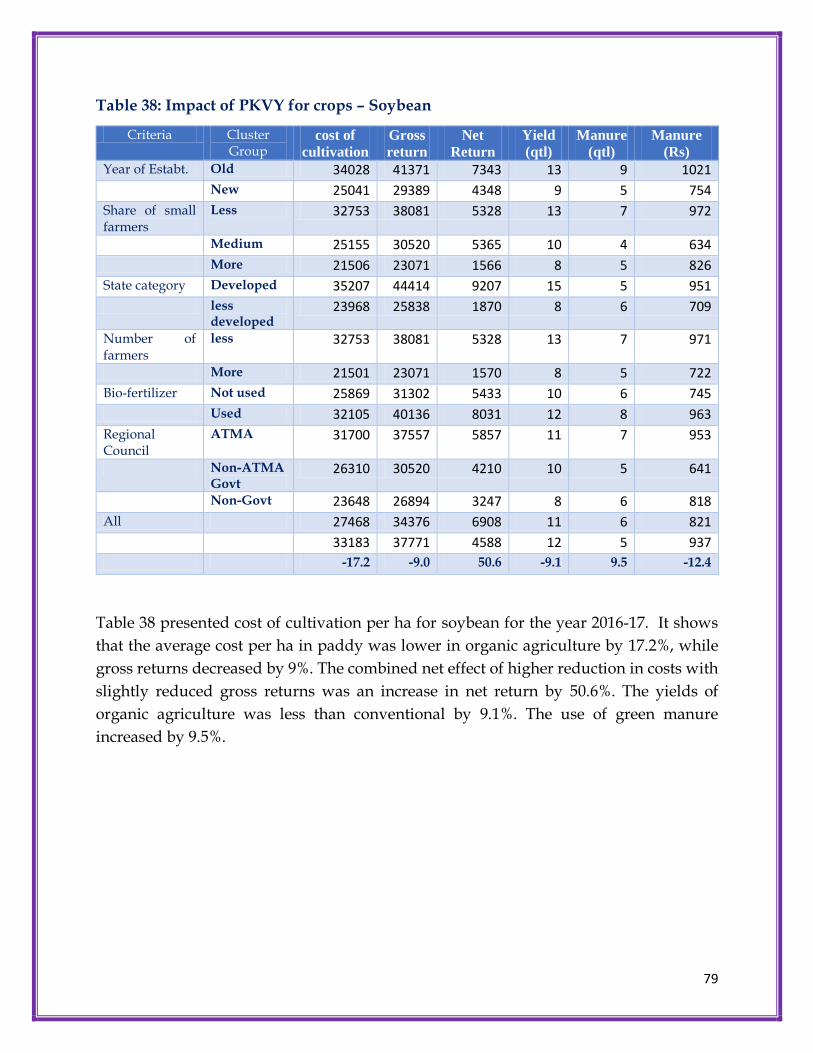
79
Table 38: Impact of PKVY for crops – Soybean
Criteria Cluster Group
cost of
cultivation
Gross
return
Net
Return
Yield
(qtl)
Manure
(qtl)
Manure
(Rs)
Year of Estabt. Old 34028 41371 7343 13 9 1021
New 25041 29389 4348 9 5 754
Share of small farmers
Less 32753 38081 5328 13 7 972
Medium 25155 30520 5365 10 4 634
More 21506 23071 1566 8 5 826
State category Developed 35207 44414 9207 15 5 951
less developed
23968 25838 1870 8 6 709
Number of farmers
less 32753 38081 5328 13 7 971
More 21501 23071 1570 8 5 722
Bio-fertilizer Not used 25869 31302 5433 10 6 745
Used 32105 40136 8031 12 8 963
Regional Council
ATMA 31700 37557 5857 11 7 953
Non-ATMA Govt
26310 30520 4210 10 5 641
Non-Govt 23648 26894 3247 8 6 818
All 27468 34376 6908 11 6 821
33183 37771 4588 12 5 937
-17.2 -9.0 50.6 -9.1 9.5 -12.4
Table 38 presented cost of cultivation per ha for soybean for the year 2016-17. It shows
that the average cost per ha in paddy was lower in organic agriculture by 17.2%, while
gross returns decreased by 9%. The combined net effect of higher reduction in costs with
slightly reduced gross returns was an increase in net return by 50.6%. The yields of
organic agriculture was less than conventional by 9.1%. The use of green manure
increased by 9.5%.

80
Table 39: Areas Needing Government Support (N = 282)
Areas Percentage (%) First rank
Supply production inputs (i.e., green manure) 60.1
Market identification / creation 34.3
Managerial / technical knowledge 30.6
Certify organic agriculture standard 22.3
Second rank
Market identification / creation 41.1
Managerial / technical knowledge 46.9
Certify organic agriculture standard 40.9
Third rank
Market identification / creation 80.4
Managerial / technical knowledge 37.4 N = sample size Source = 2006 field survey result
Farmer’s perception about organic agriculture
Fig. 19: Motivation for adoption of organic agriculture

81
Table 40: Perceptions of the farmers
% of respondents
Reasons for adoption of organic agriculture
Want to reduce costs 43
Promotion by private/NGOs 12
Promotion by agricultural officers 32
Health/food safety reasons 46
Price premium 24
Availability of family labour 21 Problems in converting to organic agriculture
Low yield during transition period 18
Highest pests and disease 21
Higher weeds 14
Lack of certification (no premium price) 57
Lack of family labour 28
Lack of availability of organic inputs 30 Areas needing government support
Knowledge dissemination 27
Supply of organic inputs at subsidized rates 85
Market identification/creation 74
Managerial/technical knowledge 46
Certification 71
Reasons for expanding organic area
Higher price 32
Improve soil fertility 56
Less cost 56
More yield 11
Home consumption 35 Reasons for not expanding organic area
Not enough labour 32
No subsidy 56
Limited land 47
Low yield 25
No premium price 47
Disease and pests attack 45 Farmer’s opinion The following tables explains farmer’s perception about organic agriculture. The results are based on the focus group interaction with a few organic agricultural clusters.

82
Reasons for adoption of organic agriculture: majority (46%) of the farmers mentioned that they adopted organic agriculture to reduce costs and to get health benefits (43%) and about 32% mentioned that because of promotion by agricultural officers.
Problems in converting to organic farming: majority mentioned that due to lack of certification (no premium price) (57%) they are not converting to organic farming.
Area needing government support: Majority of farmers mentioned that government should support in “Supply of organic inputs at subsidised rates (85%), followed by market identification/creation (74%) and certification (71%).
Reasons for expanding organic area: Major reasons are less cost (56%), improving soil fertility (56%).
Reasons for not expanding organic area: No subsidy (56%), no premium price (47%) and limited area (47%).
Fig. 20. Constraints in adoption of organic agriculture
6.2 Barriers to the Growth of Organic Farming
While the potential for growth of organic farming is very high in India, but there are
various constraints and barriers which need to be addressed. The study team conducted
stakeholder focus group discussions and came up with the following barriers for wider
adoption of the organic farming by the farmers.
1. Marketing Support and Facilities: at present for organic products there is no
organised and integrated supply chain. Even if organic farming taking place, organic
farmers have to sell their high-quality produce in the conventional markets. The issues
related to marketing support to organic produce was not addressed until recently that
83
there was clear understanding that unless marketing constraints are removed, merely
supporting organic production will not help this sector to grow. Organic produce
required separate supply chain facilities which include distinct godowns, outlets,
processing facilities etc. There is still a long way to create integrated markets for
organic produce.
2. Certification Processes: It is noted that in past; the expensive and cumbersome nature
of certification process affected the market opportunities for organic farmers. The
process is not only cumbersome but also expensive addition to support only
consumers’ need. However today, through PKVY, PGS is available free of cost. Many
states have mandated their seed certification agencies to take up organic certification
and also to promote certification, group certification is being partially or fully
subsidized. Unless these changes are for better, spread of organic farming would be
affected.
3. Subsidized supply of Chemical Inputs: presently chemical inputs are highly
subsidised whereas the organic farmers don’t depend on such subsidized inputs so
they hardly get any support. This has been a major constraint in growth of organic
farming in India. It is very difficult to phase out chemical inputs as it requires political
will and also strategic planning. As in the case of Sikkim, the regulation on supply of
inputs was majorly responsible which made Sikkim fully organic state.
4. Regulation of Chemical Inputs: according to some reports it was noted that there are
serious loopholes in the regulation of chemical inputs like pesticides. On one hand
government want to promote organic farming but on the other hand taking no efforts
in reducing aggressive marketing of chemical inputs, even there is no equivalent
marketing for organic produce. This unequal treatment is a barrier in adoption of
organic and agro-ecology farming. Strict regulation of chemical inputs is missing.
5. Labour Intensive: organic farming includes careful design and planting which is
labour-intensive. Inputs like bio-fertilisers and botanical pest repellents require input
production and processing activities to be taken up farm household level. While it is
considered, as the strength of organic farming but it has been listed as constraint here.
6. Lack of Institutional support: Currently organic farming is promoted in the same
environment as chemical farming in the current agricultural institutional frameworks.
For instance, the main organic farming promotion apparatus in the Government of
India is located under a joint secretary in charge of Integrated Nutrient Management

84
(INM), whereas organic farming is a lot more and cannot be equated with INM.
Current institutional approaches are dichotomized with no committed push for
organic farming. Organic farming should be promoted through farmer producer
organisations for better sustainability of the initiative.
7. Less financial allocation and incentives: under RKVY, less than 2% of the project was
for organic farming so far. This gives the clear picture of investment for organic
farming. There has been very little investment on establishing or strengthening
organic farming on a large scale. Even there is no major investment can be seen in
state government budget for organic farming promotion. A meagre financial outlay
for organic farming becomes the barrier for growth of organic farming.
8. “Mind-set”: one of the biggest constraints is what could be termed as an “established
mind-set”. For several decades now we have seen the agricultural development
machinery or institutions such as agriculture education or extension or research has
been oriented toward only the chemical agriculture pattern. For example, all seed
breeding happens only around chemical-response conditions. Even in Agricultural
Education System, there is very less or hardly any curriculum related to agro-ecology.
That means students who pass out have been trained accordingly which they end up
doing further research on same pattern. There was no or hardly any significant work
in any of these domains on organic farming so it needs to be re-oriented. Most of the
people confuse organic farming with “traditional farming” or “do-nothing farming”
but organic farming is about intensified agro-ecological processes with traditional
knowledge and practices enforced by modern scientific understanding. Establishing
and expansion of organic farming requires equivalent efforts from state as lent to the
green revolution decades ago. Organic farming deserves similar support now.
9. Gaps in Extension: As according to several micro-studies point out in organic
farming it is input dealer and not government who provide extension support or act
as extension agent who again are not best suited for this, for obvious reasons. The
public-sector extension has weakened over the years and private input industries has
mostly taken over the extension system which becomes a big constraint in spread of
agro-ecological knowledge. It needs to be addressed that public extension system
should be strengthened to reach the last farmer as well as re-orientation and capacity
building related organic farming. Experiences from Community Managed
Sustainable Agriculture (CMSA) program in Andhra Pradesh and Mahila Krishi

85
Sasashktikaran Pariyojana (MKSP) have shown that using experienced farmers as
resource persons to provide the last mile extension services.
10. Availability of Suitable Seeds: as it is known that agro-diversity is a very important
component of organic farming. There are several factors related to seeds which are
constraint on the growth of organic farming. First, agro-diversity depends on physical
availability of seeds of a diverse set of crop and varieties within crop. Second, the
entire seed breeding programmes in India whether it is public or private sector is in
chemical growing conditions and also mostly in irrigated conditions which are not
suitable for organic growing conditions. Third, the lack of supply of seed which are
not chemically treated in the commercial seed market. Unless special efforts are made
up to revive agro-diversity including by setting up community level seed banks, seed
breeding by participatory varietal selection, change regulations related to chemical
seed treatment procedure and standards, the spread of organic farming will be
affected adversely.
11. Knowledge Intensive Process: Chemical agriculture paradigm is physical-input-
centric, organic farming is driven by knowledge. Organic farmers need to understand
the science of their farm ecology and agriculture which again is major constraint in
growth of organic farming. The government machinery hardly provides process-
centric delivery such as training, organising of farmer field schools etc.
12. Agriculture Research Establishment: as we know in ICAR, All-India Network Project
on organic farming running for several years now, it is noted that except some
institutions and universities, the agriculture research establishment in India is yet to
catch up with the many innovations and practices adopted in organic farming. Special
incentives be instituted to draw skilled researchers into this fields. But constraints like
lack of land to lab approach, dissemination of package of practices is not happening
in the extension set up.
13. Co-existence with GMOs: Organic Farming prohibits the use of Genetically
Modified Organisms as seeds or in other inputs. In countries like India with its small
landholding and under-developed infrastructure it is clear that both these approaches
cannot co-exist. Unless the government evolves a clear policy to stop the release of
GMOs it will continue to be the barrier for spread of organic farming.
14. Affordability and consumer confidence: organic farmers do enjoy premium prices
compared to conventional farmers but due to its high cost in the market, it is out of

86
the reach of most ordinary consumers. The lack of well-organised supply chain, other
unique cost related to certification, segregation, traceability systems etc. are
something that indeed adds to the cost of organic products. Until and unless supply
chain constraint, scale and volume, easing of certification processes and establishing
of fair trade value in the mind of consumer are not addressed, it will continue to be
the barrier for growth of organic farming in India.

87
Chapter -VII
Summary & Conclusion
Indian agricultural sector is in distress with reducing profitability due to rising cost of
inputs and stagnant output prices. These twin problems of agricultural can be effectively
tackled by the wider adoption of organic agriculture (Seufert et al., 2012). Given this,
Indian government is encouraging organic agriculture under centrally sponsored scheme
of Paramparagath Krishi Vikas Yojana (PKKVY). There are about two million farmers
across the globe who practice certified organic farming methods and roughly 80 per cent
of these farms are in India (IFOAM, 2013). It wouldn’t be wrong to assume that our
country is at the centre of an organic revolution that is set to take the world by storm.
Organic farming has become increasingly important in India given the rising costs and
increased losses due to climate change and aberrations in rainfall and extreme climatic
events like floods and droughts. Consumers are also able to and willing to purchase
organic agricultural products at higher premium prices as they are free from chemical
fertilizers and pesticides. There is also uncertainty of benefits and costs of using GMOs
(genetically modified) crops on a wider scale. This resulted in a larger scope for increased
demand for organic agriculture. Apart from this, there has been a significant rise in the
demand for organic food across the world due to increased consciousness related to
health problems arising with the chemical pesticides and fertilizers contaminated food.
Keeping these in focus, there is higher thrust on PKVY to promote organic agriculture. It
is basically a scheme of supporting organic farming via cluster approach with
Participatory Guarantee System (PGS).
Terms of Reference of the study:
This nationwide impact study of PKVY entrusted to MANAGE by the Ministry of
Agriculture and Farmers Welfare with the following objectives.
To examine the design of PKVY and MOVCDNER scheme in terms of planning,
stakeholder capacity, implementation challenges, input procurement and
distribution activities (clusters formed, trainings, labs established, inspection of
clusters and certification, input supplied) and output (area under organic
expanded, organic production and market linkages)
To assess the modalities of delivery of the scheme in terms of clusters selection,
farmers training, cluster formation, inspection of field, certification, input supply,
88
value chain development, producer companies, market infrastructure and market
support linkage like organic commodity boards.
To assess the level of utilization of outcomes of PKVY and MOVCDNER by the
farmers across farm size classes, irrigated and rain fed situations especially in NE
and hilly states.
To assess the impact of PKVY and MOVCDNER scheme on area expansion under
organic agriculture, reduction in input cost and cost of cultivation, use of bio
fertilisers, farm productivity, value chain development, price premium due to
labelling, profitability and sustainability.
To recommend for improvement of overall design of the programme for improving
the effectiveness of the scheme.
Results of design, delivery and level of utilization of PKVY
This study shows the PKVY scheme is picking up in in states like Sikkim (complete
organic state), Tamil Nadu, Chhattisgarh, Karnataka, Kerala and Maharashtra. But
in other states the scheme is lagging behind. Within states also progress is good in
rainfed areas, hilly and remote areas compared to irrigate and plains. Hence there
was need to focus on expansion of PKVY scheme vertically in the rainfed, hilly
and remote areas/districts where there was a lot of potential.
As on 7th November 2017, 6211 clusters were formed, of which Maharashtra (1043),
Madhya Pradesh (992), Uttar Pradesh (806), Karnataka (538), Uttarakhand (491),
Rajasthan (410), and Chhattisgarh (338) together contribute to about 75% of the
total clusters.
Training programmes conducted on organic production practices and exposure
visits are effective in states like Kerala, Tamil Nadu, Maharashtra and
Chhattisgarh where ATMAs are involved in the PKVY implementation. Training
programmes needs to be comprehensive. The training of farmers under PKVY may
be converted to training cum field demonstration (Various organic input
production and practices may be demonstrated to make more understanding of
organic input technologies).
Farmers are the best educators of other farmers and so farmer to farmer extension
will be given importance that can greatly help in information exchange and
dissemination. Most common are farmer exchange visits, in which farmers are

89
brought to the site of successful innovation or useful practice, where they discuss
and observe benefits and costs with adopting farmers.
Release of funds in some of the states is delayed which impacted the
implementation of the PKVY at block level. In some states 1st year there was a
release of funds, but second year there was no release of funds, but again in third
year there was a release of funds. This created some sort of uncertainty about the
PKVY programme among farmers as well as local agricultural officers. This needs
to be corrected and funds should be released in advance before the sowing season,
so that the local agricultural officers and cluster LRPs can implement the scheme
with proper planning.
About 19.6 % of the clusters are producing compost followed by green manure
(15.4%) and organic seed (13.1%) which is a good sign in success of this scheme.
About 7.7% of clusters produced traditional inputs like Panchamruth, 13.8%
produced Panchagavya and 14.3% produced Beejamruth.
Majority of farmers involved were large and medium farmers and they
simultaneously practice conventional and organic agriculture in different plots, as
they were having more number of plots. Mostly commercial crops (like chillies
and cotton) were grown in conventional way, whereas pulses and oilseeds are
grown in organic way. There was a need to encourage small and marginal farmers
to take up organic agriculture.
About 96 % of the clusters prepared annual action plan and started organic
production (95 %). About 83% clusters were PGS certified and 78 % clusters were
having packaging and labelling facilities. About 80 % of clusters have marketing
facilities. And about 28 % of the clusters were having certification process and 76%
farmers expressed willingness to move towards organic methods.
Use of green leaf manure, compost and organic seeds was increased in the clusters,
especially in less developed states compared to developed states.
About 93 % of the sample clusters using biological nitrogen harvesting planting,
but only 87% are getting benefit out of it. About 65 %of clusters are using botanical
extract production units out of which 60 % are were benefitted. Average
percentage of clusters producing Bio-Fertilizers is 11% out of this 82% of clusters
are using it. About 12% of the clusters are producing Bio-pesticides, 24% clusters
are using it in farming.

90
Clusters are producing neem oil or neem cake as natural pest control mechanism.
About 5.4% of the clusters are producing, and about 11.2% of the clusters are using
it by collecting or purchased from markets.
More than 95 per cent of the clusters were using Organic input production unit
and more than 92 per cent were using Biological nitrogen harvest planting
(Gliricidia, Sesbania).About 65 per cent were using Botanical extract production
unit and 18.1 per cent Phosphate rich organic manure. Only about 5.7% of the
clusters are using this custom hiring centre services and only 4.1% are getting
benefit out of it.
Average percentage of cluster using walk in tunnels for horticulture crops is only
1.3% and all of them are using, but only 0.1% are benefited.
Only 0.3% clusters are availing subsidy under Gokul Scheme, but no one is
benefited. Under cattle shed scheme, about 6.8% clusters are taken financial
support, but only 4.8% clusters were benefited.
Farmer’s perception
Reasons for adoption of organic agriculture: majority (46%) of the farmers
mentioned that they adopted organic agriculture to reduce costs and to get health
benefits (43%) and about 32% mentioned that because of promotion by agricultural
officers.
Problems in converting to organic farming: majority mentioned that due to lack of
certification (no premium price) (57%) they are not converting to organic farming.
Area needing government support: Majority of farmers mentioned that
government should support in “Supply of organic inputs at subsidised rates (85%),
followed by market identification/creation (74%) and certification (71%).
Reasons for expanding organic area: Major reasons are less cost (56%), improving
soil fertility (56%).
Reasons for not expanding organic area: No subsidy (56%), no premium price
(47%) and limited area (47%).
Impact of PKVY
The results show that the average cost per ha in wheat was lower in organic agriculture
11.3%, while gross returns decreased by 5.6%. The combined net effect of higher

91
reduction in costs with slightly reduced gross returns was an increase in net return by
15.8%. The yields of organic agriculture was less than conventional by 5.6%. The use of
green manure increased by 50%. The cost of cultivation per ha for paddy for the year
2016-17. It shows that the average cost per ha in paddy was lower in organic agriculture
by 15.1%, while gross returns decreased by 7.3%. The combined net effect of higher
reduction in costs with slightly reduced gross returns was an increase in net return by
36.7%. The yields of organic agriculture was less than conventional by 7.3%. The use of
green manure increased by 25%. The cost of cultivation per ha for soybean for the year
2016-17. It shows that the average cost per ha in paddy was lower in organic agriculture
by 17.2%, while gross returns decreased by 9%. The combined net effect of higher
reduction in costs with slightly reduced gross returns was an increase in net return by
50.6%. The yields of organic agriculture was less than conventional by 9.1%. The use of
green manure increased by 9.5%.
Overall impact
1. Cost reduction (cost saving): There is an immediate reduction in the cost of
cultivation (cost saving) up to 10 to 20% as the beneficiaries are not using
purchased fertilizers and pesticides.
2. Due to reduction in costs, there was increase in net returns ranging from 20 to 50%.
3. Savings in purchased inputs (cash expenses): The benefits are significant in crops
like paddy and cotton, for which farmers spend huge amount of money on
purchase of fertilizers and pesticides before PKVY.
4. Price premium was observed in some clusters, which are nearer to large cities and
have good linkages with large markets (the price premium was ranged from 10%
to 30% based on the type of market linkage, commodity and market linkage. In
general price premium is not widely observed.
5. Yield improvement observed only in a few farmers who do all PKVY practices
since last few years, but in general there was no significant yield increase in first
year.
6. There was huge scope of area increase of organic area in tribal, rainfed, hilly and
remote areas.
Constraints of PKVY Programme:
1. Insufficient and delay in fund release from state governments and spread across
much larger areas. There was a need for identification of potential crops and
locations for vertical promotion with all-out efforts.
92
2. Preparation of organic-inputs is labour intensive due to this many farmers are
reluctant to convert to organic farming, there is a need to train farmers on
producing some of the organic inputs at their level itself, this will ensure the
quality. The scheme is only encouraging input companies manufacturing
biopesticides/the agencies rather than the farmers. ------- manufacturing at their
level needs to be incentivized.
3. Price premium is not realized by most of the farmers, due to lack of awareness
about PGS certification among consumers, retailers and wholesalers. Credibility
and awareness needs to be increased among different stakeholders by introducing
mobile-PGS certified produce shops, separate sale counters of PGS certified
produce in APMC markets.
4. Facilitating role of regional centres are not up to the mark. There is a need for
increasing efficiency and effectiveness of regional centres in facilitating
handholding PKVY clusters. There is a need for encouraging multiple agencies
(technical NGOs, private agencies who are involved in organic agriculture, state
department of agriculture, Farmer Producer Companies, ATMA and KVKs) to
compete to bid for regional centres.
5. Establishing separate Regional Centres for market promotion of PGS certified
commodities with PPP mode. (As private companies are comparative advantage
in marketing and brand development).
6. Farmers groups needs to be strengthened and federated at higher level as FPO’s
to increase bargaining power and brand building with the help of good NGOs
(after screening). LRPs and progressive farmers needs to be trained by
NGOs/KVKs.
7. Transition period of first and second years increase in yields are not significant
and needs support/incentives from department of agriculture.
8. Lack of integration of livestock (which provides alternate incomes and resources
as bio-inputs), farm machinery and horticulture departments.
9. PKVY guidelines are not flexible enough, they needs to be more flexible to adopt
depending upon the local situations (state requirements).
10. Duplication of beneficiaries in many areas – Existing organic farmers were selected
who were already part of other schemes. (Convergence and cooperation between
schemes which has common components of organic farming).
Recommendations (design, delivery and utilisation)
Timely action: Plan preparation, release of fund and implementation needs to be
streamlined. Release of fund was delayed and diverted in many states, hence the

93
continuity of the second year activities suffered, which needs to be streamlined.
District level action plans should be ready at least one month before sowing period.
Identification of potential zones (Organic Special economic Zones): There was a
need for identification of potential zones like rainfed areas, tribal areas, where
traditionally farmers use less fertilizers for intensive efforts for promoting organic
clusters. Creation of organic special Economic zones ( OSEZ ) where the tribal
population is more such as Chhattisgarh, Jharkhand, Srikakulam in Andhra Pradesh,
Bhadrachalam in Telangana where there is huge potential for reaping forest based
produce like honey, soapnut, tamarind, vippa flowers.
Contiguous areas: identification of complete village/block/mandal as organic cluster
will help in building brand and providing other logistic services at less cost and also
help in marketing. Selection of area should be contiguous. Whole area approach
(saturation) may be followed at least a few cluster of villages or blocks should be
completely covered to build organic brands. There is a success story of AP wherein
they encouraged SHG’s to setup village level organic shops as a part of ------ in ZBNF.
This king of initiative is encouraging to faster spread of PKVY scheme.
Focused approach: Focused approach based on the experience in the initial years of
the PKVY programme to identify potential areas of expansion. Identify and map the
default organic growing areas and declared as organic and efforts would be made to
get them a recognition and marketing.
Incentives: Announcing incentives to the farmers (master farmers) who adopt organic
farming for the first 3 – 5 years to compensate low yields.
Training Modules: Need to develop a training module on organic crop production
practices in local languages in more farmer friendly language with diagrams, figures
and illustrations. These standard package of practices should be developed block wise
and crop wise. Educating the farmers about important indigenous breeds in their
farming systems and integrated farming system should be intensified.
Scientific backing: An Research & Development should be encouraged. is required
to be established to validate and produce bio-inputs at low cost. Scientific backing of
the practices followed in organic agriculture needs to be proved for wider
acceptability of organic produce both by SAU’’s and ------. The Biological control labs
which are entrusted with production of biopesticides like T.Viridae and Pseudomonas
florescence are focused only bio pesticides but not bio fertilizers like Azolla,
Azatobactor, Phosphate solubilising bacteria, potassium mobilizing bacteria. All BC

94
labs should be equipped with man power and modernized / revamped to cater to the
growing organic needs.
Provide village-level support systems (like organic input shops) and build capacity
of farmers on technical front to establish homemade bio-fertilizers like BGA, Azolla
and bio pesticides, Composting (Vermicomposting, NADEP, BD compost, Coir pith
composting methods) at local level.
Appointing district level PKVY officers: The in-charge-agricultural officers of PKVY
are engaged in multiple activities, which is hindering the progress of implementation.
Hence there is a need for appointing special officers at least at district level. In those
states where ATMA is working, training components under PKVY should be handed
over to ATMA for effective dissemination of technology.
A multi-agency approach involving public, private and NGOs may be encouraged.
Currently there was little involvement of institutions like KVKs, ATMAs and SAUs
to promote organic agriculture. A strong monitoring for quality and production and
transfer technology should be given more emphasis by involving all Departments
(NCOF/RCOFs/ICAR institutes/APEDA)
Regional centres for Market Promotion: Specialised separate regional centres should
be established for marketing in each zone in community-PPP mode. As most of the
existing regional centres don’t have the marketing skills to build brands and
expansion of market for organic agriculture.
Farmer producer organizations (FPOs) and linking to corporates: The Government
should encourage formation of FPOs including Co-operatives and Producer
companies - exclusively for promotion of organic farming in all the districts and states
and FPOs to be empowered to handle all activities related to organic farming viz.,
capacity building, production of organic inputs, processing, certification, marketing
etc. The group should be preferably homogeneous, compact, and manageable and
based on area approach/crop approach. All the clusters identified under PKVY
should be formed as Farmer Interest Groups (FIG’s) / Commodity Interest Groups
(CIGs) and trained in Management of groups with respect to finance, finally linked
with private sector for marketing..
Promotion of FPOs will enable to increase access to bio-inputs, seeds and other critical
inputs..

95
Separate stalls for organic produce in APMC markets: APMC markets are already
existing in every block/mandal level. In these APMC markets (mandis) separate
organic certified stalls may be established, which will be maintained by PGS certified
clusters to fetch premium prices.
Promoting local processing and value addition of organics through establishing
mini-processing plants at cluster level or federation level before entering to wholesale
supply chain to get maximum share of consumer rupee by cluster farmers.
Market survey and demand estimation and product development may be done in
collaboration with specialized Regional Councils (marketing) in partnership with
private firms who are already involved in marketing of organic produce.
Simplification of procedure to get PGS certification has to be ……..
Market and Brand development: To access better prices branding need to be
developed by farmers.. Convergence with marketing and cooperative department
and explore a new supply chain on Farmer to Consumer models which helps
increasing farmers share. Similarly, consumers must also be made aware about the
health benefits of organic produce and necessity for premium price.
Popularizing PGS certification to get premium prices among the wholesalers,
retailers and consumers for creating demand for produce of PKVY clusters. The
details on the labels of PGS certified product should be on par with private labelling
to increase authenticity and transparency. Processed food shall be labelled as per food
safety and standards (FSSASI) regulations. Use of E-platform and mobile Apps for
direct marketing of organic produce. In addition to PGS-certification, third party
certification may be encouraged if clusters (farmer producer companies) are willing
to take with subsidised cost. Certification procedures may be simplified with online
filling of the data twice in a year for both kharif and rabi seasons. Common packing,
branding and labelling unit can be established at state level to promote a common
brand for each state organic produce like (Himachal organic apples). Each state
headquarters should have organic market places established where farmers can
directly sell to consumers/retailers.
Start-ups and agri-entrepreneurs: There is a growing market for the organic
agriculture, some of the private companies (even farmer producer companies) are
making huge profits by marketing the organic produce. Imparting skills in
identification of market opportunities for organic agriculture and development and
capturing of these markets can be done by encouraging agripreneurs..

96
Mass production of bio-inputs: Encouraging and incentivising establishment of
large input-suppliers of bio-inputs like Panchamruth, Panchagavya and Beejamruth.
Leveraging ICT: Information and Communication technologies for digitization of
organic farmers, crops produced, prices, development of virtual market place or
linking to eNAM would help farmers to realize better prices for their produce. PGS -
INDIA web-portal should be linked to national and international markets and
ultimately tracing back the product.
Revolving fund to farmers federations/FPOs/ farmers associations, etc. to meet their
working capital needs and to facilitate purchase of organic inputs. This will help in
avoiding distress sale. The existing unit ---- can be converted as revolving fund and
given to FPO’s who take up organic farming.
Eco Agri-Tourism: Encouraging Eco Agri-Tourism in fully organic clusters as
supplementary income to organic farmers can be explored in the suburban areas of
metro-cities.
Annexures 1
PKVY guidelines
Name of Component Assistance
A. Cluster Approach.
Cluster formation One cluster 50 acres (20 ha) contiguous area. Assistance eligibility to farmer maximum one ha @ Rs. 20,000/ - acre (Rs. 50,000/- per ha) Total Rs. 10.00 lakhs for three years. Rs. 4.95 lakh for mobilization and PGS certification. Total Rs. 14.95 lakh per cluster.
Meetings and discussions of farmers. @ Rs. 200/- per farmer ( Rs. 10,000/- for 3 years).
Exposure visit for farmer @ Rs. 200/- per farmer (Rs. 10,000/- for 3 years).
Training of cluster member (3 Trainings)
@ Rs. 20,000/- per training (Total Rs. 60,000 for one cluster for 3 years).
Total Rs. 80,000/-
B. PGS certification and quality control.
Training on PGS certification (2 days) @Rs. 200/- per Lead Resourceful Person (LRP) Total Rs. 400/- for 3 years.

97
Training of Trainers (LRP) (3 days) @ Rs. 250/- day (Total Rs. 750/- for 3 years).
Online Registration of farmer @ Rs. 100/- per member (Total Rs. 10,000/- for 2 years).
Soil sample collection and testing (21 samples/year/cluster)
@ Rs. 190/- per sample (Total = 21X190 = Rs. 3990/- per year). (Total Rs. 11970/- for 3 years).
Process documentation – inputs used, organic manures and fertilizer used etc. for PGS certification.
@ Rs. 100/- per member ( Total Rs. 5000/- per year) (Total Rs. 15000/- for 3 years).
Inspection of cluster member fields (3 inspections)
@ Rs. 400/- per inspection (Total Rs. 1200/- per year and Rs. 3600/- for 3 years).
Residue analysis of samples in NABL ( 8 Samples/year/cluster)
@ Rs. 10,000/- per sample ( Total Rs. 80,000/- per year). (Total Rs. 160,000/- for 2 years).
Certification charges @ Rs. 2000/- for 3 years.
Administrative expenses for certification.
@ Rs. 59950/- ( Salary & maintenance)- for 3 years
Total Rs. 2,63,670/-
C. Adoption of organic village.
Conversion of land to organic. @ Rs. 1000/-per acre (Total Rs. 50,000/ – per year) (Total Rs. 1,50,000/- for 3 years)
Organic seed/nursery raising, procurement
@ Rs. 500/ - per acre/ (Total Rs. 25000/- per year ( Total Rs. 75000/- for 3 years).
Production Units i.e. Pachagavya/Beejamruth/Jeevamruth etc.
@ Rs. 1500/ - per unit/acre (Total Rs. 75000/- for one cluster for 3 years).
Green Manuring/ Biological Nitrogen Harvest Planting.
@ Rs. 2000/- per acre ( Total Rs. 1.00 lakh for 3 years).
Botanical extracts production units @ Rs. 1000/- per unit/acre (Total Rs. 50,000/- for 3 years).
Total Rs. 4,50,000/-
D. Integrated Manure Management.
Liquid Bio- fertilizers @ Rs. 500/- per acre (Total Rs. 25000)- for one cluster for 3 years.
Liquid Bi- pesticides @ Rs. 500/- per acre (Total Rs. 25000/- for one cluster for 3 years.
Natural Pest control mechanism @ Rs. 500/- per acre (Total Rs. 25000/- for one cluster for 3 years.
Phosphate Rich Organic Manure (PROM)
@ Rs.1000/- per acre (Total Rs. 50,000/- for one cluster for 3 years.
Vermi- compost ( Size 7’X3X1’) @ Rs. 5000/- per unit, 50 unit for one cluster ( Total Rs. 2,50,000/- for one cluster for 3 years).
Total Rs. 3,75,000/-
E. Custom Hiring Centre ( CHC) Charges.

98
Agriculture implements @ Rs. 15,000/- per year ( Total Rs. 45,000/- for 3 years)
Walk in tunnels for Horticulture crops As per MIDH Guidelines.
Cattle shed/Poultry/Piggery for animal compost
As per Gokhul guidelines.
Total Rs. 45000/-
F. Packing, Labelling and Branding.
Packing material with PGS Logo +Hologram
@ Rs. 2500/- per acre ( Total Rs. 1,25,000/- for 3 years) .
Transportation of organic products ( four Wheeler1.5 Ton Capacity)
@ Rs. 1,20,000/- total for one cluster.
Organic Fairs @ Rs. 36330/- per cluster total for 3 years.
Total Rs. 281,330/-
Grand Total Rs. 14,95,000/-

99
Annexures 2
Cluster Questionnaire
Paramparagath Krishi Vikas yojana(PKVY)
1. State
2. District
3. Block
4. Village
5. Name of the Cluster:
6. Cluster In-charge: Mobile no.
7. When the cluster was started (year)?
8. Area under the cluster (acres)
9. How many farmers are there in the cluster?
10. How many of them are registered members?
11. Do you have any Complaints, Appeals and Grievance redressal for the group
members?Y/N
12. How many are small farmers (< 2.5 acres)
13. Total subsidy received for cluster development (Rs.): Onetime:
Yearly:
14. How many Cattle or Buffalos are there?
15. Activities Carried out
Purpose Number Distance Number of
days Nature of Inputs*
Usefulness
(1-5 scale: 5 is best)
Mobilisation (farmers)
Meetings conducted
Mention Number of people attended here:
Mention number of hours here:
Exposure Visits
Trainings Conducted
Note: * 1. Information production technology dissemination, 2. Market linkages and labeling branding, 3.
Certification procedure, 4. Soil health benefits, 5 best practices, 6. Input preparation, 7. Record maintenance,
8. Profitability

100
Peer Inspection
Number
Topic
Usefulness
No. of full certification
No. of Conversion
certification
No. of rejections
Cluster is producing and using the following
Item producing Using
Organic seed
Green manure
Compost
Bio-fertilizer
Fertilizers
Bio-pesticide
Pesticides
Panchamruth
Panchagavya
Beejamruth
Drip irrigation
Neem oil/neem
cake
16. Whether annual action plan prepared? Y/ N
17. Whether production under cluster started? Y/N
18. Whether PGS certified Y/N
19. Whether packaging and labeling facilities exists Y/N
20. Marketing facilities exists Y/ N
21. Appointed consultant? Y/N
22. Appointed data entry operator Y/N
23. Does the cluster has a certification process? Y/N
If Yes, Who is the service provider?
24. Do you think more farmers will move towards organic methods?

101
25. What are main constraints (give by importance)
Cluster Level Technologies
Owning /using Y/N Financial support
(public/ Own) (in
Rs.)
Benefit Problems
(if any)
Suggestions
for
improvement
Organic input
production unit
Biological nitrogen
harvest
planting(Gliricidia,
sesbania)
Botanical extract
production unit
Phosphate rich
organic manure
Custom hiring
center services
NA
Walk in tunnel for
horticultural crops
Cattle shed
Subsidy under
Gokul Scheme
Organic Crops and Returns
Crop
name
Season
K/R/annu
al
Are
a
(acr
e)
Irrigation
(Y/N)
Yield
(per
care)
Cost
(Rs/acre)
Price
received
Rs/Quint
al
Labelled
Y/N
Brande
d
Y/N

102
Annexures 3
Budget Allocation of PKVY
2015-16 (Rs in lakh) 1st year 2016-17 (Rs in lakh) 2nd year 2017-18 (Rs in lakh) 3rd year
Zone No of Clusters
Allocation
Release as % of allocation
Expenditure as % of release
Allocation
Release as % of allocation
Expenditure as % of release
Allocation
Release as % of allocation
Expenditure
Central zone 1068 4574 150 141 3227 122 129 1874 0 0
East zone 935 4198 294 255 2962 310 169 1721 109 0
North zone 2088 10417 448 570 7350 365 184 4269 459 0
North-East zone
572 3674 413 646 2593 465 200 1506 520 0
South zone 1509 6463 383 367 4561 221 196 2648 114 0
West zone 1036 4437 148 100 3130 184 7 1818 0 0
Total 7208 33763 67 83 23823 64 42 13835 40 0
State-wise Funds Released for Promotion of Organic Farming under Rashtriya Krishi Rashtriya Krishi Vikas
Yojana (RKVY) in crores
Zone 2011-12 2012-13 2013-14 2014-15 Total 2012-15
Central zone 4.4 5.7 4.3 14.4
East zone 102.7 10.1 112.8
Nothe zone 46 54.6 125.5 29.7 255.8
Nothe-East zone 15.8 19.6 12.7 15.7 63.7
South zone 34.2 44 30.4 28.4 137.1
West zone 108.4 11.6 27.5 3.1 150.5
India 311.3 145.6 200.5 76.8 734.2

103
Annexures 4
Suggestions
Kvk’s ,Scientists must conduct some meetings and train the farmers
Farmers should be educated about the fertilizers and pesticides thoroughly and also
should be trained to prepare their own compost, Farmers should be aware of the benefits
and how to process & use the components
Educate the farmers about the importance of desi cow, buffalo
The input costs are very low and there should be some minimum support price for the
organic products
Mandis should have separate organic certified stalls
Organic food should be available for the farmers also.
Subsidy should be given to organic farmers
18%GST is on farmer producing machines which should be reduced to 5%
If any agro-based startups are looking for finance the interest rates should be taken into
consideration. The interest rates should be low.
In my views after observing this industry in past 10 years.
CERTIFICATION PROCESS, INTERNAL AUDIT AND SUBSEQUENTLY ISSUE OF TC
this needs complete complete re dressing. As of now most of the traders and business
men not doing good and fair practice and selling goods only on TC, which they get from
agencies / documents adjustments.
We need “Proper ORGANIC INPUTS" for Organic farming - An R&D center is require to
establish to produce EFFECTIVE Organic Pesticides / insecticides, ON LOW COST.
All wild collection should be under”controlled price mechanism" be it for Herbs / seeds/
condiments or crops.
- Rohit Vohra
Aayam herbal & research Industries
Mahapura, Jaipur

104
The documentation process of conversion for organic under PKVY is very difficult and
burdensome for the department due to under staff of the department to carry out the
scheme since most LRPs are illiterate and need full assistance and online works are
hampered due to improper network in most of the districts.
PKVY may not be implemented in a state where MOVCD is being implemented as both
schemes deal with organic farming and make the farmers confusing. It will be better if
only one organic scheme is implemented in a state.
The documentation process must be made simple to reduce the workload of the
department and LRPs.
(J.LALZAMLIANA)
Director of Agriculture,
Crop Husbandry,
Mizoram, Aizawl.
Opinion & Feedback about organic food:
I appreciate that organic farms use methods of farming that are kind to the environment,
and they don't use pesticides, growth hormones or other chemicals to try and improve the
quality of their produce like most conventional farms do. Their methods are much more
natural and safer for the environment, and they are even kinder to the animals too.
Suggestion:
As I think if government wants to promote organic farming then the government should
think about the marketing of organic produce and this organically produced crops should
be exported, send to big cities and sale in the local market at higher rate. If farmer get
higher price in the market then he will definitely be attracted to organic farming and the
consumer will also get benefit by consuming a chemical free cereals. If we are able to
produce everything in food organically, then you can think how much we can benefit our
society and farmer of our country and people of other country also.
- Rohitash Pareek
Food safety Auditor

105
1. Training of Trainers (ToT):
PKVY program is being implemented through ATMA in most of the state. BTM is the
field extension person who is supposed to handle the program. A ToT is needed for BTM
and LRPs (Lead Resource Person (Group leaders)). Which will help them to understand
the program, Organic techniques, PGS Certification process and market linkages.
2. Farmers Training:
There is provision of three training only for first year and no support for next two years.
Our suggestion is that these trainings should be in the form of Farmer Field School (10 –
12 classes to be taken in each FFS) that should be for three years. This can be implemented
in same budget i.e., Rs. 20,000/- per FFS or it can be rebudget.
3. LRP Training:
There is provision of Two days training for first year ( @ Rs. 200/- per day per trainee)
and Three days training for second year ( @ Rs. 250/- per day per trainee). The budget is
too low. It should be Rs. 750/- per day per trainee.
4. Support to LRP for Pear Appraisal:
LRP is supposed to do internal inspection (minimum three inspections per year) and
remuneration for the same is Rs. 400/- per inspection which is too low. There should be
provision of monthly remuneration for LRPs for doing his job vigorously.
5. Office Expenses for PGS Certification:
There is provision of Rs. 26,150/- for first year and Rs. 16,900/- for second and third year
for support of Office Expenses for PGS Certification. Considering the responsibility and
work of Regional Council (RC) this should be increased at least Rs. 50,000/- per group per
year. As per project guidelines internal inspection should be done by LRP but practically
they are not able to do so in spite of continuous trainings. BTMs are also not capable to
help them so RC representatives do the work for the sake of proper documentation. It
needs time and expense too. The additional budget can be generated by reducing budget
for Residue Testing (for the Labs).
6. Support for Agri. Implements on rent:
Generally farmers have agri. Implements. This budget can be used for making
information centres for group an other farmers who want to join Organic farming. Group
or LRP can run the information centre. The information centre will provide guidance for
Organic farming, Post harvest care, PGS Certification support and also market linkages.
Separate budget can be allocated.
Regards For SARG Vikas Samiti (RC)
Sanjay Roman
106
1. Identification of potential zones: There is a need for identification of potential
zones like rainfed areas, tribal areas, where traditionally farmers use less fertilizer
for intensive efforts for promoting organic clusters. Hill and Tribal areas rich in
biodiversity are the other priority areas for undertaking organic farming. In
rainfed areas, organic agriculture (with low external input) has shown the
potentials to increase yields. Increasing soil organic matter/carbon is an
important approach to build resilience for changing climate. Under drought
conditions, crops in organic agriculture system produce significantly and
sustainably higher yields than comparable conventional agriculture crops. Hence
rainfed and drought prone areas are the priority areas for conversion to organic
agriculture.
2. Focused approach: Focused approach based on the existing opportunities in the
initial years of the PKVY programme will help in take-off programme. Identify
and map the Default organic growing areas and declared as organic and efforts
would be made to get them a recognition and marketing. Existing organic
farming groups under PGS/ICS certification, farmer’s cooperatives which are
into organic production and marketing will be brought under the program. (ex:
NGOs and Women SHG groups etc.).
3. Provide village-level support systems and builds capacities on technical front to
establish homemade and commercial bio-fertilizers and bio pesticides,
Composting (Vermicomposting, NADEP, BD compost, Coir pith composting
methods).
4. Initial years of the programme should primarily focus on production related
changes but also be able to pilot innovative approaches around collective
enterprises around inputs, collective marketing including with processing and
value addition.
5. Contiguous areas: Saturation of complete village/block/mandal as organic
cluster will help in building brand and providing other logistic services at less
cost and also help in marketing.
6. Stakeholder Capacity: Clusters should be aggregated to form commodity
organisations at district level under PKVY. It has been found that working with
farmer federations through FFS (Farmer Field Schools, with participation of both
women and men farmers) for capacity building, knowledge enhancement,
horizontal sharing and learning etc., works out well. Kisan Business Schools
(KBS) is an approach to build farmers capacities to understand and deal with
markets.

107
7. Farmer producer organizations: The Government should encourage formation of
farmer producer organizations (FPOs) - including Co-operatives and Producer
companies - exclusively for promotion of organic farming in all the districts and
states and these FPOs will be empowered to handle all activities related to organic
farming viz., production of organic inputs, processing, Certification, marketing
etc. The group should be preferably homogeneous, compact, and manageable
and based on area approach/crop approach.
8. Specialized Regional centres for Market Promotion: Specialised separate
regional centres should be established for marketing in each zone in community-
PPP mode.
9. Timely action plan preparation, Release of fund and implementation needs to be
streamlined.
10. The in-charge-agricultural officers of PKVY are engaged in multiple activities,
which is hindering the progress of implementation. Hence there is a need for
appointing special officers at least at district level.
11. Develop extension modules for educating farmers for all the major crops through
ATMA and KVKs. ARS and KVKs shall act as knowledge transfer centres for
farmers and extension personals by starting modal organic farms in their research
stations.
12. Farmers are the best educators of other farmers and so farmer to farmer extension
will be given importance that can greatly help in information exchange and
dissemination. Most common are farmer exchange visits, in which farmers are
brought to the site of successful innovation or useful practice, where they discuss
and observe benefits and costs with adopting farmers.
13. Continuous exposure visits should be arranged for both departmental officers
and farmers to successful organic farming systems inside and outside the state.
14. The Government will support for on farm production or for local production of
inputs) required for organic farming. Viz., support for establishing compost units,
supply of pulverisers for NSKE preparation on subsidy, and imparting required
technical trainings. Also extend necessary support for production of bio
formulations, botanical formulations at farm level as well as small scale units for
production by SHGs/Farmer groups etc. Govt will also supply traps and lures on
subsidy.

108
15. Establishing Organic Poultry, Dairy, Piggery unit and others using
local/indigenous breeds suitable to agro-ecological regions in order to meet the
demand for organic dairy, poultry and other animal based products.
16. Encouraging Eco Agri-Tourism in fully organic clusters as supplementary income
to organic farmers.
17. Revolving fund to farmers federations/FPOs/ farmers associations, etc. to tie up
their working capital needs to facilitate purchase of organic produce to avoid
distress sale
18. Promoting processing and value addition of organics at cluster level or federation
level before entering to wholesale supply chain to get maximum share of
consumer rupee by cluster farmers.
19. Market survey and demand estimation and product development may be done
in collaboration with specialized Regional Councils (marketing) in partnership
with private firms who are already involved in marketing of organic produce.
20. Govt. schemes should extend financial assistance for farming processing activities
taken up by individual farmers or groups of farmers in the value addition of their
produce. Suitable financial help will also be extended for infrastructure facilities,
storage facilities of organically grown produce.
21. Popularizing PGS certification among the wholesalers, retailers and consumers
for creating demand for produce of PKVY clusters. The details on the labels of
PGS certified product should be on par with private labelling to increase
authenticity and transparency.
22. There were number of agriculture schemes on operating separately across value
chains. Integrating the Integration of all agriculture schemes instead of isolation.
Integrated approach rather than component based approach and converging with
other departments.
23. Separate cell for PKVY with Transparency in plans, internal monitoring and social
auditing should be initiated. Accountability need to be fixed at different levels for
effective implementation of PKVY.
24. Market and Brand development: To access better prices register brand at state
level and awareness campaigns to consumers. Convergence with marketing and
cooperative department and explore a new supply chain on Farmer to Consumer
models which helps increasing farmers share. Similarly, consumers must also be
made aware about the high price of organic produce as it is necessary to sustain
organic farmers in the initial years.
109
25. Each state headquarters should have organic market places established where
farmers can directly sell to consumers/retailers.
26. Farmers adopting organic farming are grouped into common interest groups and
cooperatives. All these farmer groups should be trained and regular farm
appraisals will be facilitated.
27. Formation of a high level committee for looking into the issues related to organic
cultivation, markets and linkages with farmers representation.
28. Leveraging ICT (Information and Communication technologies) for digitization
of farmer’s information, soil health monitoring for organic carbon improvement,
Real-time soil moisture networks, virtual market place or linking to E-NAM
would help farmers to realize better prices for their produce.
29. Monitoring the outcomes and impact of the scheme is important rather on
physical and financial progress of PKVY scheme. It is therefore necessary to
collect the information in terms of productivity, production and growth over the
baseline situation.
30. More research is needed to prove the efficacy of other organic practices by
agricultural universities and research institutions organic practices, so that
farmers will be having multiple options based on the local resources availability.
References
1. Seufert, Verena, Navin Ramankutty, and Jonathan A. Foley. "Comparing the
yields of organic and conventional agriculture." Nature 485, no. 7397 (2012): 229-
232.
2. IFOAM, 2013
3. Ramesh, P., Panwar, N. R., Singh, A. B., Ramana, S., Yadav, S. K., Shrivastava, R.,
& Rao, A. S. (2010). Status of organic farming in India. Current Science, 1190-1194.
4. Tuomistoa, H. L., Hodgeb, I. D., Riordana, P., & Macdonalda, D. W. (2012). Does
organic farming reduce environmental impacts?. A meta.
Recommended


